#also btw i use the color coding that the twitter accounts use
Explore tagged Tumblr posts
Visit Tumblr Blog
Explore Tumblr blogs with no restrictions, modern design and the best experience.
Last Seen Tumblr Blogs


Fun Fact
The most popular pages on Tumblr are about Minecraft, GIFs, and David J. Peterson.
Note
Heyo, I just saw your recent post about that anon bitching at you for something you supposedly said, which you really didn't? Love the sass and no nonsense attitude btw! Keep it up!
I was just wandering what moments do you think JM has had that show he is in the community? This is not meant to offend, I am just really curious about what your opinion and moments will be! Thanks💜
Thanks anon. And good morning! Or whatever time it happens to be for you in your part of the world!
Jimin, in MY OPINION, has plenty of moments that hint at him being LGBTQ. TONS and we can even talk about those moments without talking about his obvious attraction to Jungkook, which by itself should be enough of an indicator that our boy is at least not straight.
Jimin has had plenty of moments where he incorporates rainbows into his clothes or into his photos. For example, the first 2 are photos he posted on their offical account and the 3rd is obviously a Dynamite screengrab


On a radio show in 2014, he was asked why he likes Jungkook, Jimin answered, and then Tae popped in with a "I think he just likes men" and Jimin responded with a simple "well I don't like you." Which can we all applaud him for such a snappy comeback. Not cool of Tae but he was young. Jimin didn't deny it, he couldn't without getting defensive and he turned it into a bit of a joke, but its still there, open for interpretation as a comment that had no denial

The rainbow unicorn photoshoot still raises all the eyebrows for me but it was an official photoshoot so.... I wont put too much stock into that. I will also say that Jimins rainbow hair wasn't exactly rainbow, it had 3 colors. And those 3 colors also happened to be the colors of the bisexuality pride flag... now I'm not saying that was done on purpose for sure, I'm just saying that it was done and that he chose to do it that way...👀

He has spoken many times about learning to love himself for who he is. Not pretending to be a super masculine bad boy, not having to act tough all the time, learning to accept and love himself for exactly who he was and it read to me like there was more within that message as well. This is a nice small compilation video of a few of those speeches he gave:
youtube
He drew the bigender symbol on himself for a photoshoot and used both the fem and masc words for attraction in Latin written on his hands during his filter day 2 performance.


Now disclaimer that Jimin does use He/Him pronouns with himself and the others use those pronouns with him as well. I personally do not think it is right to change those pronouns for him unless he says so. Address him however he and those closest to him address him. However this photoshoot was about expression. Jimin personally chose to write all these words/symbols on his body because they meant something to him. His exact words above talking about the photoshoot with the bigender symbol. This is a wonderful thread about the topic from Twitter:
These 2 performances in particular felt very queer coded and romantic for both Jimin and Jungkook and the fact that they did them together


And tumbler is cutting me off for image use. Lol but I'll just add this Twitter link to cover my entire point of some of his sassy moments just, yeah, you interpret that for yourself. lol We also have that clip of Jimin scoffing and asking "what even is men?" when he was told that men shouldn't check their selfies. And we have Yoongi and Jimin telling us that they want the BT21 characters to be gender-less.
And then if we add in the moments where he has expressed some attraction to men, such as appreciation for how fit they are and/or moments where he checked them out. As well as the fact that if we consider all the times he has made it pretty blatantly clear that he is attracted to Jungkook.... lol in my opinion, he is pretty obviously a part of the LGBTQ+ community, no matter what he chooses to label it as. Is it possible that I am reading this entire situation incorrectly and he is straight, sure. But I feel like that's very unlikely.
I have another ask about this same topic for Jungkook. I'll probably answer that one and then close this topic down and not accept anymore asks about it. And for all the anons in my inbox assuming I'm straight because I have a husband, well thats very bi-phobic of you. Hope you all have a very nice day! Again. Everything in here is just my personal opinion. You are free to agree or disagree.
191 notes
·
View notes
Text
How does abbybot work?
I have 4 api's in use.
The core bot is build apon discord.net.
it supplies the messages, and i can do things with them.
like checking for certain words or commands.
to do more complex things with the bot I made a message data class it stores all the useful information that specific message would be used for instance. (basic user info like ids, names; what guild theyre sending from, their guild rank color, the guild channel their sending messages from; etc.)

to save information I get I use mysql.
To make it easier to use i made a mysql user class which stores information about the user.

(like, their names, their discord ids, how many messages theyve sent and other silly things like their twitter account handle.)
speaking of twitter.
all i do is gather the tweets from the account associated to their mysql user.
but what's the use of taking tweets if your not gonna show them in their respective channel?
that brings me to commands. I have a basic string which holds a single character. we call it the prefix.

I just check if that character is being used with a command.
to show you the basics of the command system let's continue with twitter.
if someone was to say "%tweet" in chat...

I just take that users twitter handle from their user and search for a tweet. if i happen to find information on that tweet, I'll show it to the chat using what discord calls an embed.

the source is https://twitter.com/Himikorendi/status/1160040905237078016?s=20 btw
to show that i'm ending the command, I add to the current users messagesSent variable and then return the modified current user.

every command is similar. however the image part of the bot is a little different of a story.
just like with the twitter command I'll be searching for a command. however this time the commands are defined by an array of gelcommand information currently at the top of the bot. in simple terms I put the command here,

and the image tags here.

then inside the command I check if the user has the correct roles to run the command, if they do... I proceed to exeucte the command.

here's how the basic command works, you feed in tags, it gives back information about an image.

this is where you can either choose to embed the image directly from gelbooru or download it and upload it to discord yourself. and because we have access to the image data we can directly credit the author by including the source url in the embed.

when everything meets our requirements we'll build the embed then send it off to the channel it was requested from. (pointed out in the message above)
just like before we'll add to the current users commandusages variable.

at the end of all that wierd processing we send the new information about the user to the database.

That's the end of how the command section works. however sometimes you want to do things that shouldn't rely on getting messages.
which is why I implemented a timer before starting the discord.net connection. don't worry the timer runs on a different thread.

inside the timer i automate the tweet command for those who opted into tweetchannels.
for every user who opted into autotweeting,

we'll check if they've posted anything new in the last while

and if they have get at most 5 recent tweets.

currently there's no way to turn off the feature for users through code. a command switch for this will be coming eventually. also inside the timer is the new user checker. it just checks if a new user has introduced themseves. if we have a new user we single them out and add them to the database.

That in a nutshell is how abbybot works. It is and is not alot at the same time.
This is currently my best project and i love working on it :)
#abbybot#abby kaioken#zak kaioken#gelbooru#c#csharp#discord#discord.net#discord bot#tweetsharp#twitter#tweet
1 note
·
View note
Text
Exploring the Azure IoT Arduino Cloud DevKit
Someone gave me an Azure IoT DevKit, and it was lovely timing as I'm continuing to learn about IoT. As you may know, I've done a number of Arduino and Raspberry Pi projects, and plugged them into various and sundry clouds, including AWS, Azure, as well as higher-level hobbyist systems like AdaFruit IO (which is super fun, BTW. Love them.)
The Azure IoT DevKit is brilliant for a number of reasons, but one of the coolest things is that you don't need a physical one...they have an online simulator! Which is very Inception. You can try out the simulator at http://ift.tt/2Fg77OM. You can literally edit your .ino Arduino files in the browser, connect them to your Azure account, and then deploy them to a virtual DevKit (seen on the right). All the code and how-tos are on GitHub as well.
When you hit Deploy it'll create a Free Azure IoT Hub. Be aware that if you already have a free one you may want to delete it (as you can only have a certain number) or change the template as appropriate. When you're done playing, just delete the entire Resource Group and everything within it will go away.
Right off the bat you'll have the code to connect to Azure, get tweets from Twitter, and display them on the tiny screen! (Did I mention there's a tiny screen?) You can also "shake" the virtual IoT kit, and exercise the various sensors. It wouldn't be IoT if it didn't have sensors!
This is just the simulator, but it's exactly like the real MXChip IoT DevKit. (Get one here) They are less than US$50 and include WiFi, Humidity & Temperature, Gyroscope & Accelerometer, Air Pressure, Magnetometer, Microphone, and IrDA, which is ton for a small dev board. It's also got a tiny 128x64 OLED color screen! Finally, the board also can go into AP mode which lets you easily put it online in minutes.
I love these well-designed elegant little devices. It also shows up as an attached disk and it's easy to upgrade the firmware.
You can then dev against the real device with free VS Code if you like. You'll need:
Node.js and Yarn: Runtime for the setup script and automated tasks.
Azure CLI 2.0 MSI - Cross-platform command-line experience for managing Azure resources. The MSI contains dependent Python and pip.
Visual Studio Code (VS Code): Lightweight code editor for DevKit development.
Visual Studio Code extension for Arduino: Extension that enables Arduino development in Visual Studio Code.
Arduino IDE: The extension for Arduino relies on this tool.
DevKit Board Package: Tool chains, libraries, and projects for the DevKit
ST-Link Utility: Essential tools and drivers.
But this Zip file sets it all up for you on Windows, and head over here for Homebrew/Mac instructions and more details.
I was very impressed with the Arduino extension for VS Code. No disrespect to the Arduino IDE but you'll likely outgrow it quickly. This free add on to VS Code gives you intellisense and integration Arduino Debugging.
Once you have the basics done, you can graduate to the larger list of projects at http://ift.tt/2rkqa6j that include lots of cool stuff to try out like a cloud based Translator, Door Monitor, and Air Traffic Control Simulator.
All in all, I was super impressed with the polish of it all. There's a LOT to learn, to be clear, but this was a very enjoyable weekend of play.
Sponsor: Get the latest JetBrains Rider for debugging third-party .NET code, Smart Step Into, more debugger improvements, C# Interactive, new project wizard, and formatting code in columns.
© 2017 Scott Hanselman. All rights reserved.
Exploring the Azure IoT Arduino Cloud DevKit published first on http://ift.tt/2oiB0tl
0 notes
Text
Exploring the Azure IoT Arduino Cloud DevKit
Someone gave me an Azure IoT DevKit, and it was lovely timing as I'm continuing to learn about IoT. As you may know, I've done a number of Arduino and Raspberry Pi projects, and plugged them into various and sundry clouds, including AWS, Azure, as well as higher-level hobbyist systems like AdaFruit IO (which is super fun, BTW. Love them.)
The Azure IoT DevKit is brilliant for a number of reasons, but one of the coolest things is that you don't need a physical one...they have an online simulator! Which is very Inception. You can try out the simulator at https://aka.ms/iot-devkit-simulator. You can literally edit your .ino Arduino files in the browser, connect them to your Azure account, and then deploy them to a virtual DevKit (seen on the right). All the code and how-tos are on GitHub as well.
When you hit Deploy it'll create a Free Azure IoT Hub. Be aware that if you already have a free one you may want to delete it (as you can only have a certain number) or change the template as appropriate. When you're done playing, just delete the entire Resource Group and everything within it will go away.
Right off the bat you'll have the code to connect to Azure, get tweets from Twitter, and display them on the tiny screen! (Did I mention there's a tiny screen?) You can also "shake" the virtual IoT kit, and exercise the various sensors. It wouldn't be IoT if it didn't have sensors!
This is just the simulator, but it's exactly like the real MXChip IoT DevKit. (Get one here) They are less than US$50 and include WiFi, Humidity & Temperature, Gyroscope & Accelerometer, Air Pressure, Magnetometer, Microphone, and IrDA, which is ton for a small dev board. It's also got a tiny 128x64 OLED color screen! Finally, the board also can go into AP mode which lets you easily put it online in minutes.
I love these well-designed elegant little devices. It also shows up as an attached disk and it's easy to upgrade the firmware.
You can then dev against the real device with free VS Code if you like. You'll need:
Node.js and Yarn: Runtime for the setup script and automated tasks.
Azure CLI 2.0 MSI - Cross-platform command-line experience for managing Azure resources. The MSI contains dependent Python and pip.
Visual Studio Code (VS Code): Lightweight code editor for DevKit development.
Visual Studio Code extension for Arduino: Extension that enables Arduino development in Visual Studio Code.
Arduino IDE: The extension for Arduino relies on this tool.
DevKit Board Package: Tool chains, libraries, and projects for the DevKit
ST-Link Utility: Essential tools and drivers.
But this Zip file sets it all up for you on Windows, and head over here for Homebrew/Mac instructions and more details.
I was very impressed with the Arduino extension for VS Code. No disrespect to the Arduino IDE but you'll likely outgrow it quickly. This free add on to VS Code gives you intellisense and integration Arduino Debugging.
Once you have the basics done, you can graduate to the larger list of projects at https://microsoft.github.io/azure-iot-developer-kit/docs/projects/ that include lots of cool stuff to try out like a cloud based Translator, Door Monitor, and Air Traffic Control Simulator.
All in all, I was super impressed with the polish of it all. There's a LOT to learn, to be clear, but this was a very enjoyable weekend of play.
Sponsor: Get the latest JetBrains Rider for debugging third-party .NET code, Smart Step Into, more debugger improvements, C# Interactive, new project wizard, and formatting code in columns.
© 2017 Scott Hanselman. All rights reserved.


0 notes
Text
Are You Financially Average?
Mornin’ mornin’!
So last week we went over 15 great financial goals to hit if you wanted to be ABOVE average in this wacko world of ours, but today I thought it would be fun to see just how close we are to being AVERAGE average compared to others ;)
Because why not, right? What else are we going to do today?
Stats are below in bold, followed by my own thoughts & answers… I’ll let you decide which areas you actually want to be average on, and which you don’t ;)
10 Financial Statistics of The Average American
(The data is mostly from 2015 and chock-full of other variables that we should probably pay attention to, but take them for what they’re worth and just play along with this blogger here ;) Big shout to The Motley Fool where I borrowed these stats from.)
#1. The average American gross household income is $71,258
Pretty decent… Our household income this year will be around $110,000 between my wife’s new job and my online projects, but obviously if there’s only one of you in your household it’s going to skew your results :) Verdict for us: above average
#2. The average American household with debt owes $132,529
Dayuuummm… Although it *does* include mortgages and student loans, cars, etc, so it’s not ALL credit card debt. We’ve opted to go back to renting so we don’t have any mortgages, but we do have a car note with $12,142.79 left which makes our verdict here below average.
#3. The average American gave $5,491 to charity in 2015
Pretty good!!! Probably because the higher earners skew it, but still – no shame in trying to keep up! And outside all the gobs of time I spend helping people with their $$$, we fail here with only giving about $1,000 in cash and donations last year… Though we did give out over $14,000 so far with our Community Fund I helped launch, and my $20/mo charity trick is now auto. pumping out $100/mo to 5 of my favorite organizations, so we are getting better! Verdict: below average (but not for long!)
#4. The average American has a FICO credit score of 700
Much better than I’d expect? I’m not exactly sure what my *FICO* score is, but I do know from last week’s checking that we’re at 829 with Experian and 835 w/ TransUnion and 833 w/ Equifax. So I would assume we’d be in the 800’s as well with FICO. And man are there a lot of different scores out there? You can learn more about most of them here, but again as long as you’re at least monitoring one of them consistently you’ll be just fine. J$ verdict: above average
#5. The average American’s 401(k) balance is $96,288
I no longer have a 401(k) since becoming self-employed, but I do have about $504,000 in my SEP IRA which is an equivalent (minus those glorious free matches!!!) so it’s safe to say we’re way above average here too. You could also probably include IRAs and any other types of retirement accounts here which of course paints a much bigger picture, especially if you don’t even have access to a 401(k) plan.
Here’s a cool graph Motley Fool included that breaks down the average totals by *age* – which is a much fairer comparison. It comes from Vanguard’s 2016 How America Saves report (PDF):
(For more thoughts around this, check out my postings on Twitter and Facebook where there were some pretty lively conversations going in response to this graph!)
#6. The average personal savings rate in the U.S. is 5.5%
Ugh… Although apparently this is up from 1.9% in 2005, so yay? I’m never quite sure exactly how one goes about calculating their savings rate (do you use pre-tax money? After-tax? Does investing count? What about debt payments?) but here’s what I get depending on what I’m including – all based on pre-tax income:
Actual “savings” rate: 0% (all our extra money goes to maxing out retirement accounts and debt)
Investing rate: 26% (SEP IRA, ROTH IRA)
Investing + debt pay off rate: 34% (SEP IRA, ROTH IRA, Car loan)
Verdict: above average
#7. Only 18% of Americans actively contribute to an IRA
Double ugh… I’m not sure what’s considered “active” here (I usually contribute only once a year to max it out vs monthly deposits) but either way not good, America. Not good! J$ verdict: above average
#8. The average American’s tax refund in 2016 was $2,860.
I know people either LOVE getting refunds or think it’s asinine that you “give the government a loan,” but as far as I’m concerned a nice surprise is always better than an ugly one. And I find that when people get a *chunk* of money vs smaller more frequent ones, they tend to apply it more towards bigger goals anyways since it seems to make a much larger difference. So to me it’s all in HOW YOU USE THE MONEY vs when you get it.
As for our typical returns, we usually break even since we pay taxes quarterly, however last year we got an unexpected return of $5,000 when we overpaid on part of some money that came in at the end of the year. Which of course went right back into investments! And again, a much better surprise getting $5,000 back than the opposite ;)
Verdict: above average (not sure how to color code this, haha…)
#9. The average American pays an effective federal income tax rate of 13.5%
Wow! Wouldn’t have ever guessed that! Not that I pay attention too much to this stuff (borrrrringgggg). And similar to the whole savings rate thing I wasn’t quite sure how to calculate this puppy either, however a quick Google search shot me a fast answer and was able to figure it out nicely.
Per Investopedia:
An individual’s effective tax rate is calculated by dividing total tax expense from line 63 of his 1040 Form by his taxable income from line 43 of that form.
Easy enough, right? For 2016 that came out to 17% for us (much lower than usual probably due to us taking a loss when we sold our house earlier in the year, as well as my wife maybe going back to work?), but for 2015 it was quite higher at a whopping 43%! Can that be right?? This is exactly why I use an accountant as I don’t trust myself to calculate crap haha…
Verdict: above average (I’m gonna say this is both good and bad: bad cuz we’re obviously paying more than the average, but good in that it typically means we’re also *earning more,* as well as giving more back to support our state/country too)
#10. The average American’s Social Security retirement benefit is $1,363/mo
Reason #38 to make sure you’re saving and investing on your own!! Can’t rely on anyone to support you in retirement :( I cant find my login/password to the site at the moment, but here’s what our future payments were estimated at two years ago. I’d imagine it’s only gone up?
(I like how “early retirement” is 62 btw… surely they haven’t come across FIRE blogs! ;))
You can easily access all your own social security stuff these days here: http://ift.tt/1Dgs85A (provided you remember your password!). It’s also helpful when trying to run your Lifetime Wealth Ratio too that I conjured up :) Divide your current net worth by your *total earnings* over your lifetime and see what % of it you still have left! Just make sure to have a box of tissues around as most times it’s pretty depressing, haha… Verdict: above average
#11. Bonus: The average American will spend $165.14 on Thanksgiving expenses this year (via LendEdu)
If only that read Christmas! :) We’ll probably only be spending around $30 or $40 for gas and some side dishes to the dinners we’ll be attending this year (thanks mom and dad!), but I know some are flying all over the place which I’d imagine gets pricey pretty fast. Good thing we love our friends and families! Verdict: below average
(my favorite all-time gift, given to me by Baby Penny!)
BTW, right before I went to publish this I got two more T-Day stats emailed to me, by Ebates:
22% of Americans plan to begin their Black Friday shopping online after Thanksgiving dinner
11% of Americans admit to shopping on their mobile phones during Thanksgiving dinner
Wow…
So there you have it! The average financial stats of your fellow man and woman :)
Where do you land? More average than below average? More below than above?
It looks like I’m mostly above average in the right places and below average in the others, but areas of improvement can be found in both the charity and the effective tax rate areas… I’m still amazed by how all those early retirees pay 0% in taxes btw, even though they’re all millionaires!! Talk about being crafty!
See this post here by Go Curry Cracker to see what I mean: Never Pay Taxes Again (hint: you’ll need to live on far less than you’re probably doing right now to pull this off)
Thanks for playing along! No one else in real life likes talking about this stuff with me ;)
**** PS: Here’s the link again to the Motley Fool article if you want to learn more: 10 Incredible Financial Statistics That Sum Up the Average American
Are You Financially Average? posted first on http://ift.tt/2lnwIdQ
0 notes
Text
Are You Financially Average?
Mornin’ mornin’!
So last week we went over 15 great financial goals to hit if you wanted to be ABOVE average in this wacko world of ours, but today I thought it would be fun to see just how close we are to being AVERAGE average compared to others ;)
Because why not, right? What else are we going to do today?
Stats are below in bold, followed by my own thoughts & answers… I’ll let you decide which areas you actually want to be average on, and which you don’t ;)
10 Financial Statistics of The Average American
(The data is mostly from 2015 and chalk full of other variables that we should probably pay attention to, but take them for what they’re worth and just play along with this blogger here ;) Big shout to The Motley Fool where I borrowed these stats from.)
#1. The average American gross household income is $71,258
Pretty decent… Our household income this year will be around $110,000 between my wife’s new job and my online projects, but obviously if there’s only one of you in your household it’s going to skew your results :) Verdict for us: above average
#2. The average American household with debt owes $132,529
Dayuuummm… Although it *does* include mortgages and student loans, cars, etc, so it’s not ALL credit card debt. We’ve opted to go back to renting so we don’t have any mortgages, but we do have a car note with $12,142.79 left which makes our verdict here below average.
#3. The average American gave $5,491 to charity in 2015
Pretty good!!! Probably because the higher earners skew it, but still – no shame in trying to keep up! And outside all the gobs of time I spend helping people with their $$$, we fail here with only giving about $1,000 in cash and donations last year… Though we did give out over $14,000 so far with our Community Fund I helped launch, and my $20/mo charity trick is now auto. pumping out $100/mo to 5 of my favorite organizations, so we are getting better! Verdict: below average (but not for long!)
#4. The average American has a FICO credit score of 700
Much better than I’d expect? I’m not exactly sure what my *FICO* score is, but I do know from last week’s checking that we’re at 829 with Experian and 835 w/ TransUnion and 833 w/ Equifax. So I would assume we’d be in the 800’s as well with FICO. And man are there a lot of different scores out there? You can learn more about most of them here, but again as long as you’re at least monitoring one of them consistently you’ll be just fine. J$ verdict: above average
#5. The average American’s 401(k) balance is $96,288
I no longer have a 401(k) since becoming self-employed, but I do have about $504,000 in my SEP IRA which is an equivalent (minus those glorious free matches!!!) so it’s safe to say we’re way above average here too. You could also probably include IRAs and any other types of retirement accounts here which of course paints a much bigger picture, especially if you don’t even have access to a 401(k) plan.
Here’s a cool graph Motley Fool included that breaks down the average totals by *age* – which is a much fairer comparison. It comes from Vanguard’s 2016 How America Saves report (PDF):
(For more thoughts around this, check out my postings on Twitter and Facebook where there were some pretty lively conversations going in response to this graph!)
#6. The average personal savings rate in the U.S. is 5.5%
Ugh… Although apparently this is up from 1.9% in 2005, so yay? I’m never quite sure exactly how one goes about calculating their savings rate (do you use pre-tax money? After-tax? Does investing count? What about debt payments?) but here’s what I get depending on what I’m including – all based on pre-tax income:
Actual “savings” rate: 0% (all our extra money goes to maxing out retirement accounts and debt)
Investing rate: 26% (SEP IRA, ROTH IRA)
Investing + debt pay off rate: 34% (SEP IRA, ROTH IRA, Car loan)
Verdict: above average
#7. Only 18% of Americans actively contribute to an IRA
Double ugh… I’m not sure what’s considered “active” here (I usually contribute only once a year to max it out vs monthly deposits) but either way not good, America. Not good! J$ verdict: above average
#8. The average American’s tax refund in 2016 was $2,860.
I know people either LOVE getting refunds or think it’s asinine that you “give the government a loan,” but as far as I’m concerned a nice surprise is always better than an ugly one. And I find that when people get a *chunk* of money vs smaller more frequent ones, they tend to apply it more towards bigger goals anyways since it seems to make a much larger difference. So to me it’s all in HOW YOU USE THE MONEY vs when you get it.
As for our typical returns, we usually break even since we pay taxes quarterly, however last year we got an unexpected return of $5,000 when we overpaid on part of some money that came in at the end of the year. Which of course went right back into investments! And again, a much better surprise getting $5,000 back than the opposite ;)
Verdict: above average (not sure how to color code this, haha…)
#9. The average American pays an effective federal income tax rate of 13.5%
Wow! Wouldn’t have ever guessed that! Not that I pay attention too much to this stuff (borrrrringgggg). And similar to the whole savings rate thing I wasn’t quite sure how to calculate this puppy either, however a quick Google search shot me a fast answer and was able to figure it out nicely.
Per Investopedia:
An individual’s effective tax rate is calculated by dividing total tax expense from line 63 of his 1040 Form by his taxable income from line 43 of that form.
Easy enough, right? For 2016 that came out to 17% for us (much lower than usual probably due to us taking a loss when we sold our house earlier in the year, as well as my wife maybe going back to work?), but for 2015 it was quite higher at a whopping 43%! Can that be right?? This is exactly why I use an accountant as I don’t trust myself to calculate crap haha…
Verdict: above average (I’m gonna say this is both good and bad: bad cuz we’re obviously paying more than the average, but good in that it typically means we’re also *earning more,* as well as giving more back to support our state/country too)
#10. The average American’s Social Security retirement benefit is $1,363/mo
Reason #38 to make sure you’re saving and investing on your own!! Can’t rely on anyone to support you in retirement :( I cant find my login/password to the site at the moment, but here’s what our future payments were estimated at two years ago. I’d imagine it’s only gone up?
(I like how “early retirement” is 62 btw… surely they haven’t come across FIRE blogs! ;))
You can easily access all your own social security stuff these days here: http://ift.tt/1Dgs85A (provided you remember your password!). It’s also helpful when trying to run your Lifetime Wealth Ratio too that I conjured up :) Divide your current net worth by your *total earnings* over your lifetime and see what % of it you still have left! Just make sure to have a box of tissues around as most time it’s pretty depressing, haha… Verdict: above average
#11. Bonus: The average American will spend $165.14 on Thanksgiving expenses this year (via LendEdu)
If only that read Christmas! :) We’ll probably only be spending around $30 or $40 for gas and some side dishes to the dinners we’ll be attending this year (thanks mom and dad!), but I know some are flying all over the place which I’d imagine gets pricey pretty fast. Good thing we love our friends and families! Verdict: below average
(my favorite all-time gift, given to me by Baby Penny!)
BTW, right before I went to publish this I got two more T-Day stats emailed to me, by Ebates:
22% off Americans plan to begin their Black Friday shopping online after Thanksgiving dinner
11% of Americans admit to shopping on their mobile phones during Thanksgiving dinner
Wow…
So there you have it! The average financial stats of your fellow man and woman :)
Where do you land? More average than below average? More below than above?
It looks like I’m mostly above average in the right places and below average in the others, but areas of improvement can be found in both the charity and the effective tax rate areas… I’m still amazed by how all those early retirees pay 0% in taxes btw, even though they’re all millionaires!! Talk about being crafty!
See this post here by Go Curry Cracker to see what I mean: Never Pay Taxes Again (hint: you’ll need to live on far less than you’re probably doing right now to pull this off)
Thanks for playing along! No one else in real life likes talking about this stuff with me ;)
**** PS: Here’s the link again to the Motley Fool article if you want to learn more: 10 Incredible Financial Statistics That Sum Up the Average American
Are You Financially Average? published first on http://ift.tt/2ljLF4B
0 notes
Text
Updated QSMP AO3 Work Language Stats-- as of August 13th, 2023
June 6 2023 stats, July 9 2023 stats
Another QSMP language stats update!! Not too much to update on this time, but still some nice numbers.
Fun tidbits/disclaimers to start:
QSMP has 3034 works as of today!! That's 887 more works from last month's 2147, about a 41.3% increase.
French fics have doubled from 5 works to 10!
PT Portuguese has now been tagged in two works!
We've dropped one Mandarin fic, likely due to deletion.
I used the same methodology as last time, which was to manually filter by each language I expected to have works, then do the math to make sure I wasn't missing any and check likely new languages. You can check the original June 6 post to see more about that.
I won't be including overall AO3 stats, as the monthly difference for them is negligible imo. In the future, if I continue to do this for the next year or so, I'll likely pick it up again to note the difference in the last year, or perhaps make a new series of posts about language statistics across the site rather than fandom specific.
Not much change this month! Most numbers have stayed fairly steady; I won't have much analysis as a result.
The numbers:
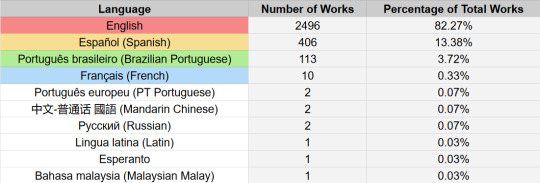
[Image Description: A table with three columns; the first lists languages, the second the number of works, and the third the percentage of total works. For the languages column, each language is listed first in that language and then in English in parentheses, and English, Spanish, Brazilian Portuguese, and French are all color-coded to indicate that they are spoken on the server. End ID.]
English has 2496 works and 82.27% of total works in QSMP
Spanish has 406 works and 13.38% of total works.
Brazilian Portuguese has 113 works and 3.72% of total works.
French has 10 works and 3.72% of total works-- the number of French fics has doubled since last month, although it's still quite low in comparison to the other languages spoken on the server.
New entry! European Portuguese now has 2 works and 0.07% of total works.
Mandarin has 2 works and 0.07% of total works; it previously had 3 works, one was likely deleted.
Russian has 2 works and 0.07% of total works, no change in number from last month.
The last three languages, Latin, Esperanto, and Malaysian Malay, all have 1 work and 0.03% of total works respectively, maintaining their numbers from last month as well.
Observations:
Like I said at the start, not much change here. The most impressive things to note are that French has doubled in number and European Portuguese now has works, neither of which are surprising. Kudos to those authors regardless, glad to see them gaining fics!!
I'll add my usual note that the stats for QSMP are interesting to compare to overall AO3 stats for the reason that we have far more Spanish and Portuguese works than the rest of the site. If you want to see numbers on total site stats, check out the previous stats posts to see those.
And that's pretty much all I've got!! I'll likely continue to post these every month, but when there's not a ton of changes they'll likely be short little posts like this with mostly just the numbers. Again, here's last month's stats and the 6/6/2023 stats. As always, if you have any data/observations on other fanfiction websites, feel free to let me know!
#bell.txt#qsmp#qsmp stats#also btw i use the color coding that the twitter accounts use#i figure it makes things a little easier
10 notes
·
View notes
Text
Are You Financially Average?
Mornin’ mornin’!
So last week we went over 15 great financial goals to hit if you wanted to be ABOVE average in this wacko world of ours, but today I thought it would be fun to see just how close we are to being AVERAGE average compared to others ;)
Because why not, right? What else are we going to do today?
Stats are below in bold, followed by my own thoughts & answers… I’ll let you decide which areas you actually want to be average on, and which you don’t ;)
10 Financial Statistics of The Average American
(The data is mostly from 2015 and chock-full of other variables that we should probably pay attention to, but take them for what they’re worth and just play along with this blogger here ;) Big shout to The Motley Fool where I borrowed these stats from.)
#1. The average American gross household income is $71,258
Pretty decent… Our household income this year will be around $110,000 between my wife’s new job and my online projects, but obviously if there’s only one of you in your household it’s going to skew your results :) Verdict for us: above average
#2. The average American household with debt owes $132,529
Dayuuummm… Although it *does* include mortgages and student loans, cars, etc, so it’s not ALL credit card debt. We’ve opted to go back to renting so we don’t have any mortgages, but we do have a car note with $12,142.79 left which makes our verdict here below average.
#3. The average American gave $5,491 to charity in 2015
Pretty good!!! Probably because the higher earners skew it, but still – no shame in trying to keep up! And outside all the gobs of time I spend helping people with their $$$, we fail here with only giving about $1,000 in cash and donations last year… Though we did give out over $14,000 so far with our Community Fund I helped launch, and my $20/mo charity trick is now auto. pumping out $100/mo to 5 of my favorite organizations, so we are getting better! Verdict: below average (but not for long!)
#4. The average American has a FICO credit score of 700
Much better than I’d expect? I’m not exactly sure what my *FICO* score is, but I do know from last week’s checking that we’re at 829 with Experian and 835 w/ TransUnion and 833 w/ Equifax. So I would assume we’d be in the 800’s as well with FICO. And man are there a lot of different scores out there? You can learn more about most of them here, but again as long as you’re at least monitoring one of them consistently you’ll be just fine. J$ verdict: above average
#5. The average American’s 401(k) balance is $96,288
I no longer have a 401(k) since becoming self-employed, but I do have about $504,000 in my SEP IRA which is an equivalent (minus those glorious free matches!!!) so it’s safe to say we’re way above average here too. You could also probably include IRAs and any other types of retirement accounts here which of course paints a much bigger picture, especially if you don’t even have access to a 401(k) plan.
Here’s a cool graph Motley Fool included that breaks down the average totals by *age* – which is a much fairer comparison. It comes from Vanguard’s 2016 How America Saves report (PDF):
(For more thoughts around this, check out my postings on Twitter and Facebook where there were some pretty lively conversations going in response to this graph!)
#6. The average personal savings rate in the U.S. is 5.5%
Ugh… Although apparently this is up from 1.9% in 2005, so yay? I’m never quite sure exactly how one goes about calculating their savings rate (do you use pre-tax money? After-tax? Does investing count? What about debt payments?) but here’s what I get depending on what I’m including – all based on pre-tax income:
Actual “savings” rate: 0% (all our extra money goes to maxing out retirement accounts and debt)
Investing rate: 26% (SEP IRA, ROTH IRA)
Investing + debt pay off rate: 34% (SEP IRA, ROTH IRA, Car loan)
Verdict: above average
#7. Only 18% of Americans actively contribute to an IRA
Double ugh… I’m not sure what’s considered “active” here (I usually contribute only once a year to max it out vs monthly deposits) but either way not good, America. Not good! J$ verdict: above average
#8. The average American’s tax refund in 2016 was $2,860.
I know people either LOVE getting refunds or think it’s asinine that you “give the government a loan,” but as far as I’m concerned a nice surprise is always better than an ugly one. And I find that when people get a *chunk* of money vs smaller more frequent ones, they tend to apply it more towards bigger goals anyways since it seems to make a much larger difference. So to me it’s all in HOW YOU USE THE MONEY vs when you get it.
As for our typical returns, we usually break even since we pay taxes quarterly, however last year we got an unexpected return of $5,000 when we overpaid on part of some money that came in at the end of the year. Which of course went right back into investments! And again, a much better surprise getting $5,000 back than the opposite ;)
Verdict: above average (not sure how to color code this, haha…)
#9. The average American pays an effective federal income tax rate of 13.5%
Wow! Wouldn’t have ever guessed that! Not that I pay attention too much to this stuff (borrrrringgggg). And similar to the whole savings rate thing I wasn’t quite sure how to calculate this puppy either, however a quick Google search shot me a fast answer and was able to figure it out nicely.
Per Investopedia:
An individual’s effective tax rate is calculated by dividing total tax expense from line 63 of his 1040 Form by his taxable income from line 43 of that form.
Easy enough, right? For 2016 that came out to 17% for us (much lower than usual probably due to us taking a loss when we sold our house earlier in the year, as well as my wife maybe going back to work?), but for 2015 it was quite higher at a whopping 43%! Can that be right?? This is exactly why I use an accountant as I don’t trust myself to calculate crap haha…
Verdict: above average (I’m gonna say this is both good and bad: bad cuz we’re obviously paying more than the average, but good in that it typically means we’re also *earning more,* as well as giving more back to support our state/country too)
#10. The average American’s Social Security retirement benefit is $1,363/mo
Reason #38 to make sure you’re saving and investing on your own!! Can’t rely on anyone to support you in retirement :( I cant find my login/password to the site at the moment, but here’s what our future payments were estimated at two years ago. I’d imagine it’s only gone up?
(I like how “early retirement” is 62 btw… surely they haven’t come across FIRE blogs! ;))
You can easily access all your own social security stuff these days here: http://ift.tt/1Dgs85A (provided you remember your password!). It’s also helpful when trying to run your Lifetime Wealth Ratio too that I conjured up :) Divide your current net worth by your *total earnings* over your lifetime and see what % of it you still have left! Just make sure to have a box of tissues around as most times it’s pretty depressing, haha… Verdict: above average
#11. Bonus: The average American will spend $165.14 on Thanksgiving expenses this year (via LendEdu)
If only that read Christmas! :) We’ll probably only be spending around $30 or $40 for gas and some side dishes to the dinners we’ll be attending this year (thanks mom and dad!), but I know some are flying all over the place which I’d imagine gets pricey pretty fast. Good thing we love our friends and families! Verdict: below average
(my favorite all-time gift, given to me by Baby Penny!)
BTW, right before I went to publish this I got two more T-Day stats emailed to me, by Ebates:
22% of Americans plan to begin their Black Friday shopping online after Thanksgiving dinner
11% of Americans admit to shopping on their mobile phones during Thanksgiving dinner
Wow…
So there you have it! The average financial stats of your fellow man and woman :)
Where do you land? More average than below average? More below than above?
It looks like I’m mostly above average in the right places and below average in the others, but areas of improvement can be found in both the charity and the effective tax rate areas… I’m still amazed by how all those early retirees pay 0% in taxes btw, even though they’re all millionaires!! Talk about being crafty!
See this post here by Go Curry Cracker to see what I mean: Never Pay Taxes Again (hint: you’ll need to live on far less than you’re probably doing right now to pull this off)
Thanks for playing along! No one else in real life likes talking about this stuff with me ;)
**** PS: Here’s the link again to the Motley Fool article if you want to learn more: 10 Incredible Financial Statistics That Sum Up the Average American
Are You Financially Average? posted first on http://ift.tt/2lnwIdQ
0 notes
Text
Are You Financially Average?
Mornin’ mornin’!
So last week we went over 15 great financial goals to hit if you wanted to be ABOVE average in this wacko world of ours, but today I thought it would be fun to see just how close we are to being AVERAGE average compared to others ;)
Because why not, right? What else are we going to do today?
Stats are below in bold, followed by my own thoughts & answers… I’ll let you decide which areas you actually want to be average on, and which you don’t ;)
10 Financial Statistics of The Average American
(The data is mostly from 2015 and chalk full of other variables that we should probably pay attention to, but take them for what they’re worth and just play along with this blogger here ;) Big shout to The Motley Fool where I borrowed these stats from.)
#1. The average American gross household income is $71,258
Pretty decent… Our household income this year will be around $110,000 between my wife’s new job and my online projects, but obviously if there’s only one of you in your household it’s going to skew your results :) Verdict for us: above average
#2. The average American household with debt owes $132,529
Dayuuummm… Although it *does* include mortgages and student loans, cars, etc, so it’s not ALL credit card debt. We’ve opted to go back to renting so we don’t have any mortgages, but we do have a car note with $12,142.79 left which makes our verdict here below average.
#3. The average American gave $5,491 to charity in 2015
Pretty good!!! Probably because the higher earners skew it, but still – no shame in trying to keep up! And outside all the gobs of time I spend helping people with their $$$, we fail here with only giving about $1,000 in cash and donations last year… Though we did give out over $14,000 so far with our Community Fund I helped launch, and my $20/mo charity trick is now auto. pumping out $100/mo to 5 of my favorite organizations, so we are getting better! Verdict: below average (but not for long!)
#4. The average American has a FICO credit score of 700
Much better than I’d expect? I’m not exactly sure what my *FICO* score is, but I do know from last week’s checking that we’re at 829 with Experian and 835 w/ TransUnion and 833 w/ Equifax. So I would assume we’d be in the 800’s as well with FICO. And man are there a lot of different scores out there? You can learn more about most of them here, but again as long as you’re at least monitoring one of them consistently you’ll be just fine. J$ verdict: above average
#5. The average American’s 401(k) balance is $96,288
I no longer have a 401(k) since becoming self-employed, but I do have about $504,000 in my SEP IRA which is an equivalent (minus those glorious free matches!!!) so it’s safe to say we’re way above average here too. You could also probably include IRAs and any other types of retirement accounts here which of course paints a much bigger picture, especially if you don’t even have access to a 401(k) plan.
Here’s a cool graph Motley Fool included that breaks down the average totals by *age* – which is a much fairer comparison. It comes from Vanguard’s 2016 How America Saves report (PDF):
(For more thoughts around this, check out my postings on Twitter and Facebook where there were some pretty lively conversations going in response to this graph!)
#6. The average personal savings rate in the U.S. is 5.5%
Ugh… Although apparently this is up from 1.9% in 2005, so yay? I’m never quite sure exactly how one goes about calculating their savings rate (do you use pre-tax money? After-tax? Does investing count? What about debt payments?) but here’s what I get depending on what I’m including – all based on pre-tax income:
Actual “savings” rate: 0% (all our extra money goes to maxing out retirement accounts and debt)
Investing rate: 26% (SEP IRA, ROTH IRA)
Investing + debt pay off rate: 34% (SEP IRA, ROTH IRA, Car loan)
Verdict: above average
#7. Only 18% of Americans actively contribute to an IRA
Double ugh… I’m not sure what’s considered “active” here (I usually contribute only once a year to max it out vs monthly deposits) but either way not good, America. Not good! J$ verdict: above average
#8. The average American’s tax refund in 2016 was $2,860.
I know people either LOVE getting refunds or think it’s asinine that you “give the government a loan,” but as far as I’m concerned a nice surprise is always better than an ugly one. And I find that when people get a *chunk* of money vs smaller more frequent ones, they tend to apply it more towards bigger goals anyways since it seems to make a much larger difference. So to me it’s all in HOW YOU USE THE MONEY vs when you get it.
As for our typical returns, we usually break even since we pay taxes quarterly, however last year we got an unexpected return of $5,000 when we overpaid on part of some money that came in at the end of the year. Which of course went right back into investments! And again, a much better surprise getting $5,000 back than the opposite ;)
Verdict: above average (not sure how to color code this, haha…)
#9. The average American pays an effective federal income tax rate of 13.5%
Wow! Wouldn’t have ever guessed that! Not that I pay attention too much to this stuff (borrrrringgggg). And similar to the whole savings rate thing I wasn’t quite sure how to calculate this puppy either, however a quick Google search shot me a fast answer and was able to figure it out nicely.
Per Investopedia:
An individual’s effective tax rate is calculated by dividing total tax expense from line 63 of his 1040 Form by his taxable income from line 43 of that form.
Easy enough, right? For 2016 that came out to 17% for us (much lower than usual probably due to us taking a loss when we sold our house earlier in the year, as well as my wife maybe going back to work?), but for 2015 it was quite higher at a whopping 43%! Can that be right?? This is exactly why I use an accountant as I don’t trust myself to calculate crap haha…
Verdict: above average (I’m gonna say this is both good and bad: bad cuz we’re obviously paying more than the average, but good in that it typically means we’re also *earning more,* as well as giving more back to support our state/country too)
#10. The average American’s Social Security retirement benefit is $1,363/mo
Reason #38 to make sure you’re saving and investing on your own!! Can’t rely on anyone to support you in retirement :( I cant find my login/password to the site at the moment, but here’s what our future payments were estimated at two years ago. I’d imagine it’s only gone up?
(I like how “early retirement” is 62 btw… surely they haven’t come across FIRE blogs! ;))
You can easily access all your own social security stuff these days here: http://ift.tt/1Dgs85A (provided you remember your password!). It’s also helpful when trying to run your Lifetime Wealth Ratio too that I conjured up :) Divide your current net worth by your *total earnings* over your lifetime and see what % of it you still have left! Just make sure to have a box of tissues around as most time it’s pretty depressing, haha… Verdict: above average
#11. Bonus: The average American will spend $165.14 on Thanksgiving expenses this year (via LendEdu)
If only that read Christmas! :) We’ll probably only be spending around $30 or $40 for gas and some side dishes to the dinners we’ll be attending this year (thanks mom and dad!), but I know some are flying all over the place which I’d imagine gets pricey pretty fast. Good thing we love our friends and families! Verdict: below average
(my favorite all-time gift, given to me by Baby Penny!)
BTW, right before I went to publish this I got two more T-Day stats emailed to me, by Ebates:
22% off Americans plan to begin their Black Friday shopping online after Thanksgiving dinner
11% of Americans admit to shopping on their mobile phones during Thanksgiving dinner
Wow…
So there you have it! The average financial stats of your fellow man and woman :)
Where do you land? More average than below average? More below than above?
It looks like I’m mostly above average in the right places and below average in the others, but areas of improvement can be found in both the charity and the effective tax rate areas… I’m still amazed by how all those early retirees pay 0% in taxes btw, even though they’re all millionaires!! Talk about being crafty!
See this post here by Go Curry Cracker to see what I mean: Never Pay Taxes Again (hint: you’ll need to live on far less than you’re probably doing right now to pull this off)
Thanks for playing along! No one else in real life likes talking about this stuff with me ;)
**** PS: Here’s the link again to the Motley Fool article if you want to learn more: 10 Incredible Financial Statistics That Sum Up the Average American
Are You Financially Average? posted first on http://ift.tt/2lnwIdQ
0 notes