#NIFTY WEEKLY TREND
Text
🌟 Bank Nifty Forecast Update! 🌟
Get the latest insights on Bank Nifty! 📊
Today's Forecast: 📅 Expect sharp movements in Bank Nifty. Stay ahead of the market!
Weekly Trends: 📈 Track the momentum and ride the trends with confidence.
Monthly Insights: 🔍 Analyze the broader picture for smart investments.
Don’t miss out on our expert analysis to navigate the markets effectively. Visit us now! 👉 hmatrading.in/bank-nifty-forecast

0 notes
Text
Buy or sell: Sumeet Bagadia recommends these three stocks for Monday - June 24
Buy or sell stocks: Indian stock market benchmarks, the Sensex and the Nifty 50, ended in the red on Friday, June 21. The indices witnessed profit booking at record levels amid the absence of fresh triggers. Nevertheless, the indices ended with mild gains for the week. Sensex rose 0.3 per cent last week, while the Nifty 50 increased by 0.2 per cent. Midcaps underperformed the benchmark index, while the smallcaps outperformed. The BSE Midcap declined 0.2 per cent. On the other hand, the BSE Smallcap index jumped 1.4 per cent for the week. During the week, the Sensex hit its all-time high of 77,851.63, and the Nifty 50 scaled a fresh peak of 23,667.10 before witnessing some profit booking at higher levels. Experts observed that the market's medium-term texture is still positive, but a small bearish candle on weekly charts and a double top formation on intraday charts suggest further weakness from the current levels
Buy or sell stocks for Monday — June 24
Sumeet Bagadia of Choice Broking has recommended three stocks for Monday — Bharti Airtel, IndiGo, and Dr Reddy's Laboratories
Bharti Airtel | Previous close: ₹1,416.05 | Target price: ₹1,520 | Stop loss: ₹ ₹1,360 | Upside potential: 7%
Bharti Airtel, a prominent player in the telecom sector, has demonstrated resilience and has given a strong breakout above ₹1,405 level.
The stock recently broke above the ₹1,405 level with high volumes, signalling robust strength.
InterGlobe Aviation (IndiGo) | Previous close: ₹4,310.15 | Target price: ₹4,600 | Stop loss: ₹4,180 | Upside potential: 7%
IndiGo is currently trading at ₹4,310.15 level, demonstrating a robust recovery from the support level of ₹4,180.
The stock has surpassed the small resistance of ₹4,260 which is also close to its short-term (20-day) EMA (exponential moving average) levels.
Dr. Reddy's Laboratories | Previous close: ₹6,011.45 | Target price: ₹6,380 | Stop loss: ₹5,800 | Upside potential: 6%
Dr Reddy's Laboratories is trading at ₹6,011.45 level, having displayed significant strength with robust volumes.
This stock signals bullish momentum. The stock has surpassed its key moving averages and is trading above its short-term (20-day), medium-term (50-day), and long-term (200-day) EMA levels, indicating sustained strength and a positive trend.
0 notes
Text
Market Outlook: Nifty 50 Set for Weekly Gain with IT and Pharma Stocks Boosting Domestic Demand
#Delhivery #domesticdemand #ITstocks #JSWInfra #Nifty50 #NiftyBank #NiftyMidcap100 #pharmastocks #ShriramTransportFinance #SJVN #weeklygain
#Business#Delhivery#domesticdemand#ITstocks#JSWInfra#Nifty50#NiftyBank#NiftyMidcap100#pharmastocks#ShriramTransportFinance#SJVN#weeklygain
0 notes
Link
[ad_1] By ending 89 points higher after scaling yet another record high level, Nifty on Friday formed a small positive candle with minor upper shadow. On both daily and weekly charts, the index formed a breakout continuation formation, which is indicating that the uptrend wave is likely to continue in the near future.The short-term trend of Nifty continues to be positive but given the recent run-up, traders should be prepared for correction. The next upside target to be watched at 20450 levels, which is 38.2% Fibonacci extension, taken from March bottom-July top-Aug bottom. Immediate supports to be watched at 20050, said Nagaraj Shetti of HDFC Securities.What should traders do? Here’s what analysts said:Rupak De, Senior Technical analyst at LKP SecuritiesNifty continued to exhibit strength as the index reached new highs. Strong Put writing at 20,100 has further bolstered positive sentiment in the market. The trend is expected to remain positive as long as Nifty remains above the 20,000 mark. In the short term, there is potential for Nifty to move towards the 20,480-20,500 range on the upside.Jatin Gedia – Technical Research Analyst at Sharekhan by BNP ParibasOn the daily charts, we can observe that the up move in Nifty has slowed down for the last three trading sessions. The slope of the ascent has been shallow. The reason we attribute to this price action is that it has reached the zone of 20100 – 20200 where the weekly upper Bollinger band is placed, which is resulting in subdued price action. The hourly momentum indicator though having a positive crossover is showing signs of negative divergence, which should not be underestimated. Overall, the short-term outlook is positive. However, considering the sharp run-up for the last three trading sessions we should have a cautious stance and be prepared for a correction. In terms of levels, 20050 – 20000 is the crucial support zone while 20200 – 20250 shall act as an immediate hurdle zone.Amol Athawale, Vice President - Technical Research, Kotak SecuritiesAlthough the larger texture of the market is bullish, the market is in temporary overbought conditions, and hence we could see some profit booking at higher levels. For short term traders, 20075 and 20000 would act as key support zones while 20300-20375 could act as crucial resistance areas for the bulls.(Disclaimer: Recommendations, suggestions, views and opinions given by the experts are their own. These do not represent the views of The Economic Times)(What's moving Sensex and Nifty Track latest market news, stock tips and expert advice on ETMarkets. Also, ETMarkets.com is now on Telegram. For fastest news alerts on financial markets, investment strategies and stocks alerts, subscribe to our Telegram feeds.) Download The Economic Times News App to get Daily Market Updates & Live Business News. Top Trending Stocks: Sensex Today Live, SBI Share Price, Axis Bank Share Price, HDFC Bank Share Price, Infosys Share Price, Wipro Share Price, NTPC Share Price [ad_2]
0 notes
Text
HSR 9-9-23

Relic grind only really got me a fine-looking Muskateer hat.
6x Abundance Trace rounds
Last Echo of War run of the week against Phantylia. Actually managed to beat her third phase without her ever using her special attack for that phase, which is nifty.
7x Aether Calyx rounds
My weeklies are all wrapped up today, so tomorrow is just whatever I can squeeze in time for. Starting to put some work into Light Cones today while I'm at it:
L40 for Resolution Shines as Pearls of Sweat (Nihility LC) for Luka
L40 for my second copy of Fermata (Nihility LC) for Sampo's benefit
L40 for Warmth Shortens Cold Nights (Abundance LC) for Lynx's benefit
L80 for Trend of the Universal Market (Preservation LC) for the Pre-Blazer
Maxing out Trend ate into most of the reserves but I'd still say it's worth it, just means I've got more of the grind I was already doing with Aether.
I was actually gonna call it there for a day but I was in the shop getting some of the green-tier Nihility Trace materials to get the LCs up and realized the buyable tickets reset so I've got enough for a ten-pull in the standard banner!

I'm 195/300 on getting the standard banner free five-star and honestly? This maxes out my Pela and I will happily take that. If you discount the Trailblazer and Herta she's my third max-Eidolon character now! (The others are Serval and Yukong, JSYK.)
Five-Star Fund: 94/180
0 notes
Text
Nifty: Current Support and Final Target Before Crash
Introduction:
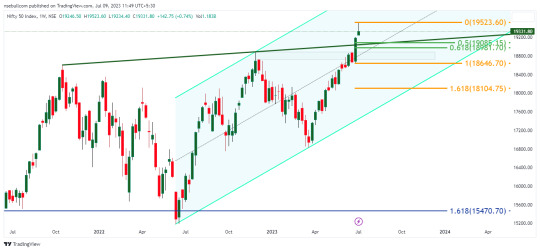
Recently institutional investors made significant profit bookings when the Nifty reached the psychological level of 19500. This development has sparked discussions and raised concerns about the possibility of a market crash. In this blog, we will delve deeper into the current situation, examining the ongoing swing target, support levels, and the potential for a continued bullish rally. Additionally, we will analyze the formation of an inverted hammer pattern and its implications for future price movements.
The Uncompleted Swing Target:
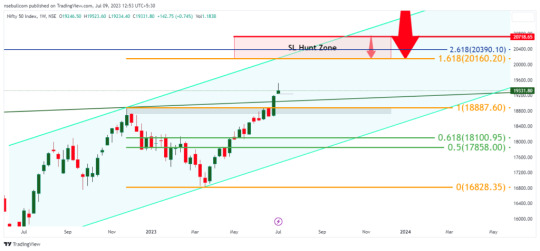
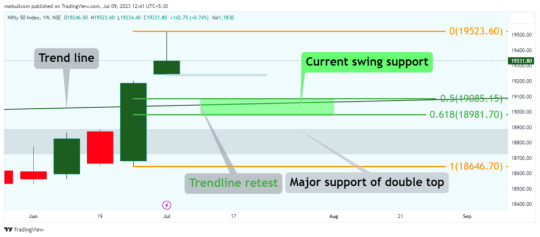
Despite the profit bookings, it is essential to note that the current swing target has not yet been achieved. This suggests that there is still room for further upward movement in Nifty. Traders and investors should exercise caution before assuming a bearish market sentiment.
Support at 19085 and Retest of Trendline:
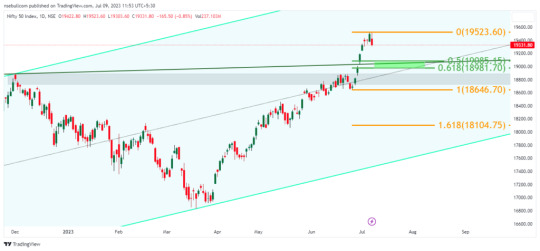
To provide stability, a support level has been established at 19085. This level acts as a floor for the market, preventing significant declines. Additionally, there is a retest of a trendline that broke upside on June 30th, indicating the potential for the bullish trend to continue without retracement. This retest further supports the notion that a market crash is unlikely at this point.
The Strongly Bullish Trend:
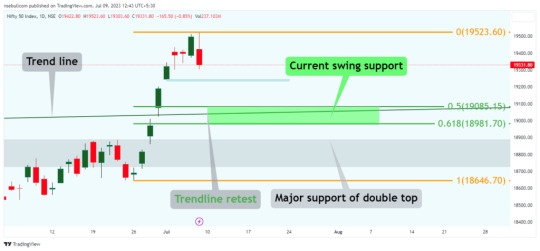
One of the positive factors contributing to the optimism is the strongly bullish trend observed in Nifty. The index has displayed resilience and the potential to continue its rally without significant retracement. This trend reflects the confidence and optimism of market participants.
Analyzing the Inverted Hammer Pattern:
On the weekly chart, an inverted hammer pattern has formed in Nifty. Traditionally, this pattern signifies a reversal from a bullish to a bearish trend. However, it is crucial to approach this pattern with caution. Until the low of the previous candle is breached and closed below 19234.40, there is still a possibility of further upward movement in the index.
Conclusion:
Institutional investors' profit bookings at the psychological level of 19500 in Nifty have sparked concerns about a potential market crash. However, considering the uncompleted swing target, the presence of a support level at 19085, and the retest of the trendline, a crash seems unlikely in the near term. The strongly bullish trend also supports the potential for a continued rally in Nifty. While the inverted hammer pattern suggests a reversal, confirmation through the breach of key levels is crucial. Traders and investors should closely monitor the price action and the breach of the low of the previous candle to gauge the direction of future price movements in Nifty. By staying informed and vigilant, market participants can make more informed decisions in these dynamic times.
Read the full article
#Nifty#niftychart#niftyfibonaccilevels#niftylive#niftyliveanalysis#NiftyLiveChart#niftypredictionfortomorrow#niftypredictiontechnicalchart#niftysupportandresistance#niftytechnicalanalysis#niftytoday#niftytradesetup
0 notes
Text
Trading setup for today: Check these numbers before the market opens, it will be easy to close profitable deals
Trade Setup: On April 19, the selling pressure in the market continued for the third consecutive day. At the same time, Nifty’s trending range also became smaller. Ahead of the weekly expiry of April 20, the Nifty 50 index is gaining support at both the 17600 and the 200-DMA. The Nifty closed at 17619, down 41.40 points. At the same time, the Sensex closed at the level of 59568 with a weakness of…

View On WordPress
0 notes
Note
thoughts on plastic surgery?
People tend to forget that plastic surgery isn’t just for people who feel like it, but also stuff like face reconstruction after severe accidents, implants after breast cancer, and things like that. In that regard, it’s pretty amazing what can be done with it, actually.
As for "casual“ plastic surgery…the issue is less that it exists, and more whatever drives people to hate their look so much they feel the need to permanently change it, no?
But idk, if someone gets a plastic surgery once and is super happy with it, tbh good for them? Like, people don’t make any drama about stuff like waxing either, and that one’s essentially self-inflicted harm at a weekly basis. Heck, it’s kinda expected to align with general societal standards. So it seems a bit…hypocritical to go "Oh but it’s not natural! Love yourself as you are!“ on one end but have society demand something way more painful that has to be actively kept up for basically a whole life on the other. You‘d think that those who go shame anyone with plastic surgery would logically hate beauty standards too, but (and granted, this is mostly anecdotal) more often than not they then circle around also judging people who don’t adhere to said standards at all either. Seems to be a bit of a "you don’t fit MY standards so screw you“ thing. Idk.
Though maybe the issue some people have is with not being able to change your mind? So it’s (potentially misplaced) concern for the well-being of the person, in that regard, maybe.
But also, if someone‘s treating plastic surgery like they go shopping for the newest clothes, that’s…maybe a bit questionable? Especially since those trends change just as much as clothes. See: how a few years ago those really big lips were a super trendy beauty thing but now aren’t really anymore. Chasing trends just isn’t stood idea in general imo. Also that’s just bound to lead to health issues after a while right? Then again, underlying issues and such.
Idk, it ain’t for me but if the person‘s happy and not compromising their health (or wallet, etc.) in any way, i don’t really see much of a problem with it? Idk. After all, the problem isn’t the surgery, it’s what leads people to take that as the option instead of anything else. (Also, the medical side of plastic surgery. That one’s, again, pretty nifty)
#another anon ask#lots of idk‘s here#but Genuinely. idk XD#wanted to make these answers shorter but they ended up longer oof#I‘m sorry anon
0 notes
Text
Weekly Top Picks: 5 stocks with consistent score improvement and upside potential of up to 41%
In addition to these scores, the report also contains trend analysis, peer analysis and mean analysts’ recommendations to help an investor make better & informed investment decisions.
Synopsis
While NIFTY stays in volatile mode and fear of correction grips the street. There are still some pockets where stocks have seen an improvement in their analyst scores. The selected stocks depict a strong…

View On WordPress
0 notes
Text
Indian Stock Market Weekly Roundup (5 - 9 Dec) - Techstory
Indian Stock Market Weekly Roundup (5 – 9 Dec) – Techstory
Yes, add me to your mailing list Indian stock market witnessed a reversal trend in the past week as both Sensex and Nifty 50 closed trading in the red.The market started the week with losses on Monday as various big-player stocks suffered a decline in value. Even though the Nifty 50 was able to end the day with a slight increase in index value, Sensex settled lower than previous closing…

View On WordPress
0 notes
Text
Stocks to buy: Axis Bank, Dr Lal Pathlabs among top four stock picks by SMC Global Securities for this week
Indian stock market benchmarks consolidated for the second consecutive session on Tuesday, June 11, amid weak global cues.Despite opening higher and trading in positive territory for a significant part of the session, equity benchmarks—Sensex and Nifty 50—ended flat on profit booking in the absence of fresh triggers. Sensex hit its intraday high of 76,860.53, but prey to profit booking in the fag-end and ended 33 points, or 0.04 per cent, lower at 76,456.59. Nifty 50 opened at 23,283.75 against its previous close of 23,259.20 and touched its intraday high of 23,389.45. The index settled 6 points, or 0.02 per cent, up at 23,264.85.
Axis Bank: Current Market Price (CMP): ₹1,193.85; Target Price: ₹1,376 Upside: 16 per cent
Axis Bank reported a net profit of ₹7,130 crore in the January-March quarter results for fiscal 2023-24 (Q4FY24), compared to a loss of ₹5,728.4 crore in the corresponding period last year. The private sector lender's net interest income (NII)-the difference between interest earned and paid-rose 11.5 per cent year-on-year (YoY) to ₹13,089 crore, compared to ₹11,742 crore in the year-ago period.
Zydus Lifesciences CMP: ₹1,058.45; Target Price: ₹1,273; Upside: 20 per cent
Zydus Lifesciences' revenue rose 10 per cent to ₹5,533.8 crore in Q4FY24. The EBITDA for the quarter was Rs. 1,630.5 crore, up 30 per cent YoY. EBITDA margin for the quarter stood at 29.5 per cent, an improvement of 440 bps on a YoY basis. The net profit for the quarter was Rs. 1,182.3 crore, up 299 per cent YoY. In FY25, the management expects high teens growth and maintain EBITDA margins of 27.5 per cent.
3.Dr Lal Pathlabs Ltd
The 200 days exponential moving average (DEMA) of the stock on the daily chart is currently at 2,401. On the weekly chart, the stock rebounded after breaching its 200-day exponential moving average (EMA) and is now trading above this key indicator. It has also broken through a trend line resistance and is sustaining above it, indicating strong upward momentum.
4.Oberoi Realty
The 200 days DEMA of the stock on the daily chart is currently at 1,392. On the weekly chart, the stock has formed a pattern of higher highs and higher lows, indicating an uptrend. It consistently trades above its 200-day EMA, supporting this positive trend.
0 notes
Text
Market Outlook: Nifty 50 Set for Weekly Gain with IT and Pharma Stocks Boosting Domestic Demand
#Delhivery #domesticdemand #ITstocks #JSWInfra #Nifty50 #NiftyBank #NiftyMidcap100 #pharmastocks #ShriramTransportFinance #SJVN #weeklygain
#Business#Delhivery#domesticdemand#ITstocks#JSWInfra#Nifty50#NiftyBank#NiftyMidcap100#pharmastocks#ShriramTransportFinance#SJVN#weeklygain
0 notes
Text
Indian Stock Market Weekly Roundup (5 - 9 Dec)
Indian Stock Market Weekly Roundup (5 – 9 Dec)
The Indian stock market witnessed a reverse trend last week as both the Sensex and Nifty 50 closed in the red.
The market started the week with losses on Monday as the share prices of various big-players declined. While the Nifty 50 index managed to end the day with a marginal rise in value, the Sensex settled lower than the previous closing levels.
Heavy selling pressure pushed down stock values…

View On WordPress
0 notes
Link
#BankNifty#Candlestickchart#NationalStockExchange#NationalStockExchangeofIndia#Nifty#Nifty50#Nifty50analysis#NiftyBank#optionchainanalysis#pivotpoint#stockmarket#StockTrading#Supportandresistancelevels#technicalanalysis#tradingstrategies#weeklyanalysis#WeeklyAnalysisofBankNiftyandNifty50
0 notes
Text
Gann Trading Course
Firstly, We See Who’s Wd Gann.
W. D. Gann Was One of The Most Industrious Technical Analysts Who Made Thousands of Charts Displaying Daily, Weekly, Monthly, And Yearly Prices for A Good Variety of Stocks and Commodities. W. D. Gann Was Certainly Among the More Successful. Creating And Publicizing a Replacement Approach to Analysing Markets, Gann Claimed That He Had Set a Record in Leverage and Accuracy More Than Once and That He Had Developed Trading Strategies for Speculators, Which He Could Predict Market Moves to Exact Price Levels. Gann Was All About the Trend, Support, Resistance, And A Target. First, He Identified the Trend, Then He Found Prices That Would Accelerate the Move in The Direction of The Trend and A Price That Would Change the Trend.
Requirements Of Doing This Course
• Basic Understanding of Forex or Stock Trading.
• Willingness To Find Out
• An Open Mind
• You Will Need a Practice Trading Account
Who This Course Is For:
• You Shouldn’t Take This Course If You Aren't Willing to Dedicate Some Time and Discipline to Learning the Strategy
• Anyone Willing to Find Out, The Way to Trade.

Gann Square Trading
Gann Square Trading Is the Most Talked About Tool in Trading Amongst the Most Popular Technical Day Trading or Long-Term Trading Tools in The World. Gann Square May Be a Form of Technical Analysis Based on The Idea That the Market Is Geometric and Cyclical in Nature. The Tool Is Comprised of Multiple Diagonal/Vertical/Trend and Arc Lines That Facilitate Your Trading. We'll Explain It Thoroughly Through Live Trades. However, We'd Like Your Complete Attention, Otherwise, You Won’t Know It.
Learn How to Draw Gann Square Yourself and Be Equipped With An Advanced Trading (Technical Analysis) Tool That Is Used by Professional Traders. Gann Square Tool May Be a Tool That Is Formed by Merging Gann Box, Arc's, And Trend Lines. Through Them and Therefore the Strategy That Advance Traders Follow; You Will Learn a New Advanced Skill That Is Known by Very Few.
I Will Help You Understand How to Merge The Gann Square Tool With Your Existing Strategy Or Indicator. This Gann Square Technical Analysis Course Comes With A Guarantee That You Simply Can Always Apply for A 100% Refund Within 30 Days.
I Will Teach You the Gann Square Trading Strategy Which Is a Complex Support and Resistance Trading Strategy That Uses Diagonal Support and Resistance Levels. Lines Of Gann Square Are Built at Different Angles from A Crucial Base or Peak at The Price Chart. These Important Angles Help in Trading Through Advance Mathematic Angles.
The Only Tactical Technical Analysis Gann Square Strategy Course: Setup One High-Profitable Trade After Another. Technical Analysis Trading May Be a Form of Advance Forex or stock trading classes in Which Individuals Buy and Sell Shares Over a Single Day's Trading or Long-Term Trading, to take advantage of Small Price Fluctuations.
Something More About Gann Levels Trading
Gann Levels Trading May Be a Famous Concept Of Trading In Indian Stocks And Indices. Here During This Course, We’ve Provided a Free Trading View Indicator of the Gann Level with That Spot V Wap Indicator. This Course Is Bounded by Rules from Entry to Exit. It Creates a Correct Mind Set in You For Trading With This Gann Level Indicator.
The Course Contains a High Probability Trading Setup, Especially Trading in Nifty & Bank Nifty. This Causes You to Perfect Trade Execution Which Will Lead to Consistency in Trading and In the End the Way to Profits.
Trading Is Predicated 60% On Trading Psychology Which New and Novice Traders Neglect. The Course Will Give Lessons on Trading Psychology While Learning Strategy. Trading Psychology Will Facilitate You to Hold Profitable Positions and Square Off Losing One. Before That, You’ll Learn to Only Take High-Probability Trades.
We Have Provided Ample Live Trading Examples So That You Will Have an Analysis That How Exactly and Where to Exactly Place the Trade with That Knowledge of Entry at the Right Time and At the Right Candlestick. Execution Of Trade Is Vital Which Gives Us the Sense of Our Risk Going to Be in That Particular Trade. Learn From Basics to Advance What's Important best stock market course in india, Trading Is Difficult If You Create It Complicated. We Made Trading Simple for You with Gann Level Trading Setup, Practice It! And Begin Your Journey.

Major Levels of Gann
The Major Gann Levels Study Is Designed for Gann Theory Implementation Based on Numerical Relationships Between Past High and Low Prices and Cyclical Patterns in Time. Gann’s Theory Distinguishes Four Major Levels of Support: G1, G2, G3, And G4. G1 Is the Level Of 50% Retracement from The All-Time High, Which Could Be Indicative of Future Upward Movement Renewal. If That Does Not Hold, Search for The G2 Level Which Is the Midpoint Between the All-Time High and All-Time Low. Renewal Failure at G2 Suggests Trying to Find G3 Which Is A 75% Retracement from The All-Time High. If All Three Levels Did Not Indicate Support, It'd Occur at G4 Which Is Calculated as A Quarter of The All-Time High-Low Range Added to The All-Time Low.
•G1 The G1 Gann Level; 50% Retracement from The All-Time High to Zero.
•G2 The G2 Gann Level; 50% Retracement from The All-Time High to Rock Bottom.
•G3 The G3 Gann Level; 75% Retracement from The All-Time High to Zero.
•G4 The G4 Gann Level; 75% Retracement from The All-Time High to Rock Bottom.
#best stock market course in India#crypto trading classes online#online share trading#share market free course#Trading classes price#trading crypto classes
0 notes