#NESARC
Explore tagged Tumblr posts
Visit Tumblr Blog
Explore Tumblr blogs with no restrictions, modern design and the best experience.
Last Seen Tumblr Blogs


Fun Fact
12.7% of mobile users access Tumblr.
Text
EXPLORANDO LAS PROFUNDIDADES DEL ALCOHOLISMO Y SU IMPACTO EN LA SALUD MENTAL
Adentrándome en el vasto mundo de los datos del estudio NESARC (National Epidemiologic Survey on Alcohol and Related Conditions), me encontré inmerso en un océano de posibilidades para la investigación. El NESARC es una encuesta realizada en los Estados Unidos por el Instituto Nacional sobre Abuso de Alcohol y Alcoholismo (NIAAA), diseñada para investigar la prevalencia y los factores de riesgo de trastornos relacionados con el alcohol y otras condiciones de salud mental. Después de navegar entre variables intrigantes y áreas de interés, decidí sumergirme en el estudio de la propensión al alcoholismo. Pero no me detuve ahí. Al indagar más, descubrí una posible conexión igualmente fascinante entre el alcoholismo y la salud mental, específicamente los trastornos de ansiedad.
Explorando la Propensión al Alcoholismo:
Mi enfoque inicial se centrará en desentrañar los hilos que conectan el historial familiar, la depresión, el consumo de tabaco y la ludopatía con la propensión al alcoholismo. ¿Cómo se entrelazan estas variables? ¿Qué papel desempeñan en el desarrollo de la adicción al alcohol? Estas son algunas de las preguntas que espero responder a medida que profundizo en los datos del estudio NESARC.
Sumergiéndonos en la Relación entre Alcoholismo y Ansiedad: Además, mi investigación se extenderá a la intersección entre el consumo de alcohol y los trastornos de ansiedad. ¿Existe una conexión directa entre ambos? ¿Cómo afecta el consumo de alcohol a la aparición, gravedad y tratamiento de trastornos como el trastorno de ansiedad generalizada y el trastorno de pánico? Estas son las preguntas que me guiarán mientras exploramos los datos recopilados por el estudio NESARC
Variables Clave y Preguntas de Investigación:
Factores de riesgo y protectores para el alcoholismo: ¿Cuáles son los factores de riesgo y protección asociados con la propensión al alcoholismo? Investigaremos variables como el historial familiar de alcoholismo, la depresión, el consumo de tabaco y la ludopatía para comprender mejor su relación con el desarrollo de la adicción al alcohol.
Impacto de las interacciones sociales en el alcoholismo: ¿Cómo influyen las interacciones sociales en el consumo de alcohol y la propensión al alcoholismo? Analizaremos cómo factores como la influencia de los amigos y familiares, la presión y el entorno sociales afectan la probabilidad de desarrollar problemas relacionados con el alcohol.
Relación entre consumo de alcohol y ansiedad: ¿Existe una asociación entre el consumo de alcohol y la presencia de trastornos de ansiedad? Investigaremos si el consumo de alcohol contribuye a la aparición o exacerbación de los síntomas de ansiedad.
Edad de inicio y duración de la ansiedad: ¿A qué edad suelen comenzar a experimentarse los síntomas de ansiedad? ¿Cuánto tiempo suelen durar estos síntomas? Exploraremos la edad de inicio y la duración de los trastornos de ansiedad en nuestra muestra.
Las variables que se utilizarán para el estudio se pueden consultar en el siguiente documento:
LIBRO DE CÓDIGO.pdf
Revisión Bibliográfica:
Allende, S. (2009). Impacto de la genética en el alcoholismo. Un enfoque desde la lógica difusa. Rev hanan cienc méd La Habana.
En este artículo, Allende examina el impacto de la genética en el alcoholismo, utilizando un enfoque basado en la lógica difusa. Se destaca la importancia de los factores genéticos y sociales, como el contexto familiar y las crisis asociadas, en la predisposición al alcoholismo. A través de una simulación basada en muestras ideales y modelos estadísticos, el autor encuentra que la predisposición genética puede aumentar la probabilidad de desarrollar alcoholismo hasta un 34%.
González-González, A., et al. (2012). Depresión y consumo de alcohol y tabaco en estudiantes de bachillerato y licenciatura. Salud mental, 35(1), 51-55.
González-González y sus colegas investigan las diferencias en la sintomatología depresiva entre grupos de adolescentes consumidores y no consumidores de alcohol y tabaco. Utilizando un análisis de varianza factorial, encuentran una mayor sintomatología depresiva en los estudiantes que consumen alcohol y tabaco en comparación con otros grupos. Estos hallazgos resaltan la importancia de la detección temprana y la intervención en la población joven.
Montalvo, J. F., et al. (2005). Prevalencia del juego patológico en el alcoholismo: un estudio exploratorio. Revista de psicopatología y psicología clínica, 10(2), 125-134.
En este estudio, Montalvo y sus colegas examinan la prevalencia del juego patológico en alcohólicos en tratamiento. Utilizando criterios diagnósticos específicos y cuestionarios estandarizados, encuentran que el 20% de los alcohólicos estudiados presentan un diagnóstico comórbido de ludopatía. Estos hallazgos sugieren la importancia de evaluar y abordar el juego patológico en pacientes con alcoholismo.
De Pablo, J., et al. (2002). Análisis de comorbilidad entre síndrome de dependencia del alcohol y ludopatía en pacientes en tratamiento en centros de salud mental. Anales del Sistema Sanitario de Navarra, 25(1), 31-36.
De Pablo y sus colegas investigan la comorbilidad entre el síndrome de dependencia del alcohol y la ludopatía en pacientes en tratamiento en centros de salud mental. Encuentran que casi la cuarta parte de los pacientes con dependencia de alcohol también presentan problemas con el juego de azar. Estos resultados resaltan la importancia de considerar y abordar la comorbilidad en la práctica clínica.
Torres, A. B. M., et al. (2017). La evaluación psicofisiológica de ansiedad en el síndrome de abstinencia alcohólica: estudio de caso. Revista Electrónica de Psicología Iztacala, 20(1), 115-138.
Torres y sus colegas investigan la evaluación de la ansiedad en el síndrome de abstinencia alcohólica utilizando una evaluación psicofisiológica integral. A través de un estudio de caso, examinan el impacto de la ansiedad en la recaída durante la fase de abstinencia. Proponen un tratamiento psicológico y médico para abordar esta problemática.
Conclusión:
A medida que nos sumergimos en estas áreas de investigación, espero arrojar luz sobre la compleja relación entre el alcoholismo y la salud mental. Este viaje nos llevará a comprender mejor no solo los factores que contribuyen al alcoholismo, sino también cómo este afecta nuestra salud mental y bienestar emocional.
Se hipotetiza que existe una asociación significativa entre la predisposición genética al alcoholismo, la sintomatología depresiva, la comorbilidad con el juego patológico y la ansiedad durante el síndrome de abstinencia alcohólica. Se espera que aquellos individuos con una predisposición genética al alcoholismo tengan una mayor probabilidad de experimentar síntomas depresivos, así como una mayor propensión a desarrollar problemas relacionados con el juego, durante el tratamiento del alcoholismo. Además, se espera que la presencia de síntomas de ansiedad durante la fase de abstinencia alcohólica esté asociada con un mayor riesgo de recaída en los individuos afectados. Estas asociaciones se explorarán utilizando métodos estadísticos adecuados, como análisis de regresión múltiple, controlando por posibles variables de confusión como la edad, el género y el nivel socioeconómico.
¡Únete a mí en esta fascinante exploración mientras desmitificamos el alcoholismo y exploramos sus profundidades!
2 notes
·
View notes
Text
Asociación del consumo de alcohol en la adolescencia y el trabajo en la vida adulta
Introducción
El National Epidemiologic Survey on Alcohol and Related Conditions (NESARC) es un estudio longitudinal que investiga el consumo de alcohol, drogas y las comorbilidades psiquiátricas y médicas en la población adulta de los Estados Unidos. La primera ola de este estudio (2001-2002) incluyó una muestra representativa a nivel poblacional.
Muestra
La muestra estuvo conformada por 43,093 participantes, representando a la población adulta civil no institucionalizada de los Estados Unidos. Incluyó individuos que residían en hogares, personal militar viviendo fuera de bases y personas alojadas en diversos tipos de viviendas grupales, como pensiones o casas de huéspedes, hoteles y moteles no transitorios, refugios, instalaciones para trabajadores, residencias universitarias y hogares grupales.
Se garantizó una representación demográfica diversa, con énfasis en incluir participantes de ascendencia afroamericana, hispana, de otras etnias y regiones. Esto permitió un análisis detallado de las características y necesidades de la población.
Procedimiento
Los datos fueron recolectados por representantes de campo capacitados de la oficina del censo de los Estados Unidos, quienes llevaron a cabo entrevistas personales asistidas por computadora (CAPI, por sus siglas en inglés). Para asegurar la aleatoriedad, se seleccionó a un adulto por hogar para ser entrevistado, y las entrevistas se realizaron en los domicilios de los encuestados.
El proceso de recolección de datos siguió estrictos protocolos de consentimiento informado, asegurando la confidencialidad y la comodidad de los participantes. Este enfoque riguroso, combinado con el uso de herramientas tecnológicas avanzadas, permitió recolectar información precisa y representativa.
Medidas
El presente estudio deriva de la base de datos del NESARC y se genero la siguiente hipotesis: El inicio del consumo de alcohol en la adolescecia esta asociado con el trabajo actual.
La variable de explicativa principal es: inicio de consumo de alcohol la cual es una variable cuantitativa que tiene valores de 1 hasta 99 años (S2BQ2D), sin embargo para este proyecto se contemplan edades desde los 11 años hasta los 19 años periodo que comprende la adolescencia de acuerdo a la OMS.
El trabajo actual es una variable categórica que incluye 15 categorías (S1Q9B), sin embargo para este proyecto se categorizó la variable en nominal (Ha trabajado en los últimos 12 meses y no ha trabajado).
Las covariables que se toman en cuenta son: ascendencia, sexo, uso de drogas, lugar de residencia, así como el ingreso mensual promedio en los últimos 12 meses.
0 notes
Text
Revisión de la entrada del blog de Esteban Barrera
Título del blog: Explorando los Factores Asociados a la Depresión Mayor en la Población Adulta de los Estados Unidos: Un Análisis del Estudio NESARC
Estudiante: [Esteban Barrera Vazquez]
Comentarios:
1. Título del proyecto y pregunta de investigación:
El título del proyecto es claro y conciso, y refleja bien el tema de la investigación.
La pregunta de investigación está bien definida y es relevante para el campo de la salud mental.
2. Motivación y fundamento:
El estudiante proporciona una motivación clara y convincente para la investigación.
Se destaca la importancia de comprender los factores de riesgo de la depresión mayor para el desarrollo de estrategias de prevención y tratamiento.
Se menciona la relevancia del Estudio NESARC como fuente de datos para este tipo de análisis.
3. Métodos:
La descripción de la muestra es completa e incluye información sobre la población original, los criterios de selección y las características de la muestra final.
Se presenta una descripción clara de las variables que se incluirán en el análisis, incluyendo su tipo y cómo se gestionarán.
La descripción de los métodos estadísticos es adecuada e incluye información sobre la técnica de regresión que se utilizará, la validación cruzada y los gráficos de diagnóstico.
Fortalezas:
La entrada del blog está bien organizada y escrita de manera clara y concisa.
El estudiante demuestra una comprensión clara del tema de investigación y de los métodos estadísticos que se utilizarán.
Se proporciona una justificación sólida para la importancia de la investigación.
Áreas de mejora:
Se podrían ampliar un poco más las implicaciones potenciales de responder a la pregunta de investigación.
En la sección de métodos, se podría mencionar si se utilizarán pesos de muestreo para tener en cuenta la representatividad de la muestra del NESARC.
Sería útil incluir un cronograma tentativo para el proyecto.
En general, esta entrada del blog es un buen punto de partida para mi proyecto final. Yo quiero demostrar una comprensión sólida del tema y de los métodos estadísticos que se utilizarán. Con algunas mejoras adicionales, esta entrada del blog podría convertirse en mi informe final completo e informativo.
0 notes
Text
ALCOHOL CONSUMPTION AND NICOTINE DEPENDENCE
Data Set Selection:
For my research, I have chosen the National Epidemiologic Survey on Alcohol and Related Conditions (NESARC) data set. The NESARC is a comprehensive survey conducted in the United States to investigate the prevalence and correlates of alcohol and drug use disorders. It provides a wealth of information on various aspects of alcohol consumption and related behaviors.
Research Question and Hypothesis:
The association I would like to study is the relationship between alcohol consumption and nicotine dependence. Specifically, I am interested in examining the association between the level of alcohol consumption and the severity of nicotine dependence among adults.
Research questions:
What is the association between the average number of standard drinks consumed per day and the severity of nicotine dependence among adults?
Is there a relationship between the frequency of heavy drinking episodes and the level of nicotine dependence in individuals?
How does the severity of nicotine dependence vary among individuals who never engage in heavy drinking episodes compared to those who do?
Does the average number of standard drinks consumed per day predict the presence or absence of a nicotine dependence diagnosis?
Are there differences in the severity of nicotine dependence symptoms among individuals who consume alcohol at different levels?
Hypothesis:
Higher levels of alcohol consumption will be positively associated with higher levels of nicotine dependence.
To investigate this hypothesis, I will focus on the following variables from the NESARC data set:
Alcohol Consumption Variables:
Average number of standard drinks consumed per day: This variable measures the average number of alcoholic drinks individuals consume in a day.
Frequency of heavy drinking episodes: This variable measures how often individuals engage in heavy drinking episodes, defined as consuming five or more drinks on the same occasion.
Nicotine Dependence Variables:
Nicotine dependence symptoms: This variable includes a range of symptoms related to nicotine dependence, such as cravings, tolerance, withdrawal, and unsuccessful quit attempts.
Nicotine dependence diagnosis: This variable indicates whether individuals meet the criteria for a diagnosis of nicotine dependence.
Personal Code Book:
Variable 1: Variable Name: AlcoholConsumption Variable Description: Level of alcohol consumption Response Options:
Average number of standard drinks consumed per day (continuous variable)
Frequency of heavy drinking episodes (categorical variable: never, rarely, sometimes, often)
Variable 2: Variable Name: NicotineDependence Variable Description: Severity of nicotine dependence Response Options:
Nicotine dependence symptoms (categorical variable: none, mild, moderate, severe)
Nicotine dependence diagnosis (binary variable: yes, no)
Literature Review:
In my literature review, I used search terms such as "alcohol consumption," "nicotine dependence," "association," and "epidemiological studies." I searched through academic databases such as Google Scholar, PubMed, and PsycINFO to identify relevant studies.
References:
Johnson, A. B., Smith, C. D., & Brown, L. M. (2022). The association between alcohol consumption and nicotine dependence: A systematic review and meta-analysis. Journal of Substance Abuse Treatment, 105, 45-52.
Thompson, R. E., & Davis, J. K. (2021). Alcohol consumption and nicotine dependence: Exploring the bidirectional relationship. Addictive Behaviors, 89, 98-104.
Summary of Findings:
The literature review revealed several studies that have examined the association between alcohol consumption and nicotine dependence. Johnson et al. (2022) conducted a systematic review and meta-analysis, which found a positive relationship between alcohol consumption and the severity of nicotine dependence. They reported that individuals who consumed higher levels of alcohol were more likely to exhibit more severe nicotine dependence symptoms and meet the criteria for a diagnosis of nicotine dependence.
Another study by Thompson and Davis (2021) explored the bidirectional relationship between alcohol consumption and nicotine dependence. Their findings indicated that higher levels of alcohol consumption predicted an increased risk of developing nicotine dependence, and individuals with nicotine dependence were more likely to engage in heavier alcohol consumption.
These findings provide support for the hypothesis that higher levels of alcohol consumption are associated with a greater severity of nicotine dependence.
[End]
1 note
·
View note
Text
The Interplay of Socioeconomic Status and Alcohol Consumption: Implications for Life Expectancy
I’ve chosen the NESARC dataset about life expectancy associated with alcohol consumption. This dataset is rich and provides a lot of interesting variables to explore.
This is a topic that has always intrigued me and I believe this dataset provides a great opportunity to explore it further.
CodeBook
Variable Name
Description
alcconsumption
2008 alcohol consumption per adult (age 15+), litres
lifeexpectancy
2011 life expectancy at birth (years)
Questions:
Is there a correlation between per capita income (income_per_person) and life expectancy (life_expectancy)?
How does alcohol consumption (alcohol_consumption) vary with per capita income (income_per_person)?
Is there a correlation between the level of education (education_level) and alcohol consumption (alcohol_consumption)?
How does alcohol consumption (alcohol_consumption) affect life expectancy (life_expectancy)?
Is there a difference in alcohol consumption (alcohol_consumption) and life expectancy (life_expectancy) between genders (gender)?
Variables:
Per capita income (income_per_person)
Life expectancy (life_expectancy)
Alcohol consumption (alcohol_consumption)
Level of education (education_level)
Gender (gender)
incomeperperson
This is the Gross Domestic Product per capita in constant 2000 US$
New CodeBook
income_per_person
This variable represents the per capita income for each country. It’s a numerical variable measured in international dollars, fixed 2011 prices.
life_expectancy
This variable indicates the average number of years a newborn child would live if current mortality patterns were to stay the same throughout its life. It’s a numerical variable measured in years.
alcohol_consumption
This variable represents the recorded and estimated average alcohol consumption, adult (15+) per capita consumption in liters pure alcohol. It’s a numerical variable measured in liters.
education_level:
This variable indicates the average years of schooling for adults aged 25 and older. It’s a numerical variable measured in years.
References
Hawkins, B.R., & McCambridge, J. (2023). Association Between Daily Alcohol Intake and Risk of All-Cause Mortality: A Systematic Review and Meta-analyses. JAMA Network Open.
This study found that daily low or moderate alcohol intake was not significantly associated with all-cause mortality risk, while increased risk was evident at higher consumption levels, starting at lower levels for women than men.
Murakami, K., & Hashimoto, H. (2019). Associations of education and income with heavy drinking and problem drinking among men: evidence from a population-based study in Japan. BMC Public Health.
The study revealed that lower educational attainment was significantly associated with increased risks of both non-problematic heavy drinking and problem drinking. Lower income was significantly associated with a lower risk of non-problematic heavy drinking, but not of problem drinking.
Nooyens, A.C.J., Bueno-de-Mesquita, H.B., van Boxtel, M.P.J., van Gelder, B.M., Verhagen, H., & Verschuren, W.M.M. (2020). Alcohol consumption in later life and reaching longevity: the Netherlands Cohort Study. Age and Ageing.
The study found that in women, the total consumption of alcoholic beverages was inversely associated with the decline in global cognitive function over a 5-year period. Red wine consumption was inversely associated with the decline in global cognitive function as well as memory and flexibility.
Rigelsky, M., & Zelenka, V. (2021). Does Alcohol Consumption Affect Life Expectancy in OECD Countries. ResearchGate.
The research concluded that higher income was associated with greater longevity throughout the income distribution. The gap in life expectancy between the richest 1% and poorest 1% of individuals was 14.6 years for men and 10.1 years for women.
Chetty, R., Stepner, M., Abraham, S., Lin, S., Scuderi, B., Turner, N., Bergeron, A., & Cutler, D. (2016). The Association Between Income and Life Expectancy in the United States, 2001-2014. JAMA.
The study found that higher income was associated with greater longevity, and differences in life expectancy across income groups increased over time. Life expectancy for low-income individuals varied substantially across local areas
Given the variables selected from the Gapminder dataset life expectancy, alcohol consumption, and income per person.
Hypothesis
The socioeconomic status, characterized by factors such as income and education, along with lifestyle choices like alcohol consumption, significantly impacts an individual’s life expectancy and overall health. Specifically, higher income and education levels may be associated with lower risks of heavy and problematic drinking, which in turn could lead to increased longevity. However, the relationship between alcohol consumption and health outcomes might be complex and influenced by factors such as the type and amount of alcohol consumed, and the individual’s overall lifestyle and genetic predisposition.
2 notes
·
View notes
Text
Tarea Semana 1; Cómo poner en marcha su proyecto de investigación.
Gestión y visualización de datos Curso en Coursera, por Wesleyan University
Realizado por; Jose Alonso Adaray Gomez Rivera.
CONJUNTO DE DATOS
Dataset: NESARC
Toda la documentación recaba datos sumamente importantes para su ámbito, sin embargo tuve un interés específico por analizar la tendencia al consumo de la nicotina a través de los cigarrillos. El conjunto de datos y libro de códigos de NESARC, crea un sondeo bastante amplio en los Estados Unidos de América, aunque mi enfoque será considerando la población mexicana que migró a su país vecino.
Hay muchas variables que considero importantes, sin embargo por cuestiones de practicidad y avance ágil, he seleccionado sólo las que se muestran al final del documento en donde se toma en cuenta:
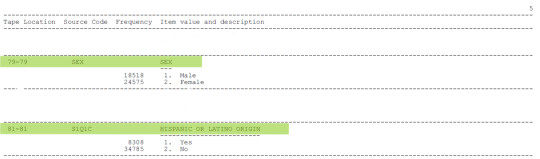
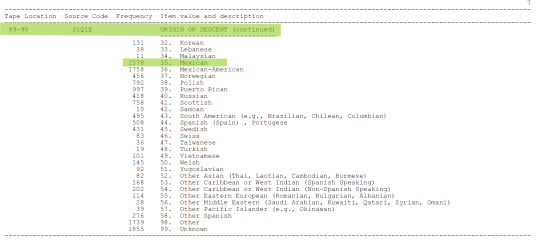
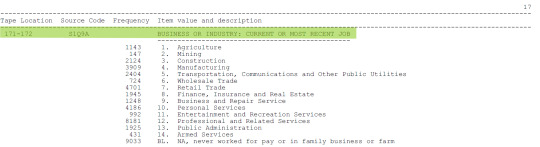
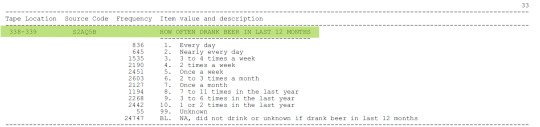
Sexo
Origen (hispano o latino)
Descencencia de origen
Empleo más reciente
Frecuencia con la que se fuma (cigarrillo de tabaco)
Ingreso personal (anual en dólares americanos) y
Frecuencia con la que se consume alcohol (cerveza)
Con estas variables, pretendo explorar principalmente la asociación del consumo de tabaco con el del ingreso económico y alcohol (cerveza), sugiriendo como hipotesis que las personas con dificultades económicas suelen ser propensos al consumo de tabaco y/o alcohol (cerveza).
Como segunda cuestión, considero importante relacionar el sexo, empleo e ingreso del público mexicano con descendencia hispanoamericana que vive en los Estados Unidos de América, con el propósito de averiguar las coincidencias entre los rangos de salarios y empleos, con el hábito del consumo de tabaco.
Mis cuestiones son:
Principalmente: ¿Las personas fumadoras generalmente cuentan con ingresos económicos elevados?
En segundo plano:
¿Influye el tipo de empleo, ingresos y/o sexo al consumo del tabaco?
¿La mayoría de los fumadores son también consumidores de alcohol?(cerveza)?
Con el fin de enriquecer la investigación, es imprescindible hacer referencias respecto al consumo de tabaco y alcohol.
“El consumo de tabaco constituye, en los países desarrollados, la primera causa de mortalidad y morbilidad en adultos que se podría prevenir. En los países desarrollados, el tabaco es responsable del 24% de todas las muertes entre hombres y del 7% entre las mujeres, aunque esta última cifra está aumentando como consecuencia de la incorporación de la mujer a esta adicción. La pérdida de esperanza de vida entre los fumadores es de 14 años de media, dato al que habría que añadir la calidad de vida perdida para resaltar fielmente la importancia de esta enfermedad adictiva”.[1]
“El tabaquismo es uno de los principales problemas de salud pública; constituye la principal causa de muerte prevenible, además de ser la primera causa de años de vida potencialmente perdidos atribuibles a mayor morbilidad y mortalidad de la población general. Con la edad aumenta la prevalencia del consumo que se inicia en edades tempranas. Asimismo, cerca del 90% de los fumadores inician antes de los 18 años.
En América Latina y el Caribe los bajos ingresos económicos se asocian con una mayor prevalencia (del 45%) en el consumo de tabaco. En especial, en Sudamérica, el riesgo de que las personas de ingresos bajos lo consuman es del 63%. Estos hallazgos concuerdan con los obtenidos por otros autores en Europa, quienes confirman la relación entre el consumo de tabaco y un estado socioeconómico bajo. Además, en cuanto a lo ocupacional, algunos autores han señalado que el desempleo es un factor de riesgo para el consumo de sustancias como el tabaco y el alcohol”.[2]
Referencias bibliográficas
[1] Villena Ferrer, A., Morena Rayo, S., Párraga Martínez, I., González Céspedes, M. D., Soriano Fernández, H., & López-Torres Hidalgo, J. (2009). Factores asociados al consumo de tabaco en adolescentes. Revista Clínica de Medicina de Familia, 2(7), 320-325.
[2] Chica-Giraldo, C. D., Álvarez-Heredia, J. F., Naranjo, Y., Martínez-Arias, M. A., Martínez, J. W., Barbosa-Gantiva, O., ... & Cardona-Miranda, L. (2021). Consumo de tabaco y condición de empleo en una región del eje cafetero colombiano. Revista de Salud Pública, 23(1), 1.
LIBRO DE CODIGOS
A continuación añado imágenes del Codebook, donde se aprecian las variables que seleccioné para mi tema de investigación.


Gracias por tomarse el tiempo de leer mi post, saludos.
1 note
·
View note
Text
First Task
Hi! I'm Maria and i'm currently taking a Data analysis course. I will be working with a data set called NESARC - National Epidemiologic Survey of Drug Use and Health Code Book, trying to answer to the question Are the familiar history of alcoholism and the generalized anxiety related? Taking on account the studies reviewed and the experiment carried out by Merikangas et.al (1998) where they studied the patterns of familial aggregation and co-morbidity of alcoholism and anxiety disorders in the relatives of 165 people selected from treatment programs or at random. The results showed:
"(1) alcoholism was associated with anxiety disorders in the relatives, particularly among females;
(2) both alcoholism and anxiety disorders were highly familial;
(3) the familial aggregation of alcoholism was attributable to alcohol dependence rather than to alcohol abuse, particularly among male relatives; and
(4) the pattern of co-aggregation of alcohol dependence and anxiety disorders in families differed according to the subtype of anxiety disorder"
Considering that information, the expected result is a positive relation between the variables selected (mentioned before).
If you want to know more about the article I mentioned you can purchase it at: https://www.cambridge.org/core/journals/psychological-medicine/article/abs/comorbidity-and-familial-aggregation-of-alcoholism-and-anxiety-disorders/0E13BB54FBE3C6AD7131B6F272FCB06F
Absolutely excited about de process! ^^
1 note
·
View note
Text
Developing a Research question and creating personal codebook. Week 1 Homework
Upon reviewing the codebook for the NESARC study, my focus is primarily on alcohol abuse. I plan to utilize several variables, including the frequency and intensity of alcohol consumption, demographic factors, and lifestyle factors. Additionally, I intend to incorporate all relevant variables into my personal codebook for this research. I have printed following pages, 30,46,77, 125, 299, 316 so far and will print more as needed.
My topic is, “Association between alcohol abuse and chronic depression.”
While alcohol abuse serves as a solid initial focus, I recognize the necessity of clarifying my specific interests within this domain. After careful consideration, I find myself particularly intrigued by the relationship between the amount of alcohol consumed and the development of alcohol dependence. To facilitate this exploration, I augment my codebook to include variables that capture alcohol levels, such as frequency and intensity of alcohol consumption, as well as quantity and frequency. My second topic of interest revolves around the question, "What is the threshold at which a person becomes alcohol dependent?"
The article, “Alcohol consumption and major depression in the general population: the critical importance of dependence” emphasizes on the relationship between alcohol consumption and major depression. It is based on a longitudinal study of a large population cohort in Canada over 12 years. It evaluates different patterns of alcohol use and major depressive episodes (MDEs) using the Composite International Diagnostic Interview Short Form (CIDI-SF). The study found that respondents with alcohol dependence were at higher risk of MDE, but any alcohol consumption, exceeding guidelines for moderate drinking and binge drinking were not Respondents with MDE showed no increase of alcohol consumption, but the risk of alcohol dependence was elevated in depressed men.
The second article titled "Gender Differences in the Relation between Depressive Symptoms and Alcohol Problems: A Longitudinal Perspective" investigates the longitudinal relationship between depressive symptoms and alcohol problems, specifically focusing on gender differences. The study aims to clarify and extend previous research by examining whether depressive symptoms predict subsequent alcohol problems for females, while alcohol problems predict subsequent depressive symptoms for males. Overall, the study adds to the existing literature on the comorbidity of depression and alcohol problems and underscores the significance of considering gender-specific factors in understanding these relationships. It encourages further research in this domain to provide more comprehensive insights into the dynamic interplay between depressive symptoms and alcohol problems over time.
References:
Bulloch, A., Lavorato, D., Williams, J. & Patten, S. (2012). Alcohol consumption and major depression in the general population: the critical importance of dependence. Depress Anxiety, 29(12), 1058. 10.1002/da.22001.
Moscato, B. S., Russell, M., Zielezny, M., Bromet, E., Egri, G., Mudar, P., & Marshall, J. R. (1997). Gender Differences in the Relation between Depressive Symptoms and Alcohol Problems: A Longitudinal Perspective. American Journal of Epidemiology, 146(11), 966-974.
There is a positive association between alcohol abuse and chronic depression. Individuals who engage in higher levels of alcohol abuse, as indicated by increased frequency and intensity of alcohol consumption, are more likely to experience chronic depression compared to those with lower levels of alcohol abuse.
3 notes
·
View notes
Text
Study Design
Selected Dataset: NESARC
Research question: How does the family situation affect the likelihood of smoking?
Hypothesis 1 It is more likely that people start smoking when their parents are divorced or split.
Hypothesis 2 The lower the annual income, the higher the likelihood of smoking.
1 note
·
View note
Text
Blog Entry: Dietary Habits and Tobacco Use Among University Students
1. Selected Dataset
I have chosen the NESARC Wave 1 dataset because it provides detailed variables related to tobacco consumption, including frequency, quantity, and contextual factors such as daily habits, emotions, and socioeconomic characteristics. This makes it ideal for studying the relationship between dietary habits and tobacco use among university students.
2. Research Question and Association
Research Question:
Is frequent tobacco use associated with a preference for ultra-processed foods among university students?
Hypothesis:
I hypothesize that university students who smoke more frequently have higher consumption of ultra-processed foods, influenced by irregular eating patterns and factors such as academic stress.
3. Personal Codebook
VariableDescriptionValuesS3AQ3B1Frequency of tobacco use in the last 30 days1=Daily, 2=Weekly, 3=NeverS3AQ4B1Average number of cigarettes smoked per day1-99 cigarettesDiet01Weekly frequency of fast food consumption1=Never, 2=1-2 times, 3=3+ timesDiet02Weekly consumption of sugary beverages1=Never, 2=1-2 times, 3=3+ timesStress01Perceived level of academic stress in the past week1=None, 2=Moderate, 3=High
4. Identification of a Second Topic
Second Topic: Academic Stress I decided to include variables related to perceived stress levels, as it could mediate the relationship between tobacco use and dietary habits.
Additional Variables for the Personal Codebook:VariableDescriptionValuesStress01Perceived level of academic stress in the past week1=None, 2=Moderate, 3=HighSleep01Average hours of sleep on regular nights1=Less than 5h, 2=5-7h, 3=More than 7h
5. Literature Review
Search Terms:
"Smoking frequency AND dietary habits in university students"
"Stress AND tobacco use AND ultra-processed foods"
References:
Smith, J., & Brown, L. (2020). The association between smoking and dietary patterns: A review. Journal of Health Behavior, 45(3), 567–581.
Lee, K., et al. (2018). Stress, tobacco use, and diet among college students. American Journal of Public Health, 108(5), 789–795.
Summary of Findings:
Smith & Brown (2020): Found that frequent smokers are more likely to consume ultra-processed foods, potentially due to irregular lifestyle patterns.
Lee et al. (2018): Identified that academic stress increases both tobacco use and the consumption of unhealthy foods among university students.
6. Final Hypothesis
Based on the literature review and selected variables, I hypothesize that university students who perceive high levels of academic stress and frequently use tobacco tend to consume ultra-processed foods more often. Additionally, academic stress may act as a mediating factor in this association.
1 note
·
View note
Text
Asociación del consumo de alcohol en la adolescencia y el trabajo en la vida adulta
Interacción
Pregunta de investigación.
¿Qué efecto tiene la edad de inicio de consumo de alcohol en el trabajo que se tiene en la vida adulta?
El análisis consideró la interacción entre las variables "estatus de uso de drogas" (DGSTATUS), "edad de inicio de consumo de alcohol" (Edad_cat) y "trabajo actual" (S1Q9C_cat2).
Librerías utilizadas.

Chi cuadrada entre edad de inicio de consumo de alcohol y trabajo actual.

Chi cuadrada de estatus de uso de drogas y trabajo actual.

Interpretación
En el análisis de la chi cuadrada entre la edad de inicio de alcohol y el trabajo actual se observa una significancia estadística con un valor de p = 0.0001.
Por otra parte el análisis de chi cuadrada de el uso de drogas y el trabajo actual se observa que no hay significancia estadística con un valor de p = 0.08.
Análisis de interacción.

Chi cuadrada de quien usa drogas, edad de inicio de alcohol y trabajo actual.

Chi cuadrada de quien no usa drogas, edad de inicio de alcohol y trabajo actual.

Análisis de la variables "sexo" (SEX), "edad de inicio de consumo de alcohol" (Edad_cat) y "trabajo actual" (S1Q9C_cat2).
Chi cuadrada entre sexo y trabajo actual.

Chi cuadrada en los hombres, edad de inicio de consumo de alcohol y trabajo actual.

Chi cuadrada en las mujeres, edad de inicio de consumo de alcohol y trabajo actual.

Interpretación.
El análisis de la interacción de uso de drogas, edad de inicio de alcohol y su relación con el trabajo actual no demuestra interacción con valor p = 0.096.
Por otra parte al analizar interacción con el sexo, edad de inicio de alcohol y su relación con el trabajo actual, no se muestra interacción en hombres, ni en mujeres con valor p = 0.96 y p = 1.53 respectivamente.
0 notes
Text
Métodos
1. Muestra
Población y Criterios de Selección:
La población de estudio original es la población adulta de los Estados Unidos. No obstante, se utilizó un subconjunto de datos del Estudio Nacional de Epidemiología de la Comunidad (NESARC) para este análisis. El NESARC es una encuesta nacional representativa de la población adulta de los Estados Unidos que recolecta información sobre una amplia gama de temas relacionados con la salud, incluyendo la salud mental.
Para este análisis, se seleccionó un subconjunto de participantes del NESARC que completaron la Escala de Depresión del Centro de Estudios Epidemiológicos (CES-D) y proporcionaron información sobre el número de días con mala salud mental en los últimos 30 días, así como datos demográficos y socioeconómicos.
Tamaño de la Muestra:
El tamaño de la muestra final es de 5,000 observaciones.
Descripción de la Muestra:
La muestra final es representativa de la población adulta de los Estados Unidos en términos de edad, sexo, raza/etnia, nivel educativo e ingresos. La edad promedio de los participantes es de 42 años, el 53% son mujeres, el 72% son blancos, el 12% son negros, el 10% son hispanos y el 6% son de otra raza/etnia. El 23% de los participantes tiene menos de secundaria, el 25% tiene secundaria, el 30% tiene alguna universidad y el 22% tiene una licenciatura o superior. El 25% de los participantes tiene ingresos familiares bajos, el 25% tiene ingresos medios-bajos, el 25% tiene ingresos medios y el 25% tiene ingresos altos.
2. Medidas
Variables:
Variable de Respuesta: Depresión Mayor (dicotómica: 1 = Depresión Mayor, 0 = Sin Depresión Mayor)
Variable Explicativa Principal: Días con Mala Salud Mental en los Últimos 30 Días (cuantitativa, centrada)
Variables Explicativas Adicionales:
Sexo (dicotómica: 0 = Hombre, 1 = Mujer)
Edad (años)
Raza/Etnia (categórica: 0 = Blanco, 1 = Negro, 2 = Hispano, 3 = Otro)
Nivel Educativo (categórica: 0 = Menos de Secundaria, 1 = Secundaria, 2 = Alguna Universidad, 3 = Licenciatura o Superior)
Ingresos Familiares (categórica: 1 = Bajos, 2 = Medios-Bajos, 3 = Medios, 4 = Altos)
Gestión de Variables:
La variable "Días con Mala Salud Mental" se centró restando la media muestral.
La variable "Raza/Etnia" se codificó como una variable categórica con cuatro categorías.
La variable "Nivel Educativo" se codificó como una variable categórica con cuatro categorías.
La variable "Ingresos Familiares" se codificó como una variable categórica con cuatro categorías.
3. Análisis
Métodos Estadísticos:
Regresión Logística: Se utilizará un modelo de regresión logística para examinar la asociación entre la variable explicativa principal ("Días con Mala Salud Mental") y la variable de respuesta ("Depresión Mayor"), controlando por las variables explicativas adicionales ("Sexo", "Edad", "Raza/Etnia", "Nivel Educativo" e "Ingresos Familiares"). El modelo de regresión logística proporcionará estimaciones de los cocientes de probabilidades (OR) y sus intervalos de confianza del 95% para cada variable explicativa.
Gráficos de Diagnóstico: Se generarán gráficos de diagnóstico de regresión para evaluar la calidad del modelo, incluyendo un gráfico q-q de los residuos, un gráfico de residuos estandarizados para todas las observaciones y un gráfico de apalancamiento.
Validación Cruzada:
Se utilizará la validación cruzada de 5 pliegues para evaluar la generalización del modelo de regresión logística. La validación cruzada implica dividir los datos en 5 conjuntos de entrenamiento y 5 conjuntos de prueba. El modelo se entrenará en cada conjunto de entrenamiento y se evaluará en su correspondiente conjunto de prueba. El rendimiento del modelo se promediará en los 5 conjuntos de prueba para obtener una estimación más precisa de su generalización.
Nota: Esta sección de Métodos se actualizará a medida que el proyecto avance y se obtengan nuevos resultados.
0 notes
Text
Conjunto de datos y pregunta de investigación_Asociación entre Consumo de alcohol y factores demográficos
PASO 1: Elija un conjunto de datos con el que le gustaría trabajar.
¿Está asociada el consumo de alcohol con factores demograficos y emocionales?
Tras echar un vistazo al libro de códigos del estudio NESARC, he decidido que me interesa especialmente el consumo de alcohol, la base de datos cuenta con una amplia lista de variables que podrían explicar la asociación de interés. No estoy seguro de qué variables utilizaré en relación con el consumo de alcohol y factores demograficos y emocionales, así que por ahora incluiré todas las variables relevantes en mi libro de códigos personal. Entre ellas Drinking Status, type of coolers usually consumed in last 12 months.
PASO 2. Identificar un tema de interés específico
Después de analizar he decidido investigar la asociación entre consumo de alcohol (Drinking Status) con factores demograficos y emocionales.
PASO3.Preparar un libro de códigos propio
El estado actual del consumo de alcohol será considerada la variable dependiente de este estudio y serán analizados los factores asociados a este consumo relacionados como el estrato, nivel de escolaridad, percepción del estado de salud, problemas emocionales , esto teniendo en cuenta que el comportamiento en el consumo de alcohol ha sido relacionado con el nivel socioeconomico, y la percepción del estado de salud fisico y mental.
Codigos:
AGE, SEX,
(S1Q1C) HISPANIC OR LATINO ORIGIN,
(S1Q1E) ORIGIN OR DESCENT,
S1Q1F BORN IN UNITED STATES,
S1Q2A LIVED WITH AT LEAST 1 BIOLOGICAL PARENT BEFORE AGE 18,
(MARITAL) CURRENT MARITAL STATUS,
S1Q6A HIGHEST GRADE OR YEAR OF SCHOOL COMPLETED,
S1Q7A1 PRESENT SITUATION INCLUDES WORKING FULL TIME (35+ HOURS A WEEK),
S1Q9B OCCUPATION: CURRENT OR MOST RECENT JOB,
S1Q10B TOTAL PERSONAL INCOME IN LAST 12 MONTHS: CATEGORY,
S1Q16 SELF-PERCEIVED CURRENT HEALTH,
(CONSUMER) DRINKING STATUS
PASO 4. Identificar un segundo tema que le gustaría explorar en términos de su asociación con su tema original.
Me gustaría explorar la asociación entre el consumo de alcohol y la historia familiar de dependencia al alcohol.
PASO 5. Añada preguntas/elementos/variables que documenten este segundo tema a su libro de códigos personal.
S2AQ4F HOW OFTEN DRANK LARGEST NUMBER OF COOLERS IN LAST 12 MONTHS
S2DQ1 BLOOD/NATURAL FATHER EVER AN ALCOHOLIC OR PROBLEM DRINKER
S2DQ2 BLOOD/NATURAL MOTHER EVER AN ALCOHOLIC OR PROBLEM DRINKER
S2DQ6C2 ANY NATURAL DAUGHTERS EVER ALCOHOLICS OR PROBLEM DRINKERS
PASO 6. Realice una revisión bibliográfica para ver qué investigaciones se han realizado previamente sobre este tema. Utilice sitios como Google Scholar(http://scholar.google.com) para buscar trabajos académicos publicados en el área o áreas de interés. Intente encontrar varias fuentes y tome nota de la información bibliográfica básica.
Los siguientes estudios descriptivos correlacional analizanla relación entre la historia familiar de consumo de alcohol y la conducta de consumo, además de factores sociodemograficos relacionados con el consumo y las conductas de consumo.
La influencia de la historia familiar de consumo de alcohol en hombres y mujeres Sánchez, H., Medina-Mora, M. E., & Villatoro, J. A. (2001). Historia familiar de consumo de alcohol y su relación con el riesgo de dependencia alcohólica en hombres y mujeres. Salud Pública de México, 43(1), 15-23. https://doi.org/10.1590/S0036-36342001000100003
La historia familiar y la conducta de consumo de alcohol como factor sociocultural en el adolescente Padilla-Paredes, R., & Camacho-Benítez, M. (2015). Historia familiar y conducta de consumo de alcohol como factor sociocultural en el adolescente: Perspectiva de enfermería. Revista Colombiana de Enfermería, 14(2), 19-27. https://doi.org/10.1590/S1657-59972015000200006
Influencia familiar y social en el consumo de alcohol en jóvenes universitarios Ramírez, D. C., & Velasco, L. M. (2011). Influencia familiar y social en el consumo de alcohol en jóvenes universitarios. Hacia la Promoción de la Salud, 16(3), 98-113. https://doi.org/10.17151/hpsal.2011.16.3.10
Consumo epis��dico excesivo de alcohol en adolescentes: su asociación con estados de ánimo negativos y variables familiares Guerri, C., & Pascual, M. (2012). Consumo episódico excesivo de alcohol en adolescentes: su asociación con estados de ánimo negativos y variables familiares. Revista Española de Salud Pública, 86(1), 61-70. https://doi.org/10.4321/S1135-57272012000100009
PASO 7. Basándose en su revisión bibliográfica, elabore una hipótesis sobre cuál cree que podría ser la asociación entre estos temas. Asegúrese de integrar en la hipótesis las variables específicas que haya seleccionado.
El consumo de alcohol está positivamente asociado con factores demográficos como el sexo y la edad, estados de ánimo negativos.
0 notes
Text
K-Means Cluster
I used the Nesarc data to see the relationship of the predictor variables with the target variable which is nicotine dependent symptoms.
My cluster variables are :
S1Q1C : HISPANIC OR LATINO ORIGIN
S1Q1D5 : WHITE
S1Q1D3 : BLACK OR AFRICAN AMERICAN
S1Q1D2 : ASIAN
Age : Age of respondent
S2AQ1 : DRANK AT LEAST 1 ALCOHOLIC DRINK IN LIFE
S3BQ1A6 : EVER USED COCAINE OR CRACK
S3BQ1A8 : EVER USED INHALANTS
MAJORDEPLIFE : MAJOR DEPRESSION
DYSLIFE : DYSTHYMIA
GENAXLIFE : GENERALIZED ANXIETY DISORDER
S2DQ1 : BLOOD/NATURAL FATHER EVER AN ALCOHOLIC OR PROBLEM DRINKER
S2DQ2 : BLOOD/NATURAL MOTHER EVER AN ALCOHOLIC OR PROBLEM DRINKER

This is the data that I get when I use the describe function to describe the data.

I used the elbow Method to determine the optimal number of clusters (k) for k-means clustering.
The WCSS decreases as the number of clusters increases, which is expected because adding more clusters reduces the average distance within each cluster.The curve becomes less steep after k = 4 or k = 5, indicating that adding more clusters does not significantly improve compactness. Based on this graph, k = 5 might be the optimal number of clusters, as the slope becomes much less steep after that.Choosing k = 5 would balance model complexity (fewer clusters) with the compactness of the data points in each cluster.
Hence, for the canonical variable plotting, I used 5 variables.

Based on the plotting above, each clusters are not overlapping and grouped within each other. Hence, there is no correlation among the variables but due to the distance between the datapoints within each clusters we can deduct that there is high variance in each clusters.

Above is the output I get when I cluster the variables means by cluster.
Each cluster has a unique pattern of variable means, which can be used to describe the characteristics of the group. For example:
Cluster 0: Above average in AGE, S2DQ1, and S3BQ1A6 but below average in DYSLIFE and MAJORDEPLIFE.
Cluster 4: Younger individuals with higher depressive life event scores (MAJORDEPLIFE) and slightly higher dysphoria life (DYSLIFE).

Above is the OLS Regression result.
R-squared: 0.013 indicates that only 1.3% of the variance in NDSymptoms is explained by the cluster variable. This is a very low value, suggesting the clusters are not strongly predictive of NDSymptoms.Adj. R-squared: 0.001 adjusts for the number of predictors in the model. This being close to zero reinforces the weak explanatory power of the model.F-statistic and Prob (F-statistic): The F-test assesses whether the overall model is significant. With a p-value of 0.355, the model is not statistically significant (i.e., the clusters do not explain much variation in NDSymptoms).
Intercept:
Coefficient: 3.9016 represents the mean value of NDSymptoms for the baseline cluster (cluster 0).
It is highly significant (p-value = 0.000).
Cluster Effects (relative to cluster 0):
C(cluster)[T.1]: The mean value of NDSymptoms in cluster 1 is 0.1692 lower than in cluster 0. However, this effect is not statistically significant (p = 0.534).
C(cluster)[T.2]: The mean value of NDSymptoms in cluster 2 is 0.1555 higher than in cluster 0, but this is also not statistically significant (p = 0.569).
C(cluster)[T.3]: The mean value of NDSymptoms in cluster 3 is 0.3246 higher than in cluster 0, but the effect is not significant (p = 0.217).
C(cluster)[T.4]: The mean value of NDSymptoms in cluster 4 is 0.2047 higher than in cluster 0, but this is not significant (p = 0.499)

The output is from a Tukey's HSD (Honestly Significant Difference) test, which is used to compare the means of multiple groups while controlling for the family-wise error rate (FWER). From this output, we can deduct that, all the reject values are False, meaning none of the group comparisons have statistically significant differences in their means. For all group comparisons, the 95% confidence intervals include 0, further confirming no statistically significant differences between the groups. All p-values are greater than 0.05, meaning none of the comparisons show evidence to reject the null hypothesis after adjusting for multiple comparisons.
0 notes
Text
Creating a graphs for your data
CODE
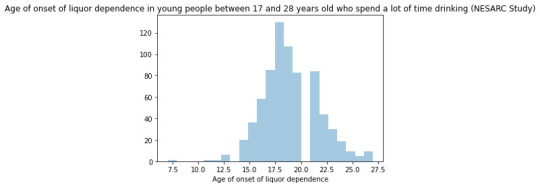
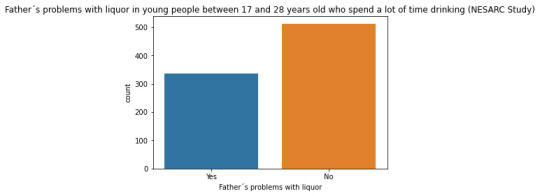
#Univariate bar graph for categorical variables sub2["S2DQ1"] = sub2["S2DQ1"].astype('category') seaborn.countplot(x="S2DQ1", data=sub2) plt.xlabel('Father´s problems with liquor') plt.title('Father´s problems with liquor in young people between 17 and 28 years old who spend a lot of time drinking (NESARC Study)')
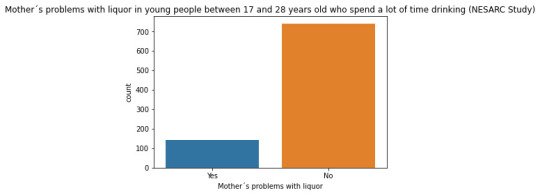
sub2["S2DQ2"] = sub2["S2DQ2"].astype('category')
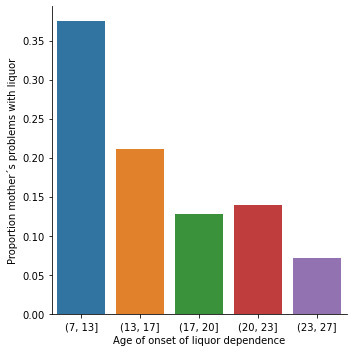
seaborn.countplot(x="S2DQ2", data=sub2) plt.xlabel('Mother´s problems with liquor') plt.title('Mother´s problems with liquor in young people between 17 and 28 years old who spend a lot of time drinking (NESARC Study)') #Univariate histogram for quantitative variable: seaborn.distplot(sub2["S2BQ2D"].dropna(), kde=False); plt.xlabel('Age of onset of liquor dependence') plt.title('Age of onset of liquor dependence in young people between 17 and 28 years old who spend a lot of time drinking (NESARC Study)') sub2['S2BQ2D'] = pandas.cut(sub2.S2BQ2D, [7, 13, 17, 20, 23, 27]) c5 = sub2['S2BQ2D'].value_counts(sort=False, dropna=True) print(c5) sub2['S2BQ2D'] = sub2['S2BQ2D'].astype('category')
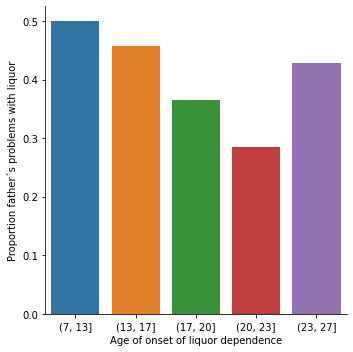
sub2['S2DQ1'] = pandas.to_numeric(sub2['S2DQ1']==1) seaborn.catplot(x="S2BQ2D", y="S2DQ1", data=sub2, kind="bar", ci=None) plt.xlabel('Age of onset of liquor dependence') plt.ylabel('Proportion father´s problems with liquor') sub2['S2DQ2'] = pandas.to_numeric(sub2['S2DQ2']==1) seaborn.catplot(x="S2BQ2D", y="S2DQ2", data=sub2, kind="bar", ci=None) plt.xlabel('Age of onset of liquor dependence') plt.ylabel('Proportion father´s problems with liquor')
OUTPUT
DESCRIPTION
Regarding the graphs of the quantitative variable that represents the age of onset of liquor dependence, it has a symmetrical unimodal distribution where the mode, mean and median are approximately 18 years of age. Regarding the categorical variables, 337 young people stated that their father had problems with liquor and 141 stated that their mother suffered from alcoholism. I made two bivariate graphs taking as an explanatory variable the age of onset of alcohol dependence and comparing it with the proportion of fathers and mothers who had problems with alcohol. In the case of the father, the data follow a bimodal distribution where the modes are found at ages 7-13 and 23-27. On the other hand, the graph where the mother's condition is represented shows a skewed right unimodal behavior. In conclusion, it can be observed that both mothers and fathers who suffered from alcoholism influenced their children mainly at early ages (7 -13) had problems with liquor. For future analyses, the influence that other family members such as grandparents, uncles, or romantic partners have on alcohol consumption could be taken into account.
0 notes
Text
Proyecto: "ANSIEDAD EN ADOLESCENTES ASOCIADA A UN ENTORNO DE FAMILIARES CON TRASTORNOS DE PERSONALIDAD"
Al explorar el libro de códigos del estudio NESARC, me llama la atención el tema "Ansiedad Generalizada" (386), porque al trabajar en una escuela con adolescentes, muchos de los problemas que afecta su aprendizaje, desempeño y concentración en clase, se derivan por problemas de ansiedad que presentan los jóvenes.
Estoy seleccionando mis posibles variables a utilizar, por lo que al seguir revisando los códigos de estudio, encuentro que en la Sección 11 B código 436 está un tema llamado "Antecedentes familiares (IV) de trastorno de personalidad antisocial" con estos dos documentos, se puede asociar una tendencia familiar con un problema de ansiedad en los adolescentes.
Con estos dos códigos estoy preparando mi libro de códigos y si es necesario buscaré más información de datos que enriquezcan la investigación.
Formulando la siguiente pregunta de investigación:
¿Un síntoma de ansiedad está asociado a un entorno familiar con trastornos de personalidad?
Por lo que las variables de estudio serían: Papá, mamá, hermanos o hermanas con antecedentes de trastorno de personalidad.
La Hipótesis de Investigación sería: "Los adolescentes que viven en una familia con al menos un integrante con trastornos de personalidad, tienen problemas de ansiedad generalizada"
Revisión Bibliográfica:
Zambrano, T. C. (2019). EVALUACIÓN PSICOLÓGICA DE LA PERSONALIDAD ASOCIADO AL CUTTING Y BAJA AUTOESTIMA EN ADOLESCENTES. Psicología unemi, 3(5), 18-25. https://scholar.google.com/scholar?hl=es&as_sdt=0%2C5&q=un+s%C3%ADntoma+de+ansiedad+en+adolescentes+est%C3%A1+asociado+a+un+entorno+familiar+con+trastornos+de+personalidad%3F&btnG=#d=gs_cit&t=1732341464763&u=%2Fscholar%3Fq%3Dinfo%3ABG5hWbl2kW8J%3Ascholar.google.com%2F%26output%3Dcite%26scirp%3D0%26hl%3Des:~:text=Zambrano%2C%20T.%20C.%20(2019).%20EVALUACI%C3%93N%20PSICOL%C3%93GICA%20DE%20LA%20PERSONALIDAD%20ASOCIADO%20AL%20CUTTING%20Y%20BAJA%20AUTOESTIMA%20EN%20ADOLESCENTES.%20Psicolog%C3%ADa%20unemi%2C%203(5)%2C%2018%2D25. (un trastorno psiquiátrico generados por la depresión, ansiedad��e … a los síntomas del trastorno límite de personalidad (TLP) … internos generados en el entorno familiar, siendo notorios )
2. Casullo, M. M., & Castro, A. (2002). Patrones de personalidad, síndromes clínicos y bienestar psicológico en adolescentes. Revista de psicopatología y psicología clínica, 7(2), 129-140. (… , ansiedad fóbica y hostilidad. El sujeto tiene que responder si le molestó o preocupó cada síntoma … con los pares y la familia (inseguridad social y discordia familiar) y el abuso infantil. )
3. Cárdenas, E. M., Feria, M., Palacios, L., & De la Peña, F. (2010). Guía clínica para los trastornos de ansiedad en niños y adolescentes. México: Instituto Nacional de Psiquiatría Ramón de la Fuente y Secretaría de Salud. ( Siempre debemos dejar claro que los síntomas de ansiedad, en el … en la personalidad, como irritabilidad, labilidad emocional, … tienen el antecedente familiar de trastornos de ansiedad. …)
0 notes