#Major Sea Ports in Ghana
Text
No colonization Question
A relative of mine was recently speculating rather wildly about what Africa and the Americas would be like if there had been no European contact/ conquest/ colonization or what have you at all. He seemed to think these areas would be fantastically prosperous and advanced and I did not agree based on my understanding of their past history. I was not really very sure how to respond or put this into words. Wanted to ask what your broad strokes take on this would be? No contact Africa/ Americas would mean they would look like what in 2023? Thanks, great blog all around!
Thanks for the nice words.
No contact and no colonization/conquest are two very different things. No contact would mean no diplomatic missions, no trade, no intellectual exchanges, no technology transfer, no defensive agreements, no military alliances, no foreign politicking that spills over into backing rival claimants in territory, etc. I’d argue that no contact in the Americas would be almost impossible - European powers looked for alternative routes to reach the valuable spice trade routes have to go through America at some point. Similarly, Silk Road and spice trade routes will land in East Africa by the Horn by ship, so no contact is also impossible. But let’s ignore what we can. You specified no European contact, so the Arab conquest of Northern Africa still happens and trade cities are established in East Africa. This means that technology transfer still happens in Africa. The Americas, owing to their geographic isolation, are avoided because of some quirk of geography where the European powers are able to secure trade routes to Asia without sailing west. I’m not sure how exactly to go to 2023, since no contact would mean essentially rewriting the 20th century with no United States and making the Cold War wonky, as well as speculating on philosophy arising from these new nations. So this is just a rough draft of civilizations that might rise to be major powers in those areas.
In West Africa, several large empires did arise, like Mali and Songhai. So I would imagine that West Africa would be dominated by the Maghreb in modern-day Morocco and Algeria and further south by the Ashanti Empire in modern day Ghana. They would have relatively sophisticated cultures, military prowess, and especially architecture. Further east, you’d probably have Yoruba states along the Niger Delta which would struggle against Ashanti hegemony, at times being a client state, at times rebelling. In East Africa, you’d probably have a powerful trade kingdom on the Red Sea which would duke it out with expansionism pushing southwards from Ottoman Egypt. Modern-day Somalia and Kenya would probably have city-states and hinterlands, much like our own history they would be powerful trading hubs for ivory and slaves to the Arab world and India. You’d also have city-states further south along the coast, near modern Tanzania. It’d be difficult for a centralized Swahili kingdom to emerge, but if it did, it would be a regional powerhouse that struggled with ethnic differences, much as the East African Federation struggles with today. In South Africa, the Zulu reign supreme as a strong, militarist empire, I don’t see other contenders that could really challenge them, but I’ll admit my knowledge there is limited. Given regular contact with other civilizations and diplomatic ventures, everything from students studying at foreign schools to technology theft, capture in war, and industrial espionage (hey, it worked for Justinian with silkworms), technology is at a rough parity with the civilizations they’re in contact with - especially in capitals and major port cities; there are no Wakandas. My knowledge of sub-Saharan religion is poor, so I’ll let others speculate on how sub-Saharan religions might change in response without having to rely on the mechanics from CK2.
Guns, Germs, and Steel has many flaws, but Diamond is correct in that steel is an incredibly useful metal for civilizational development, both in its utility for warfare and for tool use. Since I understand metallurgy, I’ll primarily be looking at it through that lens. In the Americas, the Andean civilization never developed steelworking, and was typically limited by their terrain (making mobility difficult especially in bulk transport of goods) and lack of high-weight draft animals (llamas only carry around 60 pounds). Plows were very useful in Europe to increase agricultural yield, but don’t really work with terrace farming and no draft animals, so neither agricultural nor transport demands would be a strong driver for metalworking. However, the Andean civilization did have advanced metallurgy in regards to bronze so if the demand for better weaponry and more advanced tools becomes evident, they could develop more advanced bronzemaking techniques due to the very abundant copper in the area. If they start smelting in bulk, then they can start using useful iron from mined ore, and from there, steel. West Mexico similarly had indigenous cultures with advanced metallurgy, primarily for decorative objects like bells. Given that the Mayan Empires fell primarily for reasons of overpopulation, drought, and disease, developing metalworking to improve agricultural yields would be feasible in Mexico, and there are iron and coal resources in the area for a Mesoamerican civilization to develop steel weaponry, so you’d see what we saw in our own history for the Aztecs, a collection of city-states and their hinterlands, perhaps even allying into a sort of Peloponnesian League of sorts in response to external invaders from the north or south.
Further north, in North America, you’d probably have a large civilization building around the Mississippi, and the need for transporting goods over long, vast distances would spur development for boat transport, the lack of draft animals here hurting again. So you’d have a long, narrow civilization, but given how long the Mississippi is, that could be quite vast indeed. In the Northeast, there’s plenty of iron and coal, so if technology transfer of smelting technology happens, the Iroquois Confederacy might turn the area of Pittsburgh into an industrial center just like it was in American history if it extended its control and incorporated the Susquehannock into their people and moved west toward Shawnee territory, but that’s provided they develop the technology to mine and smelt iron and from there alloy out steel. Given the lack of demand to develop these techniques in the most advanced metallurgical civilizations, I don’t think they would develop in technological parity in that regard without major changes from our own history. So metalworking in that regard would be limited mostly to copper, which was mined and used extensively throughout North America.
Thanks for the question, Captain.
SomethingLikeALawyer, Hand of the King
15 notes
·
View notes
Text
Study Suggests At-Risk African Heritage Sites Are Often Overlooked
https://sciencespies.com/history/study-suggests-at-risk-african-heritage-sites-are-often-overlooked/
Study Suggests At-Risk African Heritage Sites Are Often Overlooked

Climate change poses a significant threat to cultural and architectural heritage sites around the world—but the majority of relevant research centers solely on the losses faced by wealthier countries. In 2017, for instance, a study found that just one percent of research on climate change’s effects on heritage focused on iconic landmarks in Africa.
A new survey published in the journal Azania: Archaeological Research in Africa strives to addresses this shortage by highlighting at-risk heritage sites and practices across the African continent.
“Without significant intervention some of Africa’s most important heritage will be lost as a result of the direct and indirect impacts of climate change over the coming decades,” write co-authors Joanne Clarke, Elizabeth Edna Wangui, Grace W. Ngaruiya and Nick Brooks for the Conversation. “… The next ten years will be a critical period in which research agendas can be developed that will have a practical application for the management of African heritage in the face of climate change.”
The group’s paper analyzes a range of case studies from countries in West, East and North Africa. Some—like the wetlands and lagoons of Ghana, Togo, Bénin and Nigeria—represent natural heritage vulnerable to coastal erosion. Their ecosystems are essential for maintaining biodiversity, but storm surges and rising sea levels present a looming threat. Erosion has also severely damaged Guinean coastal forests.

Golden Gate Highlands National Park
(Pavel Špindler via Wikimedia Commons under CC BY 3.0)
In Kenya, the largely human-led destruction of mangrove forests threatens Unesco World Heritage Site Lamu Old Town, which has been continuously inhabited for more than 700 years.
The forests “protect the island from flooding,” Clarke, an archaeologist at the University of East Anglia, tells BBC News’ Pablo Uchoa.
She adds, “[A] lot of what we would call natural heritage is a protection for cultural heritage. And as we destroy the natural heritage, we also leave cultural heritage sites exposed.”
Rising seas also present problems for heritage locations like Mozambique’s Ibo Island, Shanga and Pate islands in Kenya, and the ruins of Kaole in Tanzania, according to the paper. Built less than 33 feet above sea level, these sites’ low elevation and placement atop of coral, sand or mud puts them at risk.
Clarke studies the rate of erosion sparked by rising waters at Sudan’s Suakin Island. Once a bustling port city, Suakin served as a stopping point for 19th-century African slave traders sailing across the Red Sea.
“What we do know is that the Red Sea coast will be impacted in the coming decades, which means what currently survives will be lost [without intervention],” the archaeologist tells BBC News.
Rising sea levels and coastal erosion aren’t the only threats faced by African heritage sites. The team also identifies factors like increasing humidity, which encourages bacteria and algae to grow over rock art, as well as flash floods and more extreme cycles of hot and cold weather. Rock art at Golden Gate Highlands National Park in South Africa, for example, hosts “luxuriant growth” of lichen linked to “intense biodeterioration,” according to a 2012 study.

Suakin Island in Sudan
( J-pics.info via Flickr under CC-BY-NC-SA 2.0)
In Djenné, Mali, the unpredictable climate and reduced rainfall have degraded the quality of mud bricks used to construct the city’s monumental buildings. Locals previously relied on calcified fish bones to make the bricks more resistant to climate extremes, but the area’s fish stocks have become increasingly scarce in recent years.
To maintain Djenné’s mud-brick structures, residents must import materials from farther away, increasing costs and making traditional fixes less readily available. Today, many modern masons make repairs with materials like concrete and clay bricks.
As Clarke tells BBC News, “[C]limate change has the ability to be a threat multiplier [in Djenné].”
“It has indirect impacts which are arguably more serious than the direct impact,” she explains.
Climate change has impacts beyond tangible heritage sites, the researchers write in the paper. Intangible heritage, like traditional ways of life as pastoralists, is also at risk.
“Heritage is often viewed through the lens of what can be seen—for example, disappearing coastlines with their famous archaeological sites—but Africa’s unseen heritage is just as important to preserve, and arguably more vulnerable to a changing climate,” the authors add.
Expanding on this line of thinking in the Conversation, the researchers conclude, “Resetting the research agenda towards a sustainable heritage in the face of climate change will not only enable reengagement with the past, but will help mitigate the impacts of climate change beyond heritage.”
#History
8 notes
·
View notes
Text
Christopher Columbus: Master Double Agent and Portugal’s 007

Henry IV of Spain – known as "The Impotent" for his weakness, both on the throne and (allegedly) in the marriage chamber – died in 1474. A long and inconclusive war of succession ensued, pitting supporters of Henry's 13-year-old heir, Juana de Trastámara, against a faction led by Princess Isabel of Castile and her husband, Ferdinand of Aragon. Portugal, Spain's much smaller antagonist for centuries already, sided with the loyalists.

(Wedding portrait of King Ferdinand II of Aragón and Queen Isabella of Castile.)
The civil war ended in 1480, with the Treaty of Alcáçovas/Toledo, whereby Portugal withdrew support for Juana; in exchange, Isabel and Fernando promised not to encroach on South Atlantic trade routes that Portugal had long been exploring and wished to monopolize.
Treaty Not Worth Much
Spain immediately began to violate the Treaty of Alcáçovas. Portugal's gold trade with Ghana was a powerful enticement, but the Spanish were also lured by the priceless knowledge that Portugal had painstakingly gathered about the currents, territories, winds and heavenly bodies relative to the Atlantic regions. The Portuguese were far advanced in the sciences of geography and navigation pertaining to the Atlantic Ocean, both south and west of Portugal itself.
Meanwhile, João II ascended to the throne of Portugal in 1481, reversing the policies of his father, another weak, late-Medieval ruler who'd surrendered excessive estates and privileges to the nobility. Large swaths of the noble class rebelled, but João II was an astute diplomat, with powerful alliances among the military and religious orders across Europe, along with an extensive network of spies. He sprang a trap on his adversaries, capturing and executing the ring leader.

(João II of Portugal)
Conspiracy!
Queen Isabel supported the traitors in Portugal, having obtained their promise to annul the Treaty of Alcáçovas. When the conspiracy was exposed, numerous traitors among the Portuguese nobility fled to Spain, where they found asylum, along with a base from which to continue their hostilities against João II. Prominent among the defectors were two nephews of the highly-born wife of Christopher Columbus – who would himself sacrifice the next twenty years of his life to join this exodus, faking desertion to his sovereign's most bitter foe. The internecine strife was so keen that after another occasion when his agents had tipped him off, which resulted in João II personally executing the Duke of Viseu, he threatened to charge his own wife with treason for weeping over her brother.

(Christopher Columbus was arrested at Santo Domingo in 1500 by Francisco de Bobadilla and returned to Spain, along with his two brothers, in chains)
The Mother of All Secrets
It's now been amply proven that evidence of hostility between Columbus and João II was fabricated. Columbus was, in fact, a member of João II's inner circle, in addition to being one of the most seasoned of all Portuguese mariners. After his false defection to Spain, Columbus attended three secret meetings with João II, the second of these, in 1488, being prompted by the mother of all maritime secrets: Dias having rounded the Cape of Good Hope, thereby establishing the shortest route to India by sea.
Now, the Holy Grail of all commercial bonanzas was a sea route to the riches of India – sought because Christendom was at war with Islam, and Muslim armies blocked the much shorter land routes across the Middle East. What the most knowledgeable Portuguese pilots knew was top secret, state of the art, a scientific prize for international espionage.
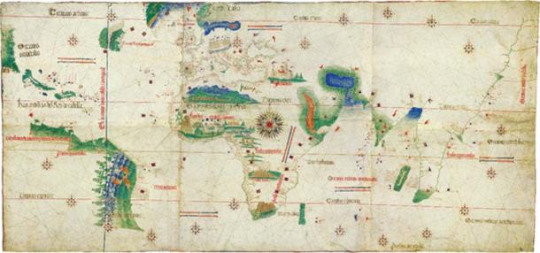
(The Portuguese discovered numerous territories and routes during the 15th and 16th centuries. Cantino planisphere, made by an anonymous cartographer in 1502.)
The Portuguese had been the first Europeans to launch expeditions in search of the Equator, which they reached around 1470, discovering while they were at it, the islands of São Tomé and Príncipe. By 1485, expert Portuguese technicians had invented charts and tables – based on the height of the sun at the Equator – which allowed navigators to determine their location in the daytime. While King João II was keeping Columbus up to date with all of the cutting-edge developments in maritime science, he was at the same time spreading so much disinformation elsewhere—among friends and foes alike— that we are still unraveling it.

(This secret letter, written by King João II was found in Columbus’ archives. Here is the exterior, addressed in the hand of King João II to, “Xpovam Collon, our special friend in Seville.”)
João II’s agents spent years pursuing the most important traitors across Spain, France and England. With that in view, the following comparison is revealing. Both Columbus and his nephew Don Lopo de Albuquerque (Count of Penamacor) fled Portugal at the same time, took refuge at Isabel's court under false identities, and fostered invasions of the Portuguese Atlantic monopoly from foreign shores. Lopo was tenaciously pursued, finally cornered in Seville and assassinated; in contrast, Columbus disposed of Portuguese secrets, exchanged letters covertly with King João II throughout his eight-year residence in Spain, stopped in Portugal on three of his four voyages, and lied to the Spanish Monarchs about these secret contacts.
A Secret Identity
Christopher Columbus is the garbled pseudonym of a very wellborn, learned, seafaring Portuguese nobleman. The antidote to all subsequent confusion about this man's true identity and character is simply to recognize that the news of his "discovery," which broke like a thunderbolt across the rest of Europe, was in fact nothing more than the release of information that the Portuguese had been hoarding for decades, laced with a linguistic insinuation that Spain had just pioneered the shortest route to India.
Everything Falls into Place
This new perspective on Columbus – as a Portuguese double agent – results in a major paradigm shift. All of the lies perpetrated by Columbus, his family, and the royal chroniclers suddenly begin to make sense as elements in a single, grand design, whose architect was King João II.
It is remarkable that the wave of treasons occurring in Portugal during the mid-1480s – engaging both Queen Isabel and Columbus so deeply – has never been linked by Portuguese historians to the biography of Columbus. Yet, no serious historian today accepts that Columbus was the first European to reach the Americas. There is no excuse any longer for maintaining that he was, or for sustaining the obsolete, pseudo-historical pretense that Columbus invented the idea of sailing west or that he ever really believed he'd landed in India.

(The secret Memorial Portugués, advising Queen Isabel that Portugal engineered the Treaty of Tordesillas specifically to safeguard the best territories for herself. Note how King João II is called (A) “an evil devil,” malvado diablo , and (B) how the “Indies,” Indias”, that Columbus visited are described as NOT the real India)
Having skirted the western lands from Canada to Argentina, the Portuguese understood there were no established commercial ports, no ready-made commercial goods, and was thus no trade potential there to compare with that of India. Columbus – and his many other co-conspirators in Spain, easily identified in retrospect – guarded these secrets faithfully, secrets they had to be privy to if they would guide the Spanish Monarchs to the counterfeit of India. The trade for gold and other goods along the west coast of Africa was immensely profitable, but still more jealously guarded was knowledge that the sea route to India lay also in this direction. The Portuguese were intent on keeping Spanish ships out of these waters. With both war and treaties having failed, João II and Columbus launched an audacious ruse to obtain their objective through less obvious means.
How History is Shaped
Colossal planning, nerve, and effort went into this accomplishment – seven years of convincing knowledgeable skeptics that the voyage was possible, outfitting a fleet and loading it with merchandise for trade (including cinnamon that would later be presented as evidence of contact with India). On a secret mission to Germany, Martim Behaim, another Templar knight member of the Portuguese Order of Christ, built a false globe based on Toscanelli's theory that East Asia lay just across the Atlantic. This globe still exists; it is the oldest one in the world. Genuine Portuguese traitors warned the Spanish Monarchs that they were being deceived.
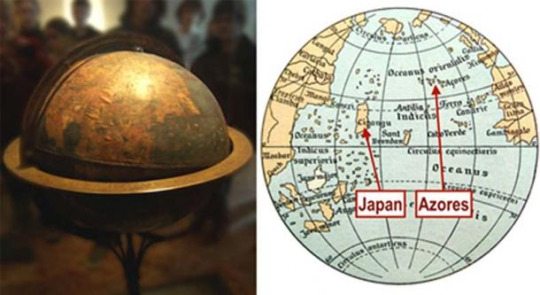
(Martin Behaim’s globe intentionally placed the Azores islands, where Behaim lived and was married, on top of the Americas. This made Asia appear much closer to Europe than it really is, thus supporting the project that Columbus was advocating for: Map of Atlantic Ocean)
The Treaty of Tordesillas (1494), observed fairly well by both sides, achieved João II's strategic objective: to engage the Spanish in the west while keeping them out of those regions that Portugal wished to dominate. Its effect on the linguistic, racial and cultural substance of an immense portion of the globe has scarcely been rivaled by any other treaty between two nations. No single factor did more to realize this outcome than the erudite seamanship, cunning, ruthless persistence, loyalty and sangfroid of the man whom we still remember today as "Christopher Columbus," a real-life 007, on May 20th, 1506.

(Cover from the master spy and sailor's Book of Privileges , which clearly shows that the owner's pseudonym was "Colon." An international transmission of the stunning "discovery," in March of 1493, distorted the name in such a fashion as to leave us with "Columbus" in English today. Technically speaking, "Colón" as the Spanish still call him, is correct, and it will someday most likely replace "Columbus" in common usage)
Another particularly factor that King João II knew of existence of land on the west was that when the first Treaty of Tordesilhas came, the line that separate Spain and Portugal territory was just near the Cape Verde territory (already belonging to Portugal). King João II refuse that line and asked for more 370 nautical miles west from that line. The Spanish Monarchs, not knowing anything about the globe, accepted, thinking that it was just more water. When the new Treaty came, the line that King João II asked put Brasil over Portuguese domain. How King João II knew exactly the number of miles to put Brasil in Portugal territory? Because he already knew there was land on the west. The “discovery” of Brasil was NOT an accident.
8 notes
·
View notes
Text
History of a Hershey’s Kiss 💋
What are the ingredients?
Milk Chocolate (Sugar, Milk, Chocolate, Cocoa Butter, Lactose, Milk Fat, Soy Lecithin, and Vanillin [Artificial Flavor]).
Where do they come from?
They source their cocoa from various growing regions around the world and have committed to use 100% certified cocoa by 2020. Most of the cocoa comes from West Africa. The milk is farm fresh from dairy farms within 100 miles of the factories. The sugar comes from sugar plantations across the southern US and around the world. The vanilla flavor is all natural and can come from various parts of the world like Madagascar. Lecithin comes from soy beans and is used to balance out the milk and cocoa butter and give it a better consistency.
What are the working and living conditions of the people who produce the cocoa?
With the majority of the global cocoa supply coming from Africa, the need for workers on plantations is always there, this has brought about the thriving business of child labor, slavery, and human trafficking across African borders. Many cocoa farms do not own the cocoa plantation and pay the land owner 50‐66 percent of each year’s crop. To keep costs low, farmers use their own family members as a source of labor. Hazardous conditions include applying pesticides, working with sharp objects like knives and machetes, working without safety equipment, and environments full of snakes, insects, and other dangerous animals. Although governments and corporations are aware of this problem, no accurate information, aside from estimates, exists regarding the true number of children working on cocoa plantations. The amount workers are paid is typically not efficient to live off of despite efforts to change conditions and labor laws. In 2011, over 400 foreign students working for Hershey went on strike after Excel, one of the company’s sub‐contractors, mislead and underpaid them. OSHA later fined the sub‐contractor $283,000 for health and safety violations.

Are child laborers involved?
Children who work on cocoa plantations are usually somewhere between 12 and 15 years old but some are as young as 5 years old. The issues of child labor, human trafficking, and forced labor in West Africa have drawn the attention of many organizations, especially those who work directly with them. There are many different initiatives, laws, and other precautionary measures in order to reduce the use of children for cocoa farming in terms of manual labor. In Africa individuals under the age of 14 are not allowed by law to work within the business sector, which does not include family farms. This law does almost nothing when considering the large amounts of family cocoa farms and the ease of hiding non‐family laborers.
How is it produced?
Cocoa pods are harvested from trees. The cocoa pods are collected in large baskets, which workers carry on their heads to curing areas. At the curing area farmers remove the cocoa beans from their pods and they are fermented and dried. The dry cured cocoa beans are then packed into sacks for transport. The cocoa beans are transported in trucks by road to the Ghanaian port, where they are packed into containers. The Cocoa products are transported in trucks by road back to the port of Singapore.
How does the cocoa get to the market?
The Cocoa products are transported in trucks by road back to the port of Singapore. A container ship transports the Cocoa products by sea to the port of Melbourne. Truck’s transport the cocoa Products by road from the port of Melbourne to a manufacturing factory. Manufacturers use the Cocoa products as ingredients. These products are loaded onto palettes and into trucks. Trucks transport the products by road to a warehouse where orders are assembled. These orders are then loaded on to pallets and into trucks. They are then transported by Road to super markets and real outlets.
How are prices set?
Supply drivers tend to be the stronger influencer of chocolate’s price volatility. With cocoa being a main ingredient this is what price typically fluctuates on. Africa – primarily the Ivory Coast and Ghana – is the largest global producer of cocoa. Supply fluctuations are a result of a number of factors, from political and civil unrest to labor issues and the effect of weather, diseases and pests on crop yields. For example, long periods of dry weather are not conducive to cocoa bean growth, resulting in supply shortages. Others ingredients such as sugar, dairy products, nuts, corn sweeteners and energy (natural gas and fuel oil) are also necessary to produce chocolate products. The prices of these commodities are driven, for the most part, by the commodities market, which sets the price based on supply and demand levels and can result in varying levels of volatility on commodity prices.
What international corporations dominate the chocolate Trade?
The dominating chocolate trade corporations are Mars Inc., Mondelez International, Nestlé, Ferrero Group, Meiji Co., Hershey Co., Lindt & Sprugli, and Perfetti Van Melle.
Who regulates it?
TransFairUSA is what many companies use to regulate the trade of cocoa to make them seen as a better factory. Others trade through one of the two world exchanges, either the NYSE Euronext or the Intercontinental Exchange.
Where did I buy it?
I bought it at Target
How much profit does a store owner make on chocolate?
They can make between 30 and 48 percent profit.
How is chocolate marketed?
Chocolate is marketed in many ways through ads like posters, commercials on tv and youtube, amusement parks etc...
Are there hidden costs that are not included in the price you paid? (Consider underpayment of labor; environmental impact; government subsidies that are direct [to the company] and indirect [infrastructure such as roads, ports, bridges, and water systems]; and the healthcare costs created by the harvesting, transporting, processing, and eating of this food.)
Yes, there are many hidden costs included in the price the people who produce the cocoa don’t get paid nearly half the amount the chocolate costs and don’t get any benefits either including healthcare or insurance. Also the way the cocoa is transported and how much the transporters get paid is not sufficient. The cocoa is transported back and forth before it even makes it to the chocolate factories. Incorporating the price of shipping like that guarantees more hidden fees.
Now that you’ve gathered some information about the components of this chocolate bar, write its biography. Tell the story of its life from the farming of its ingredients to the production and consumption.
The process of a Hershey kiss begins with the production of the main ingredients cocoa, sugar, milk, and vanilla. Production of the cocoa spans several countries and companies. The cocoa is supplied 70 percent from Africa (Ivory Coast, Ghana, Nigeria, Cameroon).The harvest process is labor intensive and starts when the seeds (cocoa beans) are extracted by splitting the pod with a machete. After the beans have been extracted, they are laid out to dry in the sun for several days in order to acquire the flavor needed for chocolate. The beans are then packed into bags and sent out for shipment where it is changed to cocoa butter then gone through another phase to get to the factory. The vanilla is harvested mostly in Madagascar under better conditions but still not the best conditions. The sugar is brought from southern US mostly and the milk is harvested about 100 miles from the actual factory by cows that, Hershey says, are treated humanely. Once everything is shipped and produced to the fullest it is then shipped to the Hershey factory to come together as the famous chocolate. The Hershey kiss has a specific shape so it goes through the proper machinery to get to that shape. They then ship the chocolate off to stores like Walmart and advertise the chocolate through commercials on tv and posters in store which make the chocolate look deletable, often times referring to the name and having actors use the chocolate kiss as a way to get more customers. People then go and buy the chocolate and eat it.
Sources:
https://danielsethics.mgt.unm.edu/pdf/Hershey%20Case.pdf
https://yourbusiness.azcentral.com/profit-margin-expected-chocolate-24385.html
https://www.hersheys.com/en_us/our-story/our-ingredients.html
https://www.investopedia.com/articles/investing/071615/what-drives-price-chocolate.asp
1 note
·
View note
Photo
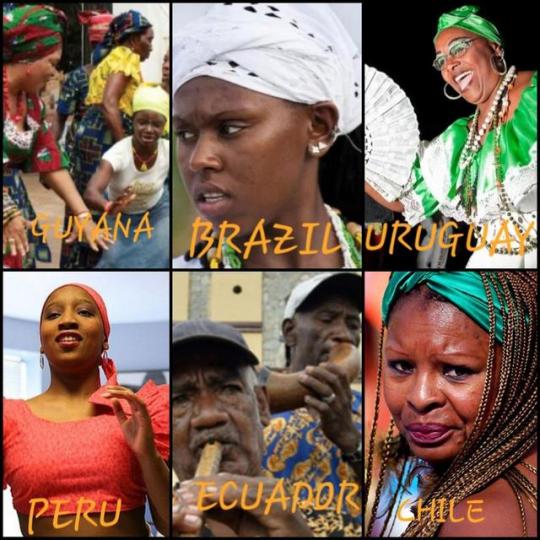
SOUTH AMERICA ISRAELITES
AFRO-GUYANA
Afro-Guyanese people are inhabitants of Guyana who are of Sub-Saharan African descent, generally descended from slaves brought to the Guianas to work on sugar plantations. In 1621 the Dutch West India Company acquired a charter to colonize and monopolize trade in the Americas and in Africa where they established a chain of slave trading and collection forts along the western African coast to supply slave labor for the Americas. The first of many hundreds of shiploads of enslaved Africans began arriving in Guyana in 1640 to work on the Dutch slave labor plantations. Slave labor was used to build the remarkable system of large drainage canals, dikes and sluices that form a protective barrier between the Atlantic Ocean and the low-lying coastline where most of the population still lives. One of the largest segments of Guyana's population are the descendants of those freed slaves who stayed in the colony after 1833. They make up about three-tenths of the population. Guyana is the only English-speaking country of South America, it was also never a Spanish or Portuguese colony, but instead Dutch and then British. Emancipation Day in Guyana comes every August 1st and commemorates the abolition of slavery in Guyana in 1834. Guyana shares Emancipation Day with other Caribbean nations that were formerly British colonies. There is currently a Hebrew culture center in Guyana called ‘The Prophetic Priesthood at Jerusalem,’ that keeps the laws of The Highest.
Also, the territory now known as Guyana was first inhabited by indigenous groups such as the Carib (Galibi or Kalinago), Arawak (Taino), Warrau, Wayana and Akawai. Before the captive’s slaves were brought to Guyana.
AFRO-BRAZILIAN
From the late 1500s to the 1860s, Brazil was consistently the largest destination for African slaves in the Americas. In that period, approximately 4 million enslaved Africans were imported to Brazil. Thousands of African slaves were brought to work in the gold mines. They were landed in Rio de Janeiro and sent to other regions. By the late 18th century, Rio de Janeiro was an "African city": most of its inhabitants were slaves. No other place in the world had as many slaves since the end of the Roman Empire. In 1808 the Portuguese Royal Family, fleeing from Napoleon, took charge in Rio de Janeiro. Some 15,000 Portuguese nobles moved to Brazil. The region changed a lot, becoming more European. The coast, in the past the place where millions of African slaves arrived (mostly from modern-day Angola, Ghana, Nigeria and Benin) to work in sugar-cane plantations, is where nowadays there is a predominance of Mulattoes, those of African and European ancestry. However, Salvador, Bahia is considered the largest African city outside of Africa, with over 80% of its inhabitants being African-Brazilians. It has been estimated by Darcy Ribeiro, a Brazilian anthropologist, author and politician that,12 million Africans were captured to be brought to Brazil, even though the majority of them died before becoming slaves in the country, only 45% of the Africans captured in Africa, to become slaves in Brazil, survived. Brazilian slavery included a diverse range of labor roles. For example, gold mining in Brazil began to grow around 1690 in interior regions of Brazil, such as modern-day region of Minas Gerais. Slaves in Brazil also worked on sugar plantations, such as those found in the first capital of Brazil—Salvador, Bahia. Other products of slave labor in Brazil during that era in Brazilian history included tobacco, textiles, and cachaça, which were often vital items traded in exchange for slaves on the African continent.
AFRO-URUGUAYANS
The majority of 190,000 Afro-Uruguayans are in Montevideo. The port of Buenos Aires served as the exclusive entry point for enslaved Africans in the Río de la Plata region. Slaves entering the port of Buenos Aires were then regularly shipped inland to Córdoba and the northwestern provinces of Salta and Tucumán in Argentina, across the Andes Mountains to Chile (see Afro-Chileans) and to the mines of Potosí in Alto Perú. Most African slaves worked as domestic servants or day laborers. Slavery was abolished gradually between 1842 and 1852. Economically they remain among the poorest sectors of Uruguayan society: most are non-qualified workers employed in the construction industry, domestic service, or cleaning and porter services. There is high unemployment among young Afro-Uruguayans. English is spoken in this country, but mostly for business, and then 99% of the population of Uruguay speaks Spanish.
AFRO-PERUVIANS
The first slaves arrived with the conquistadors (Spaniards) in 1521. In 1529 and 1537, Francisco Pizarro was granted permits to import 363 slaves to colonial Peru. The "New laws" of 1548 and the influence of the denunciation of the abuses against Native Americans by Friar Bartolomé de las Casas, slaves gradually replaced natives at the Encomienda’s. Over the course of the slave trade, approximately 95,000 slaves were brought into Peru, with the last group arriving in 1850.
Slave owners in Peru developed preferences to have slaves from specific areas of Africa (believed to have certain characteristics); they wanted to have slaves of one area who could communicate with each other. They believed slaves from Guinea, from the Senegal River down to the Slave Coast, were easier to manage and had marketable skills. They already knew how to plant and cultivate rice, train horses, and herd cattle on horseback. The slave owners also preferred slaves from the area stretching from Nigeria to eastern Ghana. The slave owners' third choice was for slaves from Congo, Mantenga, Cambado, Misanga, Mozambique, Madagascar, Terranova (who were probably bought in Porto-Novo, Benin), Mina and Angola. Two types of black slaves were forced to travel to Peru. Those born in Africa were commonly referred to as negros bozales ("untamed blacks"), which was also used in a derogatory sense. These slaves were shipped from west or southwest Africa or transported from the Spanish Indies or other Spanish colonies. Afro-Peruvians previously acculturated to Spanish culture and the ones who spoke Spanish were called negros ladinos (Latinized Negros) “Ladino” was a racist term used in the Iberia Peninsula. The Iberian Peninsula is Portugal and Spain, sound familiar? Well, if it does that’s because that is where black Jews (Yahudim) were expelled from and taking to the west coast of Africa only to be brought to the Americas and the Islands of the sea. Which would mean the slaves that were taking to Peru are descendants of these slaves, which would mean, they are the TRUE Jew/Yahudim.
In 1835, President Felipe Santiago Salaverry signed a decree again legalizing the deportation of slaves through the other Latin American countries. Thus, two years after his death, will be removed from the constitution the principle of "emancipating soil" according to which a slave entering Peru is, de facto, made free. In 1854, General José de San Martín outlaws slave trade in Peru. In 1856, President Ramón Castilla y Marquezado declared slavery abolished. Afro-Peruvian music has its roots in the communities of black slaves brought to work in the mines along the Peruvian coast. Today, Afro-Peruvians (also known as Afro descent Peruvians) reside mainly on the central and south coast, with the majority of the population in the provinces of Lima, Callao, Nazca, Chincha, Ica and Cañete. Many Afro-Peruvians live on the northern coast in Lambayeque and Piura. The greatest concentration of Afro-Peruvians and mestizos of Afro descent is in the Callao, an area that has historically received many of the Afro-Peruvians from the north and southern coast.
AFRO-ECUADORIAN
Slave ships first arrived in Ecuadorian ports in 1526, and slaves worked on plantations and in gold mines. Afro-Ecuadorians make up most of the balance of the percentage and include mulattos (mixed European and sub-Saharan African) and zambos (mixed indigenous and sub-Saharan African). Afro-Ecuadorians are an ethnic group in Ecuador who are descendants of black African slaves brought by the Spanish during their conquest of Ecuador from the Incas. They make up from 3% to 5% of Ecuador's population. The Afro-Ecuadorian culture is found primarily in the country's northwest coastal region. Africans form a majority (70%) in the province of Esmeraldas and also have an important concentration in the Valle del Chota in the Imbabura Province. They can be also found in important numbers in Quito and Guayaquil. Today, Afro-Ecuadorians have the highest unemployment level and are among the poorest of Ecuadorian social groups. Also, there is evidence that this group still faces regional inequalities and racial discrimination, particularly in urban areas.
AFRO-CHILEANS
Afro-Chileans are descended from the Sub-Saharan part of Africa, who were brought to the New World by religious orders and Spaniards. Slavery bloomed from 1580 to 1660, the import of slaves into Chile was a response to a long-term population decline among indigenous peoples. Black slaves were often used as housekeepers, agriculture, gold mining, and construction projects. Mortality was high, due to harsh working environment. and other posts of confidence. It is believed some of them might have come from Peru from the Antilles or towns in Africa, specifically from the Bantu regions some also were considered as descendants of Enslaved Africans brought from Africa to Present day Peru, Cuba, Brazil, then later brought to Chile. Afro-Chileans are mainly located in Arica y Parinacota in northern Chile. They are not recognized by Chilean government as an ethnic group.
4 notes
·
View notes
Photo

NEWSPAPER HEADLINES 29/09/2021 #Newspaper #NigeriaNews FG releases fresh debtors’ list Nov, 77 oil firms owe N2.66tn Let Supreme Court decide on VAT, Lagos tells Northern govs Northern governors under fire over silence as Kaduna death toll hits 51 Shi’ites clash with soldiers, police in Abuja, allege eight members killed Address our demands before it’s late, JOHESU tells FG PIA: Buhari’s proposed amendments not far enough, say states Vaccination: Senate to probe maltreatment of Nigerian travellers in Ghana Reps pass 2022-2024 MTEF, approve N4.89tn new borrowings FG bans 2,000 from travelling for evading COVID-19 test 320 convicts seek presidential pardon, clemency as committee reconvenes Navy disowns Commodore’s statement alleging arms sales by Chadian troops Petrol landing cost now N278, says MOMAN, crude reaches $80 It’s an insult comparing me to Hushpuppi, says jailed Invictus Obi Kogi, EFCC continue legal battle over N20bn bailout account Oct 15 Restructuring, only solution, must be done before 2023, Afenifere insists N30,000 minimum wage can’t feed average Nigerian – Ex-CIBN president Develop Ondo sea port, decongest Apapa gridlock, Akeredolu tells FG Gombe uncovers 901 suspected ‘ghost’ workers, saves N77m Saraki, Gbemisola tackle Kwara gov over demolition of LG library Kogi varsity dean’s abductors demand N20m, wife bursts into tears FCT notorious kidnapper gunned down, seven captors rescued Scores of robbers attack Osun bank, newly-promoted inspector killed Herdsmen kill nine in fresh Benue attacks Ekiti grandma collects N50,000 from man who raped three-year-old President Buhari approves 159 new radio, television stations Buhari seeks National Assembly’s clearance for ICPC, RMAFC board members Supreme Court’s Justice Oseji dies Bill to repeal Electricity Power Sector Reform Act 2005, passes second reading in Senate Senate seeks N300b to fix Niger roads Reps seek urgent repair of collapsed major road linking Imo, Anambra States How hooded gunmen kidnapped AVM Smith, couple, another in coordinated strikes Shi’ites dare police, vow to continue procession despite clash UK will return ill-gotten wealth, High Commissioner tell https://www.instagram.com/p/CUZjWcxAB0w/?utm_medium=tumblr
0 notes
Text
REGIONAL IMPACTS OF AND VULNERABILITIES TO CLIMATE CHANGE

Africa is already a continent fraught from climate stresses and is incredibly at risk of the impacts of climate change. Several areas in Africa are recog-nized as having climates that are among the foremost variable inside the globe on seasonal and decadal time scales. Floods and droughts will occur inside the identical place among months of each completely different. These events can cause famine and a wide unfold disruption of socio-economic well-being. For example, estimates rumored indicate that one-third of African people already board drought-prone space and 220 million are exposed to drought annually.
Several factors contribute and compound the impacts of current climate variability in Africa and can have nega-tive effects on the continent’s ability to deal with global climate change. These embody impoverishment, illiteracy, and lack of skills, weak institu-tions, restricted infrastructure, lack of technology and data, low levels of primary education, and health care, poor access to resources, low manage-ment capabilities, and armed conflicts. The event of resources likewise as forests can increase in population, action, and land degradation produces any threats (UNDP, 2006). Within the Sahara and Sahel, mud, and sand storms have negative impacts on agriculture, infrastructure, and health. As a result of warming, the climate in Africa is foreseen to become further variable, and extreme weather events are expected to be further frequent and severe, with increasing risk to health and life. This includes increasing risk of drought and flooding in new areas (Few et al., 2004; Christensen et al., 2007) and inundation to sea-level rise inside the continent’s coastal areas (Nicholls, 2004; McMichael et al., 2004). As an effect of worldwide (climate change global climate change temperature change) in Africa on key sectors and offers an indication of the adaptive capability of this conti-nent to climate change. Africa can face increasing water lack and stress with a succeeding potential increase of water conflicts as most of the 50 river basins in Africa are Tran’s boundary (Ashton, 2002; Wit and Jacek, 2006). Agricultural production depends chiefly on downfall rain for irrigation and may be severely compromised in many African countries, notably for subsistence farmers in SSA. Beneath international global climate change, plenty of agricultural lands are visiting, be lost, with shorter growing seasons and lower yields. National communications report that international global climate change will cause a general decline in most of the subsistence crops, e.g., sorghum in Sudan, Ethiopia, Eritrea, and Zambia; maize in Ghana; Millet in Sudan; and groundnuts in the Gambia. Of the complete further people in peril of hunger due to international global climate change, although already associate degree outsize proportion, Africa could account for the majority by the 2080s (Fischer et al., 2002). Africa is at risk of sort of climate-sensitive diseases together with malaria, tuberculosis, and diar-rhea (Guernier et al., 2004). Below international global climate change, rising temperatures are dynamic the geographical distribution of illness vectors that are migrating to new areas and better altitudes, as associate degree example, migration of the mosquito to higher altitudes can expose giant numbers of antecedently unexposed folks to infection within the densely inhabited geographic region highlands (Boko et al., 2007). Future climate variability also will act with different stresses and vulnerabilities like HIV/AIDS (which is already reducing anticipation in many African countries) and conflict and war (Harrus and Baneth, 2005), leading to augmented susceptibility and risk to infectious diseases (e.g., epidemic cholera and diarrhea) and malnutrition for adults and kids (WHO, 2004). Climate change is another stress to already vulnerable habitats, ecosys-tems, and species in Africa, and is perhaps running trigger species migration and cause environment reduction; up to 50% of Africa’s total multifarious-ness is in peril due to reduced environment and various human-induced pressures (Boko et al., 2007). The latter embraces land-use conversion due to agricultural growth and succeeding destruction of habitat; pollution; poaching; civil wars; high rates of land-use change; growth and the intro-duction of exotic species. As an example, it is perhaps visiting consider-ably decline, at the western lowland between 2002 and 2032. Future water level rise has the potential
to cause vast impacts on the African coast-lines likewise because of the already degraded coral reefs on the Japanese coast. National communications indicate that the coastal infrastructure in 30%of Africa’s coastal countries, together with the Gulf of Guinea, Senegal, Gambia, Egypt, and on the East-Southern African coast, is in danger of partial or complete inundation to accelerated water level rise. In Tanzania, a water level rise of 50 cm would inundate over 2,000 km2 of land, estimate accounting around USD 51 million (UNEP, 2002). Future water level rise, in addition, threatens lagoons and mangrove forests of every Nipponese and western Africa, and is perhaps going to impact urban centers and ports, like port Maputo, and Dar El-Salaam.
0 notes
Photo

Ghanaian shipping Company Providing Shipping services :
Hoborts Shipping services is giving the solution for complete shipping solution for it’s customer across the world and has become a major player in it’s sector.
it’s deal in wide range of shipping services for it’s valuable user .
Air freight : the best air freight is providing by hobort , have the huge network across the world .
Sea freight : Sea freight is the cheapest transport for the heavy logistics goods and hobort has the big network and agreement with major port all over the globe
Land freight : Hobort have the world largest land transport across the Ghana and other countries .
#logistics#cargo#homedecor#goods#dilevry#home#online travel#transport#business#dream#joy#airshipping#seacargo#landcargo#railcargo#roadcargo
0 notes
Text
Advancing Electronic Waste Management Techniques among Electrical/Electronic Technicians’ Workshops for Sustainable Healthy Society

Abstract
This study focused on the advancement of e-waste techniques among electrical/electronic technicians’ workshops for sustainable healthy society. Study was conducted in Nigeria. The participants for the study included 87 university engineering lecturers and 54 public health officers. Study adopted survey research design and structured questionnaire for data collection. The study was validated by three experts and reliability coefficient of 0.79 was achieved. Data obtained was analyzed using percentage, mean and standard deviation while t-test and ANOVA were used to test hypotheses. The result claimed that all e-waste components are hazardous except aluminum. Meanwhile, the level of hazardous varies and depends on type of e-waste and level of abundance. Result claimed that e-waste in electrical/electronic technician workshop have severe consequences such as uncontrolled fire and inflammatory/respiratory problem among others in the environment. Result confirmed that electrical/electronic technicians adopted unsafe method for managing e-waste such as dumping of e-waste inside flowing water and swamp and using e-waste for land filling. Result explained further that electrical/electronic technicians are facing challenges- exposure to injury and unavailability of modern equipment among others- in managing e-waste. Also, result confirmed that technique for managing e-waste in electrical/electronic workshop include establishment of recycling site and establishment and implementation of regulation. Meanwhile, result stated that qualification, experience, age and occupation affects respondent opinions in response to research questions.
Keywords: vElectrical/Electronic Technicians, Electrical/Electronic Workshops, E-Waste, Hazardous Component of E-Waste Material, E-Waste Management
Introduction
Educators and sociologists often conceived technicians as junior professional workers who know some proper subset of what professionals such as engineers or scientists know [1-3]. Technicians are workers in the field of technology who are proficient in relevant skills and techniques, with relatively practical understanding of theoretical principles for the purpose of carrying out installation, maintenance and repair activities [4,5]. Engineering technicians are charged with responsibilities like testing, monitoring, identifying, correcting and repairing (troubleshooting) problem that may arise on devices [6,7]. Generally, the ultimate function, discipline and way of life of technicians is to troubleshoot and ensure that machines and other physical systems remain in good working order [8]. Meanwhile, during the 1950s and 1960s, technician was routinely cross-referenced with “radio and television” as well as “electronics” repair [9]. This marks the beginning of electrical/electronic technicians.
Electrical/Electronic Technicians
Seigler [10] opined that electrical/electronic technician is a person working on electrical/electronic equipment at technical level between the skilled tradesman and the professional electrical engineer/scientists who has the technical knowledge and skill necessary to repair and service the modern-day consumer electronic products. In Nigeria, electrical/electronic technicians are trained in technical colleges to acquire necessary skills and competencies to carryout maintenance and repair activities such as dismantling, assembling, repairing, servicing, maintaining and installing electrical/electronic equipment and home appliances [11-14]. Arthur, et al. [1]; Seigler [10]; Dearden [15]; Bureau of Labour Statistics [16], Onuoha [17] reported that aside from upholding the responsibility of training apprentices, electrical/electronic technicians are charged to advice consumers, plan, design, develop, construct, assemble, erect, install, maintain, repair, adjust, monitor, service, test and commission electrical equipment/appliances. Seigler [10] asserted that most of electrical/electronic technicians carry out their function and maintenance activities in service shops or in stores popularly termed as workshop - a place where technicians and learners/ apprentices experiment, test, construct, dismantle, repair, design, create, imagine and study [18-20]. Electrical/Electronic technicians troubleshoot, maintain and repair appliances and equipment of different types such as refrigerator and air-conditions, electric motors and generators, voltage regulators, electric fan, Radio and Television sets, Amplifiers and Video recorders among others [11,13]. To be candid, the work of electrical/electronic technicians are acknowledged, recognized and supported globally. Experts expatiated that manufacturers of electrical/ electronic appliances are providing supportive skill training to technicians which enable technicians of electrical/electronic appliances to carry out repairing and maintenance activities to take faulty equipment back to their normal working condition for economic concern [21-24].
Meanwhile, ageing, shorter life span, emergence of new and latest technology, obsoleteness of existing technology, scarcity of spare parts to rectify faulty equipment, poor technological knowhow behind electrical/electronic product among the technicians, failure to afford charging/billing price or service requirement by consumers among other factors cause some electrical/electronic products and appliances to be accumulated at technician workshops or stores [25-30]. Onuoha [17] opined that most of electrical/electronic workshops are the house of junks for unrepaired and obsolete equipment. Also, Amachree [31]; Puckett, Westervelt, Gutierrez and Takamiya [32] explained that one quarter of the fairly used electrical/electronic appliances imported to Nigeria are functional, while the remaining three quarter of these appliances are either electronic junk or unserviceable at electrical/electronic workshop. Babatunde [25] argued that these junks of electrical/electronic equipment constitute wastes of Electrical and Electronic Equipment (Waste- EEE), which can otherwise be called Electronic Waste (E-Waste) or e-scraps at technicians’ workshops. Olaitan, Asogwa and Abu [23] reported that electrical/electronic machines and appliances become e-waste when they are considered out of use for their predetermined purposes.
E-waste
Kozlan [33] opined that e-waste is all electrical/electronic equipment or products with power plug, and batteries which have become obsolete due to advancement in technology, changes in fashion, style and status, and nearing the end of their useful life. Morgan [34] described e-waste as loosely discarded, surplus, obsolete or broken electrical or electronic devices. Electrical/ electronic waste refers to electrical/electronic appliances designed with a voltage rating not exceeding 1000 volts for alternating current and 1500 volts for direct current which have become obsolete, at the end of their lives or that have been discarded by their original users [35-38]. Babatunde [25]; Mundada, Sunil, & Shekdar, [26]; Ewuim, Akunne, Abajue, Nwankwo & Faniran [39]; Eyo [40]; Ogbomo, Obuh & Ibolo [41] opined that e-waste could be mobile phones, computers, communication equipment, entertainment electronic gadgets, household electronic appliances, audio-visual equipment and other valuable items or less functional and durable electronic gadgets that are no longer in use by their original owners. Scholars submitted that e-waste, in most of the time, is grouped into large household appliances, small household appliances, information technology (IT) and telecommunication equipment and consumer equipment [38,39,42,43].Emphatically, it is very undoubtful to declare that Massive volume and tons of e-waste are produced globally [44]. Specifically, it was estimated by scholars that 20 million to 50 million metric tons of e-waste is generated globally every year [25,45-49]. Thus, United States, Western Europe, China, Japan, and Australia are the major countries holding the leading position on the extent of e-waste generation in the world [28,50,51]. Scholars claimed that 50-80% of waste generated in these industrialized nations are probably exported to developing countries like China, India, Nigeria and Ghana [44,48,49,52-53]. Ogungbuyi, Nnorom, Osibanjo & Schluep [38]; UN Comtrade [54] estimated that within the year 2006, 2007, 2008, 2009 and 2010, 2794400, 57050, 46750, 2810900 and 403100 tons of electrical/ electronic wastes were imported to Nigeria respectively. Eyo [40]; Christine [55]; Obaje [37]; Puckett, Westervelt, Gutierrez & Takamiya [32]; Sonny [56] reported that 500 containers of fairly used electrical/electronic appliances are imported to Nigeria every months from Europe with each container holding 500 to 800 computers and monitors representing about 400,000 computers arriving to Nigeria every month. Also, Adediran & Abdulkarim [35]; Amachree [31]; Amanze [57]; Bello, Najib, Umar & Ibrahim [58]; Basel Action Network, BAN (59); Khurrum, Adnan and Xiaozhe [60]; Nnorom & Osibanjo [61]; Percy [62]; Puckett, Westervelt, Gutierrez & Takamiya [32]; Obaje [37] claimed that five million of fairly used personal computers are imported annually into Nigeria through the major sea port of Lagos alone of which 25-75% of these computer wares are unusable junk and unserviceable. In addition to this, Baldé, Wang, Kuehr & Huisman [45]; Chimere, Peter, Martina and Willie [47] reported that in 2014, Nigeria generated about 219 kilo tons of e-waste. Meanwhile, Amoyaw-Osei et al. [63]; Edward-Ekpu [64]; Percy [62] reported that 1,100,000 tons of e-waste are generated in each year in Nigeria. Thus, the internally generated e-waste coupled with imported e-waste positioned Nigeria as one of the countries where greater volume of e-waste is generated in Africa and in the world at large.
Ogungbuyi, Nnorom, Osibanjo & Schluep [38] expressed that the availability of large number of highly trained but low income informal technicians with impressive ability for repairing and refurbishing of used electrical/electronic equipment for local resale has influenced the importation of used electrical and electronic equipment from developed countries like Europe and North America to Africa such as Nigeria. However, following the fact that Nigeria as a nation lacks modern and standardized e-waste recycling facility, - the unusable, nonfunctional and unserviceable e-waste is dumped in several public places and sites spread around the cities and country [39,65].
Hazardous Component of E-waste Material
Analytically, e-waste is made up of certain components like ferrous and non-ferrous metals, and insulators [39]. E-waste items such as battery and Printed circuit boards among others contain primarily metals and non-metals components and most have certain percentage of chromium, lead, copper, nickel, cadmium, and other heavy metals and zinc [26,44,65,66-68]. Scientists affirmed that e-wastes has different hazardous and non- hazardous substances which are broadly consists of ferrous and non-ferrous metals, plastics, glass, wood & plywood, printed circuit boards, concrete and ceramics, rubber and other items [43]. Heacock, Kelly & Asante, et al. [44]; Napoleon and Sinclair [68]; Needhidasan, Melvin & Ramalingam [27] also claimed that e-waste has the content of both toxic and valuable materials in them. Shamsul [69] agreed to this and depicted that most electronic products contain toxic metals of different types which can quickly contaminate the environment when dumped. Thus, electrical/electronic equipment are made from hazardous/toxic elements capable of making e-waste a treat and affecting human and the environmental health in Nigeria [27,32,38,40,60,64,67,69,70-74]. Also, Alake & Ighalo [75] explained that many components of disposed electrical/electronic waste are heinously toxic, non-biodegradable and ecologically debilitating in nature if accidentally released into the environment. In most of the time, e-waste material has severe negative influence on electrical/electronic technicians and the nearby resident, by affecting the air, water and soil around them [38]. Many studies were conducted on identification of e-waste components but none of these studies was specifically focused on hazardous status of e-waste components based on the quantity of abundance in electrical/electronic technicians’ workshops. Thus, part of this study would examine the hazardous status of e-waste components based on the quantity of abundance in electrical/ electronic technician’s workshop.
These toxins will end up in the biological systems of living organisms causing terminal ailments, diseases and death if allowed [75,76]. Also, Omenogo [28]; Yousif [77] submitted that when e-waste is not properly disposed, the toxic substances present in components of electrical/electronic equipment can be harmful to humans and other organisms. Obaje [37]; Terada [65] claimed that the risk from e-waste affects the entire ecosystems and it is a major environmental health risk to wildlife and humans. For instance, Anwesha & Pardeep [78] reported that Guiyu in Hong Kong, a flourishing area of illegal e-waste recycling, is battling with shortages of clean and pure water due to the contamination of water resources by e-waste component. Nnorom & Osibanjo [61]; Sridhar & Bammeke [79] reported that in an industrialized area of Lagos state, some water body were tested to be acidic with PH scale of 3.40. This was attributed to mobility of heavy metals from disposed e-waste items and materials and from ash and cinder resulting from the open burning process, toward water bodies used for domestic purposes [61]. Also, Obaje [37]; Puckett, Westervelt, Gutierrez & Takamiya [32]; Terada [65] reported that 4,000 tons of hazardous e-waste (polychlorinated biphenyi) imported to koko area in Delta state, Nigeria from Italy in 1988 caused many people in the area died of cancerous diseases before it was discovered and repatriated back to source country. It is not doubtful to claim that number of studies were carried out on general hazardous effect of e-waste but none of these studies specifically focused on hazardous effect of e-waste in electrical/electronic service workshop. Thus, this study would investigate the possible effect of electrical/ electronic waste components in electrical/electronic workshop to human and its environment.
Pike Research reported that the volume of electronics e-waste, with increasing adoption of electronic gadgets around the world and ever shorter product life cycles, is expected to double over the next 15 years, from 6 million tons in 2010 to 14.9 million tons, by 2025 [55,80-81]. In another submit, Basel Action Network (BAN) claimed that e-waste generated worldwide has elevated from 9.3 million tons in 2005 to 50 million tons in 2012 [42,30]. Thus, the problem is that only around one tenth of these e-wastes were collected and taken care of [42,48,82- 84] while the remaining 90% become threat to the society and constituting wasting of resources [44,61]. In a real sense, collection of electrical and electronic waste is a sustainable process that maximizes recycling to retain valuable e-waste components in the economy and safely disposes of dangerous components [83-84]. Thus, to get rid of these adverse effects of e-waste that are generated in electrical/electronic service workshop, there is need for proper management of e-waste materials.
E-waste management
Adediran & Abdulkarim [56] submitted that e-waste management is a process of reducing, reusing and recycling of e-waste. Obaje [37]; Waste Management [85] opined that e-waste management is an effective recovery of all reusable materials from old, nonfunctioning, abandoned and disposed electrical/electronic equipment; and safe disposal of the hazardous substances in them to prevent such toxic material from contaminating the environment. Management of e-wastes involves collection, keeping, treatment and disposal of electrical/electronic waste/ scraps in a safe manner to repudiate/prevent human and its environment from harmful effect e-waste [86,87]. Meanwhile, the practices adopted by electrical/electronic technicians in their workshops to manage e-waste generated seem to be illegal, primitive and unsafe. Anwesha & Pardeep [78]; Sepúlveda, Schluep & Renaud [88] claimed that a persistent increase in legal and illegal trade of waste electrical and electronic equipment (WEEE) worldwide has caused equally increasing concern of poor WEEE management techniques. Scholars claimed that unsafe, unregulated and unaccountable collection, processing, and redistribution of old or abandoned electrical/electronic equipment are performed by workers at temporary sites, residences, workshops, and open public spaces [44]. Thus, Heacock, Kelly & Asante, et al. [44]; Solving the E-Waste Problem, StEP, Initiative [89] submitted that general practices of e-waste management among the populaces include using acid baths, burning cables, breaking of e-waste item into smaller parts using forceful approach, and dumping of e-waste materials into an unjustifiable position. Meanwhile, these workers may have embarked on e-waste risky processes and practices due to some challenges they may likely to have been facing such as lack of required knowledge, little or no access to latest technology and personal protective equipment among others [44,90]. However, the studies reviewed expatiated on unsafe practices of public general public regarding e-waste management and challenges they might be encountered while managing on e-wastes management. Thus, none of these studies empirically claimed the common practices of electrical/ electronic technicians regarding e-waste management in Nigeria. One of the focus of this study was to determine the common practice adopted by electrical/electronic technicians to manage e-waste in their workshops and, the challenges which electrical/ electronic technicians were encountering over e-waste management in their service workshops.
Azodo, Ogban & Okpor [88]; Okwesili, Ndukwe & Nwuzor [91] asserted that management of e-wastes focused on efforts of concerned people through conscious and systematic attempt in maintaining and sustaining an aesthetic, economically viable, physically healthy, conducive and safe environment for living. Hossain, Al-Hamadani & Rahman [42]; India Central Pollution Control Board [92]; Nnorom & Osibanjo [61]; Pinto [93] claimed that reclaiming some of the e-wastes materials and recycling them appropriately will mitigate the severe effect of e-waste on living things including plant and animals and their environment. Hossain, Al-Hamadani & Rahman [42] submitted that proper management of these e-wastes is important for the purpose of getting free from hazardous chemicals effect they possessed. Obaje [37]; Opara [94] claimed also that failure to effectively manage e-waste can leads to adverse environmental deterioration, depletion of potentially valuable resource base for secondary equipment and by extension serves as blocking stone for the attainment of sustainable development. The goal three and eleven of sustainable development (agenda 2030) declared in September 25-27, 2015 at United Nation Head Quarters, New York emphasized that quality and healthy living and well-being for all at all ages; and inclusive, safe, resilient and sustainable cities and human settlements must be the ultimate priority of all nations including Nigeria [95-103]. The target for attaining these goals among others includes strengthening the capacity of all countries, in particular developing countries, for early warning, risk reduction and management of national and global health risks; and reduces the adverse per capita environmental impact of cities, including by paying special attention to air quality and municipal and other waste management [101-102]. However, there is need to device appropriate management techniques for e-waste materials in electrical/electronic workshops globally and in Nigeria to be specific. This will go a long way in helping nations including Nigeria to achieve the sustainable healthy environment which goal three and eleven of agenda 2030 of sustainable development is advocating.
Anwesha & Pardeep [76] explained that the appropriate management measures of e-waste include establishment of stringent regulations. United Nations Environment Programme, UNEP, [104] opined that strengthening the political cooperation of a country to promote capacity building among workers and enhance public and private investment on safe and environmentally careful waste management technology will reduce adverse effect of e-waste. Also, Alabaster, Asante & Bergman et al. [105] recognized that bringing poverty to minimum level will alleviate the e-waste challenge in the long-term. Heacock, Kelly & Asante [44] submitted that raise the awareness and regulation of trans-boundary movement and disposal of hazardous and other wastes is a critical means of managing e-waste. Thus, portion of this study would empirically determine the techniques required to manage e-wastes in electrical/electronic service workshops in Nigeria. This is because none of existing studies has ever investigated on techniques for managing e-waste in technician’s workshops. However, the purpose of this study was to advance electrical/electronic waste management techniques among electrical/ electronic technicians’ workshops for sustainable healthy society. Specifically, the study sort to address the following research questions:
What is the hazardous status of e-waste components base on their level of abundance in electrical/electronic technicians’ workshops?
a) What is the hazardous effect of e-waste in electrical/ electronic technicians’ workshops to human and its environment?
b) What are the common practices adopted by electrical/ electronic technicians to manage e-waste in their workshops?
c) What are the challenges which electrical/electronic technicians encountered over e-waste management in their workshops?
d) What is the e- waste management techniques required in electrical/electronic workshops?/p>
Paul [106] claimed that demographic measures typically are used to identify key respondent characteristics that might influence opinion and/or are correlated with behaviours and experiences. Demographic measures include age, type of school, gender, level of academic study, race and educational attainment among other [106-107]. Thus, this study will test influence of qualification, experience, age and occupation on respondents’ opinions on advancement of waste management techniques in electrical/electronic’ workshops for sustainable Nigerian health society.
Hypotheses
a) HA1 Qualification, experience, age and occupation would significantly influence opinion of engineering lecturers and public health officers on hazardous status of e-waste components base on their level of abundance in electrical/electronic technicians’ workshops.
b) HA2 Qualification, experience, age and occupation would significantly influence opinion of engineering lecturers and public health officers on hazardous effect of electrical/electronic waste in electrical/electronic technicians’ workshops.
c) HA3 Qualification, experience, age and occupation would significantly influence opinion of engineering lecturers and public health officers on common practices adopted by electrical/ electronic technicians to manage e-waste in their workshops.
d) HA4 Qualification, experience, age and occupation would significantly influence opinion of engineering lecturers and public health officers on challenges which electrical/electronic technicians encountered over e-waste management in their workshops.
e) HA2 Qualification, experience, age and occupation would significantly influence opinion of engineering lecturers and public health officers on e- waste management techniques required in electrical/electronic workshops.
Materials and Methods
The study adopted Descriptive Survey research design. The study was conducted in Nigeria. Nganzi [108]; Gall, Gall & Borg [109] opined that descriptive surveys research design can be used to collect detailed and factual information that describes an existing phenomenon- their form, actions, changes over time and similarities with other phenomena- from all or a chosen number of the population of the concerned universe. Descriptive survey research design was adopted in this study because information regarding e-waste management was collected from experts using questionnaire. The study sampled one hundred and forty-one participants [110] which included 54 public health officers and 87 engineering lecturers in five Nigerian universities: 20 lecturers from Metallurgical and material engineering, 35 lecturers from Civil engineering and 32 lecturers from Electrical/electronic engineering in Nigeria. The study adopted structured questionnaire as instrument for data collection. The instrument was divided into Part 1 and 2. Part 1 of the instrument was used to receive demographic information of research participants while Part 2 of the instrument was divided into five sections-A, B, C, D and E- to illicit participant responses on hazardous status of e-waste component, hazardous effect of e-waste components, common practice adopted by electrical/electronic technicians to manage e-waste material, challenges encountered by technicians over e-waste management and e-waste management techniques required in electrical/electronic workshops respectively. Questionnaire items were subjected to face and content validity through the help of three experts from two Nigerian universities. The internal consistency of instrument was checked using Cronbach Alfa method. Thus, 0.76, 0.81, 0.69, 0.85 and 0.70 reliability coefficient estimate were obtained for section A, B, C, D and E respectively. Meanwhile, 0.79 was obtained as reliability coefficient estimate for the overall instrument. The instrument was administered using interpersonal contact by researchers and three research assistants. Researcher ensured consent of research participants using interpersonal discussion before the questionnaire is administered and through consent letter attached to the questionnaire. Data obtained were analyzed using statistical software SPSS 22. The research questions were answered using mean, standard deviation and percentage. Meanwhile, t-test and analysis of variance (ANOVA) were used to analyze the data at 0.05 level of significance. 50 percent, being the average percentage value, was considered as cutoff point before any item could be considered as strongly belong to any response category.While the average mean value (cut-off point) decision for section B, C, D and E was 1 2 3 4 5/2=3.0
Presentation of Result
Table 1 shows detail demographic profile of research participants. Specifically, the table illustrated two group of participants- 87 engineering lecturers which comprises of 20 metallurgical and material lecturers, 35 civil engineering lecturers and 32 electrical/electronic lecturers; and 54 public health officers. The participants, in regard to experience distribution, has 9 bachelor’s degree holders, 86 master’s degree holders and 46 PhD holders. The study participants, regarding experience distribution, comprised six participants with 0-9 years of experience, ninety-nine participants with 10-19 years of experience, nine participants with 20-29 years of experience and twenty-seven participants with 30 and above years of experience. Finally, in regard to age distribution, three of participants fell within the age range of 20-30, eleven participants fell within the age range of 31 and 40, eighty four participants fell within the age range of 41-50, thirty nine participants fell between the age ranges of 51- 60 and 4 participants fell within the age range of 61-70.
Data in Table 2 revealed that respondents agreed that all the 34 components of e-waste are hazardous except aluminum. Specifically, lead, mercury, glass and organophosphorus had percentage ratings ranged between 66.6% and 95% under the category of ‘hazardous when slightly abundant’. This depicted that these components are hazardous and can intoxicate the environment irrespective of the volume and quantity. Iron, copper, wood, yttrium, zinc, chlorobenzene and radioactive elements had percentage ratings ranged between 63.6% and 90.8% under the category of ‘hazardous when moderately abundant’. This indicated that these components are hazardous but can intoxicate the environment only when they are fairly or averagely abundant. Also, toner dust, cadmium, brominated flame among other components of e-waste had percentage ratings ranged between 61.0% and 95% under the category of ‘hazardous when largely abundant’. This illustrated that these components are hazardous but can intoxicate the environment only when they are largely or excessively abundant. Meanwhile, aluminum had percentage ratings of 68.8% under the category of ‘not hazardous regardless of state of abundant’. This depicted that aluminum cannot intoxicate the environment regardless of the volume and quantity. Many scholastic reports supported this finding. Reports claimed that over 60% of the total weight of most of e-waste consists of iron, gold, aluminum, copper, lead, mercury, beryllium, cadmium, chromium and brominated flame retardants, of which 2.7% are pollutants [27,110-114] and cause severe hazard to ecosystems with the attendant environmental health risk to wildlife and humans [38,94,115]. The composition of electronic wastes is mostly in various forms and types, containing more than 1,000 different toxic and non-toxic substances [42,116]. Also, gases releases from e-wastes component like polycyclic aromatic hydrocarbons (PAH), brominated flame retardants (BFRs), polychlorinated biphenyls (PCBs) and polychlorinated dibenzo- p-dioxins and furans (PCDD/ Fs) among others affects bio-physical environments and cause detrimental effects to human health [42,117]. Furthermore, scholars reported that some of toxic heavy metals found in e-waste include copper, beryllium, lead, tin, cadmium, brominated flame retardants, antimony, barium, and mercury [25,118]. Obaje [37]; Puckett, Westervelt, Gutierrez & Takamiya [32]; Terada [65] reported that polychlorinated biphenyl (PCB) exported to Koko area of Delta State, Nigeria in June 1988 was hazardous and caused death of cancer to people of the community.
Table 3 showed that the hazardous effect of e-waste in electrical/ electronic workshops stood at mean value of (4.49±0.51). Meanwhile, the mean rating for each item stood at mean values ranged between (4.14±0.35) and (4.63±0.48). This depicted that all the 25 items had mean ratings above the cut-off point of 3.0 and were considered by respondents as hazardous effect of e-waste in electrical/electronic technicians’ workshops to human and its environment. United Nations Environment Programme [49] supported this result and herein reported that failure to care for solid wastes including e-waste incurs a severe penalty, later, in the form of resources needlessly lost, foul odours and unsightliness and contamination of air, water, and soil resources. Individuals who live near or on disposal sites, are infected with gastrointestinal parasites, worms, and related organisms [49]. Furthermore, study found that 36.3% of 1,000 women living near the informal recycling sites experienced stillbirths in the Sylhet region of Bangladesh and 64% had hearing and/or vision problems [42,119-121]. Also, burnt e-wastes produce smoke, dust or carbon particles from toners consist of carcinogens and other hazardous chemicals which causes severe inflammations and lesions including many respiratory, lung and skin cancer and diseases [68].
Table 4 showed that the common practices adopted by electrical/electronic technicians to manage e-waste in workshops stood at mean value of (4.12±0.61). Meanwhile, the mean rating for thirteen items (item 1, 2, 3 4, 5, 6, 7, 8, 9, 10, 11, 13 and 14) stood at mean values ranged between (3.19±0.51) and (4.56±0.50). This proclaimed that all thirteen items had mean ratings above the cut-off point of 3.0 and were considered by respondents as common practices adopted by electrical/electronic technicians to manage e-waste in workshops. Meanwhile, item 12 had rating value (2.34±0.91) bellow the cutoff value of 3.00 and was not considered by respondents as common practices adopted by electrical/electronic technicians to manage e-waste in workshops. The scholars Needhidasan, Melvin & Ramalingam [27]; Sivakumaran [68] supported this finding wherein reported that dismantling of e-wastes takes much labor, in countries like China and in some parts of India where big quantity of tons of e-wastes are junked, dismantled, shredding, tearing and burning. Needhidasan, Melvin & Ramalingam [27]; Sinha-Khetriwal [73] reported that in Mumbai metropolis alone, people throw away 19,000 to 20,000 tons of electronic waste every month. Babatunde [25] reported that uncontrolled burning, disassembly and disposal which are common in the society can cause environmental and health problems. Also, Edward-Ekpu [64] reported that in Nigeria, a lot of e-waste are also stockpiled in offices and homes.
Table 5 showed that the challenges which electrical/electronic technicians encounter over e-waste management stood at mean value of (4.62±0.44). Meanwhile, the mean rating for each item stood at mean values ranged between (4.40±0.49) and (4.94±0.23). This depicted that all the 10 items had mean ratings above the cut-off point of 3.0 and were considered by respondents as challenges which electrical/electronic technicians encounter over e-waste management in workshops. Thus, this result was supported by scholars and scientist in the field of waste management. Obaje [37] submitted that e-waste is a major problem in Nigeria today because there is very low level of awareness of the hazards and health risk associated with e-waste. Needhidasan, Melvin & Ramalingam [27] reported that people who are working with e-waste sector are the urban poor with very low literacy levels and hence have very little awareness regarding the hazards of e-waste toxins. Babatunde [25] reported that one of the challenges facing e-waste management in Nigeria is lack of public awareness by manufacturers and consumers on the inherent dangers of handling and trading in e-waste and lack of a comprehensive e-waste management regulation or legislation in Nigeria to regulate, control and prohibit the flow of used consumer electronic products within Nigeria. E-waste collection in Nigeria is not organized because there are no collection centres for e-waste materials and this however caused most of e-wastes to be dumped along with other wastes [64].
Table 6 revealed that the e-waste management techniques required in electrical/electronic workshops stood at mean value of (4.43±0.49). Meanwhile, the mean rating for each item stood at mean values ranged between (4.03±0.58) and (4.96±0.20). This proclaimed that all the 34 items had mean ratings above the cut-off point of 3.0 and were considered by respondents as e-waste management techniques required in electrical/electronic workshops. The reports of past research supported the present findings. Manfred [122] supported this finding and herein reported that waste management service is falling too short of the desired level of efficiency and satisfaction resulting in problems of health, sanitation and environmental degradation due to absence of serious efforts from necessary authorities. Thus, Needhidasan, Melvin & Ramalingam [27] reported that technical and policy-level interventions, implementation and capacity building and increasing the public awareness can convert this challenge of massive e-waste generated into an opportunity. Babatunde [25] recommended that government should establish regulatory framework, through relevant agencies to manage e-waste and permanent e-waste collection facilities should be provided at strategic locations and usage of such facilities should be enforced. Ewuim, Akunne, Abajue, Nwankwo & Faniran [39] submitted that mass education and awareness should be created by regulatory bodies and government on inherent dangers of poor e-waste management on the environment.
Table 7 shows the summary of analysis of t-test and one-way between-groups analysis of variance that was conducted to explore the influence of qualification, experience, age and occupation of public health officers and engineering lecturers on their response to research questions. Participants were divided into three, four, five and two groups according to their qualification, experience, age and occupation respectively.
Hypothesis 1
Thus, qualification statistically influenced the response of engineering lecturers and public health officers on hazardous status of e-waste components in electrical/electronic workshops base on level of abundance: F (2,138) = 6.688; Sig.= 0.002. Experience statistically influenced the response of engineering lecturers and public health officers on hazardous status of e-waste components in electrical/electronic workshops base on level of abundance: F (3,137) = 8.018; Sig.= 0.000. Age statistically influenced the response of engineering lecturers and public health officers on hazardous status of e-waste components in electrical/electronic workshops base on level of abundance: F (4,136) = 24.228; Sig.= 0.000. Meanwhile, occupation did not statistically influence the response of engineering lecturers and public health officers on hazardous status of e-waste components in electrical/electronic workshops base on level of abundance: F (139, 90.976) = 0.232; Sig.= 0.631.
Hypothesis 2
Qualification statistically influenced the response of engineering lecturers and public health officers on hazardous effect of e-waste in electrical/electronic technicians’ workshops: F (2,138) = 7.384; Sig.= 0.001. Experience statistically influenced the response of engineering lecturers and public health officers on hazardous effect of e-waste in electrical/electronic technicians’ workshops: F (3,137) = 11.573; Sig.= 0.000. Age statistically influenced the response of engineering lecturers and public health officers on hazardous effect of e-waste in electrical/ electronic technicians’ workshops: F (4,136) = 11.365; Sig.= 0.000. Meanwhile, occupation did not statistically influence the response of engineering lecturers and public health officers on hazardous effect of e-waste in electrical/electronic technicians’ workshops: F (139, 110.082) = 0.145; Sig.= 0.704.
Hypothesis 3
Qualification did not statistically influence the response of engineering lecturers and public health officers on common practices adopted by electrical/electronic technicians to manage e-waste in the workshops: F(2,138)= 0.556; Sig.= 0.575. Experience did not statistically influence the response of engineering lecturers and public health officers on common practices adopted by electrical/electronic technicians to manage e-waste in the workshops: F(3,137)= 0.700; Sig.= 0.553. Age did not statistically influence the response of engineering lecturers and public health officers on common practices adopted by electrical/ electronic technicians to manage e-waste in the workshops: F(4,136)= 0.923; Sig.= 0.453. Also, occupation did not statistically influence the response of engineering lecturers and public health officers on common practices adopted by electrical/ electronic technicians to manage e-waste in the workshops: F(139,104.969)= 0.627; Sig.= 0.430.
Hypothesis 4
Qualification statistically influenced the response of engineering lecturers and public health officers on challenges which electrical/electronic technicians encounter over e-waste management: F(2,138)= 9.809; Sig.= 0.000. Age statistically influenced the response of engineering lecturers and public health officers on challenges which electrical/electronics technicians encounter over e-waste management: F(4,136)= 4.856; Sig.= 0.001.Meanwhile, experience did not statistically influence the response of engineering lecturers and public health officers on challenges which electrical/electronic technicians encounter over e-waste management: F(3,137)= 0.319; Sig.= 0.812. Also, occupation did not statistically influence the response of engineering lecturers and public health officers on challenges which electrical/electronic technicians encounter over e-waste management: F(139, 113.799)= 0.084; Sig.= 0.773.
Hypothesis 5
Qualification statistically influenced the response of engineering lecturers and public health officers on e-waste management techniques required in electrical/electronic workshops: F(2,138)= 24.196; Sig.= 0.000. Age statistically influenced the response of engineering lecturers and public health officers on e-waste management techniques required in electrical/electronic workshops: F(4,136)= 17.938; Sig.= 0.000.Meanwhile, experience did not statistically influence the response of engineering lecturers and public health officers on e-waste management techniques required in electrical/electronic workshops: F(3,137)= 0 .781; Sig.= 0.507. Also, occupation did not statistically influence the response of engineering lecturers and public health officers on e-waste management techniques required in electrical/electronic workshops: F(139, 113.799)= 0.095; Sig.= 0.757. Omenogo [28], while comparing the practices of two tertiary institutions in Nigeria on e-waste management, reported that institution was not a determining factor on whether a department keep records of discarded electronic equipment and records of stored out of use electronic items. Ohajinwa, Peter, Martina & Willie [123] reported also that health risk awareness level of the e-waste workers was significantly lower compared with their counterparts in the same informal sector. Thus, this study has commonalities with those previous studies.
Conclusion
The study investigated advancement of electrical/electronic waste management techniques among electrical/electronic technicians’ workshops for sustainable healthy society. The study uncovered the hazardous status of many composition of electronic waste materials based on the level of abundance. The study also revealed empirically the hazardous effect of e-waste materials in electrical/electronic workshops. Also, study confirmed the common e-waste practices among electrical/electronic technicians in their workshops and the challenges they are facing on e-waste management. Finally, this study discovered e-waste management techniques required for managing e-waste materials in electrical/electronic workshops. This study was geared purposely to reconstruct our society for sustainable and conducive living.
To Know More About Insights in Mining Science & Technology Please click on:
https://juniperpublishers.com/imst/index.php
To Know More About Open Access Journals Please click on:
https://juniperpublishers.com/index.php
#Juniper publishers#Open access Journals#Peer review journals#Juniper publishers reviews#Juniper publisher journals
0 notes
Photo

Gog and Magog:The Importance of Port Assab to Persia/Iran. Mr. Obama’s visit to Ethiopia sends the wrong message on democracy - Washington Post Editorial 06/25/15 01:15:00 pm, by admin, 554 words Categories: Assab,Ethiopia and The Red Sea. Mr. Obama’s visit to Ethiopia sends the wrong message on democracy - Washington Post Editorial Part 1 President Barack Obama and First Lady Michelle Obama greet His Excellency Hailemariam Desalegn, Prime Minister of the Federal Democratic Republic of Ethiopia, and Ms. Roman Tesfaye, in the Blue Room during a U.S.-Africa Leaders Summit dinner at the White House, Aug. 5, 2014. Official White House Photo by Amanda Lucidon “AFRICA DOESN’T need strongmen, it needs strong institutions.” Those were President Obama’s words when he addressed Ghana’s parliament in July 2009, during his first trip to sub-Saharan Africa as president. The historic speech, watched around the globe, was an optimistic clarion call to the leaders on the continent from the son of a Kenyan. “First, we must support strong and sustainable democratic governments,” Mr. Obama said. The president seems to have forgotten that speech. Last week, the White House announced that, while traveling to Kenya next month, Mr. Obama also will stop in Ethiopia, the first such visit by a sitting U.S. president to the country of 94 million. It’s almost unfathomable that he would make time for an entrenched human rights abuser such as Ethiopia while cold-shouldering the nation that just witnessed a historic, peaceful, democratic change of power: Nigeria. Administration officials justify the trip by citing the United States’ long-standing cooperation with Ethiopia on issues of regional security and the country’s accelerating economic growth. Ethiopia is a major recipient of U.S. development assistance, and the African Union has its headquarters there. But it also stands out in Africa for its increasingly harsh repression and its escalating chokehold on independent media and political dissent. http://nazret.com/blog/index.php/2015/06/25/mr-obama-s-visit-to 8 July 2015 @18:20 Cape Town,South Africa https://www.facebook.com/colinjohntruter/ (at The White House . Kommetjie .) https://www.instagram.com/p/B68f2wXn9uh/?igshid=12x855zc7fnbx
0 notes
Text
writers for blog posts

Welcome To Palindromecommunications.com
Find Articles Content Writers in Singapore and Malaysia!
Article writing services in Malaysia
Content writer service in Singapore
Affordable writer's for writing
Welcome to Palindrome Communications, We provide the best article content writing service in Singapore and Malaysia at an affordable price. Find the best article content writers online at Palindromecommunications.com.
Tell us about your brand/business
A FREE professional analysis of your brand/business and suitable topics/titles. This is where we plan for production.
Chill and wait for your deliveries
Palindrome works on your content, getting images, links and more just right so you can sit back and relax or deal with other things.
Copy, paste and share
After making any adjustments you like, copy, paste, upload and share your completed content to your websites and social media pages.
Our Packages
Fancy having loads of original content without worrying about writing it? Our service is built to be affordable, consistent and functional. No upfront fees or deposits. Just pay a small fee at the end of each month after you've received your delivered content. Discounts for bulk orders can be given.
Core Team
A core team of content specialists with decades of combined experience in media and content. We've been creating articles/blog posts for clients in both Malaysia and Singapore for years!
Find a writer Malaysia
Malaysia is one of the most beautiful and lively countries in the South East of Asia. It is flanked by countries such as Thailand, China, Indonesia and Singapore. Malaysia is divided into two parts namely, East Malaysia and Peninsular Malaysia, the latter being the most famous amongst tourists. Malaysia has greatly developed as a travel destination mainly because of its rich culture, breath taking nature and ancient historic connections. The climate in Malaysia is often sultry throughout the year. However it is pleasant enough to attract hordes of tourists.
Getting to Malaysia is not at all difficult. Visa procedures are very easy and direct flights from a majority of countries such as India, China, Australia, and neighboring countries such as Thailand, Singapore, and Indonesia are available. However tourists from USA or Europe are deprived of the facility of direct flights. Another interesting mode of transport is the train from Singapore to Malaysia. This journey is really a memorable and worth taking because of the scenery and breath taking green hills and slopes. Buses to Kuala Lumpur, the capital of Malaysia ply regularly to neighboring countries such as Brunei, Indonesia, Singapore and Thailand. Malaysia can also be reached by sea from the neighboring countries. There are a number of ports such as Penang, Kuching and Klang.
Find Articles writers in Singapore
It is no longer privileged knowledge that Information and Communication Technology has launched the entire globe into what is now known as the e-world-meaning electronic world. Today Governments the world over are somersaulting to reinvent and re-engineer governance so as to be more effective, efficient and transparent in the provision of information, goods and services to their citizens electronically.
Fortunately Ghana has already started dancing to the tune of the technological music because government has laid the foundation for e-government by establishing the government of Ghana website popularly referred to as Ghana Portal which is being managed by the Information Services Department of the Ministry of Information in Accra. Government has also established the Ghana-India Kofi Anan IT Centre of Excellence and above all, Ghana has formulated an Information Communication Technology framework for accelerated development, being spearheaded by the Ministry of Communications.
Nevertheless, when it comes to the practicability, accessibility and usability of e-government services by citizens, Ghana still has some mountains to climb and some rivers and lagoons to wade through. It is against this backdrop that this writer deems it relevant to share the Singapore e-government experience with fellow Ghanaians. But, even before shedding some light on e-government strategies and implementations in Singapore, it may be necessary to explain what e-government is in the first place.
Visit for more information :- http://palindromecommunications.com
0 notes
Text
AFRICA
Position and size: Africa is the second largest continent of the world; stretches for approximately 35° on each side of the Equator, and is crossed by both the tropics.
Periphery: North – Mediterranean Sea, East – Indian Ocean, Red Sea, West Atlantic Ocean, South – Antarctic Ocean.
Physical Features: Africa is a plateau continent having very ancient crystalline rocks.
In the North Western Part: Lie the ranges of Atlas Mountains which belong to the Alpine Mountain System of Southern Europe and are folded mountains.
In the Southern Part : Lie older block mountains, i.e. the Swartzberg and Drakensberg Mountains.
In North: The Tibesti and Ahaggar Mountains of the Sahara make some prominent features.
In East: The Volcanic comes such as Kilimanjaro, Mt. Kenya and Mt. Elogan are located in East Africa. Ethiopia is marked by a series of lakes like Lake Abaya, Lake Rudolf, etc. A large part of the plateau consists of a number of large basins, separated by divides.
Rivers and Drainage :The Nile, The Senegal, The Niger, The Congo, The Orange, The Limpopo, The Zambezi are important rivers
Climate: Africa, climatically can be divided into 7 regions:
Rainy tropical, (ii) Wet and dry Savannah (Low and High), (iii) Tropical Steppe, (iv) Tropical desert, (v) Humid Subtropical, (vi) Mediterranean and (vii) Undifferentiated Highlands.
Ocean currents:
The cold Canaries and Benguela current along the west coast of Africa have a cooling effect on neighboring coast.
The Warm Mozambique Current tends to warm southern coast.
The continent
Africa is the second largest continent on earth, approximately 11.7 million square miles.
Africa straddles the equator and is the only continent to extend from the northern temperate zone to the southern temperate zone.
Africa is the hottest continent on earth.
Africa covers 6 percent of the earth's total surface and 20.4 percent of the total land area.
Cairo is the continent's largest city.
Long before humans were around (the early Mesozoic Era) Africa was joined to the other continents in a massive continent called Pangaea. Over millions of years this huge continent broke apart shaping the world landscape as we know it today.
It is widely believed the African continent got its name from the ancient Romans. Upon defeating the ancient northern African city of Carthage, the Romans founded a province there they named Africa; named after the African tribe that inhabited the area.
Dallol in Northern Ethiopia has the world's hottest average temperature. The average temperature in this locality is 93 degrees Fahrenheit (33.89 degrees Celsius).
Winds: Great part of Africa lies in the north east and south east Trade wind belts.

Tropical Deserts:
(i) Somali desert of Somalia
(ii) Dankali desert of northern Ethiopia, Namibia and Kalahari.
Note: Coarse grasses and scrubs are the only vegetation of this climate.
Africa - Animals
Africa is full of dangerous animals that account for thousands of human deaths per year. Mosquitos which can transmit numerous dangerous diseases such as malaria kill the most people. Other deadly animals include the hippopotamus, the deadliest mammal, and the Puff Adder, the most dangerous snake.
The world's largest land animal is the African elephant.
The world's tallest animal, the giraffe, lives in Africa.
The fastest land animal in the world, the cheetah, lives in Africa.
Africa is home to the world's largest reptile, the Nile crocodile.
The gorilla, which can be found in the continents jungles, is the world's largest primate.
The world's largest frog, the goliath frog (also called the goliath bullfrog) lives in Africa. They can be found in the central African countries of Cameroon and Equatorial Guinea. They can grow to lengths of over 1 foot (30.5 centimeters).
Twenty five percent of the earth's bird species live in Africa.
People of Africa

The African continent has the second largest population in the world, at about one billion people.
Well over one thousand languages are spoken by the people of Africa. Some estimates put this number closer to two thousand.
The largest religion in Africa is Islam, followed by Christianity.
The African population is approximately 14.72% of the world's population .
The oldest human remains ever discovered were found in Ethiopia. They are approximately 200,000 years old.
Arabs, Berbers, Tuareg of desert : North Africa
The Pigmies : Congo Basin
The Bushman : Kalahari Desert
The Hottentots : South Africa
The Ovambo tribes : South West Africa
The Herero : South West Africa
Some important information about Africa
Major Safari Centre :Kenya
Rich Mineral district of Zaire : Katanga
Country that is Christian and Muslim : Ethiopia
Large lake in Sahara: Chad
Highest Mountain of Africa:Kilimanjaro
Country having highest percentage of nomadic herders : Somalia
The coasts of North west Africa and South West Africa (cape Town) has Mediterranean type of climate
River Congo crosses the equator twice
Island noted for spice exports : Zanzibar
South Africa is the leading producer of diamond and gold
Congo has the greatest hydroelectric potential in the world.
Common lingua franca across Eastern Africa : Swahili
Ghana was formerly known as ‘Gold Coast’ (British colony).
Nigeria is known as ‘Land of Palm Oil’.
Lake Tanganyika: A rift Valley Lake, world’s deepest lake (Kenya).
Most populated country of Africa is Nigeria. ‘Esparto Grass’ found in North Africa is used for paper making.
The Aswan Dam is situated on River Nile.
‘Port Said’ is the Northern Entrance to Suez Canal.
People of Katanga (Zaire) are known as Kasai Baluba.
Egypt is junction of the two continents, Asia and Africa.
To the west of Uganda, are the snow covered mountains of the ‘Ruwenzari Range’ known as ‘The Mountains of the Moon.’
Zanzibar and Pemba islands are well known for cloves.
Tanzania is well known for the ‘Sisal hemp’.
Coffee is produced by the progressive ‘Chagga’ Tribes on the fertile slope of
Kilimanjaro.
Kariba Dam famous for Hydro Electric Power is on River Zambezi.
Mozambique has the widest coastal plain in Africa.
Mozambique Channel separates Madagascar from Africa.
Cairo, the capital of Egypt, stands at the tip of the Nile deltas.
The whole savannah belt forms the actual Sudan, a word meaning ‘the land of the Blacks’, so called because of its Negro population.
River Nile is the longest river of Africa, emerging from Lake Victoria and draining into the Mediterranean Sea. A high class Arabian Coffee is produced in Ethiopia.
South Africa is the leading producer of maize in Africa, followed by Egypt.
Cotton is a leading export item from Uganda.
Africa Landforms
The longest river in the world, the Nile (4,132 miles), is located in Africa.
Africa has the world's largest desert, the Sahara, which is almost the size of the United States.
Victoria Falls is the largest waterfall in Africa; it is 355 feet high and one mile wide.
Mount Kilimanjaro is the highest mountain on the continent. It towers over 19,300 feet, which is so tall that glaciers can be found at its summit even though the mountain is near the equator.
Madagascar is the largest island in Africa and the fourth largest island in the world. It is in the Indian Ocean off the East coast of Africa.
A plateau called Witwatersrand in South Africa has produced half of the gold ever mined on Earth.
0 notes
Text
Introductory Note: By my calendar, it has been two months since my last post. I have several orphaned blogs that have suffered similar fates. There is no real good excuse, but some interesting reasons … well, interesting to me, anyway. However, I will update this blog more regularly. There was a two-week period, however, when I had no access to internet, email, or phone. At the end of February, my wife, Kate, and I got to go on a Caribbean cruise. When I was a kid, I went on a cruise in Hawaii, but cruise ships today are nothing like the Pacific Princess cruiser we were on back then. Here is a picture of that cruise ship now:
And here is a view of the ship we were on, the Norwegian Gem, which was elegant and carries about 2500 passengers:
The following picture essay is short on theological reflection, but it is long on an interesting and fun experience. Enjoy!
On St. Maarten
Getting There
On February 16th, we drove down to Boston and spent the night at a hotel which allows people to also keep their cars there for up to two weeks. Then we took the shuttle to South Station to catch the 11:15 train to New York City.
On the way to the train station in Boston
We love traveling by train. Every year there is a rumor that Amtrak is going to extend their DownEaster run all the way up to Rockland, which would mean we could catch the train a mile from our house, but it never happens. Otherwise we would be taking the train to Boston and NYC all the time.
The outskirts of NYC
We walked from Penn Station, past Times Square to our room in Hell’s Kitchen, which was a little over a mile. We were pretty tired, but our little hotel room looked out over a classic Hell’s Kitchen scene. I expected to see DareDevil or Spiderman show up in the alleyways.
At the Skyline Hotel in Hell’s Kitchen Hell’s Kitchen from our hotel window
Embarkation
Our hotel was only 2 blocks away from Pier 88, which is where Norwegian Cruise Lines stations itself. We had a boarding time of 12 noon, so we left about an hour ahead of time. In NYC, the blocks between Avenues is almost twice as long as between Streets. We walked from 10th Avenue, where our hotel was, to 12th Avenue, which runs along the waterfront. Less than halfway there, we could see the ship. The Norwegian Gem is huge, but about a third smaller than the megaships that are so popular now.
This is 2 blocks away. The ship is the largest building.
From this moment on, everyday was comprised of how to navigate large crowds of people.
After going through security checks, room key photos and creation, and navigating the maze of sales for massage packages, drink packages, restaurant packages, and down payments for your next cruise, we went through the enclosed gangplank to arrive on the Promenade level and were led right into the Atrium of the ship. Which is elegant and spectacular.
Here is a link to a short movie of the light sculpture in action
We left port at about 4pm. At about 3:45, our rooms were ready. They are small, but with plenty of space. Here is Kate looking at the schedule of things to do as I take a picture from the balcony. With a bonus picture of Kate with her personal life preserver.
Kate was very happy for all the security and safety things that were present on the ship. Of course, no amount of reassurance that cruise liners are one of the safest ways to travel assuaged her concerns initially.
At Sea
The Norwegian Gem has six diesel engines, which power multi-directional propulsion systems. At full speed it burns through about 3000 gallons of diesel fuel an hour. I tried not to think about the several tens of thousands of gallons of fuel deep in the hull of the ship once I found this out. Nonetheless, those engines are highly refined pieces of machinery which allow for tight maneuverability. We backed out of port and executed a very nice 90 degree turn in the river and then headed toward the sea. Also? It was cold.
The Norwegian Gem is registered in the Bahamas, and I believe every ship that is not registered in the US must be escorted out of the port by police or Coast Guard. We had a police helicopter escort us out.
We watched from the Sun Deck, along with a lot of other people.
It was moving and powerful to see Ellis Island as the sun went down, knowing relatives likely passed through there many years ago. And the Statue of Liberty at sunset is an image that has stayed with me since I saw it.
And then, we were out into the open sea, the North Atlantic.
We were at sea for 3 days going out and coming back. The first night, we – Kate and I, and our friends, Rodney and Jeni, with whom we took the cruise – explored the ship. This is the swimming pool area, which has a bar at one end, a buffet and bar at the other end, four hot tubs and two swimming pools, along with a water slide.
For the entire trip, I woke with the rising sun, which meant I was up before the vast majority of the our other 2400 fellow travelers, but not the 1000 crew members.
Kate and I made it a point to always use the stairs and walked the Promenade Deck often during our time at sea. Our room was on the 10th deck, and the Promenade was on the 7th. The buffet, pool, and sun decks were all on the 12th and 13th decks, so we walked several flights of stairs several times a day. If a person walked around the Promenade 2 ⅔ times, it was a mile. The Norwegian Gem is about 950 feet long, so once around the Promenade is a little more than a third of a mile. It is a huge ship.
The Grand Pacific dining room was at the aft of the ship. They served breakfast, lunch and dinner, and both the service and the food were excellent. The Norwegian Gem went through a major upgrade and remodel 2 and a half years ago and they went full-on Art Deco for the dining room. We were some of the first people to be seated for breakfast on the first morning, so we had a seat right above the port-side engines.
Here is the hallway leading away from our room. We were toward the forward of the ship, with a portside room (left, facing forward). This is facing aft (toward the rear). You can tell because the fish on the carpet always swim to the front of the ship, which was helpful because it was very easy to get turned around on the stairwells.
We were in room 10536. Jongi was our steward and was an excellent host for our cruise. For that matter, every staff member we interacted with was friendly, talkative, and helpful. The diversity was refreshing and wonderful to be around. Jongi was from China. Morgan, down the hall, was from India. Ghana, Croatia, Argentina, Spain, Peru, Cameroon, Norway, Philippines, Italy, France, South Africa, Russia, Taiwan, and many more were all on board. Kate and I, and our friends, Rodney and Jeni, made it a point to get to know the staff wherever we were on the ship. Lots of people complained about lots of things while on the cruise, but this being my first cruise experience as an adult, neither Kate nor I, nor our friends, could find a single thing to complain about at any point on the trip.
The seas were calm going down to San Juan. It started getting warm once we were off the coast of North Carolina. At sunset on the first day, we were down around northern Georgia, about 140 miles off shore.
Those first three days, we spent a lot of time at the outdoor cafe at the aft of the ship.
Also, I have about 400 pictures of waves and the wake of the ship.
The Norwegian Gem had 8 complimentary restaurants, 4 upcharge restaurants, and 3 buffet centers. You could, if you so desired, eat from 7am until 6:59am the next morning. O’Sheehans Pub, which overlooks the Atrium, is open 24 hours. The pub has a lot of sports memorabilia on the walls, and I was thrilled to find a great picture of The Greatest, Muhammed Ali, gracefully dodging a haymaker thrown from Joe Frazier.
By the time we were down around Florida, the water started turning a beautiful deep blue. The weather was warm and people began to swarm the pool area. Apparently, people “reserve” lounge chairs by putting their towels on the chairs, then leaving and doing whatever it is they are doing. Neither Kate or I have the patience or the desire to sit still long enough to get a tan by laying out in the sun. Also, my father used to be a dermatologist, and laying out in the sun has rooted itself as a deep and profound taboo in my psyche.
#gallery-0-89 { margin: auto; } #gallery-0-89 .gallery-item { float: left; margin-top: 10px; text-align: center; width: 33%; } #gallery-0-89 img { border: 2px solid #cfcfcf; } #gallery-0-89 .gallery-caption { margin-left: 0; } /* see gallery_shortcode() in wp-includes/media.php */
The water gets bluer the warmer it gets; and the pool gets crowded
San Juan, Puerto Rico
Our first port was San Juan, PR. It is a modern city which reminded me a lot of Detroit – many places that are thriving and active, with pockets of abandonment. All the white SUVs and buses are for tours from the cruise ships coming into the port. It is a strange and unusual business, and from my research it is not clear if having 4 cruise ships every other day coming into your town is actually helpful to the local economy or not. I suspect most of the money spent on excursions, aside from port fees (which can be as little as $8 to as much as $25 per person), ends up back with the cruise line.
While in San Juan, we went on a tour of the El Yunque National Rainforest. The forest has been a long-term conservation project for Puerto Rico, and often people with neighboring land will donate or will the land to the park, so it keeps growing. It is incredibly lush, being a rainforest and all. As a rainforest, it rains everyday, several times a day. It is a beautiful place.
When we got back to the pier, I was able to get an advertising shot of our ship, and watch the Royal Caribbean ship come in. The Eurodam was there as well. Last year, 21 million people went on cruises. It is a $40 billion a year industry. The line we were on, Norwegian Cruise Line, is bringing 4 new ships out in the next 3 years. There are issues with all of this, of course.
The Norwegian Gem and a Royal Caribbean cruise ship coming into port with us
Royal Caribbean and Holland America’s Eurodam as we leave San Juan
St. Thomas, VI
I think it is important, before I say anything about the Virgin Islands, that you know the stewards on NCL cruises are trained in the fine art of creating towel animals. Here is a sauropod our steward, Jongi, made for us:
I was in the Virgin Islands when I was an early teen, so my memory of it was not clear. I remembered it as far less populated, and it probably was less populated then. But I did remember the very blue waters and the beautiful way the trees spilled into the water from the islands. All of it looks warm, lush, and inviting.
This picture was taken at about 6:45am. It rained almost every morning in all the island ports. The rain would come in over the hills and across the water, beautiful sheet falling over the land and the water. Here, the clouds are moving off into the ocean as the sun comes up over the islands.
One of the places we went when I was there as a kid was Trunk Bay on St. John’s, VI. So the excursion we signed up for was a Trunk Bay Snorkeling and Beach day. We took a boat from the ship pier to St John’s, then got on a bus to Trunk Bay,which is in Virgin Islands National Park.
The ocean was crystal clear, but the waves were big the day we were at Trunk Bay, so the coral reef off the little cay, which was about 50 yards out from the beach, was covered with sand. Also, the beach was much more crowded than what I remembered. All that is to say that I didn’t get to see a lot of color or any fish at all snorkeling around the island. Rightfully, Trunk Bay is considered one of the 10 most beautiful beaches in the world.
St. Maarten
The next morning we ended up at Sint Maarten, which is an island divided in half. Half is Dutch, and the other, more populated, half is French. We docked on the Dutch side.
St. Maarten is a large island, but our bus to Maho Beach didn’t leave until 10am or so. It gave Kate and I a chance to wander down the pier and get some pictures.
Unbelievably, there is yet another cruise ship on the other side of the Royal Caribbean liner to the left of the picture. Also, if you look closely, you will see a little cart driving down the pier. The cart is driving down the pier toward Kate and I because people are not supposed to be down on the pier where we are. Of course, there were no signs that told us such a thing. But I got a good tourist pic of my lovely wife.
Maho Beach is in a bay on the far side of the island. It was here that Kate and I, and our friends with whom we were on the cruise with, decided the entire cruise scene is basically a travelling spectacle. Cruising, and the destinations one ends up in, is not travel in any true sense of the word. As someone who has some experience with travel, I think of travel as being willing to go to a place you don’t know, to learn about and experience things you want to know and do, and finding out about where those things are by talking to people you don’t know. Cruising is more like a moving vacation away from everything than travel.
#gallery-0-95 { margin: auto; } #gallery-0-95 .gallery-item { float: left; margin-top: 10px; text-align: center; width: 33%; } #gallery-0-95 img { border: 2px solid #cfcfcf; } #gallery-0-95 .gallery-caption { margin-left: 0; } /* see gallery_shortcode() in wp-includes/media.php */
Anyway, Maho Beach is a small beach with a whole lot of people. The primary attraction is that the beach is beautifully blue, which you can find all over the island. The main difference here are the airplanes that land right past the beach. The planes come in right over the top of the beach. Click for a YouTube video of planes landing. It is kind of crazy.
Tortola, BVI
By the time we arrived at Tortola early the next morning, we were pretty overwhelmed by the crowds and the herding from place to place and the noise. At the same time, we were aware that Tortola may be the most interesting of the islands on our trip. Even if we wanted to do something, though, the departure time was 1PM, so we just got off the ship and wandered around the town a little bit.
Kate and I went to this strange car park on the water and took some pictures, waded through the shops outside the pier, and then got back on the ship to people watch and enjoy the incredible weather – it was about 84 degrees and humid everywhere we went in the Caribbean, which was a nice break from the cold in Maine.
The aft deck overlooking the Tortola pier – Tortola in the morning
One thing I discovered about cruising is that much of the experience is always in comparison to other cruise ships and past cruises. When the Oasis of the Seas pulled up next to us, I noticed, “Hey, wait a minute…they have TWO climbing walls. And a giant LED movie screen by the pool area! What the…”
The Tui Discovery, which hails from New Zealand had a pink llama as a mascot. I liked the pink llama and thought our Norwegian Gem ship should have a mascot – maybe a reindeer or a lundehund.
Here is the Tui Discovery’s Llama And here is the Gem with a Lundehund
At Sea
We left Tortola – home of pirates and nefarious transfers of goods and humans alike – at 1pm. We took 3 days to get down to the Caribbean, and it would take a little less than that, but not much less to get back to NYC. Leaving Tortola was fantastically beautiful.
When we entered into international waters, the swells started to come in diagonally, and they were large, but relatively gentle. A lot of people on the ship didn’t handle it well, but we did.
It appeared to me that everyone on the ship knew they were headed back to cold weather, so they did whatever they could to take advantage of the time left to them to hang out in the sun and around the pool.
Sunsets were spectacular on the ocean. We didn’t get to see the green flash that happens when the sun hits the horizon at sunset when you are nearer to the equator, since it was cloudy every evening. But cloudy evenings led to moments like these.
The ship has something going on every moment of every waking hour. Most of the shows were musical reviews or comedy shows. We did go to one show with a couple of acrobats who were very impressive. What made it even more impressive was the performers were doing their ribbon and acrobatic routine on a considerably rocking ship. They did not appear to care. The theater that the performance was held was beautiful and could seat up to 1200 people. I couldn’t take pictures of the performance, but I did take a picture of the stage.
The ship was beautiful and all the lighting was just at the edge of being overwhelming, but the blue and purple and greys and the softened tones are clearly designed to calm people and draw them in.
This was a karaoke night in the Atrium featuring the crew of the ship. There were some very talented people who sang, but I was keenly aware of the penchant for ‘70s pop and soft rock.
The last couple days, Kate and our friends and I began to seek places that weren’t as crowded. However, if you choose to go on a cruise, there are people everywhere and there is no “quiet space”. Even the library was crowded. I suppose it was quiet in there, but so many people being quiet in a small space seemed more difficult to me than Calypso and Reggae bands playing by the pool.
Disembarkation
After 10 days on the Norwegian Gem, it was time to leave the ship. Cruising is a weird way to travel. It is like a floating city that travels to different places, but you see the same things everyone else sees when you go to those places. Instead of a house, you have a room where the bed is always made for you and someone cleans your bathroom for you and leaves towel animals for you.
Instead of having to worry about meals, you can choose to eat from your choice of a bunch of good to great restaurants, or just go to the buffet and eat as healthy or as unhealthy as you like. Instead of 128 channels with nothing on, there are musicians around the ship or a show in the theater or games in various lounges.
There is a lot that is attractive to all this and there are actually people who have both the income and the temperament to essentially live on a cruise ship all the time – as a passenger.
None of the above would be possible without the exceptional work of the international crew that makes all of this happen. The cooks, stewards, restaurant attendants and waiters, customer service agents, photographers, the captain and chief officers all make the experience seem unencumbered and relaxed. The amount of work to make this happen for 2400 passengers is almost inconceivable, and yet they remain friendly and attentive. Having done customer service work for many years before ministry, I can say this attitude is very hard to maintain.
But it was time to leave the ship, and we were excited to get home to our dogs and our house. We came into New York at sunrise.
By 8:45 we were off the ship. Here is a secret for you: Easy Disembarkation from the ship is when everyone leaves the ship. It is supposed to be an organized affair, but leaving the ship all at once is a herding event that is very uncomfortable.
And then, we were back on the streets of New York City.
Having been away from the ship for a month now, I can honestly say I would do this
The Cult of Cruise
whole thing again in a minute. Even with all the herding, all the people, the constant ‘70s pop music, it is unlike anything else. The danger is to join the Cruise Cult. Every cruise should be like your first cruise – unexpected, unknown, and completely new.
Kate and I had many conversations about the nature of leisure and vacations and work while on the Norwegian Gem and I will be updating the blog with some of those insights. One insight, however, that I will end with here is this:
Gratitude for those who make things possible for our enjoyment and leisure is easily overlooked. To make gratitude to those who make our vacations possible is a personal responsibility while traveling. Things go very well when, in our case, the staff and crew know you will be gracious for the things they do and the things you ask for. Once we engage gratitude, it flows. It flows from the vacation and the people helping make it possible, to the people you are traveling with, to the work you do to make the financial aspects possible, to the gifts given that help you travel, to God, for the incredibly beautiful places, creatures, and people in this world. So on your next vacation, say “Thank you” often. Start a conversation with your waiter. Thank the management or owner or captain. Look for the people who never get thanked, and thank them. Often. It will change everything, because we are changed when we are grateful.
A Sabbatical Cruise Introductory Note: By my calendar, it has been two months since my last post. I have several orphaned blogs that have suffered similar fates.
3 notes
·
View notes
Text
Blog 1:
I have never really done this whole “blog” thing but I am going to give it a try so I can keep all of you reading this updated on these life changing travels I am about to embark on. Starting this week, I will be traveling around the globe for the next 102 days, visiting 12 countries and 17 cities. You may ask what will I be doing while at sea? To answer that question, I am taking classes (had to add this to assure my corporate sponsor, mom, that I was getting plenty of education during this trip) while seeing the planet. The list of ports listed in order below:
January 12: Hawaii
January 24-28: Japan
January 31- February 5: Shanghai, Beijing, Hong Kong, China
February 8-13: Vietnam
February 19-23: Myanmar
February 28- March 5: India
March 11: Mauritius
March 18-23: Cape Town, South Africa
March 30-April 3: Tema, Takoradi, Ghana
April 11-14: Morocco
April 19: Germany
If you have suggestions or tips for any of these countries, please feel free to pass them along as I would love as much information as possible.
This amazing adventure would not have been possible without the support of my mom and family. I also want to give a major shoutout to the Miller family; thank you for introducing me to SAS and helping me along the way, I hope to make just as many memories as all of you. I will miss each and every one of you tremendously. I will try to be as safe as possible and continue to keep you all updated on my travels.
In the meantime, feel free to follow my travels and send me green bubbles, DMs, and lots of email. There will be WiFi on the ship.
Here is the info to stay up-to-date on my insane, yet amazing, adventures:
Instagram: @macsseamester
Email: [email protected]
Signing off from US soil. ✌
Bon Voyage,
Mac
0 notes
Text
Ethiopia to The World: The Origins of Coffee in Africa
Coffee has come a long way from its birthplace in the hills of Ethiopia. Today, you’ll find it growing and being sipped all over the world.
It has moved many miles, been contested, stolen, and obsessed over. Its roots in Africa help tell the story and serve as a reminder of the changing relationship that Africa has had with the rest of the world.
We’re going to take a look at how Africa plays into the journey of coffee, its popularity, and where it is today.
You may also like Why Rwandan Youth Are Turning Away From Coffee Production
Woman serving coffee brewed the traditional way at a farm in Ethiopia. Credit: Meklit Mersha
The History of Africa’s Coffee Trade
As we trace the roots of the coffee trade, it takes us back to the Horn of Africa, a peninsula with coasts on the Arabian Sea and the Gulf of Aden.
Over many centuries, important trade would take place on the Bab-el-Mandeb strait, known as the Gates of Tears, between Ethiopia and the western Arabian Peninsula, particularly Yemen.
An important player in these trading empires was the ancient Kingdom of Aksum. It was believed to have been founded in 150 BCE, centring in what we now know as Eritrea and Northern Ethiopia.
Aksum had the benefit of direct access to both the Upper Nile and the Red Sea during the third to the sixth century and was considered the greatest marketplace in North Africa. Its trade extended to what we know today as Somalia, Djibouti, Sudan, Egypt, Yemen, and Saudi Arabia. Merchants traded agricultural products such as salt, ivory, tortoise shells, gold, emeralds, silk, and spices across the region, bringing power and wealth to the kingdom.
However, they could not hold up against the expanding Islamic Empire, or Caliphate, who gained the upper hand when they seized control of the invaluable Red Sea and most of the Nile. The Islamic Empire then witnessed a century of rapid expansion across much of northern Africa and Spain under the rule of Umayyad Caliphate.
The caliphate would go on to control coffee trading. By the 14th century, however, the Empire grew tired of trading with Ethiopia for their coffee. Instead, they began cultivating their own coffee with plants smuggled out of Ethiopia to Yemen.
These ancient kingdoms in Africa were involved in the same acts as other kingdoms and empires all over the world: conquering, trading, and attempting to maintain their power and monopolies. This is something that would change over time.
A camel caravan, Ethiopia. Credit: ILRI, Apollo Habtamu
The Ottoman Empire’s Rule Over Coffee
Over the next 200 years, qahwa (coffee in Arabic) became widely cultivated across regions in Yemen, which shared a coastline with the Horn of Africa. This was helped by relatively fertile land, rainfall, and high elevations in the surrounding highlands of Mocha.
With coffee becoming an important part of everyday life within the empire, there was a great economic benefit for its growth and trade. By the 16th century, the powerful Ottoman Empire had built a coffee monopoly which they fiercely protected. They even developed the practice of boiling the coffee berries to make the seeds sterile and prevent their theft and cultivation elsewhere.
Yemen also held a strategic location in the region, right on the west of the Arabian Peninsula. Its bustling ports of Mocha and Al-Makha linked the camel caravan trade routes to the Red Sea and were the gateway for coffee exports to Egypt, Syria, and beyond.
The Horn of Africa is integral to the discussion of the beginnings of coffee trading. It was not only the birthplace of Arabica coffee but also where it was first shipped overseas before the expansion of the coffee trade.
You may also like Tracing Coffee’s Roots Back to Al-Mokha, Yemen
Coffee laborer at a coffee nursery in Ethiopia. Credit: Meklit Mersha
Coffee Travels Around The World
Having a monopoly over the coffee trade was a powerful tool: coffee was in demand and lucrative. It was fiercely guarded but also slyly stolen.
The downfall of the Ottoman Empire’s coffee monopoly came when the Dutch stole coffee seeds from Yemen in the late 1600s. From there, they were taken to the island of Java in Indonesia, a Dutch colony, where they established commercial coffee plantations. Using Javaian land and a Javaian workforce, they went on to dominate the world coffee trade.
The colonists played the leading role in the globalisation of coffee. Coffee went from being concentrated in North Africa and the Middle East to being grown worldwide. It was sought after, which made it the perfect crop for colonists to grow in their conquered colonies.
Slavery and the Atlantic Slave Trade played a significant role in shaping the coffee trade. An estimated 11 million Africans were forcibly taken to the Americas over the course of 400 years.
These slaves formed a workforce that directly contributed to the colonies’ economic success through growing items for trade, including coffee. This included British colonies in the West Indies, French colonies in Haiti, and Spanish colonies across modern-day Latin America.
Brazil, which was colonised by Portugal, was the leading producer of coffee by the 1830s. It relied on black and indigenous slave labour to grow 30% of the world’s coffee.
Colonists not only took plants but lives and livelihoods to ensure the significant growth of coffee.
Coffee ceremony in Ethiopia. Credit: ILRI, Apollo Habtamu
The Appreciation of Coffee in Africa
In Ethiopia, there is a longstanding love affair with coffee. As far back as the 10th century, Oromo warriors were believed to have rolled balls of ripe berries in animal fat and carried them on journeys as rations.
Drinking coffee remains part of the daily routine in Ethiopia. Coffee ceremonies, where coffee is roasted and brewed, are an important cultural activity. They’re the largest domestic consumer of coffee on the continent as well as the largest producer of coffee in Africa, too.
European explorers to Africa also documented the importance and appreciation of coffee. John Hanning Speke, an English explorer, described the local practice of picking and chewing the red cherries straight from the bush while he explored Uganda in the mid-1800s. (100 years later, my family did the same on our farm on the slopes of the Zimbabwean Highlands, delighting in the tastes of raspberry, red mulberry, currant, cranberry, cherry, and raisin.)
David Livingstone and John Kirk, two Scottish explorers, famously followed the course of the Zambezi River in the mid-1800s. Their accounts tell stories of great African kings and chiefs aiding European expeditions by gifting coffee. It was intended to nourish and energise the souls, fuel tired and often sick bodies, and provide the stimulus to cross treacherous waterways and tackle challenging routes.
Coffee sample sent to the Royal Botanic Gardens, Kew Gardens. Credit: Nicole Motteux
Original letters, diaries, journals, maps, photographs, sketches, and even coffee samples from this time detail European exploration across the African continent. They are now carefully preserved in the archives of the Royal Geographical Society, the National Library of Scotland, National Museums of Scotland, Kew Gardens, and many more institutions in Africa.
From the daily coffee ceremonies in Ethiopia to the gifting of coffee to explorers, coffee has been enjoyed and valued on the continent for centuries.
Early coffee beans parcels carried by tribesmen, Royal Botanic Gardens. Credit: Nicole Motteux
Coffee in Africa Today
Coffee still plays a major role in Africa. You’ll find it growing across East Africa, in Zimbabwe, and over in West Africa in the Ivory Coast and Ghana.
In many of these countries, there are embedded problems which make the production and trade of coffee more difficult. Issues relating to farm size, infrastructure, changing political climates as well as climate change can prevent farmers from excelling in their production. This directly affects farmer’s incomes and makes livelihoods more difficult to sustain.
Yet for many countries across the continent, it remains a key contributor to the economy. It makes up approximately 20% of exports from Ethiopia, Rwanda, Uganda, and Burundi.
African coffee is recognisable in its own right. It’s applauded for its unique qualities and delicate flavour profiles, from the floral notes of coffee grown at high altitudes to the distinctive bergamot notes in coffee from Yirgacheffe, Ethiopia.
Coffee being roasted at a roastery in Ethiopia. Credit: Meklit Mersha
Coffee has travelled from Ethiopia to the otherside of the world (and also to my family’s farm in Zimbabwe). Along the way, it’s captured the imagination of farmers, traders, colonists, and consumers throughout history. It’s transformed economies and remains part of the daily routine of millions’ of people around the world.
Enjoyed this? Check out Tackling The Challenges of Trading Coffee in East Africa
Written by Nicole Motteux with input by Lilani Goonesena. Featured photo caption: Coffee brewed the traditional way being served. Featured photo credit: Meklit Mersha
Perfect Daily Grind
Want to read more articles like this? Sign up for our newsletter!
The post Ethiopia to The World: The Origins of Coffee in Africa appeared first on Perfect Daily Grind.
Ethiopia to The World: The Origins of Coffee in Africa published first on https://espressoexpertweb.weebly.com/
0 notes
Text
Advancing Electronic Waste Management Techniques among Electrical/Electronic Technicians’ Workshops for Sustainable Healthy Society - Juniper publishers

Abstract
This study focused on the advancement of e-waste techniques among electrical/electronic technicians’ workshops for sustainable healthy society. Study was conducted in Nigeria. The participants for the study included 87 university engineering lecturers and 54 public health officers. Study adopted survey research design and structured questionnaire for data collection. The study was validated by three experts and reliability coefficient of 0.79 was achieved. Data obtained was analyzed using percentage, mean and standard deviation while t-test and ANOVA were used to test hypotheses. The result claimed that all e-waste components are hazardous except aluminum. Meanwhile, the level of hazardous varies and depends on type of e-waste and level of abundance. Result claimed that e-waste in electrical/electronic technician workshop have severe consequences such as uncontrolled fire and inflammatory/respiratory problem among others in the environment. Result confirmed that electrical/electronic technicians adopted unsafe method for managing e-waste such as dumping of e-waste inside flowing water and swamp and using e-waste for land filling. Result explained further that electrical/electronic technicians are facing challenges- exposure to injury and unavailability of modern equipment among others- in managing e-waste. Also, result confirmed that technique for managing e-waste in electrical/electronic workshop include establishment of recycling site and establishment and implementation of regulation. Meanwhile, result stated that qualification, experience, age and occupation affects respondent opinions in response to research questions.
Keywords: Electrical/Electronic Technicians; Electrical/Electronic Workshops; E-Waste; Hazardous Component of E-Waste Material; E-Waste Management
Introduction
Educators and sociologists often conceive technicians as junior professional workers who know some proper subset of what professionals such as engineers or scientists know [1-3]. Technicians are workers in the field of technology who are proficient in relevant skills and techniques, with relatively practical understanding of theoretical principles for the purpose of carrying out installation, maintenance and repair activities [4,5]. Engineering technicians are charged with responsibilities like testing, monitoring, identifying, correcting and repairing (troubleshooting) problem that may arise on devices [6,7]. Generally, the ultimate function, discipline and way of life of technicians is to troubleshoot and ensure that machines and other physical systems remain in good working order [8]. Meanwhile, during the 1950s and 1960s, technician was routinely cross-referenced with “radio and television” as well as “electronics” repair [9]. This marks the beginning of electrical/electronic technicians.
Electrical/Electronic Technicians
Seigler [10] opined that electrical/electronic technician is a person working on electrical/electronic equipment at technical level between the skilled tradesman and the professional electrical engineer/scientists who has the technical knowledge and skill necessary to repair and service the modern-day consumer electronic products. In Nigeria, electrical/electronic technicians are trained in technical colleges to acquire necessary skills and competencies to carryout maintenance and repair activities such as dismantling, assembling, repairing, servicing, maintaining and installing electrical/electronic equipment and home appliances [11-14]. Arthur, et al. [1]; Seigler [10]; Dearden [15]; Bureau of Labour Statistics [16], Onuoha [17] reported that aside from upholding the responsibility of training apprentices, electrical/electronic technicians are charged to advice consumers, plan, design, develop, construct, assemble, erect, install, maintain, repair, adjust, monitor, service, test and commission elec trical equipment/appliances. Seigler [10] asserted that most of electrical/electronic technicians carry out their function and maintenance activities in service shops or in stores popularly termed as workshop - a place where technicians and learners/ apprentices experiment, test, construct, dismantle, repair, design, create, imagine and study [18-20]. Electrical/Electronic technicians troubleshoot, maintain and repair appliances and equipment of different types such as refrigerator and air-conditions, electric motors and generators, voltage regulators, electric fan, Radio and Television sets, Amplifiers and Video recorders among others [11,13]. To be candid, the work of electrical/electronic technicians are acknowledged, recognized and supported globally. Experts expatiated that manufacturers of electrical/ electronic appliances are providing supportive skill training to technicians which enable technicians of electrical/electronic appliances to carry out repairing and maintenance activities to take faulty equipment back to their normal working condition for economic concern [21-24].
Meanwhile, ageing, shorter life span, emergence of new and latest technology, obsoleteness of existing technology, scarcity of spare parts to rectify faulty equipment, poor technological knowhow behind electrical/electronic product among the technicians, failure to afford charging/billing price or service requirement by consumers among other factors cause some electrical/electronic products and appliances to be accumulated at technician workshops or stores [25-30]. Onuoha [17] opined that most of electrical/electronic workshops are the house of junks for unrepaired and obsolete equipment. Also, Amachree [31]; Puckett, Westervelt, Gutierrez and Takamiya [32] explained that one quarter of the fairly used electrical/electronic appliances imported to Nigeria are functional, while the remaining three quarter of these appliances are either electronic junk or unserviceable at electrical/electronic workshop. Babatunde [25] argued that these junks of electrical/electronic equipment constitute wastes of Electrical and Electronic Equipment (Waste- EEE), which can otherwise be called Electronic Waste (E-Waste) or e-scraps at technicians’ workshops. Olaitan, Asogwa and Abu [23] reported that electrical/electronic machines and appliances become e-waste when they are considered out of use for their predetermined purposes.
E-waste
Kozlan [33] opined that e-waste is all electrical/electronic equipment or products with power plug, and batteries which have become obsolete due to advancement in technology, changes in fashion, style and status, and nearing the end of their useful life. Morgan [34] described e-waste as loosely discarded, surplus, obsolete or broken electrical or electronic devices. Electrical/electronic waste refers to electrical/electronic appliances designed with a voltage rating not exceeding 1000 volts for alternating current and 1500 volts for direct current which have become obsolete, at the end of their lives or that have been discarded by their original users [35-38]. Babatunde [25]; Mundada, Sunil, & Shekdar, [26]; Ewuim, Akunne, Abajue, Nwankwo & Faniran [39]; Eyo [40]; Ogbomo, Obuh & Ibolo [41] opined that e-waste could be mobile phones, computers, communication equipment, entertainment electronic gadgets, household electronic appliances, audio-visual equipment and other valuable items or less functional and durable electronic gadgets that are no longer in use by their original owners. Scholars submitted that e-waste, in most of the time, is grouped into large household appliances, small household appliances, information technology (IT) and telecommunication equipment and consumer equipment [38,39,42,43]. Emphatically, it is very undoubtful to declare that Massive volume and tons of e-waste are produced globally [44]. Specifically, it was estimated by scholars that 20 million to 50 million metric tons of e-waste is generated globally every year [25,45-49]. Thus, United States, Western Europe, China, Japan, and Australia are the major countries holding the leading position on the extent of e-waste generation in the world [28,50,51]. Scholars claimed that 50-80% of waste generated in these industrialized nations are probably exported to developing countries like China, India, Nigeria and Ghana [44,48,49,52-53]. Ogungbuyi, Nnorom, Osibanjo & Schluep [38]; UN Comtrade [54] estimated that within the year 2006, 2007, 2008, 2009 and 2010, 2794400, 57050, 46750, 2810900 and 403100 tons of electrical/electronic wastes were imported to Nigeria respectively. Eyo [40]; Christine [55]; Obaje [37]; Puckett, Westervelt, Gutierrez & Takamiya [32]; Sonny [56] reported that 500 containers of fairly used electrical/electronic appliances are imported to Nigeria every months from Europe with each container holding 500 to 800 computers and monitors representing about 400,000 computers arriving to Nigeria every month. Also, Adediran & Abdulkarim [35]; Amachree [31]; Amanze [57]; Bello, Najib, Umar & Ibrahim [58]; Basel Action Network, BAN (59); Khurrum, Adnan and Xiaozhe [60]; Nnorom & Osibanjo [61]; Percy [62]; Puckett, Westervelt, Gutierrez & Takamiya [32]; Obaje [37] claimed that five million of fairly used personal computers are imported annually into Nigeria through the major sea port of Lagos alone of which 25-75% of these computer wares are unusable junk and unserviceable. In addition to this, Baldé, Wang, Kuehr & Huisman [45]; Chimere, Peter, Martina and Willie [47] reported that in 2014, Nigeria generated about 219 kilo tons of e-waste. Meanwhile, Amoyaw-Osei et al. [63]; Edward-Ekpu [64]; Percy [62] reported that 1,100,000 tons of e-waste are generated in each year in Nigeria. Thus, the internally generated e-waste coupled with imported e-waste positioned Nigeria as one of the countries where greater volume of e-waste is generated in Africa and in the world at large.
Ogungbuyi, Nnorom, Osibanjo & Schluep [38] expressed that the availability of large number of highly trained but low income informal technicians with impressive ability for repairing and refurbishing of used electrical/electronic equipment for local resale has influenced the importation of used electrical and electronic equipment from developed countries like Europe and North America to Africa such as Nigeria. However, following the fact that Nigeria as a nation lacks modern and standardized e-waste recycling facility, - the unusable, nonfunctional and unserviceable e-waste is dumped in several public places and sites spread around the cities and country [39,65].
Hazardous Component of E-waste Material
Analytically, e-waste is made up of certain components like ferrous and non-ferrous metals, and insulators [39]. E-waste items such as battery and Printed circuit boards among others contain primarily metals and non-metals components and most have certain percentage of chromium, lead, copper, nickel, cadmium, and other heavy metals and zinc [26,44,65,66-68]. Scientists affirmed that e-wastes has different hazardous and non- hazardous substances which are broadly consists of ferrous and non-ferrous metals, plastics, glass, wood & plywood, printed circuit boards, concrete and ceramics, rubber and other items [43]. Heacock, Kelly & Asante, et al. [44]; Napoleon and Sinclair [68]; Needhidasan, Melvin & Ramalingam [27] also claimed that e-waste has the content of both toxic and valuable materials in them. Shamsul [69] agreed to this and depicted that most electronic products contain toxic metals of different types which can quickly contaminate the environment when dumped. Thus, electrical/electronic equipment are made from hazardous/toxic elements capable of making e-waste a treat and affecting human and the environmental health in Nigeria [27,32,38,40,60,64,67,69,70-74]. Also, Alake & Ighalo [75] explained that many components of disposed electrical/electronic waste are heinously toxic, non-biodegradable and ecologically debilitating in nature if accidentally released into the environment. In most of the time, e-waste material has severe negative influence on electrical/electronic technicians and the nearby resident, by affecting the air, water and soil around them [38]. Many studies were conducted on identification of e-waste components but none of these studies was specifically focused on hazardous status of e-waste components based on the quantity of abundance in electrical/electronic technicians’ workshops. Thus, part of this study would examine the hazardous status of e-waste components based on the quantity of abundance in electrical/electronic technician’s workshop.
These toxins will end up in the biological systems of living organisms causing terminal ailments, diseases and death if allowed [75,76]. Also, Omenogo [28]; Yousif [77] submitted that when e-waste is not properly disposed, the toxic substances present in components of electrical/electronic equipment can be harmful to humans and other organisms. Obaje [37]; Terada [65] claimed that the risk from e-waste affects the entire ecosystems and it is a major environmental health risk to wildlife and humans. For instance, Anwesha & Pardeep [78] reported that Guiyu in Hong Kong, a flourishing area of illegal e-waste recycling, is battling with shortages of clean and pure water due to the contamination of water resources by e-waste component. Nnorom & Osibanjo [61]; Sridhar & Bammeke [79] reported that in an industrialized area of Lagos state, some water body were tested to be acidic with PH scale of 3.40. This was attributed to mobility of heavy metals from disposed e-waste items and materials and from ash and cinder resulting from the open burning process, toward water bodies used for domestic purposes [61]. Also, Obaje [37]; Puckett, Westervelt, Gutierrez & Takamiya [32]; Terada [65] reported that 4,000 tons of hazardous e-waste (polychlorinated biphenyi) imported to koko area in Delta state, Nigeria from Italy in 1988 caused many people in the area died of cancerous diseases before it was discovered and repatriated back to source country. It is not doubtful to claim that number of studies were carried out on general hazardous effect of e-waste but none of these studies specifically focused on hazardous effect of e-waste in electrical/electronic service workshop. Thus, this study would investigate the possible effect of electrical/ electronic waste components in electrical/electronic workshop to human and its environment.
Pike Research reported that the volume of electronics e-waste, with increasing adoption of electronic gadgets around the world and ever shorter product life cycles, is expected to double over the next 15 years, from 6 million tons in 2010 to 14.9 million tons, by 2025 [55,80-81]. In another submit, Basel Action Network (BAN) claimed that e-waste generated worldwide has elevated from 9.3 million tons in 2005 to 50 million tons in 2012 [42,30]. Thus, the problem is that only around one tenth of these e-wastes were collected and taken care of [42,48,82- 84] while the remaining 90% become threat to the society and constituting wasting of resources [44,61]. In a real sense, collection of electrical and electronic waste is a sustainable process that maximizes recycling to retain valuable e-waste components in the economy and safely disposes of dangerous components [83-84]. Thus, to get rid of these adverse effects of e-waste that are generated in electrical/electronic service workshop, there is need for proper management of e-waste materials.
E-waste management
Adediran & Abdulkarim [56] submitted that e-waste management is a process of reducing, reusing and recycling of e-waste. Obaje [37]; Waste Management [85] opined that e-waste management is an effective recovery of all reusable materials from old, nonfunctioning, abandoned and disposed electrical/electronic equipment; and safe disposal of the hazardous substances in them to prevent such toxic material from contaminating the environment. Management of e-wastes involves collection, keeping, treatment and disposal of electrical/electronic waste/ scraps in a safe manner to repudiate/prevent human and its environment from harmful effect e-waste [86,87]. Meanwhile, the practices adopted by electrical/electronic technicians in their workshops to manage e-waste generated seem to be illegal, primitive and unsafe. Anwesha & Pardeep [78]; Sepúlveda, Schluep & Renaud [88] claimed that a persistent increase in legal and illegal trade of waste electrical and electronic equipment (WEEE) worldwide has caused equally increasing concern of poor WEEE management techniques. Scholars claimed that unsafe, unregulated and unaccountable collection, processing, and redistribution of old or abandoned electrical/electronic equipment are performed by workers at temporary sites, resi dences, workshops, and open public spaces [44]. Thus, Heacock, Kelly & Asante, et al. [44]; Solving the E-Waste Problem, StEP, Initiative [89] submitted that general practices of e-waste management among the populaces include using acid baths, burning cables, breaking of e-waste item into smaller parts using forceful approach, and dumping of e-waste materials into an unjustifiable position. Meanwhile, these workers may have embarked on e-waste risky processes and practices due to some challenges they may likely to have been facing such as lack of required knowledge, little or no access to latest technology and personal protective equipment among others [44,90]. However, the studies reviewed expatiated on unsafe practices of general public regarding e-waste management and challenges they might be encountered while managing on e-wastes management. Thus, none of these studies empirically claimed the common practices of electrical/electronic technicians regarding e-waste management in Nigeria. One of the focus of this study was to determine the common practice adopted by electrical/electronic technicians to manage e-waste in their workshops and, the challenges which electrical/electronic technicians were encountering over e-waste management in their service workshops.
Azodo, Ogban & Okpor [88]; Okwesili, Ndukwe & Nwuzor [91] asserted that management of e-wastes focused on efforts of concerned people through conscious and systematic attempt in maintaining and sustaining an aesthetic, economically viable, physically healthy, conducive and safe environment for living. Hossain, Al-Hamadani & Rahman [42]; India Central Pollution Control Board [92]; Nnorom & Osibanjo [61]; Pinto [93] claimed that reclaiming some of the e-wastes materials and recycling them appropriately will mitigate the severe effect of e-waste on living things including plant and animals and their environment. Hossain, Al-Hamadani & Rahman [42] submitted that proper management of these e-wastes is important for the purpose of getting free from hazardous chemicals effect they possessed. Obaje [37]; Opara [94] claimed also that failure to effectively manage e-waste can leads to adverse environmental deterioration, depletion of potentially valuable resource base for secondary equipment and by extension serves as blocking stone for the attainment of sustainable development.
The goal three and eleven of sustainable development (agenda 2030) declared in September 25-27, 2015 at United Nation Head Quarters, New York emphasized that quality and healthy living and well-being for all at all ages; and inclusive, safe, resilient and sustainable cities and human settlements must be the ultimate priority of all nations including Nigeria [95-103]. The target for attaining these goals among others includes strengthening the capacity of all countries, in particular developing countries, for early warning, risk reduction and management of national and global health risks; and reduces the adverse per capita environmental impact of cities, including paying special attention to air quality and municipal and other waste management [101-102]. However, there is need to device appropriate management techniques for e-waste materials in electrical/electronic workshops globally and in Nigeria to be specific. This will go a long way in helping nations including Nigeria to achieve the sustainable healthy environment which goal three and eleven of agenda 2030 of sustainable development is advocating.
Anwesha & Pardeep [76] explained that the appropriate management measures of e-waste include establishment of stringent regulations. United Nations Environment Programme, UNEP, [104] opined that strengthening the political cooperation of a country to promote capacity building among workers and enhance public and private investment on safe and environmentally careful waste management technology will reduce adverse effect of e-waste. Also, Alabaster, Asante & Bergman et al. [105] recognized that bringing poverty to minimum level will alleviate the e-waste challenge in the long-term. Heacock, Kelly & Asante [44] submitted that raising the awareness and regulation of trans-boundary movement and disposal of hazardous and other wastes is a critical means of managing e-waste. Thus, portion of this study would empirically determine the techniques required to manage e-wastes in electrical/electronic service workshops in Nigeria. This is because none of existing studies has ever investigated on techniques for managing e-waste in technician’s workshops. However, the purpose of this study was to advance electrical/electronic waste management techniques among electrical/electronic technicians’ workshops for sustainable healthy society. Specifically, the study sort to address the following research questions:
a) What are the hazardous status of e-waste components in electrical/electronic technicians’ workshops base on their level of abundance?
b) What are the hazardous effect of e-waste in electrical/ electronic technicians’ workshops to human and its environment?
c) What are the common practices adopted by electrical/ electronic technicians to manage e-waste in their workshops?
d) What are the challenges which electrical/electronic technicians encountered over e-waste management in their workshops?
e) What are the e- waste management techniques required in electrical/electronic workshops?
Paul [106] claimed that demographic measures typically are used to identify key respondent characteristics that might influence opinion and/or are correlated with behaviours and experiences. Demographic measures include age, type of school, gender, level of academic study, race and educational attainment among other [106-107]. Thus, this study will test influence of qualification, experience, age and occupation on respondents’ opinions on advancement of waste management techniques in electrical/electronic’ workshops for sustainable Nigerian health society.
Hypotheses
a) HA1 Qualification, experience, age and occupation would significantly influence opinion of engineering lecturers and public health officers on hazardous status of e-waste components base on their level of abundance in electrical/electronic technicians’ workshops.
b) HA2 Qualification, experience, age and occupation would significantly influence opinion of engineering lecturers and public health officers on hazardous effect of electrical/electronic waste in electrical/electronic technicians’ workshops.
c) HA3 Qualification, experience, age and occupation would significantly influence opinion of engineering lecturers and public health officers on common practices adopted by electrical/electronic technicians to manage e-waste in their workshops.
d) HA4 Qualification, experience, age and occupation would significantly influence opinion of engineering lecturers and public health officers on challenges which electrical/electronic technicians encountered over e-waste management in their workshops.
e) HA2 Qualification, experience, age and occupation would significantly influence opinion of engineering lecturers and public health officers on e- waste management techniques required in electrical/electronic workshops.
Materials and Methods
The study adopted Descriptive Survey research design. The study was conducted in Nigeria. Nganzi [108]; Gall, Gall & Borg [109] opined that descriptive surveys research design can be used to collect detailed and factual information that describes an existing phenomenon- their form, actions, changes over time and similarities with other phenomena- from all or a chosen number of the population of the concerned universe. Descriptive survey research design was adopted in this study because information regarding e-waste management was collected from experts using questionnaire. The study sampled one hundred and forty-one participants which included 54 public health officers and 87 engineering lecturers in five Nigerian universities: 20 lecturers from Metallurgical and material engineering, 35 lecturers from Civil engineering and 32 lecturers from Electrical/ electronic engineering in Nigeria. The study adopted structured questionnaire as instrument for data collection. The instrument was divided into Part 1 and 2. Part 1 of the instrument was used to receive demographic information of research participants while Part 2 of the instrument was divided into five sections-A, B, C, D and E- to illicit participant responses on hazardous status of e-waste component, hazardous effect of e-waste components, common practice adopted by electrical/electronic technicians to manage e-waste material, challenges encountered by technicians over e-waste management and e-waste management techniques required in electrical/electronic workshops respectively. Questionnaire items were subjected to face and content validity through the help of three experts from two Nigerian universities. The internal consistency of instrument was checked using Cronbach Alfa method. Thus, 0.76, 0.81, 0.69, 0.85 and 0.70 reliability coefficient estimate were obtained for section A, B, C, D and E respectively. Meanwhile, 0.79 was obtained as reliability coefficient estimate for the overall instrument. The instrument was administered using interpersonal contact by researchers and three research assistants. Researcher ensured consent of research participants using interpersonal discussion before the questionnaire is administered and through consent letter attached to the questionnaire. Data obtained were analyzed using statistical software SPSS 22. The research questions were answered using mean, standard deviation and percentage. Meanwhile, t-test and analysis of variance (ANOVA) were used to analyze the data at 0.05 level of significance. 50 percent, being the average percentage value, was considered as cutoff point before any item in section A could be considered as strongly belong to any response category.While the average mean value (cut-off point) decision for section B, C, D and E was 1 2 3 4 5 3.0 2 + + + + =
Presentation of Result
Table 1 shows detail demographic profile of research participants. Specifically, the table illustrated two group of participants-87 engineering lecturers which comprises of 20 metallurgical and material lecturers, 35 civil engineering lecturers and 32 electrical/electronic lecturers; and 54 public health officers. The participants, in regard to experience distribution, has 9 bachelor’s degree holders, 86 master’s degree holders and 46 PhD holders. The study participants, regarding experience distribution, comprised six participants with 0-9 years of experience, ninety-nine participants with 10-19 years of experience, nine participants with 20-29 years of experience and twenty-seven participants with 30 and above years of experience. Finally, in regard to age distribution, three of participants fell within the age range of 20-30, eleven participants fell within the age range of 31 and 40, eighty four participants fell within the age range of 41-50, thirty nine participants fell between the age ranges of 51- 60 and 4 participants fell within the age range of 61-70.
Data in Table 2 revealed that respondents agreed that all the 34 components of e-waste are hazardous except aluminum. Specifically, lead, mercury, glass and organophosphorus had percentage ratings ranged between 66.6% and 95% under the category of ‘hazardous when slightly abundant’. This depicted that these components are hazardous and can intoxicate the environment irrespective of the volume and quantity. Iron, copper, wood, yttrium, zinc, chlorobenzene and radioactive elements had percentage ratings ranged between 63.6% and 90.8% under the category of ‘hazardous when moderately abundant’. This indicated that these components are hazardous but can intoxicate the environment only when they are fairly or averagely abundant. Also, toner dust, cadmium, brominated flame among other components of e-waste had percentage ratings ranged between 61.0% and 95% under the category of ‘hazardous when largely abundant’. This illustrated that these components are hazardous but can intoxicate the environment only when they are largely or excessively abundant. Meanwhile, aluminum had percentage ratings of 68.8% under the category of ‘not hazardous regardless of state of abundant’. This depicted that aluminum cannot intoxicate the environment regardless of the volume and quantity. Many scholastic reports supported this finding. Reports claimed that over 60% of the total weight of most of e-waste consists of iron, gold, aluminum, copper, lead, mercury, beryllium, cadmium, chromium and brominated flame retardants, of which 2.7% are pollutants [27,110-114] and cause severe hazard to ecosystems with the attendant environmental health risk to wildlife and humans [38,94,115]. The composition of electronic wastes is mostly in various forms and types, containing more than 1,000 different toxic and non-toxic substances [42,116]. Also, gases releases from e-wastes component like polycyclic aromatic hydrocarbons (PAH), brominated flame retardants (BFRs), polychlorinated biphenyls (PCBs) and polychlorinated dibenzo- p-dioxins and furans (PCDD/ Fs) among others affects bio-physical environments and cause detrimental effects to human health [42,117]. Furthermore, scholars reported that some of toxic heavy metals found in e-waste include copper, beryllium, lead, tin, cadmium, brominated flame retardants, antimony, barium, and mercury [25,118]. Obaje [37]; Puckett, Westervelt, Gutierrez & Takamiya [32]; Terada [65] reported that polychlorinated biphenyl (PCB) exported to Koko area of Delta State, Nigeria in June 1988 was hazardous and caused death of cancer to people of the community.
Table 3 showed that the hazardous effect of e-waste in electrical/electronic workshops stood at mean value of (4.49±0.51). Meanwhile, the mean rating for each item stood at mean values ranged between (4.14±0.35) and (4.63±0.48). This depicted that all the 25 items had mean ratings above the cut-off point of 3.0 and were considered by respondents as hazardous effect of e-waste in electrical/electronic technicians’ workshops to human and its environment. United Nations Environment Programme [49] supported this result and herein reported that failure to care for solid wastes including e-waste incurs a severe penalty, later, in the form of resources needlessly lost, foul odours and unsightliness and contamination of air, water, and soil resources. Individuals who live near or on disposal sites, are infected with gastrointestinal parasites, worms, and related organisms [49]. Furthermore, study found that 36.3% of 1,000 women living near the informal recycling sites experienced stillbirths in the Sylhet region of Bangladesh and 64% had hearing and/or vision problems [42,119-121]. Also, burnt e-wastes produce smoke, dust or carbon particles from toners consist of carcinogens and other hazardous chemicals which causes severe inflammations and lesions including many respiratory, lung and skin cancer and diseases [68].
Table 4 showed that the common practices adopted by electrical/electronic technicians to manage e-waste in workshops stood at mean value of (4.12±0.61). Meanwhile, the mean rating for thirteen items (item 1, 2, 3 4, 5, 6, 7, 8, 9, 10, 11, 13 and 14) stood at mean values ranged between (3.19±0.51) and (4.56±0.50). This proclaimed that all thirteen items had mean ratings above the cut-off point of 3.0 and were considered by respondents as common practices adopted by electrical/electronic technicians to manage e-waste in workshops. Meanwhile, item 12 had rating value (2.34±0.91) bellow the cutoff value of 3.00 and was not considered by respondents as common practices adopted by electrical/electronic technicians to manage e-waste in workshops. The scholars Needhidasan, Melvin & Ramalingam [27]; Sivakumaran [68] supported this finding wherein reported that dismantling of e-wastes takes much labor, in countries like China and in some parts of India where big quantity of tons of e-wastes are junked, dismantled, shredding, tearing and burning. Needhidasan, Melvin & Ramalingam [27]; Sinha-Khetriwal [73] reported that in Mumbai metropolis alone, people throw away 19,000 to 20,000 tons of electronic waste every month. Babatunde [25] reported that uncontrolled burning, disassembly and disposal which are common in the society can cause environmental and health problems. Also, Edward-Ekpu [64] reported that in Nigeria, a lot of e-waste are also stockpiled in offices and homes.
Table 5 showed that the challenges which electrical/electronic technicians encounter over e-waste management stood at mean value of (4.62±0.44). Meanwhile, the mean rating for each item stood at mean values ranged between (4.40±0.49) and (4.94±0.23). This depicted that all the 10 items had mean ratings above the cut-off point of 3.0 and were considered by respondents as challenges which electrical/electronic technicians encounter over e-waste management in workshops. Thus, this result was supported by scholars and scientist in the field of waste management. Obaje [37] submitted that e-waste is a major problem in Nigeria today because there is very low level of awareness of the hazards and health risk associated with e-waste. Needhidasan, Melvin & Ramalingam [27] reported that people who are working with e-waste sector are the urban poor with very low literacy levels and hence have very little awareness regarding the hazards of e-waste toxins. Babatunde [25] reported that one of the challenges facing e-waste management in Nigeria is lack of public awareness by manufacturers and consumers on the inherent dangers of handling and trading in e-waste and lack of a comprehensive e-waste management regulation or legislation in Nigeria to regulate, control and prohibit the flow of used consumer electronic products within Nigeria. E-waste collection in Nigeria is not organized because there are no collection centres for e-waste materials and this however caused most of e-wastes to be dumped along with other wastes [64].
Table 6 revealed that the e-waste management techniques required in electrical/electronic workshops stood at mean value of (4.43±0.49). Meanwhile, the mean rating for each item stood at mean values ranged between (4.03±0.58) and (4.96±0.20). This proclaimed that all the 34 items had mean ratings above the cut-off point of 3.0 and were considered by respondents as e-waste management techniques required in electrical/electronic workshops. The reports of past research supported the present findings. Manfred [122] supported this finding and herein reported that waste management service is falling too short of the desired level of efficiency and satisfaction resulting in problems of health, sanitation and environmental degradation due to absence of serious efforts from necessary authorities. Thus, Needhidasan, Melvin & Ramalingam [27] reported that technical and policy-level interventions, implementation and capacity building and increasing the public awareness can convert this challenge of massive e-waste generated into an opportunity. Babatunde [25] recommended that government should establish regulatory framework, through relevant agencies to manage e-waste and permanent e-waste collection facilities should be provided at strategic locations and usage of such facilities should be enforced. Ewuim, Akunne, Abajue, Nwankwo & Faniran [39] submitted that mass education and awareness should be created by regulatory bodies and government on inherent dangers of poor e-waste management on the environment.
Table 7 shows the summary of analysis of t-test and one-way between-groups analysis of variance that was conducted to explore the influence of qualification, experience, age and occupation of public health officers and engineering lecturers on their response to research questions. Participants were divided into three, four, five and two groups according to their qualification, experience, age and occupation respectively.
Hypothesis 1
Thus, qualification statistically influenced the response of engineering lecturers and public health officers on hazardous status of e-waste components in electrical/electronic workshops base on level of abundance: F (2,138) = 6.688; Sig.= 0.002. Experience statistically influenced the response of engineering lecturers and public health officers on hazardous status of e-waste components in electrical/electronic workshops base on level of abundance: F (3,137) = 8.018; Sig.= 0.000. Age statistically influenced the response of engineering lecturers and public health officers on hazardous status of e-waste components in electrical/electronic workshops base on level of abundance: F (4,136) = 24.228; Sig.= 0.000. Meanwhile, occupation did not statistically influence the response of engineering lecturers and public health officers on hazardous status of e-waste components in electrical/electronic workshops base on level of abundance: F (139, 90.976) = 0.232; Sig.= 0.631.
Hypothesis 2
Qualification statistically influenced the response of engineering lecturers and public health officers on hazardous effect of e-waste in electrical/electronic technicians’ workshops: F (2,138) = 7.384; Sig.= 0.001. Experience statistically influenced the response of engineering lecturers and public health officers on hazardous effect of e-waste in electrical/electronic technicians’ workshops: F (3,137) = 11.573; Sig.= 0.000. Age statistically influenced the response of engineering lecturers and public health officers on hazardous effect of e-waste in electrical/electronic technicians’ workshops: F (4,136) = 11.365; Sig.= 0.000. Meanwhile, occupation did not statistically influence the response of engineering lecturers and public health officers on hazardous effect of e-waste in electrical/electronic technicians’ workshops: F (139, 110.082) = 0.145; Sig.= 0.704.
Hypothesis 3
Qualification did not statistically influence the response of engineering lecturers and public health officers on common practices adopted by electrical/electronic technicians to manage e-waste in the workshops: F(2,138)= 0.556; Sig.= 0.575. Experience did not statistically influence the response of engineering lecturers and public health officers on common practices adopted by electrical/electronic technicians to manage e-waste in the workshops: F(3,137)= 0.700; Sig.= 0.553. Age did not statistically influence the response of engineering lecturers and public health officers on common practices adopted by electrical/electronic technicians to manage e-waste in the workshops: F(4,136)= 0.923; Sig.= 0.453. Also, occupation did not statistically influence the response of engineering lecturers and public health officers on common practices adopted by electrical/ electronic technicians to manage e-waste in the workshops: F(139,104.969)= 0.627; Sig.= 0.430.
Hypothesis 4
Qualification statistically influenced the response of engineering lecturers and public health officers on challenges which electrical/electronic technicians encounter over e-waste management: F(2,138)= 9.809; Sig.= 0.000. Age statistically influenced the response of engineering lecturers and public health officers on challenges which electrical/electronics technicians encounter over e-waste management: F(4,136)= 4.856; Sig.= 0.001.Meanwhile, experience did not statistically influence the response of engineering lecturers and public health officers on challenges which electrical/electronic technicians encounter over e-waste management: F(3,137)= 0.319; Sig.= 0.812. Also, occupation did not statistically influence the response of engineering lecturers and public health officers on challenges which electrical/electronic technicians encounter over e-waste management: F(139, 113.799)= 0.084; Sig.= 0.773.
Hypothesis 5
Qualification statistically influenced the response of engineering lecturers and public health officers on e-waste management techniques required in electrical/electronic workshops: F(2,138)= 24.196; Sig.= 0.000. Age statistically influenced the response of engineering lecturers and public health officers on e-waste management techniques required in electrical/electronic workshops: F(4,136)= 17.938; Sig.= 0.000.Meanwhile, experience did not statistically influence the response of engineering lecturers and public health officers on e-waste management techniques required in electrical/electronic workshops: F(3,137)= 0 .781; Sig.= 0.507. Also, occupation did not statistically influence the response of engineering lecturers and public health officers on e-waste management techniques required in electrical/electronic workshops: F(139, 113.799)= 0.095; Sig.= 0.757. Omenogo [28], while comparing the practices of two tertiary institutions in Nigeria on e-waste management, reported that institution was not a determining factor on whether a department keep records of discarded electronic equipment and records of stored out of use electronic items. Ohajinwa, Peter, Martina & Willie [123] reported also that health risk awareness level of the e-waste workers was significantly lower compared with their counterparts in the same informal sector. Thus, this study has commonalities with those previous studies.
Conclusion
The study investigated advancement of electrical/electronic waste management techniques among electrical/electronic technicians’ workshops for sustainable healthy society. The study uncovered the hazardous status of many composition of electronic waste materials based on the level of abundance. The study also revealed empirically the hazardous effect of e-waste materials in electrical/electronic workshops. Also, study confirmed the common e-waste practices among electrical/electronic technicians in their workshops and the challenges they are facing on e-waste management. Finally, this study discovered e-waste management techniques required for managing e-waste materials in electrical/electronic workshops. This study was geared purposely to reconstruct our society for sustainable and conducive living.
Limitation of the study
The study adopted survey research design wherein questionnaire was used. This was not the best. There was part of this study that required pure and in-depth laboratory investigation. Thus, future study can be centered on this regard.
To Know More About Insights in Mining Science & Technology click on: https://juniperpublishers.com/imst/index.php
To Know More About Open Access Journals Please click on:
https://juniperpublishers.com/index.php
#Juniper Publishers#Open Access Journals#Juniper publisher reviews#Journal of mining science#Mining Science & Technology#Peer review Journals
0 notes
Last Seen Blogs

daniratimorleste
Hau Hadomi Timor-Leste

dwficfinder
Doctor/Rose Fic Finder

dariemkova
the adorable one

danni-poetry-maybe
Poetry?

get-toe
Kei-chan!