#LifeExpectancy
Explore tagged Tumblr posts
Visit Tumblr Blog
Explore Tumblr blogs with no restrictions, modern design and the best experience.
Last Seen Tumblr Blogs


Fun Fact
US Tumblr user growth rate is estimated to slow down to 4.1%.
Text
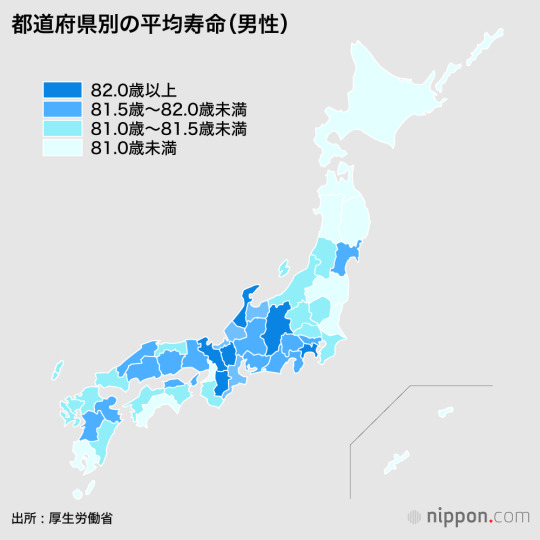


Sean bienvenidos japonistasarqueologicos a una nueva actualidad del país del sol naciente, en esta ocasión en el tema de actualidad de esta opción será la natalidad y de cómo afectará al país dicho esto pónganse cómodos que empezamos. - La esperanza de vida en Japón es la más alta del mundo, llegando a los 100 años, lo cual lo convierte en el país más longevo del mundo, Japón para 2046, según nuevos estudios llevados a cabo por National Geographic, será de 37.5% de población envejecida. - La tasa de natalidad y los estudios realizados por Statista Research Department en septiembre 29, 2022 natalidades son de 1,69. Seguramente llegue a un punto en el que se llegará a un equilibrio entre la tasa de natalidad y la tasa de mortalidad. - ¿Cuál será el destino de Japón? ¿Qué opinan al respecto? Espero que os haya gustado y nos vemos en próximas publicaciones que pasen una buena semana. - 今回は「出生率」と「出生率の推移」についてです。 - 日本の平均寿命は、それが世界で最も長く生きている国になり、100年に達し、世界で最も高いです、日本は2046年までに、ナショナルジオグラフィックが実施した新しい研究によると、人口の37.5%が高齢化されることになります。 - 2022年9月29日にStatista Research Departmentが行った研究によると、出生率・出生数は1.69である。おそらく、出生率と死亡率が均衡する地点に達するだろう。 - 日本の運命はどうなるのか、あなたはどう思いますか?私はあなたがそれを好きで、将来の記事であなたを参照してください願っています良い週を持っています。 - Welcome japanistasarqueologicos to a new news from the country of the rising sun, this time the topic of this option will be the birth rate and how it will affect the country, that said, make yourselves comfortable and let's start. - Life expectancy in Japan is the highest in the world, reaching 100 years, which makes it the longest living country in the world, Japan by 2046, according to new studies conducted by National Geographic, will be 37.5% of the population aged. - The birth rate and birth rates are 1.69, according to studies conducted by Statista Research Department on September 29, 2022. It will probably reach a point where a balance will be reached between the birth rate and the death rate. - What will Japan's fate be, and what do you think about it? I hope you liked it and see you in future posts have a good week.
#japan#birthrate#birthrates#lifeexpectancy#country#statistics#nationalgeographic#graphic#current#unesco#日本#出生率#平均寿命#国#統計#全国地理#グラフ#現在#ユネスコ#人口#健康#高齢化#不死率#population#health#ageing#mortalityrates#photography
32 notes
·
View notes
Text
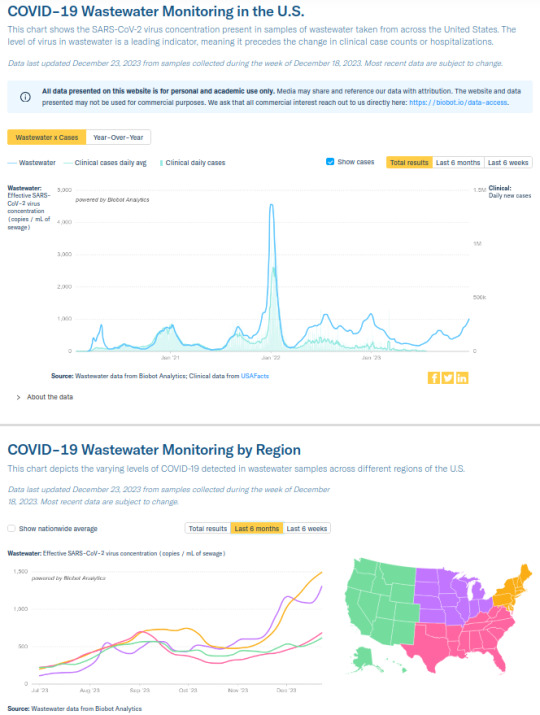
Weekly COVID-19 Update for 2023-12-24
COVID is still airborne, and COVID still very much isn't over.
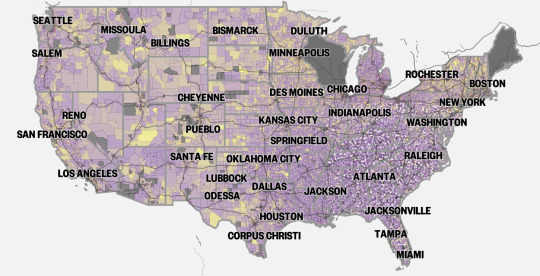
Northeastern and Midwestern USA SARS2 virus levels in wastewater are *soaring*, Northeast is currently at 1500 copies/mL (~750 copies indicates a strong surge), and Midwest is at 1300 copies/mL. Southeastern and Western USA are maintaining relatively lower levels between 600 and 700 overall, but both are still climbing. See https://biobot.io/data for county-specific data as results can vary widely between locales.
How to reduce your risk of infection? The SARS2 virus is airborne and can spread like smoke, so #MaskUp with an #N95 or better, avoid superspreader events and locations, and stay up-to-date on your boosters. Do it for yourself, so you don't catch SARS-CoV-2, and for others, so you don't spread SARS-CoV-2. Even if you're fully vaccinated, your risk of developing #LongCOVID following an infection is lower but not zero, and multiple reinfections increase your odds of negative health outcomes. Plan A always should be to prevent an infection from developing by wearing a respirator with a good seal around your mouth and nose (FFP2, FFP3, KN95, N95, N99, P100, etc.).
Holiday tips:
-If someone tells you that COVID is over, you might ask them why, if we didn't consider COVID to be over in 2020 or 2021, when the COVID wastewater levels were lower, why should we consider it over now, when the virus is circulating in even higher amounts?
-"Fewer cases" doesn't mean much when most of the at-home rapid tests don't get counted in official records, and the most accurate PCR tests are neither freely available nor given to everyone getting on a plane or attending classes.
-"Fewer deaths" also means less when you remember that about 1,200,000 of the most vulnerable people already have died from it, COVID-19 remains the #3 cause of death in 2023 (behind heart disease and cancer, the risk of both of which may be increased by COVID), and the risk of a Long COVID/post-acute COVID syndrome (PACS) disability or other potentially life-shortening organ damage (brain, kidney, lung, immune, etc.) isn't measured just by the death count. Also, the USA's life expectancy still hasn't recovered from the drop it experienced following the start of the pandemic.
source: https://biobot.io/data
source: https://www.webmd.com/a-to-z-guides/news/20231006/these-are-the-top-10-causes-of-death-in-the-us
source: https://publichealth.jhu.edu/2022/covid-and-the-heart-it-spares-no-one
source: https://pubmed.ncbi.nlm.nih.gov/33914346/
source: https://www.usatoday.com/story/news/nation/2023/11/29/average-us-life-expectancy-increased-not-pre-covid/71738611007/
#covid#pandemic#corona#coronavirus#sarscov2#publichealth#science#disease#covidisntover#virus#medicine#sars2#covidisairborne#covidisnotover#health#lifeexpectancy
47 notes
·
View notes
Text

Russia declassifies life expectancy statistics http://dlvr.it/TJlb03
0 notes
Text
Time to Rock some Power BI
0 notes
Text

Title : What is the relationship between income per person and life expectancy across different countries? Explanantion: The scatter plot below visually represents the relationship between income per person and life expectancy. It shows that as income increases, life expectancy generally tends to rise, indicating a positive correlation.
Observations:
Countries with higher income per person generally have a higher life expectancy.
There are a few outliers where life expectancy is low despite moderate income levels.
1 note
·
View note
Text
Men's average life expectancy is 3 to 7 years less than women's. Discover the reasons behind this gap, from lifestyle choices to job-related risks, and learn how we can address men's health issues.
youtube
0 notes
Text

In the second edition of #𝐦𝐨𝐧𝐝𝐚𝐲𝐟𝐚𝐜𝐭𝐬 we take a look at the countries with the highest average life expectancy in 2023 according to Worldometer:
��🇰 Hong Kong: 85.83
🇲🇴 Macao: 85.51
🇯🇵 Japan: 84.95
🇨🇭 Switzerland: 84.38
🇸🇬 Singapore: 84.27
🇮🇹 Italy: 84.20
🇰🇷 South Korea: 84.14
🇪🇸 Spain: 84.05
🇲🇹 Malta: 83.85
🇦🇺 Australia: 83.73
0 notes
Text
Losing weight increases life expectancy.
It indeed depends on how much weight you need to lose and other lifestyle factors. However, if you follow some simple rules, for example, someone who is obese (BMI of 30 or over) and loses 5–10% of their body weight will see significant improvements in health and life expectancy. If you're already at a healthy weight (BMI below 25), then losing weight probably won't have much of an impact on your longevity, but that doesn't mean you have to give up your healthy lifestyle. There are a few different ways that losing weight can help you live longer:
1. By reducing the risk of developing obesity-related diseases such as type 2 diabetes
2. heart disease and certain types of cancer
3. It helps you maintain healthy blood pressure, cholesterol, and blood sugar levels.
4. It gives you more energy and improves your overall mood and quality of life.

Read more about life expectancy in this article
1 note
·
View note
Text

India Ageing Report 2023
#indiaageingreport2023#indiaageingreport#lifeexpectancy#qualitylife#WorkingAge#unitednationpopulationfund#internationalinstituteforpopulationscience#longitudinal#ageing#surveyinindia#ageingpopulation#upsc#upscprelims#upscprelims2024#upscmains#upsc2024#upscaspirants#currentaffairsforupsc#dailynews#generalknowledge#infographic#india
0 notes
Text
You Are Likely To Live Longer Than You Think, According To Minister Mette Kierkgaard #10thArddMeeting #ArddMeeting #DayFourOfThe10thArddMeetingFeaturingMinisterMetteKierkgaard #lifeexpectancy #MinisterMetteKierkgaard #YouAreLikelyToLiveLongerThanYouThink
#Other#10thArddMeeting#ArddMeeting#DayFourOfThe10thArddMeetingFeaturingMinisterMetteKierkgaard#lifeexpectancy#MinisterMetteKierkgaard#YouAreLikelyToLiveLongerThanYouThink
0 notes
Text
How long people in your city are expected to live?
0 notes
Text
Walking RX, Hobbies, Life-Expectancy
Scientific evidence shows that walking is brain medicine. It grows brain cells, boost creativity, and enhances your mood. Are you ready to get up and get going? Do you have a hobby? If you could do anything just for fun, what would it be? Discover what hobbies may be waiting for you with simple strategies from experts. You’ll be healthier and happier. Living a long life in America is at its 100…

View On WordPress
https://www.voiceamerica.com/episode/145165/walking-rx-hobbies-life-expectancy
#empowerment#geographybe the star you are#growingwiththegoddessgardener#hobbies#lifeexpectancy#livinglonger#medicine#voice America network#Keywalking
0 notes
Text

Do married men live longer than single men? http://dlvr.it/TJbtr8
0 notes
Text


#ourworldindata, #LifeExpectancy,#Tunisia
How does Tunisia's life expectancy stack up against that of the world and Africa?
0 notes
Text
The Interplay of Socioeconomic Status and Alcohol Consumption: Implications for Life Expectancy
I’ve chosen the NESARC dataset about life expectancy associated with alcohol consumption. This dataset is rich and provides a lot of interesting variables to explore.
This is a topic that has always intrigued me and I believe this dataset provides a great opportunity to explore it further.
CodeBook
Variable Name
Description
alcconsumption
2008 alcohol consumption per adult (age 15+), litres
lifeexpectancy
2011 life expectancy at birth (years)
Questions:
Is there a correlation between per capita income (income_per_person) and life expectancy (life_expectancy)?
How does alcohol consumption (alcohol_consumption) vary with per capita income (income_per_person)?
Is there a correlation between the level of education (education_level) and alcohol consumption (alcohol_consumption)?
How does alcohol consumption (alcohol_consumption) affect life expectancy (life_expectancy)?
Is there a difference in alcohol consumption (alcohol_consumption) and life expectancy (life_expectancy) between genders (gender)?
Variables:
Per capita income (income_per_person)
Life expectancy (life_expectancy)
Alcohol consumption (alcohol_consumption)
Level of education (education_level)
Gender (gender)
incomeperperson
This is the Gross Domestic Product per capita in constant 2000 US$
New CodeBook
income_per_person
This variable represents the per capita income for each country. It’s a numerical variable measured in international dollars, fixed 2011 prices.
life_expectancy
This variable indicates the average number of years a newborn child would live if current mortality patterns were to stay the same throughout its life. It’s a numerical variable measured in years.
alcohol_consumption
This variable represents the recorded and estimated average alcohol consumption, adult (15+) per capita consumption in liters pure alcohol. It’s a numerical variable measured in liters.
education_level:
This variable indicates the average years of schooling for adults aged 25 and older. It’s a numerical variable measured in years.
References
Hawkins, B.R., & McCambridge, J. (2023). Association Between Daily Alcohol Intake and Risk of All-Cause Mortality: A Systematic Review and Meta-analyses. JAMA Network Open.
This study found that daily low or moderate alcohol intake was not significantly associated with all-cause mortality risk, while increased risk was evident at higher consumption levels, starting at lower levels for women than men.
Murakami, K., & Hashimoto, H. (2019). Associations of education and income with heavy drinking and problem drinking among men: evidence from a population-based study in Japan. BMC Public Health.
The study revealed that lower educational attainment was significantly associated with increased risks of both non-problematic heavy drinking and problem drinking. Lower income was significantly associated with a lower risk of non-problematic heavy drinking, but not of problem drinking.
Nooyens, A.C.J., Bueno-de-Mesquita, H.B., van Boxtel, M.P.J., van Gelder, B.M., Verhagen, H., & Verschuren, W.M.M. (2020). Alcohol consumption in later life and reaching longevity: the Netherlands Cohort Study. Age and Ageing.
The study found that in women, the total consumption of alcoholic beverages was inversely associated with the decline in global cognitive function over a 5-year period. Red wine consumption was inversely associated with the decline in global cognitive function as well as memory and flexibility.
Rigelsky, M., & Zelenka, V. (2021). Does Alcohol Consumption Affect Life Expectancy in OECD Countries. ResearchGate.
The research concluded that higher income was associated with greater longevity throughout the income distribution. The gap in life expectancy between the richest 1% and poorest 1% of individuals was 14.6 years for men and 10.1 years for women.
Chetty, R., Stepner, M., Abraham, S., Lin, S., Scuderi, B., Turner, N., Bergeron, A., & Cutler, D. (2016). The Association Between Income and Life Expectancy in the United States, 2001-2014. JAMA.
The study found that higher income was associated with greater longevity, and differences in life expectancy across income groups increased over time. Life expectancy for low-income individuals varied substantially across local areas
Given the variables selected from the Gapminder dataset life expectancy, alcohol consumption, and income per person.
Hypothesis
The socioeconomic status, characterized by factors such as income and education, along with lifestyle choices like alcohol consumption, significantly impacts an individual’s life expectancy and overall health. Specifically, higher income and education levels may be associated with lower risks of heavy and problematic drinking, which in turn could lead to increased longevity. However, the relationship between alcohol consumption and health outcomes might be complex and influenced by factors such as the type and amount of alcohol consumed, and the individual’s overall lifestyle and genetic predisposition.
2 notes
·
View notes