#IBM Cognos Analytics
Explore tagged Tumblr posts
Visit Tumblr Blog
Explore Tumblr blogs with no restrictions, modern design and the best experience.
Last Seen Tumblr Blogs


Fun Fact
130K people were victims of a chain letter scam that affected Tumblr in May 2011.
Text
Apa Itu IBM Cognos Analytics?
Sebagai software, IBM Cognos Analytics adalah salah satu tool terdepan yang digunakan untuk mendukung proses Business Intelligence (BI). Dalam ranah bisnis yang terus berkembang, pemahaman mendalam terhadap data dan analisis merupakan hal yang krusial bagi kesuksesan perusahaan. IBM Cognos Analytics hadir sebagai solusi yang tidak hanya mempermudah pengelolaan data, tetapi juga memberikan wawasan…

View On WordPress
0 notes
Text
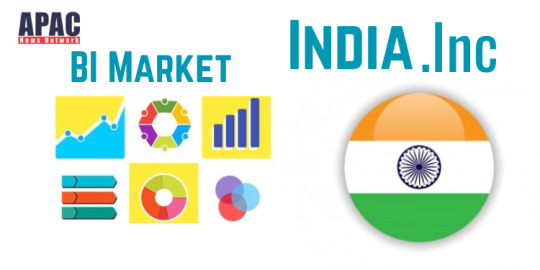
BI Market Explodes as India Inc. Analyzes Deeper
APAC News Network analyzes the Indian BI analytics market is poised for an explosive growth as Indian enterprises increasingly look at data driven insights to grow their businesses.
Rajneesh De, Consulting Editor, APAC News Network
The big data analytics market in India, just like globally, is marching at a fast pace. Enterprises today value information as a critical business asset. Big Data analytics has therefore emerged as an essential competency for enterprises today. Enterprises in India are today continuously striving to respond in constantly shifting business situations. This has led to creation of a modern enterprise data ecosystem so that data is up-to-date and the enterprise is ready to make informed decisions.
Adapting to major ongoing trends in analytics will enable enterprises to better react and pre-act. Data and analytics have become the key ingredients for this breakthrough. The direct corollary to this has been the growth of the analytics and BI market in India. These enterprises are currently employing big data and analytics as an advantageous practice to gain a competitive edge over their industry competitors by putting the data to the right use.
In India, CIOs, CDOs, and data and analytics leaders are increasingly focusing on business outcomes, exploring algorithmic business, and most importantly building trust with the business and external partners. In particular, they are experimenting and adopting smart data discovery, augmented analytics, in-memory computing and data virtualization to stay ahead of the curve.
Read More : - https://apacnewsnetwork.com/2023/11/bi-market-explodes-as-india-inc-analyzes-deeper/
#analytics workforce in India#Analyzes Deeper#APAC Exclusive#augmented analytics#AWSBFSI continues#BI Market#BI Market Explodes as India Inc. Analyzes Deeper#BI market in India#BI market India#big data analytics market in India#Big Data Trends#Delhi NCR regionglobal BI market#IBM#IBM Watson Analytics and Cognos BI#India In#cIndian analytics BI market#Indian BI#Indian BI analytics market#Indian BI and Big Data Trends#Indian BI Market Numbers#Indian BI sector deeply#Indian currency#Salesforce#SAPSAS#smart data discovery
0 notes
Text
IBM Cognos Analytics helped Macmillan Publishers achieve

One of the “Big Five” English-language publishers and a worldwide publishing house is Macmillan Publishers. There’s a strong possibility that if you read books, one of them was published by Macmillan. The Nightingale by Kristin Hannah, Brown Bear, Brown Bear, What Do You See? by Bill Martin, and some more contemporary hits like The Silent Patient by Alex Michaelides, Identity by Nora Roberts, and Razorblade Tears by S. A. Cosby were among the numerous classics they published. The requirement for advanced business intelligence (BI) and data analytics at Macmillan is thus not surprising.
The publishing sector is using data analytics
Macmillan Publishers has a long history of investing in technology that can gather in-depth analytical information on sales, inventory, and transportation of its titles in the market due to their extensive worldwide business. The publisher has been managing its internal and external operational reporting requirements using IBM Cognos Analytics for more than ten years.
This includes their departments for finance, sales, supply chain, inventory control, and manufacturing. Additionally, the team just discovered there was a chance to go beyond centralized operational reporting in order to support additional company development. Users are clamoring for faster access to reliable and accurate data and a method to do it without heavily relying on the Central Analytics Technology team’s hectic schedule.
The publishing sector makes extensive use of analytics and a wide range of metrics, from more specialized metrics like pricing and inventory status to more widely used metrics like shipments, orders, revenue, point-of-sale, and expenses. All organizational departments make use of this data, which is crucial to their business operations. Such information helps in making crucial price choices, a variety of other crucial commercial decisions, including judgments on how many books to print initially and in what format.
Data openness and visibility degraded as corporate processes became more complicated. Additionally, data wasn’t always housed in a manner that made it easy to generate the reports needed to make sensible business choices. This resulted in our users’ needing additional analytics. Additionally, as time went on, the consumers’ need for more and more analytics rose naturally, greatly outpacing our IT team’s capacity to handle it on their own.
0 notes
Text
Reinvent Your IT Career with Premium IBM Training from Ascendient Learning
IBM, a powerhouse in technology innovation, continues to shape industries with advancements in artificial intelligence, analytics, automation, and cloud solutions. Are your skills positioned to take advantage of these revolutionary trends? Ascendient Learning’s comprehensive IBM training can ensure your career doesn't just keep pace but thrives.
Why IBM Skills Are Vital for IT Professionals Today
IBM solutions power organizations worldwide, from global enterprises to innovative startups. IBM's groundbreaking platforms — such as Watson AI, Cognos Analytics, Maximo Asset Management, and Cloud Pak solutions — have become industry benchmarks. These technologies transform operational efficiency, decision-making capabilities, and strategic growth. For IT professionals, expertise in IBM technologies directly translates into career security, advancement opportunities, and competitive salaries.
Organizations increasingly prefer certified IBM professionals to spearhead critical technology initiatives, recognizing their ability to deliver measurable results and significant value.
Award-Winning IBM Training Tailored for You
Ascendient Learning, an award-winning IBM Education Provider and recipient of IBM’s Global Training Provider Excellence Award, delivers exceptional, personalized training experiences. Whether you're exploring analytics with Cognos, improving asset management with Maximo, or delving deep into AI with Watson, our courses cater directly to your professional ambitions and skill level.
Each training module is thoughtfully designed to help you quickly grasp complex concepts through clear, practical instruction. Ascendient Learning provides flexible learning paths, ranging from foundational essentials to expert-level mastery. Our flexible formats — live instructor-led virtual classrooms, in-person workshops, and self-paced online training — accommodate your busy schedule.
Learn from Industry Experts and Gain Real-World Insight
Ascendient Learning’s IBM-certified instructors bring extensive hands-on experience into every training session. Unlike typical theoretical courses, our instructors provide real-world examples, case studies, and practical scenarios that demonstrate immediate applicability.
For instance, participants in our IBM Watson courses don’t just learn theory; they engage with real cognitive computing scenarios, solving business problems using Watson AI. Likewise, professionals mastering IBM Maximo apply their training directly to asset management situations, improving reliability, reducing maintenance costs, and maximizing operational efficiency.
Unmatched Portfolio and Learning Flexibility
Ascendient Learning offers North America's largest portfolio of guaranteed-to-run IBM courses. Our comprehensive curriculum spans data analytics, business automation, security, sustainability, IBM Power Systems, and more. Whether you aim to specialize in advanced analytics with Cognos or enhance your DevOps capabilities with IBM Cloud Pak for Automation, Ascendient Learning provides the depth and breadth of courses needed to master IBM technologies thoroughly.
Our flexible FlexCredit pricing ensures training aligns with your budget and learning objectives. You select precisely what you need when you need it, maximizing your professional development investment.
Take the Next Step: Advance Your Career with Ascendient
The future belongs to those who prepare for it today. IBM’s solutions shape industries, creating enormous opportunities for skilled professionals. Ascendient Learning ensures you're ready to seize these opportunities, transforming your expertise into career advancement and organizational impact.
Don’t wait for opportunities to come to you — create them by mastering IBM’s cutting-edge technologies. Begin your IBM training journey today with Ascendient Learning and position yourself firmly at the forefront of technological innovation.
Enroll now and become the IBM expert your organization needs.
For more information, visit: https://www.ascendientlearning.com/it-training/ibm
0 notes
Text
In-Store Analytics Market expanding rapidly—Is personalized in-store engagement here to stay
The In-Store Analytics Market Size was valued at USD 3.8 billion in 2023 and is expected to reach USD 25.9 billion by 2032, growing at a CAGR of 23.8% over the forecast period of 2024-2032.
In-Store Analytics Market is undergoing a significant transformation as brick-and-mortar retailers adopt data-driven strategies to enhance customer experience, optimize operations, and stay competitive. The rise of advanced technologies like AI, IoT, and computer vision is enabling real-time tracking of shopper behavior and store performance, giving physical retail a new edge in the digital era.
U.S. Sees Strong Growth in AI-Powered Retail Insights
In-Store Analytics Market is increasingly being seen as essential by retail decision-makers who seek deeper insights into footfall patterns, product interaction, and store layout effectiveness. With the line between online and offline retail blurring, in-store analytics serves as the bridge for delivering personalized, seamless, and data-rich shopping experiences.
Get Sample Copy of This Report: https://www.snsinsider.com/sample-request/2622
Market Keyplayers:
RetailNext Inc. (RetailNext Platform, ShopperTrak)
Microsoft Corporation (Azure Synapse Analytics, Power BI)
Oracle Corporation (Oracle Retail Analytics, Oracle BI)
SAP SE (SAP Analytics Cloud, SAP HANA)
IBM Corporation (IBM Cognos Analytics, Watson AI)
Happiest Minds Technologies (Smart Retail Solutions, Customer Analytics Services)
Capillary Technologies (InTouch CRM+, VisitorMetrix)
Scanalytics Inc. (Floor Sensor Systems, Foot Traffic Analytics)
Thinkin (Smart Shelf, Analytics Dashboard)
Stratacache (Walkbase Analytics, ActiVia Video Analytics)
Market Analysis
The market is being propelled by growing demand for enhanced customer experience and inventory optimization. In-store analytics tools—ranging from heat mapping and Wi-Fi tracking to RFID and video-based analytics—help retailers make informed decisions on staffing, product placement, and promotions. In the U.S., adoption is driven by large retail chains looking to replicate the personalization of e-commerce in physical stores. European retailers are also investing in these solutions to boost operational efficiency and meet evolving consumer expectations amid high competition and regulatory standards.
Market Trends
Surge in demand for real-time foot traffic analysis
Integration of AI and machine learning in customer behavior prediction
Adoption of omnichannel analytics for unified customer profiling
Use of facial recognition and video analytics to study shopper sentiment
Growing reliance on heat maps to optimize store layout and product visibility
Expansion of sensor-based inventory tracking for loss prevention and restocking
Increased focus on ROI measurement from in-store marketing campaigns
Market Scope
The scope of the In-Store Analytics Market continues to broaden as both large retailers and mid-sized businesses recognize the value of data-enhanced operations. The technology is being implemented not only in flagship locations but also across smaller outlets and regional chains.
Heat mapping and traffic flow optimization
Customer dwell time and conversion tracking
Advanced inventory management via RFID
In-store staff performance and scheduling analytics
Seamless integration with POS and CRM systems
Multi-location benchmarking for large chains
Forecast Outlook
The In-Store Analytics Market is poised for accelerated growth, fueled by the rising need for physical stores to deliver smarter, tech-enabled experiences. As consumer preferences shift rapidly and competition intensifies, retailers in the U.S. and Europe are scaling their analytics capabilities to adapt faster, predict demand more accurately, and personalize shopper journeys in real-time. The market's future will be marked by deeper AI integration, cloud-based solutions, and predictive insights that turn retail data into actionable strategies.
Access Complete Report: https://www.snsinsider.com/reports/in-store-analytics-market-2622
Conclusion
The evolution of retail now hinges on actionable in-store intelligence. With powerful analytics tools transforming how stores operate, the In-Store Analytics Market is no longer a luxury—it’s a strategic imperative. As retailers in the U.S. and Europe strive to exceed customer expectations while improving operational performance, investing in data-driven store optimization is the key to unlocking measurable growth and lasting brand loyalty.
About Us:
SNS Insider is one of the leading market research and consulting agencies that dominates the market research industry globally. Our company's aim is to give clients the knowledge they require in order to function in changing circumstances. In order to give you current, accurate market data, consumer insights, and opinions so that you can make decisions with confidence, we employ a variety of techniques, including surveys, video talks, and focus groups around the world.
Related Reports:
U.S.A. Sees Surging Demand for Agriculture Analytics to Revolutionize Smart Farming Practices
U.S.A Witnesses Rapid Growth in Speech Analytics Market Fueled by AI Integration and Customer Insights
Contact Us:
Jagney Dave - Vice President of Client Engagement
Phone: +1-315 636 4242 (US) | +44- 20 3290 5010 (UK)
Mail us: [email protected]
0 notes
Text

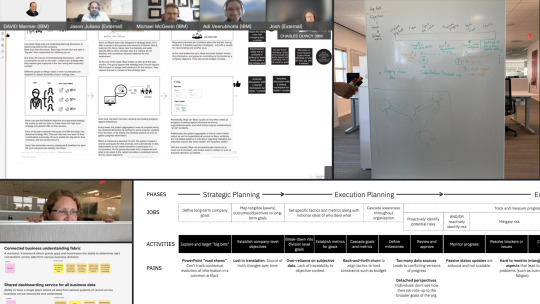
↑ IBM Business Analytics defined and pursued an exciting roadmap to reinvention, largely through a close collaboration between design and product management. Lead by strategic design, we introduced frameworks such as Jobs-To-Be-Done, 3 Horizons, Value Proposition Canvas, and Design Envisioning Sprints for a portfolio of 4 flagship products: Planning Analytics, Cognos Analytics, Controller, and Open Pages. The outcome was to future-proof these products by integrating an end-to-end business performance management cycle for our customers, using emerging technologies such as AI where they made an impact.
IBM Business Analytics
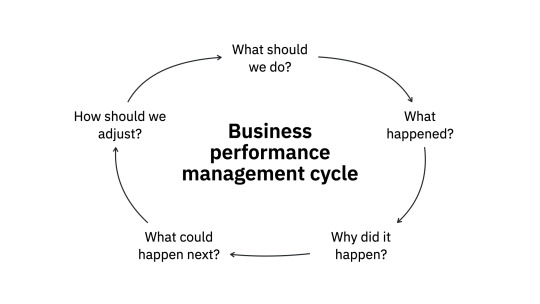
↑ The business performance management cycle for extended financial planning analytics, connects business intelligence and business planning together with data.
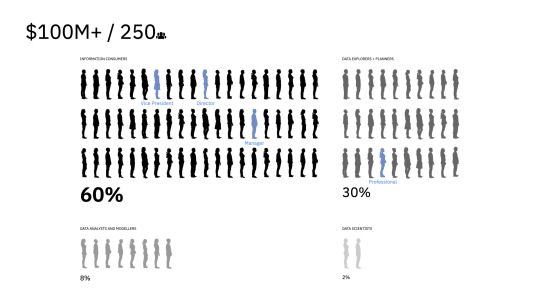
↓ Traditional business analytics solutions target 8-10% of an organization's technically advanced users, but knowledge workers represent 60% of xFPA consumption.
↘ Rising need for organizations to make better decisions quickly and easily from increasingly complex data requires us to rethink traditionally technical modes of BI tools.
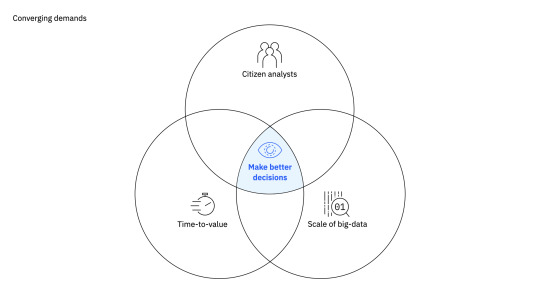
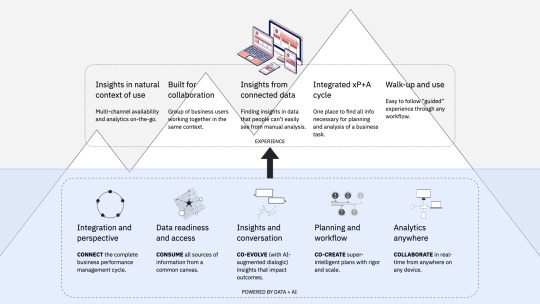
↑ Knowledge workers expect an xFPA experience considerably more approachable than existing systems, yet with the power to tap into deep organizational data.
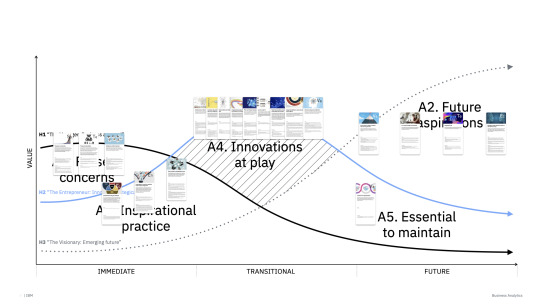
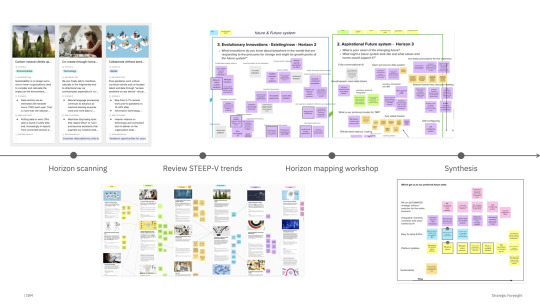
↑ The 3 Horizons foresight framework considers current, interim, and aspirational trajectories, which makes it particularly effective in business and enterprise contexts, where innovation has a polyrhythmic pattern.
↓ 19 relevant emerging trends and 5 key drivers were identified through horizon scanning and UX research data.
↘ Their impact on product trajectories was plotted together in a cross-functional workshop that included senior stakeholders from design, engineering, product management, sales, marketing, and research.

↑ Our envisioning sprints were a series of rapid collaborative design sessions in which we combined opportunities for under-served needs uncovered by Jobs-To-Be-Done, market and product analytics, and emerging technologies along 3 Horizons, to creatively envision use cases that could then be wind-tunneled and validated against our Value Proposition Canvas.
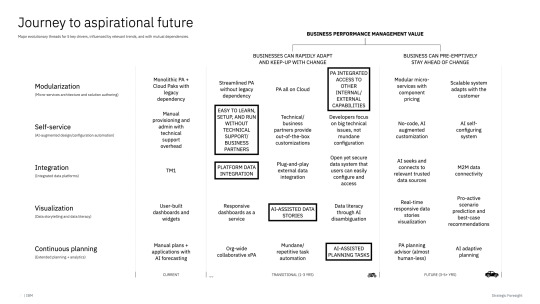
↑ New capabilities, and advances to existing ones, were proposed for near (skateboard), mid (bike), and long (car) development roadmaps.
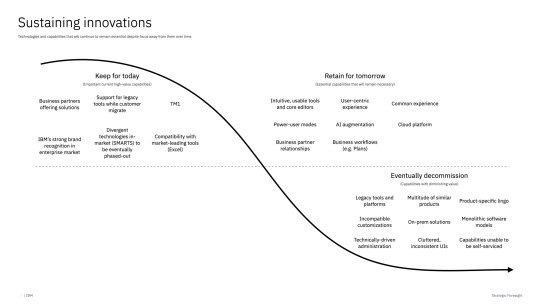
↓ We identified current capabilities and technologies that would remain essential vs those that should eventually be deprecated.
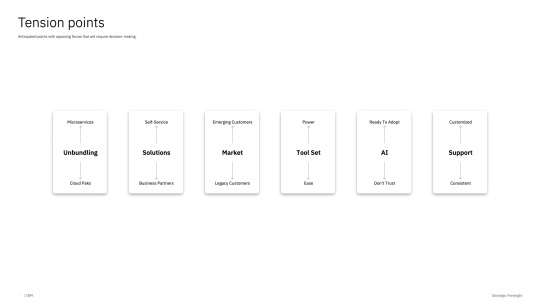
↘ And anticipated tension points that require non-zero-sum strategies.

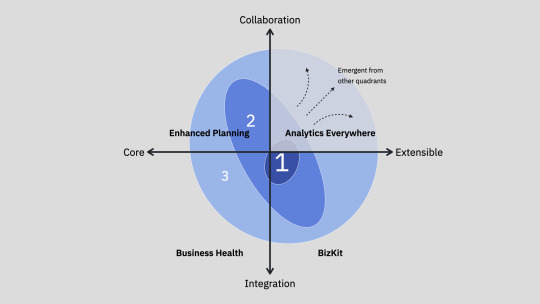
↑ Our product innovation strategy addressed 4 areas from core collaboration to an extended integration ecosystem.
↗ With a go-to-market in 3 phases, beginning with modularization of our products into a composable services architecture that can be connected in different ways to create an end-to-end business performance management cycle.
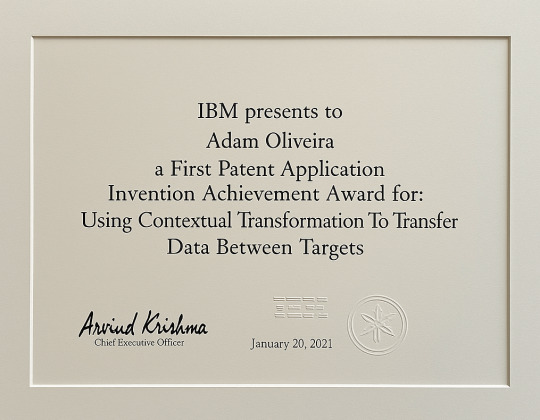
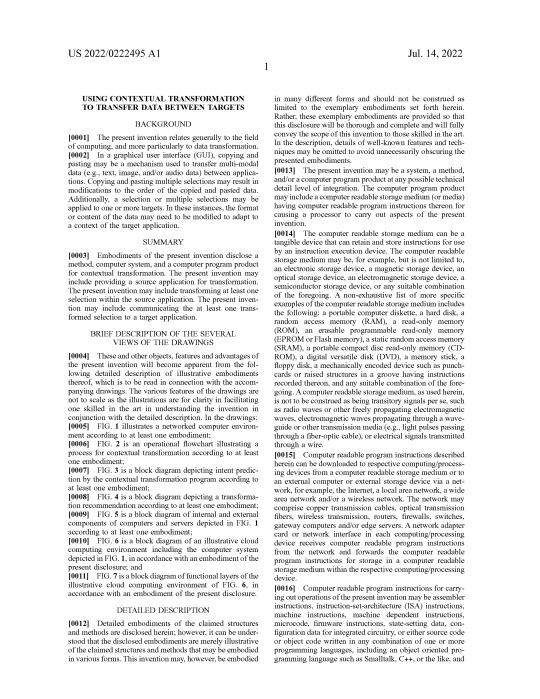
↑ An invention achievement for a patent I filed that addressed an interesting problem for users when working with common information across multiple applications in an integrated ecosystem. The patent proposes a method of copy-and-paste that uses AI to understand context of the transfer and modify the pasted content appropriately. For example, if copying and pasting data from one currency or language to another document in another currency or language.
↓ The patent was granted in 2021 and published in 2022. Read the full publication here »


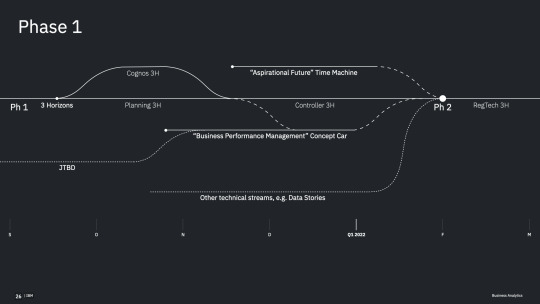
↑ The master plan involved conducting similar rigor on all 4 products, and converging existing streams of product development.
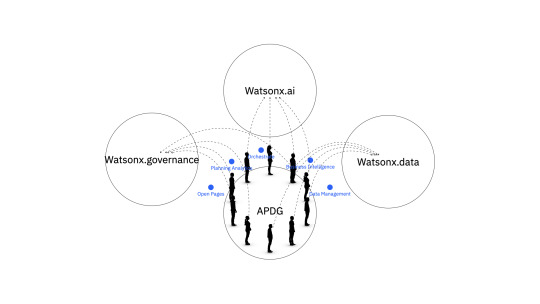
The strategic design work for reinventing IBM Business Analytics lead directly to the creation of the Advanced Product Design Group (APDG), and subsequently several new watsonx initiatives, including watsonx BI Assistant, which are covered in the next chapter on IBM Data + AI.
0 notes
Text
Is the IBM C2090-623 Exam the Hidden Gem for Aspiring Data Analysts?
Many overlook the IBM Cognos Analytics Administrator V11 certification, but the IBM C2090-623 Exam is a real game-changer for professionals diving into enterprise-level BI solutions. It’s not just about dashboards—this exam covers configuration, security, and performance tuning in Cognos environments.
If you're aiming for a role in business intelligence administration, investing in solid IBM C2090-623 Exam Preparation can set you apart. Anyone here already certified or planning to take the plunge? Let’s talk tips, tools, and tricks!

1 note
·
View note
Text
Comparing Certification Options in a Data Analytics Course in Delhi
In today’s world, data is everywhere. From shopping websites to health apps and social media platforms, data is being collected every second. But collecting data is not enough — companies need professionals who can understand and analyze this data to make better decisions. That’s where Data Analytics comes in.
If you’re planning to build a career in data analytics, getting certified is a great first step. In Delhi, a growing hub for IT and data professionals, many institutes offer data analytics courses with certifications. But which certification should you choose? What are the options available? And what makes one better than the other?
In this article, we will explore and compare different certification options available in Data Analytics courses in Delhi, with a special focus on the offerings from Uncodemy. We’ll help you choose the right path for your career growth.
Why Certification in Data Analytics is Important
Before we dive into comparisons, let’s first understand why certification matters:
✅ Proof of Skills: A certificate proves that you have the knowledge and skills to work as a data analyst.
✅ Job Opportunities: Most companies look for certified professionals while hiring.
✅ Higher Salary: Certified professionals often get better salary packages.
✅ Confidence: Certification gives you confidence to apply your knowledge in real-world projects.
Popular Data Analytics Certifications in Delhi
There are many types of data analytics certifications. Let’s look at some of the most common ones that students and professionals go for in Delhi:
1. Uncodemy Data Analytics Certification
Uncodemy is one of the leading IT training institutes in Delhi. It offers a complete Data Analytics course that comes with a professional certification.
🔹 Key Features:
Live online and offline classes
Real-time projects and case studies
1-on-1 mentorship
Internship opportunities
100% placement assistance
Globally recognized certification
🔹 Topics Covered:
Excel for data analytics
SQL (Structured Query Language)
Python for data analysis
Data visualization with Power BI and Tableau
Machine learning basics
Data handling using Pandas and NumPy
🔹 Duration:
3 to 6 months (flexible timings available)
🔹 Certification:
You’ll receive a Data Analytics Certification from Uncodemy, which is recognized by many companies across India.
🔹 Who Should Choose This?
Beginners, college students, working professionals, and career switchers who want complete guidance and hands-on training.
2. Google Data Analytics Professional Certificate (Coursera)
Offered by Google on Coursera, this course is also popular among learners.
🔹 Key Features:
8 self-paced modules
Beginner-friendly
Google-recognized certificate
No prior experience needed
🔹 Duration:
Approx. 6 months (at 10 hours/week)
🔹 Topics Covered:
Data collection and cleaning
Data analysis
Data visualization using spreadsheets, SQL, R
🔹 Pros:
Taught by Google professionals
Affordable
🔹 Cons:
Fully online with no live mentoring
No personal feedback or placement support
3. Microsoft Certified: Data Analyst Associate (via Power BI)
This certification focuses on data analysis using Microsoft Power BI.
🔹 Key Features:
Focused on Power BI
Recognized globally
Requires passing one exam: PL-300
🔹 Pros:
Industry-focused
Good for BI-specific roles
🔹 Cons:
Only focuses on Power BI
Requires good self-study skills
No training included — you must prepare on your own or take a separate course
4. IBM Data Analyst Certificate (Coursera)
Offered by IBM on Coursera, this is another online certification.
🔹 Topics Covered:
Python, SQL, Excel
Data visualization with IBM Cognos
Data analysis using Pandas and NumPy
🔹 Duration:
6 months (at 4–6 hours/week)
🔹 Pros:
From IBM
Project-based learning
🔹 Cons:
No live support
No direct job placement assistance
Comparison Table: Top Certification Options
FeatureUncodemyGoogle CertificateMicrosoft Power BIIBM CertificateMode of TrainingLive (online/offline)Online (self-paced)Self-studyOnline (self-paced)Duration3–6 months6 monthsFlexible (exam-based)6 monthsHands-on Projects✅ Yes✅ Limited❌ No✅ YesPlacement Support✅ Yes❌ No❌ No❌ NoTools CoveredExcel, SQL, Python, Tableau, Power BISQL, R, ExcelPower BI onlyPython, SQL, CognosCertification AuthorityUncodemyGoogleMicrosoftIBMMentorship & Support✅ 1-on-1 Support❌ None❌ None❌ LimitedCostMedium (Affordable)LowMedium (Exam Fees)Low to MediumSuitable ForBeginners & professionalsBeginnersBI SpecialistsBeginners & intermediate
Why Choose Uncodemy?
While all the above certifications have their own benefits, Uncodemy’s Data Analytics Course stands out for a few big reasons:
✅ 1. Mentorship and Support
At Uncodemy, you’re not just buying a course — you’re getting a mentor. You can ask questions anytime, get career advice, and even receive help with interviews.
✅ 2. Placement Assistance
Uncodemy offers 100% placement support. They help you build a strong resume, prepare for interviews, and connect you with top companies.
✅ 3. Real Projects
You’ll work on real-time industry projects, which will help you build a portfolio that impresses employers.
✅ 4. Flexible Timings
Whether you’re a student or a working professional, Uncodemy offers flexible batch timings so you can learn at your convenience.
✅ 5. Affordable and Value for Money
Compared to other certification providers, Uncodemy offers a complete training package at an affordable price.
How to Choose the Right Certification?
Here are a few simple tips to choose the best certification for your needs:
🎯 Know Your Goal: Do you want a job quickly? Are you switching careers? Choose a course that gives hands-on experience and job support.
📅 Time Commitment: Check how much time you can give weekly. Live classes may need regular attendance.
📊 Tool Focus: Different courses focus on different tools. Choose one that covers Python, SQL, Excel, and Tableau/Power BI — the top tools for data analytics.
🧑🏫 Mentorship: Learning alone can be hard. Choose a course that gives you 1-on-1 guidance.
💼 Job Support: If you’re looking for a job, pick a course that offers placement help.
Final Thoughts
Data Analytics is a growing field with amazing career opportunities. A good certification can help you start your journey with confidence. In Delhi, you have many options to choose from — online certificates, global providers like Google or IBM, or personalized training with institutes like Uncodemy.
If you want live classes, mentorship, real projects, and job support all in one place, Uncodemy’s Data Analytics Certification is one of the best options in the city. Whether you're a student, a fresher, or someone looking to switch careers, Uncodemy can guide you every step of the way.
Ready to Get Started?
Visit Uncodemy’s official website to explore more about the Data Analytics course in delhi, view the syllabus, and book a free demo session today.
0 notes
Text
Self-Service Analytics Market Share Analysis 2032: Size, Scope, Growth Trends & Forecast
The Self-Service Analytics Market was valued at USD 4.5 billion in 2023 and is expected to reach USD 19.75 billion by 2032, growing at a CAGR of 17.90% over the forecast period 2024-2032.
The self-service analytics market is witnessing accelerated growth as organizations across industries embrace data-driven decision-making. As the volume of data continues to rise, enterprises are increasingly shifting towards tools that empower non-technical users to analyze and interpret data without the need for specialized IT intervention. Self-service analytics enables business users to access, visualize, and explore data insights independently, which enhances productivity, speeds up decision-making, and fosters a culture of data democratization within organizations.
Self-Service Analytics Market Size, Share, Scope, Analysis, Forecast, Growth, and Industry Report 2032 highlights the increasing demand for intuitive analytical platforms that integrate seamlessly with existing business applications. With businesses becoming more agile, there is a growing need for real-time analytics, customizable dashboards, and interactive reporting tools. Enterprises are investing in platforms that offer ease of use, scalability, and strong data governance features to ensure security and compliance. This shift is contributing to substantial market expansion and innovation within the analytics industry.
Get Sample Copy of This Report: https://www.snsinsider.com/sample-request/5511
Market Keyplayers:
Tableau (Tableau Desktop, Tableau Server)
Microsoft (Power BI, Azure Synapse Analytics)
Qlik (Qlik Sense, QlikView)
Sisense (Sisense for Cloud Data Teams, Sisense for Cloud Analytics)
TIBCO Software (Spotfire, TIBCO Data Science)
SAP (SAP BusinessObjects, SAP Analytics Cloud)
Domo (Domo Business Cloud, Domo Analytics)
IBM (IBM Cognos Analytics, IBM Watson Analytics)
Google (Looker, Google Data Studio)
Oracle (Oracle Analytics Cloud, Oracle Business Intelligence)
Zoho (Zoho Analytics, Zoho Reports)
MicroStrategy (MicroStrategy Analytics, MicroStrategy Desktop)
Alteryx (Alteryx Designer, Alteryx Server)
Sisense (Sisense for Cloud Data Teams, Sisense for Cloud Analytics)
Qlik (Qlik Sense, Qlik DataMarket)
ThoughtSpot (ThoughtSpot Analytics, ThoughtSpot Search)
TARGIT (TARGIT Decision Suite, TARGIT Analytics)
GoodData (GoodData Platform, GoodData Insights)
Yellowfin (Yellowfin Analytics, Yellowfin Signals)
Birst (Birst Analytics, Birst Cloud)
Market Trends
Several key trends are shaping the current and future landscape of the self-service analytics market:
Rise of Embedded Analytics: Organizations are integrating analytics directly into business applications, allowing users to access insights without switching platforms. Embedded analytics enhances user experience and increases adoption across departments.
Growth of Cloud-Based Analytics Solutions: The move towards cloud computing has significantly boosted the adoption of self-service analytics tools. Cloud-based platforms offer scalability, cost-efficiency, and remote accessibility, which align with the needs of modern, distributed workforces.
Natural Language Processing (NLP): NLP capabilities are transforming self-service analytics by allowing users to interact with data using conversational queries. This trend is reducing the entry barrier for users with limited technical expertise.
Focus on Data Governance and Security: As more employees gain access to analytics tools, organizations are prioritizing robust governance frameworks to manage data access, ensure quality, and comply with regulations like GDPR and HIPAA.
AI and ML Integration: Advanced self-service platforms are incorporating machine learning algorithms to uncover hidden trends, perform predictive analytics, and automate data analysis—empowering users to make smarter, faster decisions.
Enquiry of This Report: https://www.snsinsider.com/enquiry/5511
Market Segmentation:
By Software
Tableau
Sas
Logi Analytics
Qlik
Others
By Service
Business User
Consultants
Corporate IT Professionals
Others
By Enterprise Type
Large Size Enterprises
Small and Medium Sized Enterprises (SMEs)
By Industry Vertical
BFSI
Consumer Goods & Retail
Healthcare
IT and Telecom
Manufacturing & Automotive
Market Analysis
This growth is fueled by a surge in demand from sectors like retail, BFSI, healthcare, and manufacturing, where quick access to insights can drive operational efficiency and competitive advantage.
North America currently dominates the market due to early technology adoption, a mature IT infrastructure, and a high concentration of analytics providers. However, Asia-Pacific is expected to witness the fastest growth during the forecast period, driven by digital transformation initiatives, expanding internet penetration, and increasing investments in business intelligence solutions.
The market is highly competitive, with leading players such as Microsoft, Tableau (Salesforce), IBM, Qlik, and SAP constantly innovating to offer enhanced functionalities. Startups and niche players are also entering the market with specialized offerings tailored for small and medium-sized enterprises (SMEs), contributing to a diverse and dynamic vendor landscape.
Future Prospects
The future of self-service analytics is expected to be driven by a deeper integration of artificial intelligence, automation, and mobile-first technologies. As analytics becomes more embedded into everyday business operations, we can expect platforms to offer more real-time collaboration features, voice-enabled insights, and customizable solutions based on industry-specific requirements.
With increasing focus on upskilling and data literacy among employees, organizations are likely to invest in training programs and user-friendly platforms that support self-learning. The demand for industry-specific solutions tailored to roles and functions—such as marketing analytics, financial performance dashboards, and operational intelligence—will also rise.
In addition, interoperability between different data sources and tools will be a key focus area. Vendors that can offer seamless integration with enterprise ecosystems—including ERP, CRM, and HRMS platforms—will hold a competitive edge. The continued evolution of low-code/no-code platforms will also broaden the user base, allowing even non-technical users to build custom reports and dashboards.
Access Complete Report: https://www.snsinsider.com/reports/self-service-analytics-market-5511
Conclusion
The self-service analytics market is evolving rapidly, unlocking opportunities for businesses to make faster, smarter, and more inclusive decisions. As organizations prioritize agility, transparency, and data democratization, self-service tools are becoming indispensable across all sectors. The convergence of AI, cloud computing, and user-centric design is setting the stage for the next wave of innovation in analytics.
With growing investment in analytics infrastructure and an increasing emphasis on data-driven culture, the market is poised for robust and sustained growth through 2032. Organizations that embrace self-service analytics will be better equipped to respond to changing market dynamics, innovate faster, and achieve measurable business outcomes in an increasingly competitive digital landscape.
About Us:
SNS Insider is one of the leading market research and consulting agencies that dominates the market research industry globally. Our company's aim is to give clients the knowledge they require in order to function in changing circumstances. In order to give you current, accurate market data, consumer insights, and opinions so that you can make decisions with confidence, we employ a variety of techniques, including surveys, video talks, and focus groups around the world.
Contact Us:
Jagney Dave - Vice President of Client Engagement
Phone: +1-315 636 4242 (US) | +44- 20 3290 5010 (UK)
#Self-Service Analytics Market#Self-Service Analytics Market Scope#Self-Service Analytics Market Growth#Self-Service Analytics Market Trends
0 notes
Text
IBM Cognos vs Tableau: A Comprehensive Comparison for Enterprise Analytics
In today's data-driven business landscape, choosing the right enterprise analytics platform is crucial for organizational success. This comprehensive analysis compares two industry leaders, IBM Cognos and Tableau, examining their features, capabilities, and enterprise readiness.
Understanding Enterprise Analytics Foundations: [IBM Cognos vs Tableau Before discussing the specific comparison of IBM Cognos vs Tableau, it's essential to understand what makes an enterprise analytics platform truly effective. Enterprise data integration capabilities form the backbone of any analytics solution and determine its ability to handle complex data environments.
Technical Architecture and Performance Scalability and Infrastructure Design When evaluating IBM Cognos vs Tableau, comparing scalability architecture reveals distinct approaches. IBM Cognos employs a multi-tier architecture optimized for enterprise-scale deployments, while Tableau offers a flexible architecture that can scale horizontally.
Query Optimization and Performance Both platforms handle query optimization methods differently. IBM Cognos vs Tableau performance metrics show that Cognos excels in complex query handling through its advanced query optimization engine, while Tableau leverages its VizQL technology for rapid data visualization.
Data Modeling and Integration Framework Enterprise Data Integration The comparison between IBM Cognos and Tableau in data modeling frameworks reveals Cognos's robust enterprise modeling capabilities and Tableau's more intuitive approach. Third-party integration options vary significantly between the platforms.
Real-time Analytics Capabilities Real-time analytics performance is crucial for modern enterprises. The IBM Cognos vs Tableau analysis shows that both platforms offer real-time capabilities, but their approaches differ in implementation and resource utilization.
User Experience and Visualization Self-service Analytics The IBM Cognos vs Tableau evaluation demonstrates Tableau's strength in self-service analytics comparison. While Tableau offers intuitive data visualization capabilities, Cognos provides a more structured approach to self-service analytics.
Mobile and Cross-platform Features Mobile analytics features have become increasingly important. The IBM Cognos vs Tableau assessment shows that both platforms offer robust mobile solutions but take different approaches to cross-platform compatibility.
Enterprise Security and Governance Security Framework Analysis The security framework comparison reveals comprehensive security features on both platforms when comparing IBM Cognos and Tableau. However, the role-based access control implementation differs, with Cognos offering more granular controls.
Governance and Compliance The IBM Cognos vs Tableau evaluation demonstrates strong governance capabilities in both platforms. Cognos has more extensively developed metadata management and audit trail features.
Cost Considerations and Implementation Total Cost of Ownership A crucial aspect of the IBM Cognos vs Tableau comparison is understanding the total cost of ownership. Implementation timeline and resource requirements vary significantly between platforms.
Support and Training The IBM Cognos vs Tableau analysis compares different approaches to training requirements and support services. Both platforms offer extensive training resources but with varying methodologies.
Integration Ecosystem API and Extension Capabilities API extensibility features differ in the IBM Cognos vs Tableau comparison. Both platforms offer robust API ecosystems, but their approaches to custom development options vary.
Data Source Connectivity The IBM Cognos vs Tableau evaluation reveals different strategies for ETL tool compatibility and data source connectivity. Both platforms support a wide range of data sources.
Performance and Scalability Metrics Query and Dashboard Performance In the IBM Cognos vs Tableau comparison, query response and dashboard loading times vary based on deployment scenarios and data complexity.
Concurrent User Handling Both platforms handle concurrent user capacity differently, with varying approaches to cache management and server resource utilization.
Making the Strategic Choice: Key Takeaways for Enterprise Decision Makers The comprehensive IBM Cognos vs Tableau analysis reveals that both platforms offer robust solutions for enterprise analytics, with different strengths aligned to specific use cases. Organizations must carefully evaluate their particular needs against these capabilities.
Why Choose DataTerrain for Your Analytics Implementation DataTerrain brings extensive expertise in both IBM Cognos and Tableau implementations. Our certified consultants help organizations make informed decisions and ensure successful deployments through:
Deep technical expertise in both platforms Proven implementation methodology Comprehensive training and support services Custom solution development capabilities Ongoing maintenance and optimization services Contact DataTerrain today to discuss your enterprise analytics needs and discover how we can help you maximize your investment in either IBM Cognos or Tableau.
0 notes
Text
Choosing the Right Reporting Tool for Your Business
For any business striving for success, gathering data and generating reports are critical for assessing performance, understanding customer behavior, and making well-informed decisions. With an abundance of reporting tools available, finding the right one for your organization can be challenging.
This guide aims to simplify the process by helping you identify the best data reporting tool to meet your company’s specific needs. We’ll explore popular software options, highlighting their features, benefits, and potential limitations.
What Are Reporting Tools?
A reporting tool is a software solution designed to help organizations collect, analyze, and present data in a clear and organized format. These tools enable businesses to create various types of reports—such as financial, operational, sales, and marketing reports—which can inform strategic decisions and track progress.
Key features of reporting tools often include:
Data visualization capabilities
Customizable report templates
Automated report generation
Integration with diverse data sources
By leveraging these tools, businesses can uncover insights, monitor trends, and track key performance indicators (KPIs), ultimately driving growth and operational efficiency.
Types of Reporting Tools
Different reporting tools serve distinct purposes. Below are some common types of tools to consider:
1. Business Intelligence (BI) Tools
BI tools help analyze and visualize complex datasets, supporting better decision-making. Popular examples include Tableau, Microsoft Power BI, and QlikView. Many BI tools offer advanced capabilities such as predictive analytics, data mining, and machine learning.
2. Dashboard Reporting Tools
These tools specialize in creating interactive dashboards that display real-time KPIs and metrics. Examples include Sisense, Domo, and Klipfolio. They provide a visual overview of data, making it easier to monitor performance at a glance.
3. Spreadsheet-Based Tools
Spreadsheet tools like Microsoft Excel and Google Sheets are widely used for their simplicity and flexibility. Users can create charts, perform calculations, and organize data within a familiar interface.
4. Ad Hoc Reporting Tools
Designed for quick, custom report creation, these tools often feature drag-and-drop interfaces and pre-built templates. Examples include Zoho Analytics and Birst. They are ideal for users without technical expertise who need tailored reports.
5. Financial Reporting Tools
These tools focus on generating financial reports, such as balance sheets, income statements, and cash flow analyses. Examples include Oracle Hyperion, SAP Financial Statement Insights, and IBM Cognos. They are crucial for tracking financial health and ensuring compliance.
6. CRM Reporting Tools
Integrated into Customer Relationship Management systems, these tools provide insights into customer data, sales performance, and marketing campaigns. Examples include Salesforce, HubSpot, and Microsoft Dynamics 365.
7. Open-Source Reporting Tools
Open-source tools are free to use and highly customizable, making them a good option for businesses with tight budgets. Examples include BIRT (Business Intelligence and Reporting Tools), JasperReports, and Pentaho.
Top 5 Reporting Tools of 2023
Here are five top-rated reporting tools to consider for your business:
1. Tableau
Tableau is a leading BI and data visualization tool known for its intuitive interface, extensive customization options, and strong community support. It’s suitable for organizations of all sizes looking to create interactive dashboards and reports.
2. Domo
Domo is a cloud-based BI platform offering real-time data visualization, collaboration tools, and mobile access. Its user-friendly design and pre-built connectors make it ideal for businesses seeking to streamline reporting processes.
3. Looker
Looker provides advanced analytics and reporting capabilities, with a focus on data governance and integration with popular data warehouses. Acquired by Google in 2019, Looker’s customizable data models make it a strong choice for businesses prioritizing data accuracy.
4. Microsoft Power BI
Power BI integrates seamlessly with Microsoft products like Office 365 and Azure. Its robust data analysis, visualization features, and competitive pricing make it appealing for organizations leveraging Microsoft’s ecosystem.
5. Sisense
Sisense is renowned for its ease of use and scalability. Its In-Chip™ technology enables faster data processing, while its capability to handle large datasets and embed analytics into other applications makes it an excellent choice for complex reporting needs.
0 notes
Text
Cognos:The Power of Business Intelligence in Accounting

The phrase "Cognos – Best Accounting Software" might be a bit misleading, as IBM Cognos is not specifically designed as an accounting software. Instead, Cognos is a suite of business intelligence (BI) and performance management tools that offer advanced analytics, reporting, and decision-making features. While it can support accounting functions, it is not a dedicated accounting software like QuickBooks, Xero, or Sage.
However, many organizations use Cognos for financial reporting, forecasting, and budgeting due to its analytics and data integration capabilities. Cognos can connect with various accounting and ERP systems to help streamline financial data management, but it’s not the primary choice for day-to-day accounting tasks such as invoicing, payroll, or tax filing.
Here’s a clearer understanding of why Cognos may be mentioned in the context of accounting:
Financial Reporting:
Cognos can generate in-depth reports such as income statements, balance sheets, and cash flow statements, making it useful for accountants who need to produce detailed, accurate reports for stakeholders.
Data Integration:
It can pull in data from various accounting systems and other business tools, allowing accountants to have a consolidated view of financial data in one platform.
Advanced Analytics:
With Cognos, users can analyze financial data more effectively, using predictive models and advanced analytics to support budgeting, forecasting, and decision-making.
Automation:
Cognos allows for automated report generation and distribution, saving time for accounting teams and improving the accuracy of financial information.
What is Cognos?
Cognos is a suite of business intelligence (BI) and performance management software developed by IBM. It is primarily designed to help organizations make data-driven decisions by providing tools for reporting, analytics, data visualization, monitoring, and forecasting. Cognos allows businesses to gather, analyze, and report on data from various sources to gain insights that improve decision-making, operations, and performance.
Here are the key features of Cognos:
Reporting:
Cognos provides powerful reporting tools to generate detailed and customizable reports, such as financial statements, operational reports, and ad-hoc reports.
Reports can be generated in various formats, including PDF, Excel, and HTML.
Data Visualization:
Users can create dashboards and visual representations of data, such as charts, graphs, and tables, to easily analyze trends, performance, and key metrics.
This is useful for decision-makers who need a visual understanding of data.
Analytics:
Cognos includes tools for descriptive, diagnostic, predictive, and prescriptive analytics, enabling users to analyze data patterns, forecast trends, and recommend actions.
It supports both basic and advanced analytics, helping users make data-driven decisions.
Performance Management:
It helps organizations track key performance indicators (KPIs) and monitor business performance.
Cognos provides tools for budgeting, planning, and forecasting, particularly in financial analysis.
Data Integration:
Cognos can integrate with various data sources, including relational databases, spreadsheets, and ERP systems, to provide a unified view of organizational data.
Collaboration:
Users can collaborate on reports, share insights, and interact with data across teams to align decisions with business goals.
Cloud and On-Premises Deployment:
Cognos offers both cloud-based and on-premises deployment options, providing flexibility in how organizations choose to deploy and access the software.
Security:
Cognos ensures that data is secure by providing user access controls and robust security features to protect sensitive business information.
Key Uses of Cognos:
Financial Reporting: Organizations use Cognos for generating financial reports, ensuring compliance, and tracking financial performance.
Operational Reporting: It can be used for operational data analysis, such as inventory management, supply chain optimization, and customer service metrics.
Executive Dashboards: Senior executives and managers use Cognos dashboards to monitor business performance at a glance, using visualized data to make informed decisions.
How Cognos is best accounting software?
Cognos is not specifically designed as accounting software but is a powerful business intelligence (BI) and performance management tool that complements accounting functions. It excels in financial reporting, budgeting, and forecasting, allowing accountants to generate detailed financial statements, track KPIs, and analyze data from various sources. Cognos enables automated report generation, saving time and improving accuracy. Its data visualization and advanced analytics provide valuable insights for decision-making. By integrating with other accounting systems and ERP tools, it allows businesses to consolidate financial data in one platform for better analysis. While not a traditional accounting software, Cognos supports financial operations by streamlining reporting, improving efficiency, and enhancing financial insights, making it an excellent choice for data-driven accounting and financial management.
Top Features That Make Cognos the Best Accounting Software
While Cognos is not specifically designed as traditional accounting software, it offers several features that make it highly beneficial for accounting and finance teams. Here are the top features that contribute to making Cognos an excellent tool for accounting and financial management:
Advanced Financial Reporting
Cognos excels in automated reporting for financial data. It can generate customized reports such as income statements, balance sheets, and cash flow reports. The ability to automate and customize reports saves time and ensures data accuracy, which is essential in accounting for compliance and decision-making.
Scheduled Reports: Reports can be scheduled to run automatically, saving time for accounting teams who would otherwise need to generate them manually.
Data Integration
Cognos integrates seamlessly with various accounting systems, Enterprise Resource Planning (ERP) platforms, and data sources. It enables accountants to pull data from different systems, consolidating financial information in one unified dashboard or report.
ETL Capabilities: It can extract, transform, and load data from multiple systems, making it easier to analyze financial data across the organization.
Budgeting and Forecasting
Cognos offers tools for budgeting, forecasting, and financial planning, which are key tasks in accounting. These tools help accountants predict future financial performance based on historical data and business trends, improving decision-making and resource allocation.
It allows businesses to track budget vs. actual performance in real-time, providing insights into any discrepancies that may require attention.
Advanced Analytics and Forecasting
Predictive analytics tools in Cognos allow accountants to identify future financial trends, potential risks, and opportunities based on historical data. This helps improve financial forecasting and strategic planning.
Financial analysts can use what-if analysis to simulate different scenarios, helping accountants make informed financial decisions.
Data Visualization
Cognos offers powerful data visualization capabilities, making it easier for accountants to present financial data in an intuitive and easily understandable format. Using charts, graphs, and dashboards, accountants can present complex financial data to stakeholders more effectively.
This visualization is particularly useful for executives and managers who need quick insights into the company’s financial health.
Security and Access Control
Given the sensitive nature of financial data, Cognos offers robust security features, including user access controls and permission management, ensuring that only authorized personnel can view or modify financial information.
The system supports granular access control, allowing accounting teams to limit access based on roles and responsibilities.
Collaboration and Sharing
Cognos enables collaboration between team members, making it easier to share reports and insights with stakeholders across the organization. It provides tools for commenting, discussion, and annotations within reports, which facilitates teamwork and decision-making.
Accountants can easily share financial reports and dashboards with senior management, ensuring that everyone has access to the latest financial data.
Real-Time Reporting
With Cognos, accountants have access to real-time data and reports, which is crucial for up-to-date financial monitoring. This feature helps finance teams identify issues as they arise and respond quickly to changes in financial performance.
The real-time analytics support quick decision-making and improve the ability to adapt to financial changes and challenges.
Scalability and Flexibility
Cognos is highly scalable, making it suitable for businesses of all sizes, from small companies to large enterprises. It can handle large volumes of data, making it an ideal solution for growing businesses that need more complex financial reporting and analysis.
It is also flexible in deployment options, supporting both cloud and on-premise installations, allowing businesses to choose the best option for their needs.
Audit Trails and Compliance
Cognos supports auditing capabilities, which are essential for ensuring compliance with financial regulations and internal policies. The system provides detailed audit trails, making it easier to track financial transactions and ensure transparency and accountability in financial reporting.
This is particularly useful during audits and when ensuring adherence to standards like SOX (Sarbanes-Oxley) for corporate governance.
Why Choose Cognos Over Other Accounting Software?
Cognos stands out for its unique combination of business intelligence (BI) and accounting features. Unlike traditional accounting software that primarily handles transactional processes, Cognos focuses on providing data-driven insights and strategic financial management. Its robust integration capabilities, scalability, and intuitive interface make it a preferred choice for businesses seeking to not only manage finances but also gain actionable insights to drive better decision-making and growth. Cognos allows organizations to analyze and visualize data from multiple sources, making it ideal for companies that require advanced financial analysis and reporting.
How Cognos does make working so easy?
Cognos simplifies work processes in organizations, especially for accounting, finance, and data-driven teams, through a combination of automation, integration, user-friendly features, and advanced analytics. Here’s a detailed breakdown of how Cognos makes working easier:
Automation of Reporting and Data Generation
Cognos automates the generation of financial reports, dashboards, and ad-hoc queries, saving significant time for employees who would otherwise have to compile data manually. Reports are automatically generated and can be scheduled to run at specific times (daily, weekly, or monthly), ensuring data is always up-to-date.
Automated Data Updates: Once set up, Cognos pulls data from integrated sources, automatically updating reports, which eliminates the need for manual data entry or the risk of outdated information.
Data Integration Across Multiple Systems
Cognos integrates seamlessly with various data sources, such as accounting systems, ERP platforms, CRM tools, and databases. It can pull data from multiple departments and systems (finance, operations, sales, HR, etc.), providing a single source of truth.
This eliminates the need to switch between different applications, helping users work with consolidated data in one place, improving efficiency and reducing errors due to data inconsistencies.
User-Friendly Interface and Dashboards
Cognos provides intuitive dashboards and easy-to-use tools that make it accessible for users with various levels of technical expertise. Accountants, financial analysts, and managers can quickly create customized dashboards that display key metrics, trends, and real-time data.
Self-Service Reporting: Non-technical users can create and modify reports or dashboards without relying on IT, empowering business users to explore data and insights independently.
Advanced Analytics for Quick Insights
Cognos simplifies decision-making by providing advanced analytics capabilities such as predictive analytics, trend analysis, and what-if scenarios. This allows users to uncover trends, identify issues early, and make more accurate forecasts.
It offers interactive features like drill-down analysis, which lets users click into reports or visualizations to view more detailed data without needing complex queries or technical knowledge.
Real-Time Access to Data and Insights
With Cognos, users have access to real-time data. This is crucial in today’s fast-paced business environment, especially for financial and operational decision-making.
Real-time data access allows teams to quickly adjust their strategies based on the latest financial or performance information, avoiding delays in decision-making that can occur when relying on outdated reports.
Collaboration and Sharing
Cognos promotes team collaboration by enabling users to share reports, dashboards, and insights across the organization. Commenting and annotations within reports allow users to interact with the data, discuss findings, and suggest improvements, all within the platform.
This eliminates the need for emails or separate meetings to discuss data, as everyone can access the latest version of reports in one centralized location.
Mobile Access for On-the-Go Work
Cognos offers mobile apps for accessing reports and dashboards on-the-go. Whether you're in the office, traveling, or working remotely, users can easily view financial data, KPIs, and performance metrics from their smartphones or tablets.
This flexibility ensures that decision-makers have constant access to the information they need, increasing responsiveness and efficiency across the organization.
Security and Access Control
Cognos makes working easier by managing user access with detailed security controls, ensuring that only authorized users have access to sensitive financial data.
Role-based access and permissions ensure that employees can only view or edit data that is relevant to their responsibilities, which helps streamline workflows by limiting unnecessary information overload.
Scalable and Customizable to Meet Needs
Cognos is scalable and customizable, making it adaptable to businesses of different sizes and industries. As your business grows, Cognos can handle increasing data volumes and more complex reporting needs.
Users can personalize their workspaces and dashboards according to specific preferences and tasks, making the tool even more efficient and tailored to the team’s needs.
Simplified Compliance and Audit Trails
For businesses that need to stay compliant with financial regulations (like SOX or GDPR), Cognos simplifies the process by maintaining detailed audit trails of all actions, changes, and reports. This helps accountants and auditors track data movements and ensures compliance with industry standards.
Automated compliance reporting ensures that teams can quickly provide the required documentation during audits, saving time and reducing the risk of human error.
Conclusion:
Cognos is not traditional accounting software but offers powerful business intelligence tools that complement accounting functions. It excels in financial reporting, budgeting, forecasting, and data integration, enabling organizations to make data-driven decisions. While not designed for day-to-day accounting tasks, its advanced analytics, automated reporting, and scalability make it a valuable tool for financial management and strategic decision-making.
FAQs:
What is Cognos used for in accounting?
Cognos helps with financial reporting, budgeting, forecasting, and data integration, supporting accounting teams in generating accurate financial insights.
Is Cognos better than traditional accounting software?
Cognos is not designed as accounting software but offers advanced analytics and reporting that complement accounting functions.
Can Cognos integrate with other accounting systems?
Yes, Cognos integrates with various ERP and accounting systems to consolidate financial data for better analysis.
1 note
·
View note
Text
EPM WITH IBM

Integration is the key for streamlining planning, budgeting, forecasting and financial consolidation processes. In order to adapt to ever dynamic business conditions, enterprises need a solution that creates a single source of truth through visibility into their data. And it’s not just for finance — the same robust planning and consolidation solution can be a powerful EPM solution across the entire organization.
IBM Planning Analytics with Watson and IBM Cognos Controller help to unify and streamline planning and financial consolidation across the enterprise. Icon is one of the leading implementation partners of IBM in Asia, with many successful implementations across leading industry verticals like hospitality, healthcare, manufacturing and education.
FOR MORE INFO- https://www.iconresources.com/
0 notes
Text
Lead with Intelligence: IBM Training That Powers the Future of Enterprise IT
In an era dominated by emerging technologies, IBM continues to be the engine behind critical enterprise systems worldwide. From artificial intelligence to automation, cloud to cybersecurity, IBM’s platforms support business operations at every scale. However, as the complexity of technology increases, so does the need for skilled professionals who can manage, integrate, and innovate using IBM solutions. This is where IBM training becomes a strategic investment, not just for individuals but for entire organizations navigating digital transformation.
Training That Covers Every IBM Domain
IBM’s influence spans across industries and disciplines, and so does Ascendient’s training catalog. Data analytics professionals can dive into courses on Cognos, SPSS, and Planning Analytics. Those managing cloud infrastructures can gain deep expertise in IBM Cloud Pak solutions, including Cloud Pak for Data, Automation, Security, and Watson.
Automation and integration specialists can train in Business Automation Workflow, Operational Decision Management, and App Connect, learning to streamline processes and increase productivity. For professionals focused on cybersecurity, Ascendient Learning offers in-depth instruction in QRadar, Guardium, and IBM Verify, covering everything from threat detection to access control.
Infrastructure teams can sharpen their skills in IBM Power Systems, Spectrum Storage, and IBM Z. Software developers and engineering teams can benefit from tools like WebSphere, Rational DOORS, and Engineering Lifecycle Management. No matter your focus, Ascendient’s IBM training meets the demands of today’s enterprise IT environments.
Real Credentials That Boost Career Value
IBM certifications and digital badges are recognized around the world and serve as a strong validation of technical knowledge and job readiness. Ascendient Learning helps professionals prepare for and earn these credentials with targeted, exam-aligned training. Whether you are pursuing certifications in artificial intelligence, cloud architecture, security, or data science, each course is backed by IBM’s standards and led by instructors who understand both the technology and the exam landscape.
Customized Enterprise Learning That Scales
For organizations, IBM training is more than skill-building; it’s a strategic tool for achieving business outcomes. Ascendient Learning works closely with enterprise clients to assess current competencies, identify knowledge gaps, and build customized learning plans. Whether your team is deploying a new IBM platform or expanding existing capabilities, Ascendient Learning offers private team training, bootcamps, and modular courses tailored to your goals. Through the Customer Enrollment Portal, organizations can manage training activity, budgets, and performance data in one place.
Ascendient Learning: Your Trusted IBM Training Partner
Ascendient Learning stands at the forefront of IBM education, offering one of the most comprehensive portfolios of IBM-authorized training available in North America. As the Education Provider for TD SYNNEX and a recognized Global Training Provider of the Year, Ascendient Learning delivers award-winning instruction, certified courseware, and unmatched scheduling flexibility.
With years of delivery experience, Ascendient offers training across the full spectrum of IBM technologies. Courses are led by IBM-certified instructors with real-world experience, ensuring that learners understand not just how IBM tools work, but how to apply them to solve real challenges. Whether you prefer in-person sessions, live virtual classrooms, or self-paced study, Ascendient Learning’s delivery options meet professionals where they are.
Start Your IBM Journey with Ascendient
IBM technologies remain essential to the backbone of global business, and mastering them opens the door to career growth, project leadership, and enterprise impact. Ascendient Learning is uniquely positioned to support that journey, combining certified instruction, flexible delivery, and deep IBM expertise in every course.
Now is the time to upgrade your skills, validate your expertise, and shape the future of technology with confidence. Start your IBM training journey with Ascendient Learning, and move forward with clarity, credibility, and capability!
For more information visit: https://www.ascendientlearning.com/it-training/ibm
0 notes
Text
ERP Software Market Expands with Increased Focus on Automation and Integration
The Enterprise Resource Planning Software Market was valued at USD 62.49 billion in 2023 and is expected to reach USD 175.63 billion by 2032, growing at a CAGR of 12.23% from 2024-2032.
ERP Software Market continues to be a cornerstone of digital transformation, enabling organizations to streamline operations, enhance visibility, and drive decision-making through integrated business solutions. As industries increasingly adopt cloud-first strategies, ERP systems are evolving to support hybrid workforces, real-time data access, and modular deployments tailored to specific business needs.
U.S. sees strong ERP demand in mid-size and large enterprises amid digital acceleration
ERP Software Market is witnessing a robust surge in demand across manufacturing, healthcare, retail, and finance sectors. Vendors are focusing on AI integration, predictive analytics, and mobile accessibility, helping enterprises in the U.S. and globally improve agility, compliance, and customer satisfaction.
Get Sample Copy of This Report: https://www.snsinsider.com/sample-request/2964
Market Keyplayers:
Epicor Software Corporation (Epicor ERP, Prophet 21)
Hewlett-Packard Development Company, L.P (HP Adaptive Management, HP Project Portfolio Management)
Infor Inc. (Infor CloudSuite, Infor M3)
IBM Corporation (IBM Cognos Analytics, IBM Maximo)
Microsoft Corporation (Microsoft Dynamics 365, Microsoft Power BI)
NetSuite Inc. (NetSuite ERP, NetSuite CRM+)
Oracle Corporation (Oracle NetSuite, Oracle Fusion Cloud ERP)
Sage Group plc (Sage Intacct, Sage 300cloud)
SAP SE (SAP S/4HANA, SAP Business ByDesign)
Unit4 (Unit4 ERP, Unit4 Financial Planning & Analysis)
Workday Inc. (Workday Financial Management, Workday Human Capital Management)
Deltek (Deltek Costpoint, Deltek Vantagepoint)
QAD Inc. (QAD Adaptive ERP, QAD Cloud ERP)
IFS AB (IFS Cloud, IFS Applications)
Acumatica (Acumatica Cloud ERP, Acumatica Construction Edition)
Syspro (SYSPRO ERP, SYSPRO Avanti)
Tally Solutions Pvt Ltd (TallyPrime, Tally ERP 9)
Odoo SA (Odoo ERP, Odoo CRM)
Priority Software (Priority ERP, Priority Zoom)
Ramco Systems (Ramco ERP Suite, Ramco Global Payroll)
abas Software GmbH (abas ERP, abas Distribution)
Plex Systems Inc. (Plex Smart Manufacturing Platform, Plex ERP)
Market Analysis
The ERP Software Market is undergoing a significant shift from on-premise systems to flexible cloud-based models. Businesses are recognizing the importance of end-to-end integration across finance, supply chain, human resources, and customer relationship management. In the U.S., rapid digitization of legacy systems and the need for operational resilience have driven major ERP investments. Meanwhile, Europe’s focus on regulatory compliance and data security is influencing adoption, especially in finance and public sectors.
Market Trends
Migration to cloud-native ERP platforms for scalability
Integration of AI/ML for real-time insights and automation
Growing demand for industry-specific ERP solutions
Increased adoption among SMEs due to flexible pricing models
Expansion of mobile ERP access for remote workforce
ERP systems incorporating advanced data visualization tools
Focus on cybersecurity and data governance within ERP architecture
Market Scope
The ERP Software Market is not limited to enterprise giants; it is rapidly becoming accessible and indispensable for mid-sized and growing businesses. Modular ERP solutions are being adopted across various sectors for their ability to streamline workflows and improve productivity.
Cross-departmental integration enhancing operational efficiency
Customizable modules for different industry verticals
Cloud-hosted ERP systems supporting global scalability
Real-time financial and inventory tracking
Seamless third-party integrations (CRM, BI, HRM tools)
Enhanced data security features ensuring regulatory compliance
Forecast Outlook
The ERP Software Market is set to evolve further with a focus on intelligent automation and seamless cross-functional visibility. As organizations prioritize agility and data-driven strategies, ERP solutions will play a critical role in aligning business goals with operational execution. The U.S. and European markets are expected to continue driving innovation through increased investment in AI-powered ERP platforms, real-time analytics, and flexible deployment models that cater to dynamic market conditions.
Access Complete Report: https://www.snsinsider.com/reports/erp-software-market-2964
Conclusion
The future of the ERP Software Market lies in its adaptability, intelligence, and ability to unify complex business processes across geographies. With enterprises in the U.S. and Europe striving for operational excellence and digital scalability, ERP platforms are emerging as strategic assets—not just software systems. Organizations that invest in next-gen ERP now will be better equipped to lead, innovate, and scale in an increasingly competitive global environment.
About Us:
SNS Insider is one of the leading market research and consulting agencies that dominates the market research industry globally. Our company's aim is to give clients the knowledge they require in order to function in changing circumstances. In order to give you current, accurate market data, consumer insights, and opinions so that you can make decisions with confidence, we employ a variety of techniques, including surveys, video talks, and focus groups around the world.
Related Reports:
U.S.A gears up for a surge in Media Asset Management Market adoption across broadcasting and streaming sectors
U.S.A driving transformative growth in the expanding Affective Computing Market landscape
U.S.A drives innovation in Enterprise WLAN Market with rapid digital upgrades
Contact Us:
Jagney Dave - Vice President of Client Engagement
Phone: +1-315 636 4242 (US) | +44- 20 3290 5010 (UK)
Mail us: [email protected]
0 notes
Text
youtube
↑ The Advanced Product Design Group was conceived in 2023 as a specialized team within IBM Software, intended to rapidly support and grow fragile, early-stage products—bringing structure, excellence, and accelerated impact much like a SEAL team—before handing off to long-term teams. This approach addresses a critical capability gap in a design workforce primarily focused on mature products.
IBM Data + AI Software

↑ Accelerating time-to-wow was its primary goal. This meant being able to very quickly articulate an abstract idea in tangible form, prove investment viability, and move it to the next stage.
↓ The team would specialize in sense-making, concept and futures design, storytelling, and stage-craft, then hand-off the product when it transitioned into full-development.
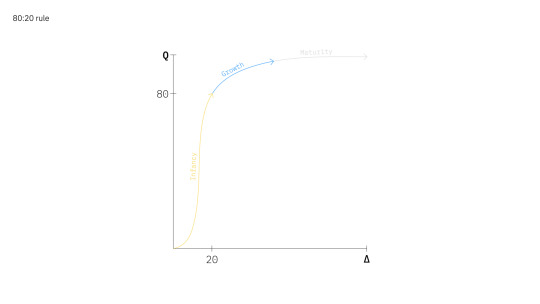
↘ Applying the 80:20 rule, the APDG would use only 20% of time, effort, and resources comparatively, to achieve 80% of a new product or feature's initial design.


↑ Speed of execution would take precedence.
↗ As the APDG would consist of a very lean team, we would staff projects by augmenting existing product teams in a "triangle offensive", utilized in many consulting models, to enable cross-learning and interchangeability.
↓ I codified a system for quickly identifying designers by 6 temperaments, to most effectively match the right designers with the right projects.

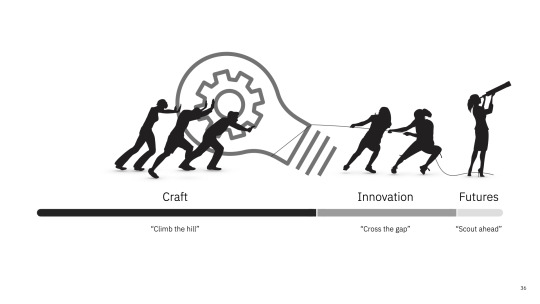
↑ The 6 temperaments align with 3 polyrhythmic trajectories of product development.
↗ APDG designers were deployed to 3 new watsonx AI initiatives to accelerate early-stage time-to-wow.
↑ While Cognos Analytics had already implemented an AI Assistant several years earlier, it was based on older rules-based models. Even though we updated the model later with one of our Granite large-language models, the "assistant" paradigm limited the type of experience that was possible with generative AI.
youtube
↑ The APDG was engaged to reinvent IBM's Business Intelligence platform for the AI era. Within 3 weeks of co-creation with stakeholders across 6 areas of the business—design, engineering, product management, sales, marketing, and research—we envisioned an AI-powered intelligent journal.
↓ The intelligent journal vision concept helped stakeholders acquire $5M initial round of funding to develop the watsonx BI Assistant. A private-beta was announced and demoed at THINK 2024, only 10 months after our concept.
youtube

↑ Our future roadmap, informed by the 3 Horizons foresight effort, and demonstrated with the announcement and private preview of watsonx BI Assistant, moved IBM from the niche to visionary quadrant in Gartner's annual report.
youtube
↑ The APDG was also engaged by Planning Analytics to discover user-needs based opportunities for AI. We facilitated an inside-to-out of the box innovation exercise with stakeholders from 6 areas of the business.
↓ This exercise lead to the invention of the Model Accuracy feature, which utilized AI to compare a TM1 or planning model to a natural language description of the intended business need or outcome.


vimeo
↑ In Fall 2024, I was tasked with a mission to define a POV for Design Telemetry, and build a new practice that could scale across the organization.
↓ Telemetry goes beyond product analytics: How might we create a real-time, adaptive system that integrates design intelligence, behavioral insights, and predictive foresight—enabling organizations to make proactive, future-proof design decisions that optimize both user experience and monetization?
1 note
·
View note