#GCP node setup
Explore tagged Tumblr posts
Visit Tumblr Blog
Explore Tumblr blogs with no restrictions, modern design and the best experience.
Last Seen Tumblr Blogs


Fun Fact
The most popular pages on Tumblr are about Minecraft, GIFs, and David J. Peterson.
Text
Master Google Cloud: Deploying Node JS APIs on VM
Full Video Link - https://youtu.be/gxZ-iJNCbAM Check out this new video on the CodeOneDigest YouTube channel! Learn how to create Virtual Machine in Google Cloud Platform, Setup Google Compute Engine VM & Deploy run JS APIs in VM. #codeonedigest
In this tutorial, we will create & setup Google Compute Engine Virtual Machine in Google Cloud Platform. We will be deploying & running javascript APIs in google compute engine virtual machine. We will be opening firewall port for incoming API request in VM. We will also learn how to deploy API code and run API service in google compute engine virtual machine. I will provide step by step guide to…

View On WordPress
#compute engine#deploy api for free#deploy api in google cloud#deploy node js api#deploy node js api for free#deploy node js application#deploy node js project on server#gcp compute engine interview questions#gcp google cloud platform#google cloud creating a virtual machine#google cloud platform#google cloud platform tutorial#google compute engine#virtual machine setup
0 notes
Text
Taking a Deeper Look at Deepseek Thought Process
What binary is associated with quorum management?
No web access.
Okay, so I'm trying to understand what binary is associated with quorum management in IBM Spectrum Scale. First off, from my previous understanding, quorum management seems to involve several components like the Grid Control Policy (GCP), Replication Agent (RA), and Quorum Manager (QM). But when it comes to binaries, I think we're talking about specific software executables or processes that handle these tasks.
We see that the process is starting off from the wrong conclusion, but the question is can it correct itself? I'm not entirely sure what a "binary" refers to in this context. Maybe it's like an executable file or a specific service running on the nodes? If I recall correctly, Spectrum Scale is built on top of GPFS (General Parallel File System), so maybe some of these binaries are related to that underlying filesystem.
It has issues with the word binary, but sort of gets on the road. I think quorum management involves ensuring that enough nodes are available and in agreement to maintain data consistency. So, there must be specific processes or daemons running that handle this coordination. Maybe something like gcpd for Grid Control Policy Daemon? Or perhaps qmagent for Quorum Manager Agent? Wait, I've heard of spectrum-scaled before—maybe that's the main process for Spectrum Scale itself. Could it be that quorum management is handled by a specific module within this binary or maybe a separate one?
So it actually moves somewhat in the right direction here talking about a main process. I also remember hearing about replication agents (ra), which handle data replication across nodes. Maybe they play a role in ensuring quorum by replicating data to enough nodes. Perhaps there's a tool like quorumadm for managing quorum settings? That seems plausible—it could be used to check the current quorum status or adjust thresholds. I think I need to look into IBM's documentation or release notes for Spectrum Scale. Maybe they mention specific binaries related to quorum management. Alternatively, checking process listings on a node running Spectrum Scale might reveal the relevant processes.
It references looking at the documentation and that is the right call. If I were to run ps aux | grep spectrum on a Spectrum Scale server, would that show me the associated binaries? It might list processes like gcpd, ra, and others. From there, I could identify which ones are directly tied to quorum management. Also, maybe log files or configuration files have hints about these binaries. For example, /etc/spectrum directory might contain config files for GCP or QM. In summary, the key binaries likely include: Grid Control Policy Daemon (gcpd) - Manages high-level policies and thresholds. Quorum Manager Agent (qmagent) - Specifically handles quorum-related tasks. Replication Agent (ra) - Ensures data replication across nodes to meet quorum requirements. I should verify this by checking IBM's official documentation or through practical inspection on a Spectrum Scale setup.
As you can see the "thoughts" completely revolve around whatever it previously "thought". It isn't really able to re-examine previous conclusions here.
Can you confirm with sources the above?
Web access.
Okay, so I'm trying to figure out which binary is associated with quorum management in IBM Spectrum Scale based on what was said earlier. The previous answer listed three binaries: Grid Control Policy Daemon (gcpd), Quorum Manager Agent (qmagent), and Replication Agent (ra). Now, the user is asking me to confirm this information using the provided context. First, I need to look at the context given. It includes some sources from IBM's documentation about quorum nodes in Spectrum Scale. The first source talks about how quorum is defined as one plus half of the explicitly defined quorum nodes and mentions that there are no default quorum nodes; you have to specify which ones. The second source seems to be repeating the same information, so it doesn't add anything new. The third source again discusses node quorum in Spectrum Scale and provides an example configuration with three quorum nodes. Looking at these sources, they all focus on how quorum is defined and configured within the cluster but don't mention any specific binaries or processes that manage quorum. They talk about quorum nodes and configurations, not the underlying software components responsible for handling quorum logic. Given this, it seems like the earlier answer might be based more on general knowledge of Spectrum Scale rather than directly citing the provided context. The sources don't explicitly name any binaries associated with quorum management. Therefore, I can't confirm the binaries listed (gcpd, qmagent, ra) using the given context because they aren't mentioned there.
Here is where it goes off the rails. It doesn't find its previous idea in the documentation, but rather than starting fresh it says I can't confirm my previous answer. I should probably explain this to the user, letting them know that while those binaries might be related based on general knowledge of Spectrum Scale, the provided sources don't mention them. It would also be helpful to suggest looking into IBM's official documentation or other reliable sources for confirmation.
It then simply goes back to its conclusion that those wrong binaries are possibly correct even after finding no evidence that they are.
So quorum management is not handled mmfsd?
No web access.
Alright, so I'm trying to understand how quorum management works in IBM Spectrum Scale. From what I gathered earlier, there are these components like gcpd, qmagent, and ra that might be involved in managing quorum. But then, the user asked if mmfsd is related to quorum management. First, I need to figure out what mmfsd is. MMFSD stands for Multiple Mirror File System Daemon, right? It's a part of IBM Spectrum Scale used for file system operations and mirroring data across nodes. So, does it handle quorum? Quorum in distributed systems usually refers to the minimum number of nodes that need to be available to ensure consistency and avoid split-brain scenarios. In Spectrum Scale, maintaining quorum is essential for making sure that decisions like data replication are consistent across all nodes.
Here it goes off the rails. It gets lost in the semantics of what does mmfsd stand for. It also doesn't seem to strongly associate Spectrum Scale and GPFS. But if mmfsd is primarily about file system operations and mirroring, maybe it's more about ensuring data availability rather than managing the quorum itself. I think quorum management might be handled at a higher level, possibly by components like gcpd or qmagent, which manage policies and replication across the cluster.
It again returns to the same error with gcpd and qmagent. However, there's some ambiguity here. The user suggested that these binaries like gcpd, qmagent, and ra are involved in quorum management, but based on the context provided earlier, they aren't explicitly mentioned. So, I'm not entirely sure if mmfsd is directly responsible for quorum or if it works alongside other components. To clarify, maybe I should look into IBM's official documentation or case studies that explain how Spectrum Scale manages quorum internally. It would help to see which binaries are actually involved in the process and their specific roles.
It claims that I suggested those binaries it made up are part of the process, but it can't confirm and I didn't say they were–so where is that coming from? In summary, while mmfsd deals with file system mirroring and data availability, it doesn't seem directly responsible for managing the quorum itself. Quorum management likely involves other components that ensure a sufficient number of nodes agree on data states before committing changes.
Is mmfsd involved in quorum management in IBM spectrum scale GPFS?
Let's ask directly.
Web access.
Alright, the user is asking whether mmfsd is involved in quorum management within IBM Spectrum Scale GPFS. From previous interactions, I remember that the user has been exploring how quorum management works in this system and had some confusion about which binaries are responsible.
It continues to go back to its old data.
Looking at the context provided earlier, there was information about node quorum and commands related to changing quorum settings, but nothing directly mentioning mmfsd. In fact, when I previously explained the components involved, like GCP, RA, and QM, the user then asked for confirmation with sources, which led me to clarify that those binaries weren't explicitly mentioned in the context.
Now, the user is specifically asking about mmfsd. My previous response indicated that mmfsd isn’t directly involved in quorum management but handles file system operations. However, I need to make sure this is accurate and based on reliable sources.
I should check if there are any IBM documents or official resources that link mmfsd to quorum processes. If not, it's safer to say that mmfsd isn't the process handling quorum. Instead, higher-level daemons manage quorum, ensuring data consistency across nodes without mmfsd's direct involvement.
The user might be trying to troubleshoot an issue or configure their environment correctly, so providing clear information about each component’s role is essential. They probably want to understand where to focus their efforts for quorum settings and avoid confusion with file system operations handled by mmfsd.
So it executes this search "IBM Spectrum Scale mmfsd quorum management documentation" to try to find the information. This search is sort of backing into the information, and a better more explicit search would return the right answer.
Analysis
As I mentioned before I think calling this "thinking" is a stretch. It is a facsimile of thought perhaps. The "thought" process is rigidly attached to prior statements if not immediately found to be false or denied by the user. This seems to cause the system to stick to its path and not re-evaluate based on a lack of evidence.
I am not sure how much of this failure is that it's a 14B parameter model, but the "thinking" is very weak here. Even if we take the more explicit question into a new chat it can't get the answer right.
I wanted to document this partly for my memory, but also partly as a demonstration of how weak the "thinking" is. Deepseek makes a finding and can't reason its way out–even when it has no evidence. The lack of evidence doesn't weaken its position. Deepseek is kind of an alternative facts machine–given that even in light of no evidence–that is still insufficient evidence for it to say that it is wrong and try a new direction.
4 notes
·
View notes
Text
Master DevOps Like a Pro: Learn Terraform, Kubernetes, Ansible & Docker in One Course

If you're dreaming of mastering DevOps and landing high-paying roles in tech, there's no better time than now to level up your skills. Whether you're a system admin, developer, or IT professional aiming to break into the DevOps world, the right tools and training make all the difference. What if you could learn the most in-demand DevOps technologies—Terraform, Kubernetes, Ansible, and Docker—all in one place?
Introducing the DevOps MasterClass: Terraform Kubernetes Ansible Docker—a complete, hands-on course designed to equip you with real-world skills that employers are actively searching for.
Let’s explore what makes this course so powerful and why it might just be the best decision you make for your tech career.
🚀 Why DevOps Is Changing the Tech Industry
Before we dive into the tools, let's quickly understand why DevOps is a game-changer.
Traditional software development and operations used to work in silos. Developers wrote the code, and operations teams handled deployments. The result? Slow, buggy releases and constant miscommunication.
DevOps breaks those silos—it's a culture, a set of practices, and a toolkit that enables teams to collaborate better, release faster, and maintain higher software quality. With major companies like Netflix, Amazon, and Google using DevOps pipelines, the demand for skilled DevOps engineers is skyrocketing.
🎯 What Makes This MasterClass Stand Out?
There are dozens of DevOps tutorials online—but here’s why this DevOps MasterClass: Terraform Kubernetes Ansible Docker truly stands out:
All-in-One Learning: Learn four top tools in one place—Terraform, Kubernetes, Ansible, and Docker.
Real-World Projects: Not just theory. You’ll work on projects that simulate real DevOps environments.
Beginner to Advanced: No matter your level, the course guides you step-by-step.
Lifetime Access: Learn at your own pace and revisit anytime.
Industry-Relevant Curriculum: Aligned with what companies actually use in production.
🧰 The DevOps Toolkit You’ll Master
Let’s break down the four core tools you'll be learning—and why each is so important for modern DevOps practices.
1. Terraform: Infrastructure as Code Made Easy
Imagine being able to create, manage, and scale infrastructure with just a few lines of code. That’s Terraform for you.
Instead of manually setting up cloud resources (which is time-consuming and error-prone), Terraform lets you define everything as code. Whether it’s AWS, Azure, or GCP, Terraform handles it with elegance.
You’ll learn:
How to write Terraform configuration files
Create and destroy cloud resources with ease
Build reusable infrastructure modules
Automate cloud provisioning
This part of the course helps you build the foundations of Infrastructure as Code (IaC)—a must-have skill in modern cloud environments.
2. Kubernetes: Container Orchestration Done Right
Kubernetes, often called K8s, is the gold standard for managing containers. If Docker helps you build and ship containers, Kubernetes helps you scale, manage, and monitor them in production.
In the course, you’ll cover:
Kubernetes architecture (pods, nodes, services)
Deploying applications using YAML
Scaling applications up/down automatically
Handling updates and rollbacks
Managing persistent storage and secrets
This is essential if you’re aiming to run apps at scale and work with microservices.
3. Ansible: Configuration Management Without the Hassle
Ansible makes IT automation simple. It allows you to configure servers, install software, and manage services with human-readable playbooks—no coding headaches.
What you’ll learn:
Writing and running Ansible playbooks
Automating server setups (Linux, cloud VMs, etc.)
Managing app deployments with Ansible roles
Integrating Ansible with CI/CD pipelines
This will help you automate repetitive tasks and maintain consistent environments—a crucial DevOps capability.
4. Docker: The Foundation of Modern DevOps
Docker changed everything. It made app packaging and deployment incredibly easy. Instead of “it works on my machine,” Docker ensures it works everywhere.
You’ll master:
Dockerfile creation and image building
Working with Docker Hub and registries
Networking and volumes
Docker Compose for multi-container apps
Best practices for image optimization and security
Docker is the first tool many DevOps learners start with—and in this course, it’s covered thoroughly.
🔄 How These Tools Work Together in a DevOps Pipeline
These four tools don’t work in isolation—they complement each other perfectly:
Docker packages the application.
Ansible automates the server environment.
Terraform sets up the infrastructure.
Kubernetes deploys and scales your Docker containers.
By mastering this combo, you’ll be able to build a robust, automated DevOps pipeline that mirrors real-world enterprise environments.
💼 Who Should Take This Course?
The DevOps MasterClass: Terraform Kubernetes Ansible Docker is ideal for:
Aspiring DevOps engineers looking to enter the field
System admins who want to automate and modernize infrastructure
Developers who want to understand deployments better
Cloud professionals who need to work across platforms
IT managers who want to upskill their team or shift into DevOps roles
If you’re passionate about learning and ready to commit, this course is your launchpad.
🧠 What You’ll Build (Hands-On Projects)
Unlike dry tutorials, this course emphasizes hands-on experience. Expect to build and manage:
Real-world infrastructure using Terraform on AWS
Scalable deployments on Kubernetes clusters
Automated software installation using Ansible
Containerized web applications with Docker and Docker Compose
These projects will fill your GitHub portfolio—and help you impress hiring managers or clients.
📈 Job Market Value of These Skills
Let’s talk money. According to Glassdoor and Indeed:
DevOps Engineers earn an average of $115,000 to $150,000 per year
Terraform, Kubernetes, Docker, and Ansible skills are listed in 80% of DevOps job posts
Many companies are looking for multi-skilled professionals who can handle everything from infrastructure to deployment
Learning all four tools gives you a major competitive edge.
🧩 What’s Inside the Course (Module Breakdown)
Here’s a sneak peek at the modules:
Introduction to DevOps & Tools Overview
Docker Basics to Advanced
Working with Docker Compose
Ansible Playbooks and Automation
Terraform Infrastructure Provisioning
Kubernetes Architecture & Deployment
CI/CD Integration with DevOps Tools
Project-Based Learning
Every module includes real-world examples, quizzes, and projects to test your skills.
🌐 Why Learn from This Course Instead of Free Tutorials?
It’s tempting to rely on YouTube or blogs for learning. But here’s what this paid course gives you that free resources don’t:
✅ Structured Curriculum ✅ Lifetime Access ✅ Community Support ✅ Expert Instructor Guidance ✅ Projects to Build Your Portfolio
Investing in a high-quality course isn’t just about information—it’s about transformation. You go from knowing a tool to mastering it with confidence.
✨ What Learners Are Saying
⭐ “This course helped me land a DevOps role in just 3 months. The Terraform and Kubernetes modules were spot on.” — Ravi, India
⭐ “I was new to Docker and Ansible, and now I deploy apps in Kubernetes like a pro. Highly recommend this course!” — Jessica, UK
⭐ “Finally, a practical course that teaches how these tools work together. Worth every minute.” — Carlos, USA
🎓 Final Thoughts: Your DevOps Journey Starts Now
The tech world is evolving rapidly, and DevOps is no longer optional—it’s essential. With this DevOps MasterClass: Terraform Kubernetes Ansible Docker, you gain a complete DevOps skill set that’s immediately applicable in the real world.
Don’t waste time juggling multiple incomplete tutorials. Master everything in one comprehensive, expertly designed course.
👉 Take charge of your future. Learn the most in-demand tools. Build real projects. And become the DevOps expert companies are searching for.
Ready to get started?
Enroll in the DevOps MasterClass now and take your first step toward DevOps mastery.
0 notes
Text
Kubernetes vs. Traditional Infrastructure: Why Clusters and Pods Win
In today’s fast-paced digital landscape, agility, scalability, and reliability are not just nice-to-haves—they’re necessities. Traditional infrastructure, once the backbone of enterprise computing, is increasingly being replaced by cloud-native solutions. At the forefront of this transformation is Kubernetes, an open-source container orchestration platform that has become the gold standard for managing containerized applications.
But what makes Kubernetes a superior choice compared to traditional infrastructure? In this article, we’ll dive deep into the core differences, and explain why clusters and pods are redefining modern application deployment and operations.
Understanding the Fundamentals
Before drawing comparisons, it’s important to clarify what we mean by each term:
Traditional Infrastructure
This refers to monolithic, VM-based environments typically managed through manual or semi-automated processes. Applications are deployed on fixed servers or VMs, often with tight coupling between hardware and software layers.
Kubernetes
Kubernetes abstracts away infrastructure by using clusters (groups of nodes) to run pods (the smallest deployable units of computing). It automates deployment, scaling, and operations of application containers across clusters of machines.
Key Comparisons: Kubernetes vs Traditional Infrastructure
Feature
Traditional Infrastructure
Kubernetes
Scalability
Manual scaling of VMs; slow and error-prone
Auto-scaling of pods and nodes based on load
Resource Utilization
Inefficient due to over-provisioning
Efficient bin-packing of containers
Deployment Speed
Slow and manual (e.g., SSH into servers)
Declarative deployments via YAML and CI/CD
Fault Tolerance
Rigid failover; high risk of downtime
Self-healing, with automatic pod restarts and rescheduling
Infrastructure Abstraction
Tightly coupled; app knows about the environment
Decoupled; Kubernetes abstracts compute, network, and storage
Operational Overhead
High; requires manual configuration, patching
Low; centralized, automated management
Portability
Limited; hard to migrate across environments
High; deploy to any Kubernetes cluster (cloud, on-prem, hybrid)
Why Clusters and Pods Win
1. Decoupled Architecture
Traditional infrastructure often binds application logic tightly to specific servers or environments. Kubernetes promotes microservices and containers, isolating app components into pods. These can run anywhere without knowing the underlying system details.
2. Dynamic Scaling and Scheduling
In a Kubernetes cluster, pods can scale automatically based on real-time demand. The Horizontal Pod Autoscaler (HPA) and Cluster Autoscaler help dynamically adjust resources—unthinkable in most traditional setups.
3. Resilience and Self-Healing
Kubernetes watches your workloads continuously. If a pod crashes or a node fails, the system automatically reschedules the workload on healthy nodes. This built-in self-healing drastically reduces operational overhead and downtime.
4. Faster, Safer Deployments
With declarative configurations and GitOps workflows, teams can deploy with speed and confidence. Rollbacks, canary deployments, and blue/green strategies are natively supported—streamlining what’s often a risky manual process in traditional environments.
5. Unified Management Across Environments
Whether you're deploying to AWS, Azure, GCP, or on-premises, Kubernetes provides a consistent API and toolchain. No more re-engineering apps for each environment—write once, run anywhere.
Addressing Common Concerns
“Kubernetes is too complex.”
Yes, Kubernetes has a learning curve. But its complexity replaces operational chaos with standardized automation. Tools like Helm, ArgoCD, and managed services (e.g., GKE, EKS, AKS) help simplify the onboarding process.
“Traditional infra is more secure.”
Security in traditional environments often depends on network perimeter controls. Kubernetes promotes zero trust principles, pod-level isolation, and RBAC, and integrates with service meshes like Istio for granular security policies.
Real-World Impact
Companies like Spotify, Shopify, and Airbnb have migrated from legacy infrastructure to Kubernetes to:
Reduce infrastructure costs through efficient resource utilization
Accelerate development cycles with DevOps and CI/CD
Enhance reliability through self-healing workloads
Enable multi-cloud strategies and avoid vendor lock-in
Final Thoughts
Kubernetes is more than a trend—it’s a foundational shift in how software is built, deployed, and operated. While traditional infrastructure served its purpose in a pre-cloud world, it can’t match the agility and scalability that Kubernetes offers today.
Clusters and pods don’t just win—they change the game.
0 notes
Text
Top Performance Optimization Strategies Experts Trust in 2025
Introduction

Performance optimization strategies form the backbone of any system that aims to deliver speed, scalability, and reliability, especially under unpredictable traffic and data loads. As platforms grow more complex, choosing the right strategy becomes just as critical as choosing the right tech stack.
Whether you're operating in a monolith or adopting a modular approach, a well-defined microservices architecture scalability guide ensures that each service scales independently, without draining shared resources or increasing latency.
From backend response times to frontend load handling, every layer of your product must be tuned to perform efficiently. That’s where high-impact software product engineering services come in, bringing expertise in system design, observability, caching strategies, and infrastructure optimization.
In this blog, we’ll break down what expert product engineers do to solve system performance issues and the real benefits of these strategies.
Core Areas of Performance Optimization

Before applying advanced performance optimization strategies, expert product engineers focus on key architectural areas that affect speed, reliability, and cost. From request handling to rendering and infrastructure setup, each layer offers opportunities to improve system responsiveness under load.
Let’s take a look at the core areas of system performance optimization,
Frontend Optimization
Slow-loading frontends are a primary reason for high bounce rates. Idle system assets, unused JavaScript, and render-blocking CSS all slow down the experience. Through lazy loading, critical-path rendering, and CDN delivery, businesses can apply focused website performance optimization for traffic spikes.
Tools like Lighthouse and WebPageTest help identify real-world bottlenecks and browser-specific delays.
Backend Performance Tuning
Optimizing routes, indexing databases, and reducing heavy payloads help drastically improve API response time. Many tech experts use Redis for in-memory caching, asynchronous queues to offload processes, and apply query optimization as part of consistent backend performance tuning. These methods are essential for maintaining the efficiency of a microservices architecture.
Infrastructure and Deployment Efficiency
Even a well-optimized app will fail on an unprepared infrastructure. Engineers deploy autoscaling nodes, load balancers, and multi-zone architectures to deliver scalable infrastructure for high-traffic events. Tools like Kubernetes, AWS ECS, or GCP Cloud Run help distribute load across regions.
How Experts Identify and Measure Performance Bottlenecks?
No performance optimization effort is effective unless it’s measurable. Tech experts rely on data-driven workflows to detect, isolate, and fix issues before they impact real users. Their process always begins with business visibility, knowing exactly where the system starts to slow down under load, and these points mentioned below,
The Right Tools for Web Performance Optimization
Tools like Lighthouse, WebPageTest, and Chrome DevTools quickly detect rendering frontend issues. For backend and infrastructure, businesses can depend on Prometheus, Grafana, and New Relic for real-time telemetry and alerting. These are industry-standard tools for enhanced web performance optimization, giving teams both high-level views and granular insights across services.
Key Metrics to Track for App Speed
Tech experts monitor response time percentiles (P50, P95, P99), Apdex scores, throughput (RPS), memory leaks, garbage collection behavior, and CPU usage under stress. These are the most actionable metrics to track for app speed, especially in distributed environments.
Error Rate Patterns and Alert Thresholds
Monitoring error trends over time, rather than just current status, is critical. Spikes in 5xx errors, timeouts, and DB lock events are early signals of system degradation. You must set alert thresholds not just on uptime, but on patterns that reveal performance regression over time.
Profiling and Tracing
For deep-dive diagnostics, engineers use profiling tools like Py-spy, Blackfire, or Xdebug to catch code-level inefficiencies. Distributed tracing tools like Jaeger and OpenTelemetry allow mapping of slow services across microservice chains. It's essential for maintaining reliability in complex deployments.
Top Performance Optimization Strategies Experts Utilize

When performance matters at scale, tech experts don’t rely on guesswork, they use tested, measurable, and replicable approaches.
These performance optimization strategies go beyond surface-level improvements and target the core behaviors of your system in real-world conditions.
Use Multi-Layered Caching
You can implement caching at the database, application, and edge levels to reduce redundant computation and speed up delivery. Using Redis, Memcached, and edge caching via CDNs ensures that static and semi-dynamic content doesn’t overwhelm origin servers. This is one of the most effective backend performance tuning techniques to handle scale.
Break Down Heavy Processes with Queues
To maintain fast response times, time-consuming tasks like PDF generation, payment processing, or image optimization are pushed to asynchronous queues. Technologies like RabbitMQ, SQS, or BullMQ allow decoupling of these jobs, which helps improve API response time during user interaction.
Deploy Lightweight Containers with Autoscaling
Running services inside Docker containers, managed through Kubernetes or ECS, allows dynamic horizontal scaling. With smart autoscaling rules based on CPU/memory usage, services can expand instantly during spikes. This is essential when planning scalable infrastructure for high-traffic events.
Apply Code Splitting and Lazy Loading on Frontend
Instead of delivering the full application on initial load, code splitting sends only the necessary parts first. Lazy loading defers offscreen images and scripts, which improves first interaction speed and overall load time. It supports broader website performance optimization for traffic spikes.
Run Load Testing Regularly
Top businesses treat performance like a moving target, they don’t optimize once and forget it. They use tools like k6, Gatling, and Artillery to simulate peak conditions and gather consistent metrics. Regular testing aligns with the principles of modern software product engineering services, where performance is tied directly to deployment velocity and scale-readiness.
Impact of Common System Bottlenecks in Your Business

System bottlenecks can significantly degrade application performance, leading to user dissatisfaction and revenue loss. Understanding their impact is crucial for implementing effective performance optimization-based digital solutions.
Performance Degradation
Bottlenecks often result in increased response times and system downtime. For instance, database bottlenecks can limit a system's ability to process requests efficiently, causing delays and potential timeouts.
Operational Inefficiencies
Persistent bottlenecks can strain system resources, leading to increased maintenance costs and reduced scalability. Addressing these issues proactively is essential to maintain the system’s operational efficiency.
User Experience Decline
Even minor delays affect user engagement metrics. A study shows that a 1-second delay can reduce customer satisfaction by 16% and drop conversion rates by up to 7%. This makes it essential to eliminate performance bottlenecks across all tiers, UI to infrastructure.
Revenue Loss
Frequent system downtime or degraded performance directly hits revenue. A report found that 93% of enterprises lose $300K+ per hour of downtime, while 48% lose over $1M/hour. Businesses must understand that performance isn’t a technical metric, it's a bottom-line KPI.
Scalability Blockers
Undetected system bottlenecks halt its ability to scale efficiently. As systems grow, unresolved constraints compound, requiring full redesigns instead of simple scale-outs. A robust microservices architecture can prevent this, but only when teams proactively eliminate performance bottlenecks before its expansion.
Checklist to Implement Expert-Level System Performance Optimization
Before launching your next product update or high-traffic campaign, this checklist will help you align your system with expert-approved standards. Businesses can make much benefit out of these performance optimization strategies, ensuring they’re fully equipped to scale reliably and avoid costly performance setbacks!
Frontend
Minify JavaScript and CSS bundles
Implement lazy loading and async scripts
Use a CDN for static assets to improve global delivery
Audit page speed with Lighthouse or WebPageTest
Backend
Optimize slow DB queries and set indexes properly
Introduce caching layers (Redis, Memcached)
Use queues to offload heavy processes
Apply proven backend performance tuning techniques
System Infrastructure
Configure autoscaling and load balancers
Deploy services in lightweight containers for flexibility
Implement fault tolerance with zone or region failover
Design around a scalable infrastructure for high-traffic events
System Monitoring & Testing
Set up real-time system monitoring (Datadog, Prometheus, New Relic)
Track core KPIs like response time percentiles, Apdex scores, and CPU thresholds
Use load testing tools like K6 or Artillery to simulate real spikes
Schedule regular drills to eliminate performance bottlenecks before they scale within the system
Bottomline
In today’s high-demand digital environment, performance isn’t optional, it’s a competitive advantage. Users expect fast, reliable applications, and businesses that fail to meet these expectations risk losing both revenue and reputation. This is why leading businesses consistently invest in well-defined performance optimization strategies, that extend from code to cloud.
By combining frontend delivery improvements, backend performance tuning, and infrastructure readiness, modern applications can handle growth without sacrificing reliability. These aren’t one-time fixes, they’re ongoing, measurable efforts applied through the development lifecycle.
Partnering with expert-led software product engineering services brings additional clarity and speed to performance initiatives. These teams understand the nuances of system scaling and help implement distributed caching, container orchestration, and CI/CD-integrated monitoring tools.
Building a scalable infrastructure for high-traffic events is not just about autoscaling instances. But it’s also about anticipating failure points, load-testing under pressure, and ensuring the architecture grows with demand. Every second of a saved response time improves user experience, reduces bounce rate, and increases users’ trust.
The most successful digital products are the ones that can scale without experiencing frequent system slowdowns. With the right performance approach, you can set a whole new and strong foundation for sustainable growth.
FAQs
What are performance optimization strategies in software systems?
Performance optimization strategies refer to structured techniques used to improve the speed, stability, and scalability of software applications. These include caching, load balancing, code refactoring, and infrastructure tuning. Businesses implement these strategies to enhance user experience and reduce system strain under load.
How can backend performance tuning improve application speed?
Backend performance tuning focuses on optimizing database queries, server logic, and API response times. It reduces processing delays and improves overall transaction flow across services. Developers utilize indexing, query profiling, and async operations to speed up backend execution. This results in faster data delivery and better system responsiveness.
Why is scalable infrastructure important for traffic-heavy events?
A scalable infrastructure for high-traffic events ensures your application remains available during demand spikes. Without it, systems risk downtime, latency spikes, and user churn. Autoscaling, distributed systems, and failover setups are key to absorbing sudden traffic loads.
What role do software product engineering services play in performance?
Software product engineering services provide expert support for performance audits, architectural improvements, and DevOps automation. They bring deep technical insight to resolve system bottlenecks and scale it efficiently. These services are especially valuable when internal teams lack bandwidth or expertise. Their involvement accelerates optimization without disrupting ongoing delivery.
Original Source : https://medium.com/@mukesh.ram/impact-of-common-system-bottlenecks-in-your-business-b7fc1565ceff
#Backend Performance Tuning#Improve API Response Time#Performance Optimization#Optimization Strategies
0 notes
Text
How DNS-Based Endpoints Enhance Security in GKE Clusters
DNS-Based Endpoints
In order to prevent unwanted access while maintaining cluster management, it is crucial to restrict access to the cluster control plane, which processes Kubernetes API calls, as you are aware if you use Google Kubernetes Engine (GKE).
Authorized networks and turning off public endpoints were the two main ways that GKE used to secure the control plane. However, accessing the cluster may be challenging when employing these techniques. To obtain access through the cluster’s private network, you need to come up with innovative solutions like bastion hosts, and the list of permitted networks needs to be updated for every cluster.
Google Cloud is presenting a new DNS-based endpoint for GKE clusters today, which offers more security restrictions and access method flexibility. All clusters have the DNS-based endpoint available today, irrespective of cluster configuration or version. Several of the present issues with Kubernetes control plane access are resolved with the new DNS-based endpoint, including:
Complex allowlist and firewall setups based on IP: ACLs and approved network configurations based on IP addresses are vulnerable to human setup error.
IP-based static configurations: You must adjust the approved network IP firewall configuration in accordance with changes in network configuration and IP ranges.
Proxy/bastion hosts: You must set up a proxy or bastion host if you are accessing the GKE control plane from a different cloud location, a distant network, or a VPC that is not the same as the VPC where the cluster is located.
Due to these difficulties, GKE clients now have to deal with a complicated configuration and a perplexing user experience.
Introducing a new DNS-based endpoint
Any network that can connect to Google Cloud APIs, such as VPC networks, on-premises networks, or other cloud networks, can access the frontend that the DNS name resolves to. This front-end Each cluster control plane has its own DNS or fully qualified domain name (FQDN) with the new DNS-based endpoint for GKE routes traffic to your cluster after using security policies to block unwanted traffic.Image credit to Google cloud
This strategy has several advantages:
Simple flexible access from anywhere
Proxy nodes and bastion hosts are not required when using the DNS-based endpoint. Without using proxies, authorized users can access your control plane from various clouds, on-premises deployments, or from their homes. Transiting various VPCs is unrestricted with DNS-based endpoints because all that is needed is access to Google APIs. You can still use VPC Service Controls to restrict access to particular networks if you’d like.
Dynamic Security
The same IAM controls that safeguard all GCP API access are also utilized to protect access to your control plane over the DNS-based endpoint. You can make sure that only authorized users, regardless of the IP address or network they use, may access the control plane by implementing identity and access management (IAM) policies. You can easily remove access to a specific identity if necessary, without having to bother about network IP address bounds and configuration. IAM roles can be tailored to the requirements of your company.
See Customize your network isolation for additional information on the precise permissions needed to set up IAM roles, rules, and authentication tokens.
Two layers of security
You may set up network-based controls with VPC Service Controls in addition to IAM policies, giving your cluster control plane a multi-layer security architecture. Context-aware access controls based on network origin and other attributes are added by VPC Service Controls. The security of a private cluster that is only accessible from a VPC network can be equaled.
All Google Cloud APIs use VPC Service Controls, which ensures that your clusters’ security setup matches that of the services and data hosted by all other Google Cloud APIs. For all Google Cloud resources used in a project, you may provide solid assurances for the prevention of illegal access to data and services. Cloud Audit Logs and VPC Service Controls work together to track control plane access.
How to configure DNS-based access
The procedure of setting up DNS-based access for the GKE cluster control plane is simple Check the next steps.
Enable the DNS-based endpoint
Use the following command to enable DNS-based access for a new cluster:
$ gcloud container clusters create $cluster_name –enable-dns-access
As an alternative, use the following command to allow DNS-based access for an existing cluster:
$ gcloud container clusters update $cluster_name –enable-dns-acces
Configure IAM
Requests must be authenticated with a role that has the new IAM authorization in order to access the control plane.
roles/container.developer
roles/container.viewer
Ensure your client can access Google APIs
You must confirm that your client has access to Google APIs if it is connecting from a Google VPC. Activating Private Google Access, which enables clients to connect to Google APIs without using the public internet, is one approach to accomplish this. Each subnet has its own configuration for private Google Access.
Tip: Private Google Access is already enabled for node subnetworks.
[Selective] Setting up access to Google APIs via Private Service Connect
The Private Service Connect for Google APIs endpoint, which is used to access the other Google APIs, can be used to access the DNS endpoint of the cluster. To configure Private Service Connect for Google APIs endpoints, follow the instructions on the Access Google APIs through endpoints page.
Since using a custom endpoint to access the cluster’s DNS is not supported, as detailed in the use an endpoint section, in order to get it to work, you must create a CNAME to “gke.goog” and an A record between “gke.goog” and the private IP allocated to Private Service Connect for Google APIs.
Try DNS access
You can now try DNS-based access. The following command generates a kubeconfig file using the cluster’s DNS address:
gcloud container clusters get-credentials $cluster_name –dns-endpoint
Use kubectl to access your cluster. This allows Cloud Shell to access clusters without a public IP endpoint, previously required a proxy.
Extra security using VPC Service Controls
Additional control plane access security can be added with VPC Service Controls.
What about the IP-based endpoint?
You can test DNS-based control plane access without affecting your clients by using the IP-based endpoint. After you’re satisfied with DNS-based access, disable IP-based access for added security and easier cluster management:
gcloud container clusters update $cluster_name –enable-ip-access=false
Read more on Govindhtech.com
#DNS#Security#GKE#GKEClusters#Kubernetes#API#DNSbased#VPCnetworks#GoogleAPIs#News#Technews#Technology#Technologynews#Technologytrends#Govindhtech
1 note
·
View note
Text
Master Ansible: Automation & DevOps with Real Projects
Introduction
In today's fast-paced IT world, automation is no longer a luxury; it's a necessity. One of the most powerful tools driving this revolution is Ansible. If you're looking to simplify complex tasks, reduce human error, and speed up your workflows, mastering Ansible is a must. This article will take you through Ansible’s role in DevOps and automation, providing practical insights and real-world examples to help you get the most out of it.
What is Ansible?
Ansible is an open-source tool that automates software provisioning, configuration management, and application deployment. Initially developed by Michael DeHaan in 2012, it has quickly risen to become a favorite among IT professionals.
The tool is known for its simplicity, as it doesn’t require agents to be installed on the machines it manages. Ansible operates through a simple YAML syntax, making it accessible even to beginners.
Why Ansible is Essential for Automation
Ansible’s automation capabilities are vast. It saves time by automating repetitive tasks, such as server configuration and software installations. By eliminating manual processes, it reduces the chance of human error. In short, Ansible gives teams more time to focus on high-priority work, enabling them to be more productive.
The Role of Ansible in DevOps
In a DevOps environment, where continuous integration and continuous deployment (CI/CD) pipelines are critical, Ansible plays a crucial role. It helps manage configurations, automate deployments, and orchestrate complex workflows across multiple systems. This ensures that your applications are delivered faster and with fewer issues.
Key Areas Where Ansible Shines in DevOps:
Configuration Management: Ensures consistency across servers.
Orchestration: Automates multi-tier rollouts.
Continuous Deployment: Simplifies application rollouts with zero downtime.
How Ansible Works
One of the most appealing aspects of Ansible is its agentless architecture. Unlike other automation tools, you don’t need to install agents on the systems Ansible manages. It uses SSH (Secure Shell) to communicate, making it lightweight and secure.
There are two main configuration models:
Push Model: Where Ansible pushes configurations to the nodes.
Pull Model: Common in other tools but not the default in Ansible.
Ansible Playbooks: The Heart of Automation
Playbooks are your go-to resource if you want to automate tasks with Ansible. Playbooks are files written in YAML that define a series of tasks to be executed. They are straightforward and readable, even for those with limited technical expertise.
Understanding Ansible Modules
Ansible comes with a wide range of modules, which are units of code that execute tasks like package management, user management, and networking. You can think of modules as the building blocks of your playbooks.
For example:
apt for managing packages on Ubuntu.
yum for managing packages on CentOS/RHEL.
file for managing files and directories.
Real-World Ansible Use Cases
Ansible isn’t just for small-scale automation. It’s used in enterprises around the world for various tasks. Some common use cases include:
Automating Cloud Infrastructure: Managing AWS, GCP, or Azure environments.
Managing Docker Containers: Automating container orchestration and updates.
Database Management: Automating tasks like backups, migrations, and configuration management.
Ansible vs. Other Automation Tools
Ansible often gets compared to other tools like Puppet, Chef, and Terraform. While each tool has its strengths, Ansible is popular due to its simplicity and agentless nature.
Ansible vs. Puppet: Puppet requires agents, while Ansible does not.
Ansible vs. Chef: Chef has a more complex setup.
Ansible vs. Terraform: Terraform excels at infrastructure as code, while Ansible is better for application-level automation.
Advanced Ansible Techniques
Once you’ve mastered the basics, you can dive into more advanced features like:
Using Variables: Pass data dynamically into your playbooks.
Loops and Conditionals: Add logic to your tasks for more flexibility.
Error Handling: Use blocks and rescue statements to manage failures gracefully.
Ansible Galaxy: Boost Your Efficiency
Ansible Galaxy is a repository for pre-built roles that allow you to speed up your automation. Instead of building everything from scratch, you can leverage roles that the community has shared.
Security Automation with Ansible
Security is a growing concern in IT, and Ansible can help here too. You can automate tasks like:
Security Patches: Keep your systems up-to-date with the latest patches.
Firewall Configuration: Automate firewall rule management.
Monitoring and Logging with Ansible
To ensure that your systems are running smoothly, Ansible can help with monitoring and logging. Integrating tools like ELK (Elasticsearch, Logstash, Kibana) into your playbooks can help you stay on top of system health.
Ansible Best Practices
To ensure your Ansible setup is as efficient as possible:
Structure Your Playbooks: Break large playbooks into smaller, reusable files.
Version Control: Use Git to manage changes.
Document Everything: Make sure your playbooks are well-documented for easy handover and scaling.
Conclusion
Ansible is a powerful automation tool that simplifies everything from configuration management to application deployment. Its simplicity, flexibility, and agentless architecture make it an ideal choice for both small teams and large enterprises. If you're serious about improving your workflows and embracing automation, mastering Ansible is the way forward.
FAQs
What are Ansible's prerequisites?
You need Python installed on both the controller and managed nodes.
How does Ansible handle large infrastructures?
Ansible uses parallelism to manage large infrastructures efficiently.
Can Ansible manage Windows machines?
Yes, Ansible has modules that allow it to manage Windows servers.
Is Ansible free to use?
Ansible is open-source and free, though Ansible Tower is a paid product offering additional features.
How often should playbooks be updated?
Playbooks should be updated regularly to account for system changes, software updates, and security patches.
0 notes
Text
Getting Started with OpenShift: Environment Setup
OpenShift is a powerful Kubernetes-based platform that allows you to develop, deploy, and manage containerized applications. This guide will walk you through setting up an OpenShift environment on different platforms, including your local machine and various cloud services.
Table of Contents
1. [Prerequisites]
2. [Setting Up OpenShift on a Local Machine](#setting-up-openshift-on-a-local-machine)
- [Minishift]
- [CodeReady Containers]
3. [Setting Up OpenShift on the Cloud]
- [Red Hat OpenShift on AWS]
- [Red Hat OpenShift on Azure]
- [Red Hat OpenShift on Google Cloud Platform]
4. [Common Troubleshooting Tips]
5. [Conclusion]
Prerequisites
Before you begin, ensure you have the following prerequisites in place:
- A computer with a modern operating system (Windows, macOS, or Linux).
- Sufficient memory and CPU resources (at least 8GB RAM and 4 CPUs recommended).
- Admin/root access to your machine.
- Basic understanding of containerization and Kubernetes concepts.
Setting Up OpenShift on a Local Machine
Minishift
Minishift is a tool that helps you run OpenShift locally by launching a single-node OpenShift cluster inside a virtual machine.
Step-by-Step Guide
1. Install Dependencies
- VirtualBox: Download and install VirtualBox from [here](https://www.virtualbox.org/).
- Minishift: Download Minishift from the [official release page](https://github.com/minishift/minishift/releases) and add it to your PATH.
2. Start Minishift
Open a terminal and start Minishift:
```sh
minishift start
```
3. Access OpenShift Console
Once Minishift is running, you can access the OpenShift console at `https://192.168.99.100:8443/console` (the IP might vary, check your terminal output for the exact address).

CodeReady Containers
CodeReady Containers (CRC) provides a minimal, preconfigured OpenShift cluster on your local machine, optimized for testing and development.
Step-by-Step Guide
1. Install CRC
- Download CRC from the [Red Hat Developers website](https://developers.redhat.com/products/codeready-containers/overview).
- Install CRC and add it to your PATH.
2. Set Up CRC
- Run the setup command:
```sh
crc setup
```
3. Start CRC
- Start the CRC instance:
```sh
crc start
```
4. Access OpenShift Console
Access the OpenShift web console at the URL provided in the terminal output.

Setting Up OpenShift on the Cloud
Red Hat OpenShift on AWS
Red Hat OpenShift on AWS (ROSA) provides a fully-managed OpenShift service.
Step-by-Step Guide
1. Sign Up for ROSA
- Create a Red Hat account and AWS account if you don't have them.
- Log in to the [Red Hat OpenShift Console](https://cloud.redhat.com/openshift) and navigate to the AWS section.
2. Create a Cluster
- Follow the on-screen instructions to create a new OpenShift cluster on AWS.
3. Access the Cluster
- Once the cluster is up and running, access the OpenShift web console via the provided URL.

Red Hat OpenShift on Azure
Red Hat OpenShift on Azure (ARO) offers a managed OpenShift service integrated with Azure.
Step-by-Step Guide
1. Sign Up for ARO
- Ensure you have a Red Hat and Azure account.
- Navigate to the Azure portal and search for Red Hat OpenShift.
2. Create a Cluster
- Follow the wizard to set up a new OpenShift cluster.
3. Access the Cluster
- Use the URL provided to access the OpenShift web console.

Red Hat OpenShift on Google Cloud Platform
OpenShift on Google Cloud Platform (GCP) allows you to deploy OpenShift clusters managed by Red Hat on GCP infrastructure.
Step-by-Step Guide
1. Sign Up for OpenShift on GCP
- Set up a Red Hat and Google Cloud account.
- Go to the OpenShift on GCP section on the Red Hat OpenShift Console.
2. Create a Cluster
- Follow the instructions to deploy a new cluster on GCP.
3. Access the Cluster
- Access the OpenShift web console using the provided URL.

Common Troubleshooting Tips
- Networking Issues: Ensure that your firewall allows traffic on necessary ports (e.g., 8443 for the web console).
- Resource Limits: Check that your local machine or cloud instance has sufficient resources.
- Logs and Diagnostics: Use `oc logs` and `oc adm diagnostics` commands to troubleshoot issues.
Conclusion
Setting up an OpenShift environment can vary depending on your platform, but with the steps provided above, you should be able to get up and running smoothly. Whether you choose to run OpenShift locally or on the cloud, the flexibility and power of OpenShift will enhance your containerized application development and deployment process.
[OpenShift](https://example.com/openshift.png)
For further reading and more detailed instructions, refer to the www.qcsdclabs.com
#redhatcourses#information technology#linux#container#docker#kubernetes#containerorchestration#containersecurity#dockerswarm#aws
0 notes
Text
Docker Online Training | Visualpath
Docker Machine and Docker Swarm: How They Work?
Introduction:
Docker, with its containerization technology, has revolutionized how applications are built, shipped, and deployed. However, managing Docker containers across various environments can still be a daunting task, especially when dealing with multiple hosts or cloud providers. This is where Docker Machine comes into play, offering a streamlined approach to managing Docker hosts regardless of the underlying infrastructure. - Docker and Kubernetes Training
Docker Machine:
Docker Machine is a tool that enables developers to create and manage Docker hosts on local machines, remote servers, or cloud providers effortlessly. It abstracts away the complexity of setting up Docker environments by automating the provisioning process. With Docker Machine, developers can easily spin up multiple Docker hosts, each with its own configuration, to run containerized applications. - Kubernetes Online Training
Simplified Deployment Workflow:
One of the key benefits of Docker Machine is its simplified deployment workflow. Instead of manually configuring Docker hosts on different platforms, developers can use Docker Machine to automate the process. By simply running a few commands, they can create Docker hosts on local machines for development or on remote servers for production deployment.
Multi-Cloud Support:
Docker Machine offers support for multiple cloud providers, including Amazon Web Services (AWS), Microsoft Azure, Google Cloud Platform (GCP), and more. This allows developers to deploy Docker hosts on their preferred cloud infrastructure without having to deal with the intricacies of each provider's setup process. - Docker Online Training
Scaling with Ease:
Scaling containerized applications can be challenging, especially when dealing with a large number of Docker hosts. Docker Machine simplifies the scaling process by allowing developers to quickly add or remove hosts as needed. Whether it's scaling horizontally to handle increased traffic or vertically to accommodate resource-intensive workloads, Docker Machine provides the tools to effortlessly manage the underlying infrastructure.
Integration with Docker Swarm:
For orchestrating and managing clusters of Docker hosts, Docker Machine seamlessly integrates with Docker Swarm. Developers can use Docker Machine to create Swarm nodes across multiple hosts, enabling high availability and fault tolerance for their applications.
Conclusion:
In conclusion, Docker Machine is a powerful tool for simplifying the management of Docker hosts across various environments. By automating the provisioning process and providing support for multi-cloud deployment, Docker Machine enables developers to focus on building and deploying applications rather than worrying about infrastructure setup.
Visualpath is the Leading and Best Institute for learning Docker And Kubernetes Online in Ameerpet, Hyderabad. We provide Docker Online Training Course, you will get the best course at an affordable cost.
Attend Free Demo
Call on - +91-9989971070.
Visit : https://www.visualpath.in/DevOps-docker-kubernetes-training.html
Blog : https://dockerandkubernetesonlinetraining.blogspot.com/
#docker and kubernetes training#docker online training#docker training in hyderabad#kubernetes training hyderabad#docker and kubernetes online training#docker online training hyderabad#kubernetes online training#kubernetes online training hyderabad
0 notes
Text
Adding Markers and Custom Icons on Google Maps in React.js

Google Maps is a powerful tool for displaying and interacting with geographic information in web applications. In this blog post, we will explore how to add markers with custom icons to a Google Map using React.js. Custom markers can help you make your maps more visually appealing and informative.
Prerequisites: Before we begin, make sure you have the following prerequisites in place:
A basic understanding of React.js and JavaScript.
Node.js and npm (Node Package Manager) installed on your development machine.
A Google Cloud Platform (GCP) account with billing enabled and the Maps JavaScript API enabled.
Let’s get started!
Step 1: Set Up a React.js Project If you don’t already have a React.js project, you can create one using Create React App or your preferred React.js project setup.
npx create-react-app custom-marker-map
cd custom-marker-map
npm start
Step 2: Create a Google Maps Component Next, let’s create a React component that will display the Google Map.
// src/components/GoogleMap.js
import React, { Component } from 'react';
class GoogleMap extends Component {
componentDidMount() {
// Load the Google Maps JavaScript API
const script = document.createElement('script');
script.src = `https://maps.googleapis.com/maps/api/js?key=YOUR_API_KEY&libraries=places`;
script.async = true;
script.defer = true;
script.onload = this.initMap;
document.head.appendChild(script);
}
initMap() {
// Initialize the map
const map = new window.google.maps.Map(document.getElementById('map'), {
center: { lat: 37.7749, lng: -122.4194 }, // Set your initial map center coordinates
zoom: 12, // Set the initial zoom level
});
// Add markers to the map
const marker = new window.google.maps.Marker({
position: { lat: 37.7749, lng: -122.4194 }, // Set marker coordinates
map: map,
icon: 'path/to/custom-marker.png', // Path to your custom marker icon
title: 'Custom Marker',
});
}
render() {
return <div id="map" style={{ width: '100%', height: '400px' }}></div>;
}
}
export default GoogleMap;
In this component, we load the Google Maps JavaScript API using a script tag and initialize the map with a specified center and zoom level. We then add a custom marker to the map using the google.maps.Marker class and provide the path to the custom marker icon.
Step 3: Display the Map Component Now, import and render the GoogleMap component in your main App.js file or any other desired location within your React app.
// src/App.js
import React from 'react';
import './App.css';
import GoogleMap from './components/GoogleMap';
function App() {
return (
<div className="App">
<h1>Custom Marker Map</h1>
<GoogleMap />
</div>
);
}
export default App;
Step 4: Customize the Marker Icon To use a custom icon for your marker, replace 'path/to/custom-marker.png' with the path to your custom marker icon image. You can use a PNG or SVG file for your marker.
Step 5: Run Your React App Start your React app by running:
npm start
You should now see a Google Map with a custom marker icon at the specified coordinates.
Conclusion: In this blog post, we’ve learned how to add markers with custom icons to a Google Map in a React.js application. Custom markers can help you personalize your maps and provide valuable information to your users. You can further enhance your map by adding interactivity and additional features, such as info windows, by exploring the Google Maps JavaScript API documentation. Happy mapping!
React Company provides access to a team of experienced React developers who are ready to answer your questions and help you solve any problems you may encounter.
For any inquiries or further assistance, please don’t hesitate to contact us.
For more details you can connect with bosc tech labs.
0 notes
Text
We built a live streaming infrastructure for a client to serve over 1000 users
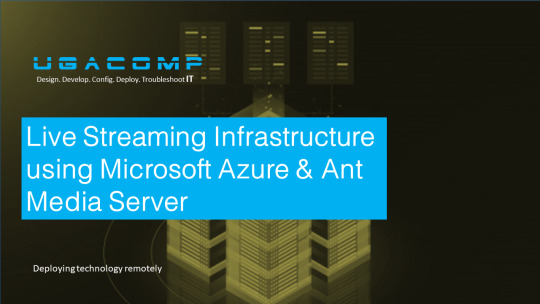
At Ugacomp, we remotely work with clients to offer them technology solutions they need. From remote IT consulting and project assessment to designing and deploying technical projects, we proudly boast of handling 'Everything Tech'
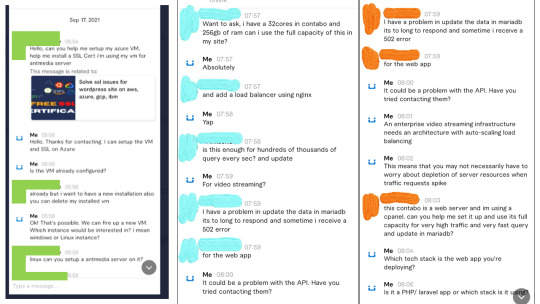
We recently got a remote client from Philippines who wanted us to help him remotely design and deploy a live streaming infrastructure with capacity to serve over 100s of real-time streaming users. Below is a snapshot of some of our discussions we had with this client.
(Critical data about the client has been redacted)
Now, our client's live streaming infrastructure would run on top of Microsoft Azure, without him having to self-host physical IT infrastructure at his business premises. For those of you who don't know anything about Microsoft Azure, it is an Infrastructure-as-a-Service (IaaS) platform that allows you to remotely deploy and configure both virtual and bare metal servers in the cloud.
In order to get started, we undertook a sequence of activities to execute the configurations as needed. And here is how we went about it;
We setup the appropriate billing and subscription Plan
One of the interesting things that make cloud computing interesting is not having to incur upfront spending like in traditional IT infrastructure deployments. Cloud computing offers cost-effective pricing strategy where you have the options of choosing the right subscription for your business. For the case of our client, we setup Azure's Pay as You Go pricing Plan. This is means that Microsoft Azure would charge the client based on the amount of resources the deployed server infrastructure consumes in a given period of time.
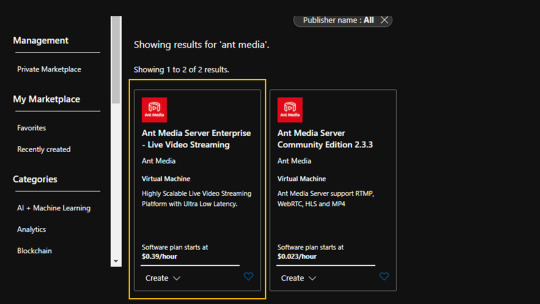
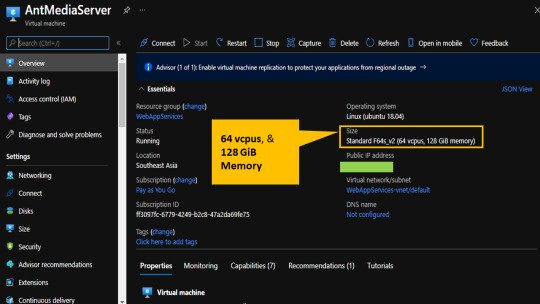
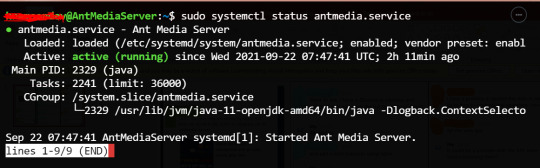
We deployed Ant Media Server Instance
Ant Media Server is an application server designed to handle live video streaming content using User Datagram Protocol (UDP). Ant Media server has two license plans i.e. the free community edition and the enterprise edition license.
We chose the enterprise version because it had all the features and capabilities for enterprise clientele performance setup
The kind of server instance we deployed was 'compute-optimized' with sufficient computing resources to handle high quality video streaming requests from 100s of simultaneous users. We actually opted for 64 Virtual CPU cores and 128 GiB Memory
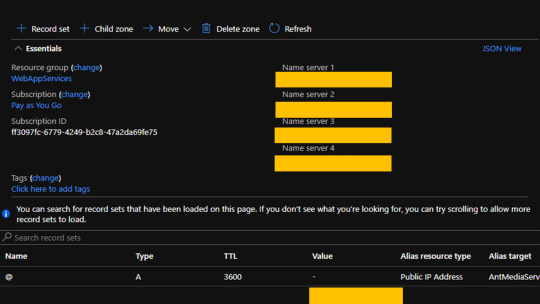
We configured the DNS records
Our client wanted his Live streaming server IP address to be bound to a custom domain name, which he had provided. We had to achieve this by using Azure's DNS Zones' service.
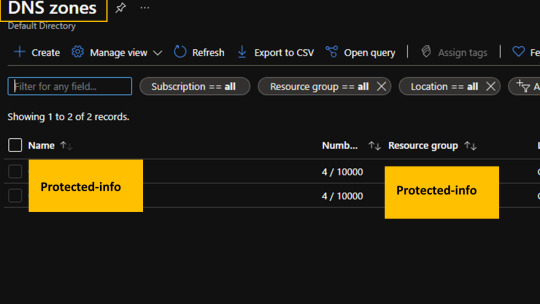
Using Azure's DNS Zones service, we went ahead and configured the Nameservers and other critical DNS records info required to bind custom domain to the server's IP address.
We integrated SSL certificate to the Server
We used SSH to run a couple of commands that helped us to achieve SSL installation to the server. The good thing is that Ant Media application server ships with SSL certificate that we had to configure with a couple of commands.
Configuring Firewall rules
Ant Media Server Azure instance is preconfigured with all the necessary firewall configurations. Once you fire up its preconfigured VM instance, all the necessary security configurations will automatically be installed.
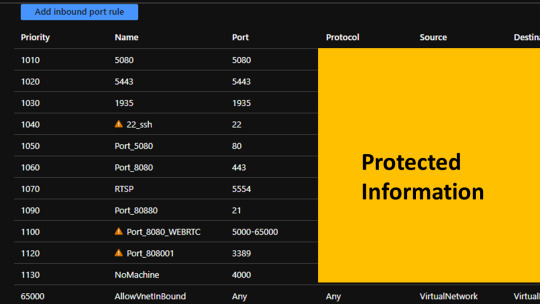
To be sure if everything was working, we fired up our SSH access to the server and checked if ant media was setup and running correctly. We realized everything was fine as we wanted.
Finally, the client's project was up and running within a day. We tirelessly prioritized our client's work as it was urgently needed to be completed in just one day.


We beat the deadline by 6 hours. It was such an incredible project experience we've ever handled.
Our client was happy for the good job we did, Up to now, he keeps consulting with us on a couple of IT support projects. We're continuously helping him to solve or troubleshoot tech problems on a remote basis
How we can work with you
We help clients from any part of the world to design, develop, configure, deploy or troubleshoot any IT project. If you're in our geographical proximity, we can work with you onsite. However, if we can't connect with onsite, then we can use remote-working model to help you execute any tech project you have.
Our services include;
Designing custom Web applications (apps & websites)
Deploying IT infrastructure in the cloud (AWS, Azure, GCP, IBM, Oracle, Alibaba, Digital Ocean, Linode, Contabo, Vultr, SSD Nodes, and more)
Deploying Virtual Desktop environments in the cloud
Configuring VPS servers for web hosting services
IT infrastructure analysis and audit (performance, Security and cost optimization)
Proffessional IT consulting and project assessment
Contractual-based IT support services for businesses or enterprises (onsite and off-site)
Network design and deployment (onsite projects)
Enterprise IT compliance Assessments and Audits
Enterprise technology assessments for businesses and organizations i.e. helping to introduce new tech solutions to your business
Corporate IT trainings for company employees
Onsite IT infrastructure deployment (full-stack configurations and deployments)
Corporate IT Policy formulation and implementation.
Enterprise Software acquisition and licensing
And everything tech as needed by your company or business.
For urgent projects, hire us on Fiverr
We use Fiverr to accept remote hiring because it is a platform that guarantees trust between you; our remote employer and us; the remote employees. After agreeing with us on a particular project, you can pay us through Fiverr. That money will be kept by Fiverr platform. Then, on our side, we will work on your project, complete it and submit it to you. After you've received the completed project as you wanted, Fiverr will release the money to us. If the work isn't done as you wanted, you can ask Fiverr to refund you back your money. It is as secure as that, isn't it? :)
Send us an email; [email protected]. Call us/ WhatsApp us: +256758057003
#technology#techlover#techblog#techcrunch#server#cloud#computing#fiverr#freelance#remotework#hosting#web hosting#application development#mobile apps#android#it career#consulting#digital marketing#digitalmarketing#technical support#it support#information technology#computer science#artificial intelligence#deep learn#deep learning#innovation
3 notes
·
View notes
Quote
by Steef-Jan Wiggers Follow In a recent blog post, Google announced the beta of Cloud AI Platform Pipelines, which provides users with a way to deploy robust, repeatable machine learning pipelines along with monitoring, auditing, version tracking, and reproducibility. With Cloud AI Pipelines, Google can help organizations adopt the practice of Machine Learning Operations, also known as MLOps – a term for applying DevOps practices to help users automate, manage, and audit ML workflows. Typically, these practices involve data preparation and analysis, training, evaluation, deployment, and more. Google product manager Anusha Ramesh and staff developer advocate Amy Unruh wrote in the blog post: When you're just prototyping a machine learning (ML) model in a notebook, it can seem fairly straightforward. But when you need to start paying attention to the other pieces required to make an ML workflow sustainable and scalable, things become more complex. Moreover, when complexity grows, building a repeatable and auditable process becomes more laborious. Cloud AI Platform Pipelines - which runs on a Google Kubernetes Engine (GKE) Cluster and is accessible via the Cloud AI Platform dashboard – has two major parts: The infrastructure for deploying and running structured AI workflows integrated with GCP services such as BigQuery, Dataflow, AI Platform Training and Serving, Cloud Functions, and The pipeline tools for building, debugging and sharing pipelines and components. With the Cloud AI Platform Pipelines users can specify a pipeline using either the Kubeflow Pipelines (KFP) software development kit (SDK) or by customizing the TensorFlow Extended (TFX) Pipeline template with the TFX SDK. The latter currently consists of libraries, components, and some binaries and it is up to the developer to pick the right level of abstraction for the task at hand. Furthermore, TFX SDK includes a library ML Metadata (MLMD) for recording and retrieving metadata associated with the workflows; this library can also run independently. Google recommends using KPF SDK for fully custom pipelines or pipelines that use prebuilt KFP components, and TFX SDK and its templates for E2E ML Pipelines based on TensorFlow. Note that over time, Google stated in the blog post that these two SDK experiences would merge. The SDK, in the end, will compile the pipeline and submit it to the Pipelines REST API; the AI Pipelines REST API server stores and schedules the pipeline for execution. An open-source container-native workflow engine for orchestrating parallel jobs on Kubernetes called Argo runs the pipelines, which includes additional microservices to record metadata, handle components IO, and schedule pipeline runs. The Argo workflow engine executes each pipeline on individual isolated pods in a GKE cluster – allowing each pipeline component to leverage Google Cloud services such as Dataflow, AI Platform Training and Prediction, BigQuery, and others. Furthermore, pipelines can contain steps that perform sizeable GPU and TPU computation in the cluster, directly leveraging features like autoscaling and node auto-provisioning. Source: https://cloud.google.com/blog/products/ai-machine-learning/introducing-cloud-ai-platform-pipelines AI Platform Pipeline runs include automatic metadata tracking using the MLMD - and logs the artifacts used in each pipeline step, pipeline parameters, and the linkage across the input/output artifacts, as well as the pipeline steps that created and consumed them. With Cloud AI Platform Pipelines, according to the blog post customers will get: Push-button installation via the Google Cloud Console Enterprise features for running ML workloads, including pipeline versioning, automatic metadata tracking of artifacts and executions, Cloud Logging, visualization tools, and more Seamless integration with Google Cloud managed services like BigQuery, Dataflow, AI Platform Training and Serving, Cloud Functions, and many others Many prebuilt pipeline components (pipeline steps) for ML workflows, with easy construction of your own custom components The support for Kubeflow will allow a straightforward migration to other cloud platforms, as a respondent on a Hacker News thread on Google AI Cloud Pipeline stated: Cloud AI Platform Pipelines appear to use Kubeflow Pipelines on the backend, which is open-source and runs on Kubernetes. The Kubeflow team has invested a lot of time on making it simple to deploy across a variety of public clouds, such as AWS, and Azure. If Google were to kill it, you could easily run it on any other hosted Kubernetes service. The release of AI Cloud Pipelines shows Google's further expansion of Machine Learning as a Service (MLaaS) portfolio - consisting of several other ML centric services such as Cloud AutoML, Kubeflow and AI Platform Prediction. The expansion is necessary to allow Google to further capitalize on the growing demand for ML-based cloud services in a market which analysts expect to reach USD 8.48 billion by 2025, and to compete with other large public cloud vendors such as Amazon offering similar services like SageMaker and Microsoft with Azure Machine Learning. Currently, Google plans to add more features for AI Cloud Pipelines. These features are: Easy cluster upgrades More templates for authoring ML workflows More straightforward UI-based setup of off-cluster storage of backend data Workload identity, to support transparent access to GCP services, and Multi-user isolation – allowing each person accessing the Pipelines cluster to control who can access their pipelines and other resources. Lastly, more information on Google's Cloud AI Pipeline is available in the getting started documentation.
http://damianfallon.blogspot.com/2020/03/google-announces-cloud-ai-platform.html
1 note
·
View note
Link
0 notes
Text
Comparing RonDB 21.04.0 on AWS, Azure and GCP using Sysbench
Release of RonDB 21.04.0RonDB is based on MySQL NDB Cluster optimised for use in modern cloud settings. Today we launch RonDB 21.04.0. In RonDB 21.04.0 we have integrated benchmark scripts to execute various benchmarks towards RonDB.There are three ways of using RonDB. The first is using the managed version provided by Logical Clocks. This is currently available in AWS and is currently being developed to also support Azure. This is still in limited access mode. To access it contact Logical Clocks at the rondb.com website.The second way is to use a script provided by Logical Clocks that automates the creation of VMs and the installation of the software components required by RonDB. These scripts are available to create RonDB clusters on Azure and GCP (Google Cloud). This script can be downloaded from nexus.hops.works/rondb-cloud-installer.sh.The third manner to use RonDB is to simply download the RonDB binary tarball and install it on any computers of your own liking.All these methods start by visiting http://rondb.com. From here you will find the download scripts, the tarball to download and to send an email request access to the managed version of RonDB.RonDB 21.04.0 can be used in any of the above settings, but we focus our development, testing and optimisations towards executing RonDB in an efficient manner in AWS, Azure and GCP. We will likely add Oracle Cloud eventually to the mix as well.Benchmark SetupWhat we have discovered in our benchmarking is that even with very similar HW there are some differences in how RonDB performs on the different clouds. So this report presents the results using very similar setups in AWS, Azure and GCP.Above we have the benchmark setup used in all the experiments. There are always 2 RonDB data nodes and they are replicas of each other. Thus all write operations are written on both data nodes to ensure that we are always available even in the presence of node failures.The MySQL Servers are pure clients since data is located on the RonDB data nodes. Thus we can easily scale the benchmark using any number of MySQL Servers. The benchmark application runs on a single VM that sends SQL queries to the MySQL Servers and receives results using a MySQL client written in C. It is sufficient to have a single Sysbench server for these experiments.In this experiment we will scale RonDB data nodes by using different VM types. It is also possible to scale RonDB by adding more RonDB data nodes. Both of these changes can be performed without any downtime.It is possible to execute the Sysbench server local to the MySQL Server and let multiple Sysbench servers execute in parallel. This would however be a 2-tiered cluster and we wanted to test a 3-tiered cluster setup since we think this is the most common setup used. Obviously a 2-tiered cluster setup will have lower latency, but it will also be more complex to maintain.There is also a RonDB management server in the setup, however this is not involved in the benchmark execution and is either located in the Sysbench server or a separate dual CPU VM. Availability ZonesAWS, Azure and GCP all use a concept called Availability Zones. These are located in the same city, but can be distant from each other. The latency between Availability Zones can be more than 1 millisecond in latency for each jump. RonDB contains options to optimise for such a setup, but in this test we wanted to test a setup that is within an Availability Zone.Thus all setups we ensured that all VMs participating in cluster setup were in the same zone. Even within a zone the variance on the latency can be substantial. We see this in that the benchmark numbers can vary even within the same cloud and the same availability zone on different runs. From other reports it is reported that network latency is around 40-60 microseconds between VMs in the same availability zone. Our experience is that it is normal that this latency varies at least 10-20 microseconds up or down. In Azure it is even possible that the variance is higher since they can implement some availability zones in multiple buildings. In this case Azure provides a concept called Proximity Placement Groups that can be used to ensure that VMs are located in the same building and not spread between buildings in the same availability zone.RonDB VM TypesAll cloud vendors have VMs that come from different generations of SW and HW. For a latency sensitive application like RonDB this had serious implications. All the VMs we tested used very similar Intel x86 CPUs. There is some difference in performance between older Intel x86 and newer CPUs. However this difference is usually on the order of 30-40%, so not so drastic.However an area where innovation has happened at a much higher pace is networking. Cloud vendors have drastically improved the networking latency, bandwidth and efficiency from generation to generation.What we found is that it is essential to use the latest VM generation for MySQL Servers and RonDB data nodes. The difference between the latest generation and the previous generation was up to 3x in latency and performance. We found that the latest generation of VMs from all cloud vendors have similar performance, but using older versions had a high impact on the benchmark results. All the benchmarking results in this report uses the latest generation of VMs from all vendors.For AWS this means using their 5th generation VMs. AWS has three main categories of VMs, these c5, m5 and r5. c5 VMs are focused on lots of CPU and modest amounts of memory. m5 VMs twice as much memory with the same amount of CPU and r5 have 4x more memory than the c5 and the same amount of CPU. For RonDB this works perfectly fine. The RonDB data nodes store all the data and thus require as much memory as possible. Thus we use the r5 category here. MySQL Servers only act as clients in RonDB setup, thus require only a modest amount of memory, thus we use the c5 category here.The latest generation in Azure is the v4 generation. Azure VMs have two categories, the D and E VMs. The E category has twice as much memory as the D category. The E category is similar to AWS r5 and the D category is similar to the AWS m5 category.The latest generation in GCP is the n2 generation. They have n2-highcpu that matches AWS c5, n2-standard that matches AWS m5 and n2-highmem that matches AWS r5. GCP also has the ability to extend memory beyond 8 GB per CPU which is obviously interesting for RonDB.Benchmark Notes on Cloud VendorsSince we developed the RonDB managed version on AWS we have a bit more experience from benchmarking here. We quickly discovered that the standard Sysbench OLTP RW benchmark actually is not only a CPU benchmark. It is very much a networking benchmark as well. In some benchmarks using 32 VCPUs on the data nodes, we had to send around 20 Gb/sec from the data node VMs. Not all VM types could handle this. In AWS this meant that we had to use a category called r5n. This category uses servers that have 100G Ethernet instead of 25G Ethernet and thus a 32 VCPU VM was provided with bandwidth up to 25G. We didn’t investigate this thoroughly on Azure and GCP.Some quirks we noted was that the supply of Azure v4 VM instances was somewhat limited. In some regions it was difficult to succeed in allocating a set of large v4 VM instances. In GCP we had issues with our quotas and got a denial to increase the quota size for n2 VMs, which was a bit surprising. This meant that we executed not as many configurations on Azure and GCP. Thus some comparisons are between Azure and AWS only.Using the latest VM generation AWS, Azure and GCP all had reasonable performance. There were differences of course, but between 10-30% except in one benchmark. Our conclusion is that AWS, Azure and GCP have used different strategies in how to handle networking interrupts. AWS reports the lowest latency on networking in our tests and this is also seen in other benchmark reports. However GCP shows both in our benchmarks and other similar reports to have higher throughput but worse latency. Azure falls in between those.Our conclusion is that it is likely caused by how network interrupts are handled. If the network interrupts are acted upon immediately one gets the best possible latency. But at high loads the performance goes down since interrupt handling costs lots of CPU. If network interrupts are instead handled using polling the latency is worse, but at high loads the cost of interrupts stays low even at extreme loads.Thus best latency is achieved through handling interrupts directly and using polling one gets better performance the longer the delay in the network interrupt. Obviously the true answer is a lot more complex than this, but suffice it to say that the cloud vendors have selected different optimisation strategies that work well in different situations.Benchmark Notes on RonDBOne more thing that affects latency of RonDB to a great extent is the wakeup latency of threads. Based on benchmarks I did while at Oracle I concluded that wakeup latency is about 2x higher on VMs compared to on bare metal. On VMs it can be as high as 25 microseconds, but is likely nowadays to be more like on the order of 10-15 microseconds.RonDB implements adaptive CPU spinning. This ensures that latency is decreasing when the load increases. This means that we get a latency curve that starts a bit higher, then goes down until the queueing for CPU resources starts to impact latency and after that it follows a normal latency where latency increases as load increases.Latency variations are very small up to about 50% of the maximum load on RonDB.In our benchmarks we have measured the latency that 95% of the transactions were below. Thus we didn’t focus so much on single outliers. RonDB is implementing soft real-time, thus it isn’t intended for hard real-time applications where life depends on individual transactions completing in time.The benchmarks do however report a maximum latency. Most of the time these maximum latencies were as expected. But one outlier we saw, this was on GCP where we saw transaction latency at a bit above 200 ms when executing benchmarks with up to 8 threads. These outliers disappeared when going towards higher thread counts. Thus it seems that GCP VMs have some sort of deep sleep that keeps them down for 200 ms. This latency was always in the range 200-210 milliseconds. Thus it seemed that there was a sleep of 200ms somewhere in the VM. In some experiments on Azure we saw even higher maximum latency with similar behaviour as on GCP. So it is likely that most cloud vendors (probably all) can go into deep sleeps that highly affect latency when operations start up again.Benchmark ConfigurationOk, now on to numbers. We will show results from 4 different setups. All setups use 2 data nodes. The first setup uses 2 MySQL Servers and both RonDB data nodes and MySQL Servers use VMs with 16 VCPUs. This setup mainly tests latency and performance of MySQL Servers in an environment where data nodes are not overloaded. This test compares AWS, Azure and GCP.The second setup increases the number of MySQL Servers to 4 in the same setup. This makes the data node the bottleneck in the benchmark. This benchmark also compares AWS, Azure and GCP.The third setup uses 16 VPUs on data nodes and 2 MySQL Servers using 32 VCPUs. This test shows performance in a balanced setup where both data nodes and MySQL Servers are close to their limit. This test compares AWS and Azure.The final setup compares a setup with 32 VCPUs on data nodes and 3 MySQL Servers using 32 VCPUs. This setup mainly focuses on behaviour latency and throughput of MySQL Servers in an environment where the data nodes are not the bottleneck. The test compares AWS with Azure.We used 3 different benchmarks. Standard Sysbench OLTP RW, this benchmark is both a test of CPU performance as well as networking performance. Next benchmark is the same as OLTP RW using a filter where the scans only return 1 of the 100 scanned rows instead of all of them. This makes the benchmark more CPU focused.The final benchmark is a key lookup benchmark that only sends SQL queries using IN statements. This means that each SQL query performs 100 key lookups. This benchmark shows the performance of simple key lookups using RonDB through SQL queries.ConclusionsThe results show clearly that AWS has the best latency numbers at low to modest loads. At high loads GCP gives the best results. Azure has similar latency to GCP, but doesn’t provide the same benefits at higher loads. These results are in line with similar benchmark reports comparing AWS, Azure and GCP.The variations from one benchmark run to another run can be significant when it comes to latency. This is natural since there is a random latency added dependent on how far apart the VMs are within the availability zone. However throughput is usually not affected in the same manner.In some regions Azure uses several buildings to implement one availability zone, this will affect latency and throughput negatively. In those regions it is important to use Proximity Placement Groups in Azure to ensure that all VMs are located in the same building. The effect of this is seen in the last benchmark results in this report.The limitations on VM networking are a bit different. This played out as a major factor in the key lookup benchmark where one could see that AWS performance was limited due to network bandwidth limitation. Azure VMs had access to a higher networking bandwidth for similar VM types.AWS provided the r5n VM types, this provided 4x more networking bandwidth with the same CPU and memory setup. This provided very useful for benchmarking using RonDB data nodes with 32 VCPUs.Benchmark Results2 Data Nodes@16 VCPUs, 2 MySQL Server@16 VCPUsStandard OLTP RWIn this benchmark we see clearly the distinguishing features of AWS vs GCP. AWShas better latency at low load. 6,5 milliseconds compared to 9,66 milliseconds.However GCP reaches higher performance. At 128 threads it reaches 7% higherperformance at 7% lower latency. So GCP focuses on the performance at high loadwhereas AWS focuses more on performance at lower loads. Both approaches haveobvious benefits, which is best is obviously subjective and depends on the application.This benchmark is mainly testing the throughput of MySQL Servers. The RonDBdata nodes are only loaded to about 60-70% of their potential throughput with2 MySQL Servers.Moving to latency numbers one can see the same story, but even clearer. AWS hasa better latency up to 48 threads where the latency of GCP becomes better. In GCPwe see that the latency at 1 thread is higher than the latency at 12 threads and onlyat 24 threads the latency starts to increase beyond the latency at 1 thread. Thus inGCP the latency is very stable over different loads until the load goes beyond 50%of the possible throughput. We see the same behaviour on Azure whereas AWSlatency slowly starts to increase at lower thread counts.Standard OLTP RW using filterThe OLTP RW using a filter is more focused on CPU performance. The major differenceis seen at higher loads. The latency at low loads is very similar, but at higher loads weget higher throughput at lower latency. Thus standard OLTP RW has a steeper marchfrom acceptable latency to high latency. The difference in throughput is very smallbetween cloud vendors, it is within 10%.The comparison between AWS and GCP is similar though. The GCP benefit at higherload is slightly higher and similar to the latency. The AWS advantage at lower loads isslightly lower. Thus GCP has a slight advantage compared to standard OLTP RW,but it is a very small difference.Key LookupsIn the graph below we see the number of key lookups that 2 MySQL Servers can drive.The numbers are very equal for the different cloud vendors. AWS as usual has anadvantage at lower thread counts and GCP gains the higher numbers at higherthread counts and Azure is usually in the middle.The latency numbers are shown below. These numbers more clearly show theadvantage of AWS at lower thread counts. At higher thread counts the latencyis mostly the same for all cloud vendors. This benchmark is extremely regularin its use case and thus it is mostly the CPU performance that matters in thisbenchmark. Since this is more or the less same on all cloud vendors we seeno major difference.2 Data Nodes@16 VCPUs, 4 MySQL Server@16 VCPUsIn this benchmark the bottleneck moves to the RonDB data nodes. We now havesufficient amounts of MySQL Servers to make the RonDB data nodes a bottleneck.This means a bottleneck that can be both a CPU bottleneck as well as a networkingbottleneck.Standard OLTP RWThe latency is very stable until we reach 64 threads where we have around 15k TPS at20 milliseconds latency. At higher thread counts the data nodes becomes the bottleneckand in this case the latency has a much higher variation. We can even see that latencyat 128 threads in Azure goes down and throughput up. We expect that this is due tointerrupt handling being executed on the same CPUs as database processing happens.This is something that we will look more into.OLTP RW using filterThe throughput of OLTP with a filter means that the focus is more on CPU performance.This makes it clear that the high variation on throughput and latency in standard OLTP RWcomes from handling the gigabytes per second of data to send to the MySQL Servers.In this benchmark the throughput increases in a stable manner and similarly the latencygoes up in an expected manner.All cloud vendors are very close to each other except at low thread counts whereAWS have an advantage.Key LookupsThe key lookups with 4 MySQL Server and 2 data nodes and all nodes using16 VCPUs per node moves the bottleneck to the data node. As usual AWSwins out on the latency at lower thread counts. But at higher thread countsAWS hits a firm wall. Most likely it hits a firm bandwidth limitation on the VMs.This limitation is higher on Azure, thus these VM can go an extra mile and serve1 million more key lookups per second.2 Data Nodes@16 VCPUs, 2 MySQL Server@32 VCPUsThis benchmark uses the same amount of CPUs on the MySQL Server side,but instead of divided on 4 MySQL Servers, it is using 2 MySQL Servers.We didn’t test GCP in this configuration. We expect no surprises in throughputand latency if we do.Standard OLTP RWIn the Standard OLTP RW we see that the throughput is the same as with4 MySQL Servers. However the throughput increases in a more regular manner.What we mainly see is that we can achieve a higher throughput using a smalleramount of threads in total. This makes the throughput more stable. Thus weconclude that at least up to 32 VCPUs it pays off to use larger MySQL Serversif required.2 Data Nodes@32 VCPUs, 3 MySQL Server@32 VCPUsIn this benchmark we increased the number of CPUs on the RonDB datanodes to 32 VCPUs. Most of the testing in this setup has been performedon AWS. The main reason for including the Azure numbers is becausethese numbers show the impact of not using Proximity Placement Groupsin Azure on large regions. We saw clearly in these benchmarks that thelatency in the Azure setup was much higher than in previous benchmarksthat were using a smaller region.However in the smaller region it was difficult to allocate these larger VMsin any larger number. We constantly got failures due to lacking resourcesto fulfil our requests.Standard OLTP RWIn AWS we discovered that the network was a bottleneck when executingthis benchmark. Thus we used r5n.8xlarge instead of r5.8xlarge VMs inthis benchmark. These VMs reside in machines with 100G Ethernetconnections and each 32 VCPU VM have access to at least 25 Gb/secnetworking. The setup tested here with 3 MySQL Servers doesn’t load theRonDB data node fully. In other benchmarks we were able to increasethroughput to around 35k TPS. However these benchmarks used a differentsetup, so these numbers are not relevant for a comparison. What we see isthat the throughput in this case is roughly twice the throughput when using16 VCPUs in the data nodes.Latency numbers look very good and it is clear that we haven't reallyreached the bottleneck really in neither the MySQL Servers nor theRonDB data nodes.OLTP RW using filterSimilarly in this experiment we haven’t really reached the bottleneck on neither theRonDB data nodes nor the MySQL Servers. So no real news from this benchmark. http://mikaelronstrom.blogspot.com/2021/04/comparing-rondb-21040-on-aws-azure-and.html
0 notes
Text
Managing OpenShift Clusters: Best Practices and Tools
Introduction
Brief overview of OpenShift and its significance in the Kubernetes ecosystem.
Importance of effective cluster management for stability, performance, and security.
1. Setting Up Your OpenShift Cluster
Cluster Provisioning
Steps for setting up an OpenShift cluster on different platforms (bare metal, cloud providers like AWS, Azure, GCP).
Using OpenShift Installer for automated setups.
Configuration Management
Initial configuration settings.
Best practices for cluster configuration.
2. Monitoring and Logging
Monitoring Tools
Using Prometheus and Grafana for monitoring cluster health and performance.
Overview of OpenShift Monitoring Stack.
Logging Solutions
Setting up EFK (Elasticsearch, Fluentd, Kibana) stack.
Best practices for log management and analysis.
3. Scaling and Performance Optimization
Auto-scaling
Horizontal Pod Autoscaler (HPA).
Cluster Autoscaler.
Resource Management
Managing resource quotas and limits.
Best practices for resource allocation and utilization.
Performance Tuning
Tips for optimizing cluster and application performance.
Common performance issues and how to address them.
4. Security Management
Implementing Security Policies
Role-Based Access Control (RBAC).
Network policies for isolating workloads.
Managing Secrets and Configurations
Securely managing sensitive information using OpenShift secrets.
Best practices for configuration management.
Compliance and Auditing
Tools for compliance monitoring.
Setting up audit logs.
5. Backup and Disaster Recovery
Backup Strategies
Tools for backing up OpenShift clusters (e.g., Velero).
Scheduling regular backups and verifying backup integrity.
Disaster Recovery Plans
Creating a disaster recovery plan.
Testing and validating recovery procedures.
6. Day-to-Day Cluster Operations
Routine Maintenance Tasks
Regular updates and patch management.
Node management and health checks.
Troubleshooting Common Issues
Identifying and resolving common cluster issues.
Using OpenShift diagnostics tools.
7. Advanced Management Techniques
Custom Resource Definitions (CRDs)
Creating and managing CRDs for extending cluster functionality.
Operator Framework
Using Kubernetes Operators to automate complex application deployment and management.
Cluster Federation
Managing multiple OpenShift clusters using Red Hat Advanced Cluster Management (ACM).
Conclusion
Recap of key points.
Encouragement to follow best practices and continuously update skills.
Additional resources for further learning (official documentation, community forums, training programs).
By covering these aspects in your blog post, you'll provide a comprehensive guide to managing OpenShift clusters, helping your readers ensure their clusters are efficient, secure, and reliable.
For more details click www.qcsdclabs.com
#redhatcourses#information technology#containerorchestration#kubernetes#container#docker#containersecurity#linux#dockerswarm#aws
0 notes
Photo

[FREE] Setup Single Node Cloudera Cluster on Google Cloud What you Will learn ? Set up One Machine Cloudera Data Platform (CDP) Cluster on Google Cloud (GCP)
0 notes