#Automating Tableau Reports Validation
Explore tagged Tumblr posts
Visit Tumblr Blog
Explore Tumblr blogs with no restrictions, modern design and the best experience.
Last Seen Tumblr Blogs


Fun Fact
Tumblr has been providing a Korean-language service since 2013.
Text
#Tableau#Tableau Reporting#Data Validation#DataOps Suite#Datagaps#Automating Tableau Reports Validation
0 notes
Text
How-To IT
Topic: Core areas of IT
1. Hardware
• Computers (Desktops, Laptops, Workstations)
• Servers and Data Centers
• Networking Devices (Routers, Switches, Modems)
• Storage Devices (HDDs, SSDs, NAS)
• Peripheral Devices (Printers, Scanners, Monitors)
2. Software
• Operating Systems (Windows, Linux, macOS)
• Application Software (Office Suites, ERP, CRM)
• Development Software (IDEs, Code Libraries, APIs)
• Middleware (Integration Tools)
• Security Software (Antivirus, Firewalls, SIEM)
3. Networking and Telecommunications
• LAN/WAN Infrastructure
• Wireless Networking (Wi-Fi, 5G)
• VPNs (Virtual Private Networks)
• Communication Systems (VoIP, Email Servers)
• Internet Services
4. Data Management
• Databases (SQL, NoSQL)
• Data Warehousing
• Big Data Technologies (Hadoop, Spark)
• Backup and Recovery Systems
• Data Integration Tools
5. Cybersecurity
• Network Security
• Endpoint Protection
• Identity and Access Management (IAM)
• Threat Detection and Incident Response
• Encryption and Data Privacy
6. Software Development
• Front-End Development (UI/UX Design)
• Back-End Development
• DevOps and CI/CD Pipelines
• Mobile App Development
• Cloud-Native Development
7. Cloud Computing
• Infrastructure as a Service (IaaS)
• Platform as a Service (PaaS)
• Software as a Service (SaaS)
• Serverless Computing
• Cloud Storage and Management
8. IT Support and Services
• Help Desk Support
• IT Service Management (ITSM)
• System Administration
• Hardware and Software Troubleshooting
• End-User Training
9. Artificial Intelligence and Machine Learning
• AI Algorithms and Frameworks
• Natural Language Processing (NLP)
• Computer Vision
• Robotics
• Predictive Analytics
10. Business Intelligence and Analytics
• Reporting Tools (Tableau, Power BI)
• Data Visualization
• Business Analytics Platforms
• Predictive Modeling
11. Internet of Things (IoT)
• IoT Devices and Sensors
• IoT Platforms
• Edge Computing
• Smart Systems (Homes, Cities, Vehicles)
12. Enterprise Systems
• Enterprise Resource Planning (ERP)
• Customer Relationship Management (CRM)
• Human Resource Management Systems (HRMS)
• Supply Chain Management Systems
13. IT Governance and Compliance
• ITIL (Information Technology Infrastructure Library)
• COBIT (Control Objectives for Information Technologies)
• ISO/IEC Standards
• Regulatory Compliance (GDPR, HIPAA, SOX)
14. Emerging Technologies
• Blockchain
• Quantum Computing
• Augmented Reality (AR) and Virtual Reality (VR)
• 3D Printing
• Digital Twins
15. IT Project Management
• Agile, Scrum, and Kanban
• Waterfall Methodology
• Resource Allocation
• Risk Management
16. IT Infrastructure
• Data Centers
• Virtualization (VMware, Hyper-V)
• Disaster Recovery Planning
• Load Balancing
17. IT Education and Certifications
• Vendor Certifications (Microsoft, Cisco, AWS)
• Training and Development Programs
• Online Learning Platforms
18. IT Operations and Monitoring
• Performance Monitoring (APM, Network Monitoring)
• IT Asset Management
• Event and Incident Management
19. Software Testing
• Manual Testing: Human testers evaluate software by executing test cases without using automation tools.
• Automated Testing: Use of testing tools (e.g., Selenium, JUnit) to run automated scripts and check software behavior.
• Functional Testing: Validating that the software performs its intended functions.
• Non-Functional Testing: Assessing non-functional aspects such as performance, usability, and security.
• Unit Testing: Testing individual components or units of code for correctness.
• Integration Testing: Ensuring that different modules or systems work together as expected.
• System Testing: Verifying the complete software system’s behavior against requirements.
• Acceptance Testing: Conducting tests to confirm that the software meets business requirements (including UAT - User Acceptance Testing).
• Regression Testing: Ensuring that new changes or features do not negatively affect existing functionalities.
• Performance Testing: Testing software performance under various conditions (load, stress, scalability).
• Security Testing: Identifying vulnerabilities and assessing the software’s ability to protect data.
• Compatibility Testing: Ensuring the software works on different operating systems, browsers, or devices.
• Continuous Testing: Integrating testing into the development lifecycle to provide quick feedback and minimize bugs.
• Test Automation Frameworks: Tools and structures used to automate testing processes (e.g., TestNG, Appium).
19. VoIP (Voice over IP)
VoIP Protocols & Standards
• SIP (Session Initiation Protocol)
• H.323
• RTP (Real-Time Transport Protocol)
• MGCP (Media Gateway Control Protocol)
VoIP Hardware
• IP Phones (Desk Phones, Mobile Clients)
• VoIP Gateways
• Analog Telephone Adapters (ATAs)
• VoIP Servers
• Network Switches/ Routers for VoIP
VoIP Software
• Softphones (e.g., Zoiper, X-Lite)
• PBX (Private Branch Exchange) Systems
• VoIP Management Software
• Call Center Solutions (e.g., Asterisk, 3CX)
VoIP Network Infrastructure
• Quality of Service (QoS) Configuration
• VPNs (Virtual Private Networks) for VoIP
• VoIP Traffic Shaping & Bandwidth Management
• Firewall and Security Configurations for VoIP
• Network Monitoring & Optimization Tools
VoIP Security
• Encryption (SRTP, TLS)
• Authentication and Authorization
• Firewall & Intrusion Detection Systems
• VoIP Fraud DetectionVoIP Providers
• Hosted VoIP Services (e.g., RingCentral, Vonage)
• SIP Trunking Providers
• PBX Hosting & Managed Services
VoIP Quality and Testing
• Call Quality Monitoring
• Latency, Jitter, and Packet Loss Testing
• VoIP Performance Metrics and Reporting Tools
• User Acceptance Testing (UAT) for VoIP Systems
Integration with Other Systems
• CRM Integration (e.g., Salesforce with VoIP)
• Unified Communications (UC) Solutions
• Contact Center Integration
• Email, Chat, and Video Communication Integration
2 notes
·
View notes
Text
Data Analyst Certifications in 2025: Which Ones Matter & How to Get Them, 100% Placement in MNC, Data Analyst Course in Delhi, 110082 - " Free Data Science Course" by SLA Consultants India,
In 2025, as the data-driven economy reaches new heights, companies are looking beyond traditional degrees to validate skills. Certifications have become the new benchmark for employability in data analytics, offering proof of both technical knowledge and real-world application. With analytics roles evolving rapidly due to advancements in AI and automation, professionals need certifications that reflect up-to-date skills. Among the most impactful options in India is the Data Analyst Course offered by SLA Consultants India, located in Delhi (Pin Code 110082), which also includes 100% placement in MNCs and a Free Data Science Course to future-proof your profile.
Data Analyst Course in Delhi
The certifications that matter in 2025 are those that equip learners with in-demand tools and technologies. Core competencies like Excel, SQL, Python, Power BI, and Tableau remain critical, and employers are particularly focused on candidates who can work with real datasets and communicate insights effectively. SLA Consultants India provides hands-on training in all these areas through a structured, job-oriented program. Their course goes beyond theory, offering live projects, assignments, and interview preparation—all of which are crucial in landing a high-paying job in top-tier companies.
Data Analyst Training Course in Delhi
What makes SLA Consultants India's certification even more valuable is the complementary Data Science course included with enrollment. This course introduces learners to automation, machine learning, and AI fundamentals, helping them stand out in an increasingly automated job market. Employers in 2025 are seeking hybrid professionals—those who can combine technical analytics skills with knowledge of modern AI tools. This dual-skill advantage is exactly what the SLA program delivers, enhancing your ability to adapt and grow in a rapidly changing industry.
Data Analyst Training Course Modules Module 1 - Basic and Advanced Excel With Dashboard and Excel Analytics Module 2 - VBA / Macros - Automation Reporting, User Form and Dashboard Module 3 - SQL and MS Access - Data Manipulation, Queries, Scripts and Server Connection - MIS and Data Analytics Module 4 - MS Power BI | Tableau Both BI & Data Visualization Module 5 - Free Python Data Science | Alteryx/ R Programing Module 6 - Python Data Science and Machine Learning - 100% Free in Offer - by IIT/NIT Alumni Trainer
Obtaining the right certification also comes down to placement support and industry recognition. SLA Consultants India offers 100% placement assistance, with tie-ups across multiple MNCs and corporate recruiters. Their certification is widely accepted in the job market, thanks to their reputation for producing skilled, job-ready professionals. Whether you're a fresher stepping into analytics or a working professional aiming for a career switch, enrolling in their Data Analyst Certification Course in Delhi is a strategic step toward a secure and high-growth career. With their comprehensive training, expert mentors, and placement backing, you gain more than a certificate—you gain a future.
In conclusion, certifications are not just helpful—they are essential in 2025’s competitive data analytics landscape. But not all certifications carry the same weight. To truly boost your employability and skill set, you need a program that’s practical, industry-aligned, and placement-focused. SLA Consultants India delivers exactly that, with a powerful blend of analytics and data science training, backed by 100% MNC placement support. If you’re serious about building a rewarding career in data, this certification is your launchpad to success. To get more details Call: +91-8700575874 or Email: [email protected]
0 notes
Text
How to Automate Tableau to Power BI Migration for Faster Results
As businesses continue to evolve, so do their analytics needs. Many organizations are moving from Tableau to Power BI to leverage Microsoft’s broader ecosystem, tighter integration with Office 365, and cost efficiency. But migrating from one powerful BI platform to another isn’t a plug-and-play operation—it requires strategy, tools, and automation to ensure speed and accuracy.
At OfficeSolution, we specialize in streamlining your analytics journey. Here’s how you can automate your Tableau to Power BI migration and accelerate results without losing data integrity or performance.
Why Consider Migration to Power BI?
While Tableau offers rich data visualization capabilities, Power BI brings a robust suite of benefits, especially for organizations already embedded in Microsoft’s ecosystem. These include:
Seamless integration with Azure, Excel, and SharePoint
Scalable data models using DAX
Lower licensing costs
Embedded AI and natural language querying
Migrating doesn’t mean starting from scratch. With the right automation approach, your dashboards, data models, and business logic can be transitioned efficiently.
Step 1: Inventory and Assessment
Before automating anything, conduct a full inventory of your Tableau assets:
Dashboards and worksheets
Data sources and connectors
Calculated fields and filters
User roles and access permissions
This phase helps prioritize which dashboards to migrate first and which ones need redesigning due to functional differences between Tableau and Power BI.
Step 2: Use Automation Tools for Conversion
There are now tools and scripts that can partially automate the migration process. While full one-to-one conversion isn’t always possible due to the structural differences, automation can significantly cut manual effort:
Tableau to Power BI Converter Tools: Emerging tools can read Tableau workbook (TWB/TWBX) files and extract metadata, data sources, and layout designs.
Custom Python Scripts: Developers can use Tableau’s REST API and Power BI’s PowerShell modules or REST API to programmatically extract data and push it into Power BI.
ETL Automation Platforms: If your Tableau dashboards use SQL-based data sources, tools like Azure Data Factory or Talend can automate data migration and transformation to match Power BI requirements.
At OfficeSolution, we’ve developed proprietary scripts that map Tableau calculations to DAX and automate the bulk of the report structure transformation.
Step 3: Validate and Optimize
After automation, a manual review is crucial. Even the best tools require human oversight to:
Rebuild advanced visualizations
Validate data integrity and filters
Optimize performance using Power BI best practices
Align with governance and compliance standards
Our team uses a rigorous QA checklist to ensure everything in Power BI mirrors the original Tableau experience—or improves upon it.
Step 4: Train and Transition Users
The success of any migration depends on end-user adoption. Power BI offers a different interface and experience. Conduct hands-on training sessions, create Power BI templates for common use cases, and provide support as users transition.
Conclusion
Automating Tableau to Power BI migration isn’t just about saving time—it’s about ensuring accuracy, scalability, and business continuity. With the right combination of tools, scripting, and expertise, you can accelerate your analytics modernization with confidence.
At OfficeSolution, we help enterprises unlock the full value of Power BI through intelligent migration and ongoing support. Ready to upgrade your analytics stack? Let’s talk.
0 notes
Text
How to Start a Data Analytics Career Without Coding
In a world increasingly driven by data, breaking into data analytics has never been more accessible—even for those without a coding or technical background. Whether you're a business graduate, marketing professional, or someone pivoting mid-career, you can build a strong career in data analytics using tools, mindset, and strategic planning.

In this blog, we’ll walk you through a practical, step-by-step guide tailored for non-tech professionals and explore how you can get started in India’s booming analytics industry.
Why Data Analytics Is a Smart Career Move (Even Without Coding)
Data analytics is about making sense of numbers, spotting trends, and helping businesses make better decisions. While coding skills can be helpful, they are not mandatory for entry-level analyst roles. What truly matters is your ability to interpret data, visualize insights, and communicate findings.
India’s digital transformation across industries has created a massive demand for data talent. This has opened opportunities in big data companies, IT firms, startups, consulting agencies, and more.
Step 1: Understand What Data Analytics Really Involves
Before diving into the tools, it's important to understand the role:
Data Analysts gather, clean, and interpret datasets.
They create dashboards and reports to identify patterns and insights.
Their work informs strategic business decisions across marketing, finance, operations, and beyond.
And here’s the good news: You don’t need to write complex code to do this.
Step 2: Build Your Skillset with the Right Tools
Start by focusing on tools and concepts that don’t require a programming background:
Microsoft Excel – Master formulas, pivot tables, and data cleaning.
Power BI / Tableau – Learn to create powerful data visualizations.
SQL (Basics) – Optional, but valuable for querying structured data.
Statistics & Business Math – Understand mean, median, variance, correlation, etc.
Free courses from platforms like Coursera, Google, and YouTube can get you started at zero cost.
Step 3: Work on Real-Life Projects
Nothing beats hands-on experience. Begin by analyzing publicly available datasets from:
Kaggle
data.gov.in
Google Dataset Search
Build small projects around business problems like customer churn, sales forecasting, or campaign performance. Showcase your work on GitHub or create a portfolio website.
Step 4: Get Certified
Certifications validate your skills and boost your resume. Some beginner-friendly ones include:
Google Data Analytics Certificate
Microsoft Certified: Data Analyst Associate
Tableau Desktop Specialist
These courses often combine tool training with case studies, giving you a well-rounded introduction.
Step 5: Learn How to Tell a Data Story
This is where many technical professionals fall short, but you’ll shine.
Learn how to present insights to stakeholders.
Focus on data storytelling—what happened, why, and what action to take.
Keep it visual. Charts and graphs often communicate better than tables and text.
Step 6: Explore Opportunities in India’s Booming Analytics Industry
India is a global hub for data and analytics services. Here are some top data analytics companies in India that are always on the lookout for data analysts all over India:
1. TCS (Tata Consultancy Services)
Offers data-driven solutions across industries including banking, healthcare, and retail.
2. Infosys
Combines analytics with AI and automation to solve business problems.
3. Wipro
A leader in integrating data analytics with cloud and IoT services.
4. Mu Sigma
Known for analytics consulting for Fortune 500 clients.
5. Fractal Analytics
Uses AI and analytics for industries like insurance, retail, and healthcare.
6. LatentView Analytics
One of the fastest-growing data companies in India focusing on digital transformation.
These firms are looking for candidates with strong business understanding and an ability to interpret data—skills you can absolutely build without coding.
Step 7: Network and Apply Smartly
Join LinkedIn groups related to data analytics in India.
Attend webinars, meetups, or online events.
Reach out to professionals in your target companies for informational interviews.
Customize your resume to highlight your projects, certifications, and soft skills like communication and problem-solving.
Final Thoughts
You don’t need to be a programmer to thrive in data analytics. With curiosity, commitment, and the right tools, you can launch a successful career—even if you're starting from scratch. India’s thriving ecosystem of big data companies and analytics firms is actively looking for diverse talent. Why not you?
Start today—your future in data analytics is just a few clicks away.
1 note
·
View note
Text
Top Skills You Need to Land an Entry-Level Data Analyst Job in India
With businesses increasingly relying on data to drive decision-making, the role of a data analyst has become crucial in various industries. From finance and healthcare to e-commerce and IT, companies are actively hiring data analysts to interpret complex datasets and provide actionable insights. However, breaking into this field requires a strong skill set that aligns with industry expectations. Whether you are a recent graduate or transitioning from another field, mastering the right skills will significantly enhance your employability. This blog explores the essential skills you need to secure an entry-level data analyst job in India from the best Data Analytics Online Training.
1. Proficiency in Microsoft Excel
Excel remains one of the most widely used tools in data analytics. Employers expect candidates to be proficient in using Excel functions such as VLOOKUP, INDEX-MATCH, PivotTables, and conditional formatting. Understanding data cleaning, filtering, and basic statistical analysis in Excel is essential for handling structured data. Advanced Excel skills, including macros and VBA, can further improve your efficiency as an analyst.
2. SQL for Data Manipulation
SQL (Structured Query Language) is a fundamental skill for data analysts, as most companies store data in relational databases. Proficiency in writing SQL queries to retrieve, filter, and manipulate data is essential. You should be comfortable using commands like SELECT, JOIN, GROUP BY, and WHERE to extract meaningful insights from datasets. Additionally, knowledge of database management systems such as MySQL, PostgreSQL, or Microsoft SQL Server is valuable. If you want to learn more about Data Analytics, consider enrolling in an Best Online Training & Placement programs . They often offer certifications, mentorship, and job placement opportunities to support your learning journey.
3. Python or R for Data Analysis
While Excel and SQL are important, programming languages like Python and R add significant value to your skill set. Python, with libraries such as Pandas, NumPy, and Matplotlib, is widely used for data analysis, automation, and visualization. R is also preferred in statistical analysis and research-oriented industries. Learning how to clean, manipulate, and visualize data using these languages will help you work with large datasets efficiently.
4. Data Visualization with Tableau and Power BI
Data analysts must present insights in an easy-to-understand manner. Visualization tools like Tableau and Power BI allow you to create interactive dashboards and reports. Employers expect analysts to be proficient in using charts, graphs, and dashboards to communicate trends and business insights effectively. Knowing when to use different visualization techniques enhances decision-making for stakeholders.
5. Understanding of Statistics and Data Interpretation
A solid understanding of statistics is crucial for drawing meaningful conclusions from data. Key statistical concepts such as probability, regression analysis, hypothesis testing, and correlation are frequently applied in data analysis. These concepts help analysts interpret trends, make predictions, and validate business hypotheses.
6. Business Acumen and Problem-Solving Skills
A successful data analyst goes beyond numbers and understands the business context. Business acumen helps you identify key performance indicators (KPIs) relevant to your industry and interpret data to drive business decisions. Employers seek candidates who can analyze data from a strategic perspective and provide actionable insights to improve efficiency and revenue.
7. Communication and Storytelling with Data
Interpreting data is one thing, but effectively communicating insights is equally important. Data analysts must present findings in a way that non-technical stakeholders can understand. Strong storytelling skills, combined with visualization techniques, help convey complex data in a simple and compelling manner.
8. Knowledge of ETL and Data Cleaning
Most raw data is messy and requires cleaning before analysis. Understanding Extract, Transform, Load (ETL) processes and data wrangling techniques is essential. Experience with tools like Alteryx, Talend, or Python libraries like Pandas can help automate data cleaning tasks, making data more structured and reliable for analysis.
Conclusion
Securing an entry-level data analyst job in India requires a well-rounded skill set that includes technical expertise, business acumen, and strong communication abilities. Mastering Excel, SQL, Python, and data visualization tools, along with a solid understanding of statistics and problem-solving, will position you as a strong candidate in the job market. Continuous learning and hands-on practice with real-world datasets will further enhance your employability and help you build a successful career in data analytics.
0 notes
Text
Top Tools and Techniques for Effective Data Management Planning
In today’s digital age, data is at the heart of decision-making for businesses. However, managing large volumes of data effectively requires proper data management planning and the right tools. Whether you're a business owner or Google Analytics consultants, having a solid strategy ensures accurate, actionable insights. Here are the top tools and techniques to streamline data management and boost efficiency.
1. Data Integration Tools
Platforms like Talend and Informatica simplify the integration of data from multiple sources. These tools ensure your data management planning is seamless, helping you consolidate and organize data efficiently.
2. Cloud-Based Storage Solutions
Solutions such as Google Cloud and AWS offer scalable, secure storage for your data. These platforms allow for easy access, ensuring your team can collaborate and analyze data in real-time.
3. Advanced Analytics Platforms
Google Analytics is a vital tool for understanding website performance and user behavior. A Google Analytics consultant can leverage its powerful features to identify trends, track performance metrics, and enhance your marketing strategies.
4. Data Quality Assurance Techniques
Data quality is critical for effective decision-making. Regular audits, validation tools, and cleansing processes ensure your data is accurate, reliable, and actionable.
5. Automated Reporting Tools
Power BI and Tableau are excellent for creating automated, interactive dashboards. These tools allow businesses to visualize data trends and track performance metrics, making it easier to align decisions with goals.
Conclusion
Effective data management planning requires the right mix of tools and techniques. By integrating platforms like Google Analytics with other advanced tools, businesses can unlock the full potential of their data. Partnering with Kaliper.io ensures expert guidance for accurate insights and better results. Start planning your data strategy today!
0 notes
Text
Job Oriented Data Analyst Training Course in Delhi, with Microsoft Certification, "New Year Offer 2025" Free Job Placement
Launch your career in data analytics with the Job-Oriented Data Analyst Course in Delhi, offered by SLA Consultants India. This program is meticulously designed to equip you with the in-demand skills required to excel in the data analytics field. The course curriculum covers essential tools like Advanced Excel, SQL, Tableau, Power BI, and Python, along with advanced concepts such as data visualization, data cleaning, and predictive modeling. Practical learning through live projects and case studies ensures you’re prepared to tackle real-world challenges effectively.
A key highlight of this Data Analyst Training in Delhi is the inclusion of a Microsoft Certification, a globally recognized credential that validates your proficiency in data analytics. This certification enhances your professional profile, making you a highly sought-after candidate in the competitive job market. With expert trainers and industry-relevant content, the course helps you master critical skills and stay ahead in the rapidly evolving analytics landscape.
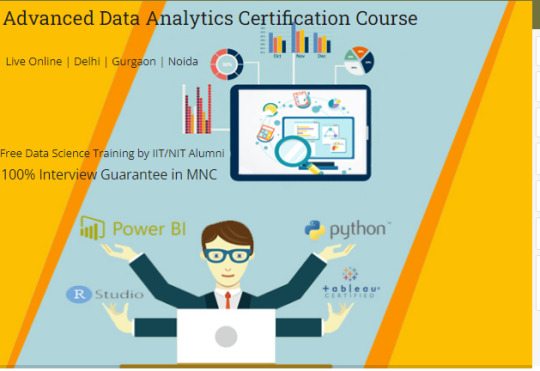
Adding even more value to the program is SLA Consultants India’s "New Year Offer 2025", which includes free job placement assistance. Their dedicated placement team connects you with top organizations, ensuring a seamless transition from learning to employment. With strong industry partnerships, SLA Consultants India provides opportunities for roles such as Data Analyst, MIS Executive, or Business Analyst in leading companies, helping you achieve your career goals.
The Data Analyst Certification in Delhi is available in both classroom and online formats, offering flexibility to suit the needs of students, working professionals, and career switchers. Whether you’re a recent graduate looking to start your career or a professional aiming to upskill, this program is the perfect choice. Enroll today in SLA Consultants India’s Job-Oriented Data Analyst Training Course to gain the skills, a prestigious Microsoft Certification, and job placement support—all designed to secure your success in the data-driven world.
Data Analyst Training Course Modules Module 1 - Basic and Advanced Excel With Dashboard and Excel Analytics Module 2 - VBA / Macros - Automation Reporting, User Form and Dashboard Module 3 - SQL and MS Access - Data Manipulation, Queries, Scripts and Server Connection - MIS and Data Analytics Module 4 - MS Power BI | Tableau Both BI & Data Visualization Module 5 - Free Python Data Science | Alteryx/ R Programing Module 6 - Python Data Science and Machine Learning - 100% Free in Offer - by IIT/NIT Alumni Trainer
0 notes
Text
How to Determine the ROI of Workforce Transformation Initiatives
Organizations are investing extensively in projects to improve employee skills, incorporate innovative technology, and instill a culture of flexibility. However, a fundamental question remains: how can you calculate the return on investment (ROI) for these workforce transformation initiatives? Quantifying ROI is critical not just for validating investments, but also for fine-tuning future projects. This blog delves into sophisticated ROI calculation methods, supported by industry information and frameworks.
Understanding Workforce Transformation ROI. Workforce transformation programs include activities like as upskilling, reskilling, process automation, and cultural changes. ROI, in this sense, refers to the financial gains received relative to the costs paid in making these improvements. While ROI is often measured as a percentage, workforce change frequently necessitates more complex assessment criteria.
Steps to Assess Workforce ROI 1. Define clear objectives. Before beginning any transition, it is critical to set defined, quantifiable goals. This might include:
Increasing employee productivity by X percent. Decreased time-to-market for new products.
Increasing staff retention by Y percent. Driving performance as indicated by the quantity of innovative ideas implemented. According to the World Economic Forum (WEF), organizations that focus reskilling can enhance productivity by up to 14%.
2. Identify key metrics. Key Performance Indicators (KPIs) are the cornerstone for workforce ROI. Common key performance indicators include:
Productivity gains: Compare outcomes like revenue per employee before and after the transformation.
Employee Engagement: Utilize engagement surveys or tools, such as Gallup's Q12 metric.
Turnover Rates: Keep track of the reduction in attrition rates and its influence on cost savings.
Innovation Metrics: Keep track of the number of patents filed and innovative solutions produced.
3. Quantify costs. To effectively measure workforce ROI, you must account for all related expenditures, including:
Training and development expenditures.
Technology adoption and integration are costly.
Opportunity expenses associated with employee time spent on transformation efforts.According to Deloitte's 2023 Human Capital Trends Report, the typical major firm spends $1,286 per person each year on training activities.
4. Evaluate financial benefits. Financial gains from workforce transformation may appear as follows:
Increased Revenue: Improved skills and engagement are frequently associated with increased sales and market share.
Cost savings come from automation and process improvements, which minimize operational inefficiencies.Retention Savings: According to a Society for Human Resource Management (SHRM) survey, replacing an employee costs an average of 6-9 months' compensation.
5. Use advanced analytics. Use modern analytics and AI techniques to predict difficult ROI scenarios. Predictive analytics may assist forecast future benefits, and data visualisation tools like as Tableau or Power BI can elucidate trends.
6. Consider Intangibles While financial indicators are vital, intangibles like as employee morale, brand reputation, and leadership development are also important. A McKinsey study discovered that businesses with a strong culture of continuous learning are 30% more productive.
Advanced frameworks for ROI calculation 1. The Phillips ROI Methodology. This five-step strategy focuses on isolating the consequences of workforce transformation efforts.
Assess response and satisfaction. Evaluate learning and skill development. Assess changes in application and behavior. Calculate the business effect. Calculate ROI as (Net Benefits / Costs) x 100.
2. Balanced scorecard. Kaplan and Norton developed this strategy, which extends beyond financial measurements and includes:
Customer Perspective: Increased customer satisfaction as a result of better staff performance. Internal Process Perspective: Increased Efficiency. Long-term capacities and flexibility are key components of the learning and growth perspective.
Real-World Examples of Workforce Transformation ROI. 1. The Amazon Upskilling 2025 Initiative Amazon has pledged $700 million to upskill 100,000 employees by 2025. Early findings demonstrate a positive ROI from greater internal mobility and lower recruiting expenses, demonstrating how smart investments may yield real returns.
2. The IBM SkillsBuild Program IBM's reskilling project resulted in a 40% increase in staff productivity, which immediately benefited their bottom line. The company's usage of AI-powered analytics also revealed opportunities for continual development.orld Examples of Workforce Transformation ROI.
Common Challenges and How to Address them Attribution: Determining which improvements directly contribute to ROI can be challenging. Overcome this by using control groups and pre/post implementation comparisons. Time Lag: Benefits might take years to manifest. Use Net Present worth (NPV) calculations to account for the time worth of money.
Data silos: Integrate systems to enable consistent data gathering and analysis.
Conclusion Measuring the ROI of workforce transformation programs is a multifaceted process requiring defined objectives, data collecting, and advanced analytics. While financial measurements are important, including qualitative outcomes enables a more comprehensive examination. Organisations may justify their investments while also building a compelling case for continual workforce transformation by using frameworks such as the Phillips ROI Methodology and employing real-world success stories.
TalenTeam specializes in guiding organizations through this path by deploying tailored workforce solutions that provide quantifiable ROI. Contact us immediately if you're just getting started or want to fine-tune your plan.
0 notes
Text
Automate Tableau Regression Testing with Datagaps BI Validator
Introduction
In today's data-driven world, the accuracy and reliability of business intelligence (BI) reports are paramount. As Tableau gains prominence for visualizing data, ensuring the integrity of these reports through effective regression testing becomes increasingly critical.
Challenges of Tableau Regression Testing
Tableau users often grapple with several challenges during regression testing. Issues such as handling complex data volumes, managing frequent updates, ensuring visualization accuracy, and maintaining consistent performance metrics pose significant hurdles.
Datagaps BI Validator: Your Solution
Enter Datagaps BI Validator—a robust tool tailored to streamline and enhance Tableau regression testing processes. From data comparison and UI consistency checks to comprehensive validation across multiple environments, BI Validator empowers organizations to maintain data accuracy effortlessly.
Key Features and Benefits
Automated Comparison: Automatically compare Tableau worksheet data and UI elements to detect discrepancies.
Detailed Reporting: Generate comprehensive reports with visual indicators to pinpoint changes between versions.
Integration and Automation: Seamlessly integrate with CI/CD pipelines for continuous testing and validation.
Comprehensive Validation: Validate data integrity, calculations, and visualizations across different Tableau environments.
Proactive Issue Detection: Receive alerts and notifications to promptly address discrepancies, ensuring data quality.
Expertise and Support: Leverage Datagaps' expertise in BI validation for unmatched accuracy and reliability.
Conclusion
Datagaps BI Validator empowers organizations to conquer Tableau regression testing challenges efficiently. By automating processes and providing actionable insights, BI Validator ensures that Tableau reports are always accurate, reliable, and up-to-date. Take charge of your data integrity with Datagaps BI Validator today.
Referred by Datagaps
#DataOpsSuiteBIValidator
Request a demo today
Demo: https://www.datagaps.com/request-a-demo/#utm_source=youtube&utm_medium=yt_video&utm_campaign=yt_request_demo&utm_id=yt_request_demo
#BI #PowerBI #BIValidator #Tableau #Datagaps
2 notes
·
View notes
Text
How Business Intelligence Consulting Companies Can Help
Business Intelligence (BI) consulting companies play a crucial role in helping organizations make data-driven decisions. By leveraging their expertise in data analysis, technology, and industry best practices, BI consultants can transform raw data into actionable insights. Here’s how they can help your business:

1. Strategic Planning and Roadmapping
Assessment and Goal Setting:
BI consultants start by understanding your business objectives and assessing your current data landscape.
They help set realistic goals and create a roadmap for implementing BI solutions that align with your strategic objectives.
Tailored BI Strategy:
Develop a customized BI strategy that fits your organization’s unique needs, industry, and market conditions.
Identify key performance indicators (KPIs) and metrics that matter most to your business.
2. Data Integration and Management
Data Collection and Integration:
BI consultants help gather data from various sources, such as databases, CRM systems, social media, and more.
They integrate this data into a cohesive system, ensuring seamless flow and consistency across your organization.
Data Quality and Governance:
Establish data governance policies to maintain data quality, accuracy, and security.
Implement data cleaning and validation processes to ensure the integrity of your data.
3. Implementation of BI Tools and Technologies
Tool Selection:
Assist in selecting the right BI tools and technologies that fit your business requirements and budget.
Evaluate and recommend software solutions like Tableau, Power BI, Qlik, or custom-built platforms.
System Integration:
Integrate BI tools with your existing IT infrastructure and ensure compatibility with other systems.
Configure and customize the tools to meet your specific reporting and analysis needs.
4. Data Visualization and Reporting
Interactive Dashboards:
Design and develop interactive dashboards that provide real-time insights and are easy to use.
Ensure dashboards are tailored to different user roles, from executives to operational teams.
Custom Reports:
Create customized reports that highlight critical metrics and trends.
Automate reporting processes to save time and reduce manual effort.
5. Advanced Analytics and Predictive Modeling
Descriptive Analytics:
Analyze historical data to understand past performance and identify patterns and trends.
Provide insights into what has happened in your business and why.
Predictive Analytics:
Use advanced algorithms and machine learning models to predict future outcomes.
Help forecast sales, customer behavior, market trends, and more, enabling proactive decision-making.
6. Training and Support
User Training:
Provide comprehensive training for your team to ensure they can effectively use BI tools and interpret data insights.
Offer ongoing training sessions as new features and updates are rolled out.
Technical Support:
Offer technical support to address any issues or challenges that arise with your BI system.
Ensure continuous improvement and optimization of your BI processes and tools.
7. Performance Monitoring and Optimization
Continuous Monitoring:
Monitor the performance of your BI solutions to ensure they meet your business needs.
Identify areas for improvement and make necessary adjustments to optimize performance.
Feedback and Iteration:
Collect feedback from users and stakeholders to continuously improve BI processes and tools.
Implement iterative improvements to keep your BI system aligned with changing business needs.
8. Competitive Advantage
Benchmarking and Market Analysis:
Provide benchmarking insights by comparing your business performance with industry standards.
Conduct market analysis to help you understand your competitive position and identify growth opportunities.
Strategic Insights:
Deliver strategic insights that help you make informed decisions, reduce risks, and seize opportunities.
Enable you to stay ahead of the competition by leveraging data-driven strategies.
Conclusion
Business Intelligence consulting companies are invaluable partners in your journey towards becoming a data-driven organization. They bring expertise, experience, and a structured approach to harnessing the power of data. By implementing robust BI solutions, integrating advanced analytics, and providing continuous support, BI consultants enable businesses to make smarter decisions, improve efficiency, and gain a competitive edge. Whether you are just starting with BI or looking to optimize your existing processes, a BI consulting company can provide the guidance and tools you need to succeed.
0 notes
Text
What are the long-term benefits of pursuing an HR certification? Get Best HR Certification Course by SLA Consultants India
Pursuing an HR certification offers numerous long-term benefits, making it a valuable investment for professionals looking to advance in the field of Human Resources. As organizations continuously evolve, they seek HR professionals with specialized skills in recruitment, compliance, payroll management, and employee relations. An HR Course in Delhi enhances industry knowledge but also boosts career prospects by validating expertise in modern HR practices, ensuring long-term job stability and growth in this dynamic field.
One of the most significant advantages of earning an HR certification is increased employability and higher salary potential. Certified HR professionals are often preferred by employers due to their structured training and up-to-date knowledge of labor laws, HR analytics, and digital HR tools such as HRMS and payroll automation. This HR Training Course in Delhi provides a competitive edge, allowing professionals to secure high-paying roles in leading organizations across industries, including IT, finance, healthcare, and manufacturing.
Another long-term benefit is career advancement and leadership opportunities. An HR Certification Course in Delhi helps professionals transition into strategic roles such as HR Manager, HR Business Partner, or Talent Acquisition Head. As companies emphasize employee engagement, organizational development, and compliance, certified HR professionals play a crucial role in shaping business strategies. Additionally, having an HR certification increases the chances of international career opportunities, as globally recognized HR skills are in demand across multinational corporations.

Advanced HR Generalist Training Course Details
Module 1 - Statutory and Legal Compliances - HR Training by MNC Expert
Module 2 - Compensation And Benefits - HR Training by MNC Expert
Module 3 - Corporate IR / Labour Law Compliances - HR Training by MNC Expert
Module 4 - Performance Management System (Advanced Topic Added) in HR Training
Module 5 - Learning and Organizational Development (Advanced Topic Added)
Module 6 - HR Policies (New Topic Added)
Module 7– HR -Business Partner (Advanced TopicAdded)
Module 8 - Employee Relationship Management Workshop Session - HR Training by MNC Expert
Module 9 - Recruitment and Selections - HR Talent Acquisition Expert
Module 10- Interview
Module 11–Advanced SAP HCM/SAP HR
Module 12 Project Process in SAP HCM implementation
Module 13 Reporting Tools OR SAP HCM Report
Module 14 Project Preparation (SAP)
Module 15 Advanced HR Analytics with Tableau
Module 16 to 20 – HR Psychometric Test
To maximize these long-term benefits, enrolling in a professional HR certification course from a reputed institute is essential. SLA Consultants India offers industry-oriented HR training that covers payroll processing, labor laws, recruitment strategies, HR analytics, and compliance management. HR Training Institute in Delhi provide hands-on learning, practical case studies, and placement assistance, ensuring professionals are well-equipped for career success. By obtaining an HR certification, individuals can secure long-term job stability, higher earning potential, and leadership roles in the ever-growing HR industry. For more details Call: +91-8700575874 or Email: [email protected]
0 notes
Text
Seamless Tableau to Power BI Migration: A Guide by Office Solution
In today’s fast-evolving business landscape, organizations are constantly seeking better ways to analyze and visualize data. Many companies are now transitioning from Tableau to Power BI to leverage Microsoft’s robust ecosystem, cost-effectiveness, and deeper integration with other business tools. Office Solution specializes in helping businesses achieve a smooth migration from Tableau to Power BI, ensuring minimal disruption and maximum efficiency.
Why Migrate from Tableau to Power BI?
Cost-Effectiveness: Power BI offers competitive pricing, making it a budget-friendly alternative for businesses looking to scale their analytics solutions.
Seamless Integration: As part of the Microsoft ecosystem, Power BI integrates smoothly with Excel, Azure, and other Microsoft products, enhancing workflow efficiency.
User-Friendly Interface: Power BI's intuitive design makes it easier for users with minimal technical expertise to create reports and dashboards.
Advanced AI Capabilities: With built-in AI and machine learning features, Power BI provides more intelligent data insights.
Enhanced Data Connectivity: Power BI supports a wider range of data sources, making it easier to consolidate and analyze information.
Steps for a Smooth Tableau to Power BI Migration
1. Assess Your Current Tableau Environment
Before migration, evaluate your existing Tableau reports, data sources, and dashboards to identify key elements that need to be transferred.
2. Map Tableau Features to Power BI
Since Tableau and Power BI have different functionalities, a detailed mapping process is required to align Tableau’s calculations, visualizations, and data models with Power BI’s equivalents.
3. Extract and Transform Data
Use Power Query to extract data from Tableau and transform it into Power BI-compatible formats. Ensure data integrity and accuracy during this process.
4. Rebuild Dashboards and Reports
Recreate Tableau dashboards in Power BI using its visual elements and features. Leverage Power BI’s built-in AI and automation tools to enhance reporting capabilities.
5. Validate and Test
Conduct a thorough validation process to ensure all data points and visualizations align correctly. Run parallel reports in both platforms to compare accuracy.
6. Train Users and Deploy
Provide Power BI training for end-users to maximize adoption and ensure they can fully utilize the platform’s capabilities.
Why Choose Office Solution for Tableau to Power BI Migration?
At Office Solution, we understand that every business has unique data needs. Our team of migration experts ensures a seamless transition by:
Conducting in-depth assessments to create a customized migration roadmap.
Handling data transformation and dashboard recreation with precision.
Providing post-migration support and training to ensure smooth adoption.
Conclusion
Migrating from Tableau to Power BI can be a game-changer for businesses looking to enhance their data analytics while reducing costs. Office Solution simplifies this transition, ensuring efficiency and accuracy every step of the way. Contact us today to start your seamless migration journey!
visit us : https://tableautopowerbimigration.com/
0 notes
Text
10 Best Marketing Analytics Tools to Use in 2024
Business owners and marketers frequently gather customer and competitor data for targeted marketing efforts, trend identification, issue/opportunity spotting, and decision-making. Marketing analytics involves utilizing tools like data analytics, business intelligence, dashboards, and reporting. Streamlining this process is achievable through dedicated marketing analytics software. In this article, let’s explore top options, detailing features, benefits, and reliability.

10 best marketing analytics tools you can consider
There are many marketing analytics tools out there that promise to process and extract valuable insights from your marketing data. So, to help you choose an appropriate tool for your business, let’s see a list of the top 10 marketing analytics tools.
Coupler.io — a platform for data automation, analytics, and reporting
Coupler.io is a comprehensive data automation and analytics platform that empowers efficient data management. It enables the collection, transformation, and analysis of marketing data for informed decision-making. While not a direct marketing tool, it facilitates marketing analytics and reporting tasks.
Key features include a number of marketing sources to extract data from, like Google Analytics 4, Facebook Ads, Mailchimp, and others. Coupler.io also integrates with Looker Studio for customized analytical reports and automation. Alternatively, it seamlessly connects marketing sources to other BI tools such as Tableau or Power BI.
Moreover, Coupler.io offers data analytics consultancy services, addressing diverse data-related challenges, including advanced visualization and setting up data infrastructure.
2. Optimizely
Optimizely serves as a versatile digital experience platform, encompassing content creation, e-commerce management, and experimentation for optimizing customer interactions.
The platform includes robust features for content management throughout its lifecycle. From campaign assistance through the Content Marketing Platform to enhancing digital experiences via the Content Management System, Optimizely provides comprehensive support.
For e-commerce endeavors, Optimizely offers AI-powered tools for personalized experiences and product recommendations, enhancing business management capabilities and fostering customer engagement.
With its experimentation tools, Optimizely enables thorough evaluation of customer touchpoints. Through Web Experimentation, users can conduct tests to glean insights and refine user experiences, while Feature Experimentation aids in validating new features and ensuring high-quality releases.
3. Heap
Heap is a marketing analytics platform designed to provide comprehensive insights into customer digital experiences, aiding in enhancing conversion rates, retention, and satisfaction.
Key features include session replay, enabling users to visualize user interactions and identify moments of friction. It also facilitates the discovery of potential issues and opportunities within the product’s digital experience, helping to avoid confirmation bias and erroneous decisions.
Additionally, Heap allows for the creation of user segments to understand diverse user behaviors and personalize their journeys. It supports dashboard creation for monitoring metrics and sharing insights while offering auto-capture, custom tracking, and server-side event capabilities for robust behavioral data collection. Moreover, Heap offers cross-platform analytics, ensuring seamless monitoring of digital experiences across web and mobile platforms, and integrates with various business software tools for enhanced functionality.
4. TapClicks
TapClicks serves as a comprehensive marketing analysis tool encompassing workflow and project management, big data integration, insights, analytics, and reporting.
Key features include tapAnalytics, enabling the analysis of campaign performance by uncovering hidden trends and opportunities. It facilitates data calculations, consolidation from multiple sources, goal and budget tracking, as well as lead and data load status management.
TapClicks offers tapData for automated data pipeline management, aggregating, blending, and transferring data from over 6000 sources to popular destinations such as BigQuery, Snowflake, and S3. It provides dimension, filter, and flexible data control options for data refinement. Additionally, tapReports allows users to create impactful reports and dashboards displaying KPIs and statistics, with features for adding recipients and scheduling report delivery.
5. Mixpanel
Mixpanel is an advanced user behavior analytics platform empowering data-driven decision-making for businesses. This marketing analytics tool provides insights into user interactions with products, aiding in informed decision-making to enhance user engagement and retention.
Key features of Mixpanel include event tracking, enabling the monitoring of individual user interactions across multiple touchpoints. It also offers funnels and retention analysis to understand user journeys, pinpoint drop-offs, and assess user retention comprehensively.
Mixpanel provides predictive analytics utilizing machine learning algorithms to forecast user behavior and optimize marketing strategies effectively. User segmentation capabilities allow businesses to categorize users based on behavior and attributes, enabling targeted marketing efforts. Additionally, Mixpanel integrates seamlessly with various other tools, including CRMs and email marketing platforms, for enhanced functionality.
6. Buffer
Buffer is a comprehensive social media management tool that simplifies the process of scheduling posts across various platforms such as Twitter, allowing users to efficiently plan and manage content from a single dashboard. Additionally, it serves as a valuable marketing analytics software, enabling analysis of post-performance and other social media marketing activities.
Key features of Buffer include post scheduling, facilitating the organization, and management of social media posts across different platforms within one centralized dashboard. It also offers social media performance analytics, allowing users to assess the effectiveness of their posts and refine their social media strategy accordingly.
Moreover, Buffer provides multi-account management capabilities, enabling users to oversee multiple social media accounts from a single platform. Team collaboration features allow for seamless teamwork on social media campaigns, while custom reports offer detailed insights into social media performance, aiding in the optimization of marketing strategies. Integration with other digital marketing tools further streamlines processes, enhancing overall efficiency.
7. Google Analytics 4
GA4, the successor of Google Analytics Universal, serves as a powerful web analytics tool assisting businesses in comprehending user interactions with their websites and apps.
Key features of Google Analytics 4 include user-centric measurement, allowing businesses to track customer journeys across various devices and platforms in a privacy-conscious manner. Unlike its predecessor, GA4 emphasizes customer-centric measurement over device-centric tracking.
Enhanced audience-building capabilities enable the creation of audiences based on user behavior, demographics, and technological attributes. These audiences can be analyzed within GA4 or exported to Google Ads for remarketing campaigns. Additionally, GA4 offers codeless event tracking, allowing users to configure specific events directly from the user interface without the need for additional code on their site or app.
GA4 incorporates data-driven attribution models powered by machine learning, facilitating the assignment of credit to touchpoints in the customer journey. This enables businesses to gain insights into which marketing efforts are driving the most significant results, aiding in strategic decision-making and campaign optimization.
Additionally, businesses can easily export data from GA4 to Power BI, allowing for seamless integration and comprehensive analysis of web and app analytics within Power BI’s powerful reporting environment.
8. Looker Studio
Looker Studio offers a versatile solution for transforming raw data into actionable insights, facilitating informed decision-making across various domains. With its customizable dashboards and reports, users can efficiently monitor key metrics and trends derived from data collected from CRMs, email software, and other marketing applications. This simplifies data analysis and enhances the accessibility of insights for all stakeholders, not just data scientists.
Key features of Looker Studio include customizable dashboards and reports, enabling users to create tailored marketing dashboards to track essential metrics and streamline reporting processes. Additionally, its data modeling capabilities empower users to understand intricate relationships and patterns within their datasets, further enhancing data analysis efficiency.
Furthermore, Looker Studio offers seamless integration with various data sources and business tools, ensuring compatibility and interoperability across platforms. Users can leverage native or third-party connectors, such as Coupler.io, to integrate Looker Studio with other business tools and data sources effortlessly, expanding its utility and versatility within organizational workflows.
9. Contentsquare
Contentsquare stands out as a robust digital experience analytics platform dedicated to offering businesses profound insights into user interactions across websites, mobile apps, and other digital products. Leveraging machine learning algorithms, often referred to as AI in marketing parlance, Contentsquare delivers predictive analytics aimed at enhancing customer experience and fostering growth.
Key features of Contentsquare include user journey analysis, allowing businesses to scrutinize user paths to pinpoint friction points and optimization opportunities. Through session replay, users can delve into individual user sessions to gain nuanced insights into user behavior. Heatmaps provide visual representations of user interactions, offering clarity on areas of interest and potential issues within digital interfaces.
Moreover, Contentsquare offers conversion funnel analysis, enabling businesses to track user behavior through the conversion process and identify points of abandonment. Its predictive analytics capabilities harness AI to forecast future user behavior and trends. Additionally, Contentsquare boasts integration capabilities with various digital tools, including CRM systems, e-commerce platforms, and analytics tools, ensuring seamless compatibility and data flow across platforms.
10. Plerdy
Plerdy serves as a comprehensive conversion rate optimization solution, equipping businesses with essential tools to monitor and enhance their online performance. These tools, including session replay and heatmaps, offer valuable insights into website usability and facilitate increased conversions.
Key features of Plerdy encompass session replay, enabling businesses to monitor visitor behavior and detect anomalies, providing precise insights into user interactions on selected web pages. Heatmaps visualize user behavior, shedding light on areas of interest and potential friction points within the website interface.
Plerdy offers event-tracking functionality, allowing businesses to monitor user-specific actions such as clicks and form submissions. This aids in evaluating website design effectiveness and identifying issues that may contribute to high vain click rates. Additionally, Plerdy provides conversion funnel analysis, enabling businesses to scrutinize user behavior throughout the conversion process, pinpointing drop-off points and optimization opportunities.
Leverage marketing analytics tools to enhance decision-making processes
Integral to every marketing campaign, analytics aids in issue identification and swift action, facilitating data-driven decision-making within your business.
An optimal marketing analytics platform should enable comprehensive data collection from diverse sources, facilitate categorization, and interpretation through dashboards, automate report generation, and accommodate multiple users for enhanced collaboration and efficiency.
0 notes
Text
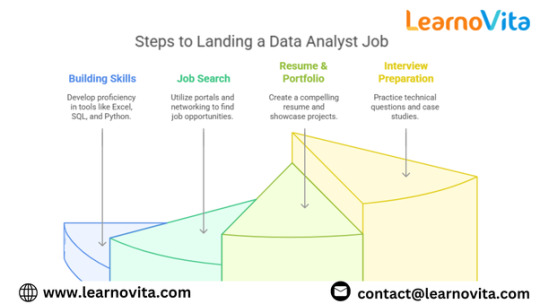
How to Become a Data Analyst: A Step-by-Step Guide
A career as a Data Analyst is one of the most promising paths in today’s data-driven world. Businesses rely on data analysts to interpret information, uncover trends, and provide actionable insights that drive decision-making. With industries like finance, healthcare, and technology increasingly investing in data analytics, the demand for skilled professionals continues to grow. However, many aspiring data analysts are unsure of where to start and what skills to develop. This guide provides a clear, step-by-step approach to becoming a Data Analyst, from learning essential tools to landing your first job from the best Data Analytics Online Training.

Step 1: Develop the Necessary Skills
To succeed as a Data Analyst, mastering technical and analytical skills is essential. A strong foundation in data manipulation, statistics, and visualization is crucial. Learning SQL is the first step, as it allows analysts to retrieve and manage data efficiently. Excel is also widely used for organizing datasets and performing basic analysis. For advanced analytics, programming languages like Python and R are valuable, enabling automation and deeper statistical analysis. Visualization tools such as Tableau and Power BI help in presenting findings clearly, making insights accessible to stakeholders. Additionally, understanding business concepts and problem-solving techniques enhances an analyst’s ability to interpret data effectively.If you want to learn more about Data Analytics, consider enrolling in an Best Online Training & Placement programs . They often offer certifications, mentorship, and job placement opportunities to support your learning journey

Step 2: Work on Real-World Projects
Practical experience is key to building confidence and showcasing analytical skills. Working with real-world datasets helps in applying theoretical knowledge to solve business problems. Platforms like Kaggle, Google Data Studio, and government data portals offer access to publicly available datasets, allowing aspiring analysts to practice data cleaning, analysis, and visualization. Creating dashboards, writing reports, and presenting insights through storytelling are valuable exercises that prepare candidates for industry demands. Engaging in case studies and problem-solving challenges further strengthens analytical abilities.
Step 3: Build a Strong Portfolio
A well-structured portfolio sets candidates apart in the competitive job market. Showcasing projects on platforms like GitHub, LinkedIn, or personal websites demonstrates technical expertise and problem-solving capabilities. A strong portfolio includes various types of analyses, such as trend analysis, customer segmentation, and predictive modeling. Including visualizations, code explanations, and business insights makes the work more impactful. Employers look for candidates who can translate raw data into meaningful narratives, so a portfolio that highlights storytelling through data is highly valuable.
Step 4: Earn Relevant Certifications
Certifications enhance credibility and signal proficiency in key analytics tools. Industry-recognized certifications such as the Google Data Analytics Certificate, Microsoft Certified: Data Analyst Associate, and Tableau Desktop Specialist validate essential skills. These certifications help candidates stand out, especially when transitioning from non-technical backgrounds. Many online platforms offer structured courses, combining theoretical concepts with hands-on practice to ensure a well-rounded learning experience. While certifications are not mandatory, they significantly boost job prospects.
Step 5: Apply for Internships and Jobs
Gaining practical industry experience through internships or entry-level positions is crucial for career growth. Many companies offer internships that provide exposure to real business problems and hands-on experience with analytics tools. Applying for junior Data Analyst roles, business intelligence positions, or data-focused internships helps in getting a foot in the door. Crafting a well-structured resume that highlights analytical skills, projects, and certifications increases the chances of securing interviews. Networking with professionals through LinkedIn, attending industry webinars, and participating in data communities also opens doors to job opportunities.
Conclusion
Becoming a Data Analyst requires a combination of technical skills, hands-on experience, and a strong portfolio. By mastering SQL, Excel, Python, and visualization tools, aspiring analysts can build a solid foundation. Working on real-world projects and earning relevant certifications further strengthens credibility. Gaining practical experience through internships and networking with industry professionals accelerates job placement. With businesses increasingly relying on data for decision-making, skilled Data Analysts will continue to be in high demand, making this a rewarding and future-proof career choice.
0 notes
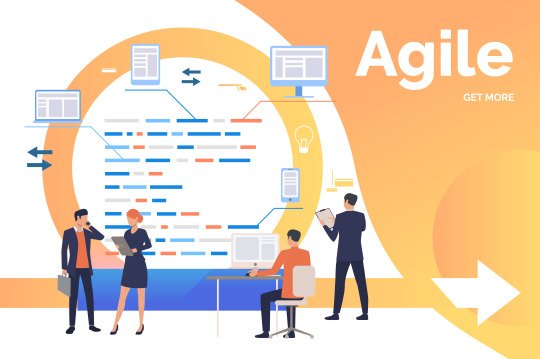
Text
Agile Intelligence: Transforming Business Intelligence with Agile Practices
Introduction:
Timely and actionable insights are critical in the fast-paced corporate world. Organizations are increasingly using Agile approaches to transform their Business Intelligence (BI) processes to stay up with changing market conditions. This thorough reference explains how to incorporate Agile ideas and practices into business intelligence (BI) processes to improve flexibility, teamwork, and the efficacy of data-driven decision-making as a whole.
Understanding Agile in the Context of Business Intelligence
1. Agile Principles in BI:
Iterative Development: Divide big-data initiatives into more manageable steps so that they can be continuously improved upon in response to input.
Customer Collaboration: Involve stakeholders at every stage of the BI development process to make sure the insights provided are suitable for their changing requirements.
Accepting Change: To adjust to changing business priorities, accept requirements changes even if they occur late in the development process.
Self-Organizing Teams: To boost productivity and group ownership, BI teams should be encouraged to collaborate across functional boundaries.
2. Agile Methodologies for BI:
Scrum in BI: To arrange BI teams, schedule sprints, and guarantee the constant delivery of insightful BI information, use Scrum frameworks.
Kanban for BI: Use Kanban boards to effectively prioritize tasks and promote transparency by managing and visualizing the flow of BI activity.
Applying Agile to Business Intelligence Practices
1. User Story Mapping:
Define User Stories: Using user stories, map important user personas BI requirements and make sure they are in line with corporate objectives.
Prioritize User Stories: Sort user stories according to their business value so that BI teams can concentrate on delivering the most significant insights first.
2. Sprint Planning for BI:
Define Sprint Goals: Clearly define the goals of every BI sprint, including improving current reports and creating new analytical models.
Time-Boxed Development: To maintain a responsive development speed and a consistent cadence of BI deliverables, apply time-boxed sprints.
3. Cross-Functional BI Teams:
Skill Diversification: Create diversified, cross-functional BI teams of data analysts, business analysts, and visualization specialists.
Collaborative Environment: Encourage a culture of collaboration among team members so that during the BI development process they may exchange ideas, knowledge, and criticism.
4. Continuous Feedback Loops:
Regular Stakeholder Demos: Showcase BI deliverables frequently, solicit comments, and make any necessary modifications in real-time.
Retrospectives: Have retrospectives following each BI sprint to discuss what went well and what may be improved, promoting a continuous improvement culture.5. Agile BI Tools:
Data Visualization Platforms: Use agile-friendly BI tools, such as Tableau or Power BI, to speed up the development and visualization of insights.
Collaboration Platforms: Jira and Trello are examples of collaborative applications that may be used to organize BI activities, improve collaboration, and preserve transparency.
Overcoming Challenges in Applying Agile to BI
1. Data Quality and Governance:
Establish Data Standards: By establishing and following defined data procedures, you can guarantee data quality and control.
Data Validation: To identify anomalies early in the BI development lifecycle, implement automated data validation procedures.
2. Balancing Flexibility and Structure:
Adaptability: To keep BI projects from becoming chaotic, embrace Agile’s adaptable nature while preserving a certain degree of structure.
Agile Leadership: Encourage leadership that recognizes the necessity for strategic alignment while also understanding the balance between Agile ideals.
3. Cultural Shift:
Training and Education: BI teams and stakeholders should be encouraged to adopt an Agile attitude by funding training and educational initiatives.
Change Management: To help the organization navigate the cultural transition to Agile BI practices, put change management techniques into action.
Conclusion:
Organizations may unleash the full power of their data by integrating Agile concepts and methodology with Business Intelligence practices. Agile‘s iterative, customer-centric methodology improves teamwork, speeds up delivery, and makes ensuring that business requirements are always evolving so that BI insights stay applicable. Accept the Agile intelligence revolution and turn your business intelligence (BI) procedures into a responsive, dynamic engine that powers data-driven decision-making.
0 notes