#( further analysis tba )
Explore tagged Tumblr posts
Visit Tumblr Blog
Explore Tumblr blogs with no restrictions, modern design and the best experience.
Last Seen Tumblr Blogs


Fun Fact
In 2020, 44% of users from Denmark used Tumblr daily.
Text

ANIMAL: WOLF
Loyal, observant, free and determined - these are just some of the qualities that the Wolf possesses, or symbols that refer to this animal. It is one of the most fascinating and powerful. He relies on his pack and his people to ensure his survival, while retaining his individuality and following his own instincts. He shows us that there's strength in numbers, and reminds us that together we can do better. It is endowed with great strength, and although it is sometimes seen by man as a wild and solitary animal, it is nevertheless one of the most sensitive and faithful.
#( further analysis tba )#—◆ character study | somebody inside of me has always tried ( with all his strength ) to be nobody
1 note
·
View note
Text

001. GENERAL INFORMATION.
OFFICIAL NAME Cedric Rowan Sinclair.
NICKNAMES + ALIASES Sinclair ( if anything ) , Ced ( rarely ), Ceddy ( never, except from his mom ).
AGE Thirty seven.
GENDER Cis man.
PRONOUNS He / him.
SEXUALITY Heterosexual.
ZODIAC Capricorn.
PLACE OF BIRTH London , England.
RESIDENCE High end waterfront property in Riverside , Heartford.
OCCUPATION Music producer & composer.
LANGUAGES SPOKEN English , French , Some Spanish , Some Danish.
002. PHYSICAL TRAITS.
HAIR COLOR Brunet.
HAIR STYLE Short , kempt + stubble facial hair.
EYES Russet.
HEIGHT Six feet.
BUILD Athletic / muscular.
ETHNICITY English , Scottish , Greek.
NATIONALITY British.
TATTOOS None.
PIERCINGS None.
MARKINGS Several small scars from childhood scattered along his arms and legs + a birthmark on his right shoulder blade.
FACECLAIM Theo James.
003. MENTAL ANALYSIS.
POSITIVE TRAITS Charismatic , dauntless , incisive , resilient.
NEGATIVE TRAITS Evasive , impulsive , roguish , sarcastic.
VICES Decadence , hastiness , selfishness , stubbornness.
VIRTUES Assertiveness , imaginative , perseverance , tolerance.
ALIGNMENT Chaotic neutral.
004. CONNECTIONS.
MOTHER Katherine "Kitty" Sinclair ( Née Crawford ).
STATUS Alive.
RELATIONSHIP Close.
FATHER Robert Sinclair.
STATUS Alive.
RELATIONSHIP Strained.
SIBLINGS Deacon Sinclair & Maisie Everett ( Née Sinclair ).
STATUS Alive.
RELATIONSHIP Indifferent.
005. BIOGRAPHICAL DATA.
New year, new bundle of joy ― born on the first of January, on a blisteringly cold evening in London, Cedric brought an unyielding warmth with him into the Sinclair's lives. As the middle child, but the youngest boy, he was given a freedom others may have deemed negligent. While his older brother was prepping for the inheritance of the Sinclair's business empire, and his younger sister was being coddled like a caged bird, Cedric was gallivanting across Europe, experiencing the lifestyle his mother had formerly engaged before being chained down.
Partying in between his not so dedicated studies, traveling the globe to absorb everything the world had to offer, and dabbling in a passion that he'd developed at a young age. Always having been musically inclined, Cedric's talent was only honed by being professionally trained by the best pianist his parents could afford ― his dad's only positive contribution to the young man's life. Through connections made via countless parties and events, he was quick to make a name for himself in the music industry. What started as symphonic concerts, eventually had him branching out into his own avenue, creating his own label, further separating himself from his family's legacy to develop an individualistic one of his own.
Reaching the pinnacle of his career in his mid thirties, it could only go downhill from there, and the drop was more nauseating than the steep slopes of any available roller coaster. The illegal substances Cedric had consumed through years spent in pursuit of pleasure finally caught up to the musician. A media scandal chased his dreams down the drain and his father's fury forced him into recluse, the mock story of charity work overseas covering up his intensive stay in only the best rehabilitation villa.
A year passes and new beginnings are promised. Heartford is suggested to him, a newly appointed city still with the charm of a quaint town. With a studio built into the newly purchased waterfront home, he has hopes of redeeming his reputation, focusing on his first love in a more peaceful setting.
006. WANTED PLOTS.
TBA
3 notes
·
View notes
Text
1 note
·
View note
Text
#AO3 Feed Link#FanFiction#AO3 Izuhatsuocha#♣#Izuhatsuocha#Bakutsuyu#💣#🐰#🔧#🎈#🐸#⚢#⚤#R:T#A:AuthorDGaster
1 note
·
View note
Text
Growth of Propylene Oxide Market Quantitative and Qualitative Analysis | Industry Challenges and Forecast till 2036
Research Nester has released a report titled “Propylene oxide Market: – Global Demand Analysis & Opportunity Outlook 2036” which also includes some of the prominent market analyzing parameters such as industry growth drivers, restraints, supply and demand risk, market attractiveness, year-on-year (Y-O-Y) growth comparisons, market share comparisons, BPS analysis, SWOT analysis and Porter’s five force model.

The global propylene oxide market has shown significant growth on account of increasing application of propylene oxide as a chemical intermediate. Backed by this factor, the propylene oxide market is estimated to witness significant growth in the coming years. In 2019, the market accounted for a market value of USD 13875.7 million and is estimated to grow by a CAGR of 5% over the forecast period of 2023-2035. A significant trend in the propylene oxide market has been the development and commercialization of new production technologies, which not only reduces the production of by-products but also does not use any chlorine-based chemistry.
Request Report Sample@
https://www.researchnester.com/sample-request-2804
Regionally, the global propylene oxide market is segmented into North America, Asia Pacific, Europe, Latin America, and Middle East & Africa region. Among the market in these regions, the Asia Pacific propylene oxide market is estimated to witness highest growth throughout the forecast period. The region is home to some of the fastest-growing economies of the world, including China, India, Bangladesh, and others. The evolution of construction, automotive, food & beverage and other industries has further strengthened the overall economic growth of the region, which is further anticipated to create lucrative opportunities for the new entrants in the market.
The Europe propylene oxide market is expected to touch a value of USD 4199.5 by 2035 by growing at a CAGR of 2.8 percent over the forecast period. Propylene oxide has gained popularity in the European market owing to its growing adoption in end-use industries such as construction & manufacturing, automobiles, consumer electronics, and packaging. Germany is the largest as well as the fastest-growing country in Europe propylene oxide market. The rapidly growing construction sector in the country on account of population growth, demographic changes, and favorable environment has influenced the market growth. The building & construction industry is one of Europe’s main consumer of propylene oxide.
The global propylene oxide market is segmented on the basis of production process into chlorohydrin process, styrene monomer process, hydrogen peroxide process, TBA co-product process, and cumene-based process. Among these, is it anticipated that the chlorohydrin (CPHO) process will account for a market value of about USD 4920.6 million by 2020. CHPO is the oldest process used in the production of propylene oxide and held the largest market share in 2019.
Request for customization @
https://www.researchnester.com/customized-reports-2804
Increasing Use Of Propylene Oxide As A Chemical Intermediate to Drive the Market Growth
Increased demand for propylene oxide for the production of chemical intermediates such as for the polyurethane and solvent industries, is a key factor expected to drive the growth of the market over the forecast period. The rapidly growing healthcare sector is also expected to create lucrative opportunities for the global propylene oxide market. Propylene oxide is used for low-temperature sterilization of medical devices, bandages, and various other pharmaceutical products. It also functions as an essential chemical intermediate for the manufacture of propylene glycol, which is widely used in the chemical, food & beverage, pharmaceutical and cosmetics industries. Over the forecasted period, this factor is expected to drive the growth of the global demand for propylene oxide.
However, the possible carcinogenicity associated with the application of propylene oxide along with the environmental liability associated with the chlorohydrin process for the production of propylene oxideis expected to serve as a restraining factor in the growth of propylene oxide market during the forecast period.
This report also provides the existing competitive scenario of some of the key players of the propylene oxide market which includes company profiling of Dow, Balchem Inc (NASDAQ: BCPC), BASF SE (ETR: BAS), Ashland (NYSE: ASH); Alfa Aesar, Thermo Fisher Scientific.; Sumitomo Chemical Co, Ltd. (TYO: 4005), Huntsman International LLC (NYSE: HUN), Lyondellbasell Industries Holdings B.V. (NYSE: LYB), Eastman Chemical Company (NYSE: EMN) among other prominent players.
The profiling enfolds key information of the companies which comprises of business overview, products and services, key financials and recent news and developments. Conclusively, the report titled “Propylene Oxide Market– Global Demand Analysis & Opportunity Outlook 2036”, analyses the overall propylene oxide industry to help new entrants to understand the details of the market. In addition to that, this report also guides existing players looking for expansion and major investors looking for investment in the global propylene oxide market in the near future.
Access Full Report, here@
https://www.researchnester.com/reports/propylene-oxide-market/2804
About Research Nester-
Research Nester is a leading service provider for strategic market research and consulting. We aim to provide unbiased, unparalleled market insights and industry analysis to help industries, conglomerates and executives to take wise decisions for their future marketing strategy, expansion and investment etc. We believe every business can expand to its new horizon, provided a right guidance at a right time is available through strategic minds. Our out of box thinking helps our clients to take wise decision in order to avoid future uncertainties.
Contact for more Info:
AJ Daniel
Email: [email protected]
U.S. Phone: +1 646 586 9123
U.K. Phone: +44 203 608 5919
0 notes
Text

This is just a quick list of the finished fics I’ve posted here and on AO3. Check under the #hounds speaks and #my writing tags for essays, criticisms, meta analysis, and general thoughts.
Mudhorn divider by @/thecutestgrotto
Banner and all other dividers courtesy of @/saradika-graphics
Action figure blog: @ar-pic-ulated

The Mandalorian
• Geroya: One-shot. 1k words. Gen. Set pre-show, leading into Season 1. Worldbuilding, filling in the spaces within canon.
• Fate Sometimes Steps In: One-shot. 1k words. Gen. Set after “The Gunslinger,” focusing on Fennec Shand.
• Gaa’tayl: One-shot. 3k words. Gen. Set pre-show, following Paz Vizsla.
• Stranded In the Desert: One-shot. 3.1k words. Gen. A missing/added scene to the beginning of “The Passenger” with Mando and the kid.
• Nightfall: One-shot. 1.8k words. Gen. Set during Order 66, an alternate take on the child’s escape.
• The Exodus: One-shot. 5.7k words. Gen. The third act of “The Sin” from the covert’s perspective, retconning the later idea that only Paz Vizsla and the Armorer escaped Nevarro.
• The Oldest Profession: One-shot. 4.9k words. Gen. Set prior to the show, a sort of character study of Mando.
• Temporal Chalice AU (potential time travel/history rewritten smorgasbord)
• The Concept of Names: 1.1k word character study. Mando’s relationships with others as shown by what he calls them.
• Mando takes a job with a stranger
• Toro Calican Lives AU: Series, WIP, Teen. Toro Calican makes a different choice and sets his life on a different path.

The Clone Wars
Aay’han
Original clone trooper story. Gen.
Chapter 1 — Remains to Be Seen: 4.6k words
Chapter 2 — TBA
Rogue One
Soldier, Princess, Farm Boy, Spy
Comparing and contrasting four heroes of the Rebellion. Gen. WIP.
Chapter 1 — Disparity: 1.9k words
Chapter 2 — TBA

The Bad Batch
• My Brother’s Keeper: Multi-chapter, WIP. Gen. Clone Force 99 stumbles onto a nexus of the Force and wakes up to find they’ve swapped bodies with one another.
Original Trilogy
• Bar Talk: One-shot. 2.7k words. Gen. Set a short time after Return of the Jedi, with Lando and Luke.
Prequel Trilogy
• Amidala the Resilient: One-shot AU. 3.9k words. Teen, heavy themes. A different ending for Revenge of the Sith.
• Spooky/angsty Padme Lives AU
• Redrafting The Phantom Menace
Sequel Trilogy
• An alternate universe with the same characters in a completely different story (action figure blog, adventure movie pitch)
• The Last Jedi AU: Paige lives, Poe abides by the letter of the law, Rose and Finn pull a jailbreak, and somebody finds a mysterious crystal

Crossovers, Fusions, and Retellings
The Princess Bride
The Sabersmith’s Son
The Colossus of Kashyyyk
The Man In Black
• A Prospect/Mandalorian crossover scene
Analyses, Criticisms, and Elevator Pitches
The Mandalorian
• Theory about Mando’s parents
• Mando lets Karga live, “The Sin”
• Peli Motto’s intuition
• Character analysis: Toro Calican
• Theory about Boba Fett’s original connection to Fennec Shand
• World-building: The covert on Nevarro
• Script analysis: Gor Koresh, and Mando’s justified violence
• Loose story threads: Minor changes to “The Passenger”
• Further details on potential themes “The Passenger” episode could have had (In a reblog for Stranded In the Desert)
• Character analysis of Mando: Protective vs Worrisome
• Strengthening characters: Cara Dune and Carson Teva, criticism of “The Siege”
• Peli Motto’s regard of Boba Fett
• Wasted Potential: Jack Black on Plazir 15
• Analyzing Mando’s fighting style — “The Prisoner”
• Analyzing Mando’s motivations: Criticism of “The Heiress”
Reblog with Character Analysis on Bo-Katan
• Analyzing Mando’s fighting style and motivations, Mando’s lack of agency as a character and being sidelined as a protagonist — Criticism of “The Heiress” and “The Rescue”
• Inconsistencies and weak world-building regarding where Mandalorians should live, Season 3
• Criticism of Bo-Katan being praised/focused on instead of Mando, Season 3
• Criticism of the writers’ usage of Bo-Katan’s character, end of Season 3
• Criticism of Mando settling down, end of Season 3
• Comparing and contrasting Din Djarin to Aragorn and Éomer of LotR
• Proposal for a different season 2 to fix some pacing and character development issues
• Director’s commentary for the writing process for Nightfall
• Character analysis concerning the topic of Mando’s “side quests”
• Character analysis: Mando and Ranzar Malk’s crew
• Character analysis: Mando’s choices regarding his relationships with others
• Revising Carson Teva’s character
• Criticism of Ahsoka Tano’s Character and “The Jedi” episode of Season 2
• Mandalorian culture regarding the Armorer and the forge
• Mand’alor the Reluctant (brief analysis of how Din as Mand’alor could have been set up)
• Minor change to “The Tragedy” to make Mando’s choices stronger (plus bonus wings AU thought)
Reblog with further criticism to pacing and Cara Dune’s scene
• “Jedi healer” snake-oil salesman
• “Strong Female Character”: Criticism of the show’s writing regarding Bo-Katan’s character and longterm TV show story planning
• Vizsla’s animosity towards Mando
• What word describes a parent who loses a child? (AU)
• General headcanon list for Din Djarin
• Mand’alor the Reluctant: A challenger for the sword
• Mand’alor the Reluctant: Getting rid of the sword (at least temporarily)
The Book of Boba Fett
• De-aged Boba Fett scenario
• The Marketability of Star Wars Merchandise: Production design and its ties to storytelling
• Kill Your Darlings: “The Gathering Storm”
• Grogu’s regard of Luke
• “Fountain of Aging” scenario spitballing a de-aged AU post-TBoBF)
• Criticism of Boba Fett parading Fennec Shand around out in public
• Criticism of TBoBF’s writing: Lack of character objectives and focus, too many side characters, and “surprise” antagonists with no prior buildup or introduction
• Criticism of Boba and Din’s fight scene: Bad character choices
• Mando and Boba Fett body swap idea
• What If… Jaina Solo and Boba Fett met sooner? (Legends mashup)
Original Trilogy
• Spitballing a Bail Organa lives AU
• Making Princess Leia’s character arc stronger
Prequel Trilogy
• Character Revision for Anakin Skywalker
• Further criticism and character revision for Anakin Skywalker
• Duel of Fates fight choreography criticism
Sequel Trilogy
• Criticism and revision of Han, Leia, Luke, and Ben Solo’s characters and Kylo Ren’s origin
Andor
• Racial disparity in who gets to live: Criticism of Andor with suggested changes
• Short character analysis: Davo Sculdun
• Luthen’s ruthlessness and Cassian’s potential response
The Acolyte
• Criticisms and Suggested Changes Part 1
• Osha’s vision of Mae
The Bad Batch
• S1E : Rampage criticism/idea pitch
• Who’d be the funniest person for the rest of the crew to find out has an ex-wife they’ve never mentioned? (Crack)
• Rebellion era Echo/Riyo Chuchi pitch
• Character analysis: Crosshair
• Character analysis: Crosshair pt 2
• Wrecker’s defense of Echo against Cid’s antagonism
Original Character Ideas
• Someone from Fennec’s past shows up on Tatooine
• Peli Motto’s ex-husband
• Koziol and Bobo: an informant and his enforcer
Silliness
• Kung Fu Panda parallels
Multi
• Five headcanons (Inc. Mando, Luke, Leia, Solo)
• Star Wars WWF AU
#Masterlist#navigation#my writing#The Mandalorian#The Bad Batch#Star Wars AU#Rogue One#The Book of Boba Fett#original trilogy#sequel trilogy#prequel trilogy#hounds speaks#Star Wars
4 notes
·
View notes
Text
Innovations In Tertiary Butylamine Production and Supply Chain Management
Tertiary Butylamine (TBA) is a versatile chemical compound used in various industrial applications, including pharmaceuticals, agrochemicals, and rubber processing. As the demand for TBA continues to rise, manufacturers and supply chain managers are constantly seeking innovative solutions to enhance production efficiency and optimize the supply chain.
What Is Tertiary Butylamine?
Tert Butylamine is an aliphatic amine with the molecular formula C4H11N. It is colorless, has an odour similar to amine or ammonia, and is easily miscible in water and other organic solvents. The main application of this chemical is in the production of accelerator compounds that enhance the vulcanization rate of rubber. Tertiary butylamine is also a major chemical intermediate used for the production of antihypertensive drugs used to treat high blood pressure and in the production of Terbutaline drugs used to treat bronchitis and asthma treatment.
Innovations In Tertiary Butylamine Production
Sustainable Production Processes
In recent years, the chemical industry has increasingly emphasized sustainable practices. TBA production has also witnessed significant advancements in this regard. Companies are adopting environmentally friendly production processes that minimize waste generation, reduce energy consumption, and utilize renewable resources. These sustainable practices not only help protect the environment but also contribute to cost savings and improved public perception.
Advanced Catalysts For Tba Synthesis
Catalysts play a crucial role in Tertiary butylamine synthesis, facilitating the conversion of raw materials into the desired product. Continuous research and development efforts have led to the discovery of highly efficient catalysts that enable faster reaction rates, higher yields, and improved selectivity. Novel catalysts not only enhance productivity but also reduce the environmental impact by minimizing the use of hazardous substances.
Enhanced Efficiency In Tba Manufacturing
Efficiency gains in TBA manufacturing are achieved through process optimization and technological advancements. By implementing innovative process engineering techniques, manufacturers can streamline production, reduce cycle times, and minimize resource wastage. This includes optimizing reaction conditions, improving purification techniques, and implementing automated control systems. The integration of advanced technologies, such as artificial intelligence and machine learning, further enhances process efficiency by enabling real-time monitoring, predictive maintenance, and data-driven decision-making.
Innovations In Supply Chain Management for Tertiary Butylamine
Global Distribution Networks
Tertiary butylamine is a globally traded chemical, necessitating a robust supply chain network to ensure timely delivery and meet market demand. Companies are expanding their distribution networks by establishing strategic partnerships, setting up regional warehouses, and leveraging transportation infrastructure. These global distribution networks enable efficient movement of TBA from production facilities to end-users across different geographical regions.
Transportation And Logistics Optimization
Efficient transportation and logistics play a crucial role in the smooth functioning of the TBA supply chain. Companies are implementing advanced logistics management systems to optimize route planning, reduce transit times, and minimize transportation costs. Integration of real-time tracking and monitoring technologies enhances visibility, allowing for better coordination and proactive problem-solving.
Inventory Management Strategies
Effective inventory management is essential for balancing supply and demand in the Tertiary butylamine industry. Companies employ sophisticated inventory management systems that utilize demand forecasting algorithms and historical data analysis to optimize inventory levels. This helps prevent stockouts and overstocking situations, reducing holding costs while ensuring timely availability of TBA for customers.
Analytical Testing Techniques
Ensuring the quality and purity of TBA throughout the supply chain is critical. Advanced analytical testing techniques, such as chromatography, spectroscopy, and mass spectrometry, are employed to accurately analyze and quantify the composition of TBA samples. These techniques enable comprehensive quality control, allowing manufacturers to maintain consistency in product specifications and comply with regulatory standards.
Compliance With Regulatory Standards
The Tertiary butylamine industry is subject to various regulatory requirements related to safety, health, and environmental protection. Companies adhere to stringent regulatory standards by implementing robust quality management systems, conducting regular audits, and engaging in continuous process improvement. Compliance not only ensures product integrity but also enhances customer trust and mitigates legal risks.
Ensuring Product Integrity
Product integrity is crucial in the TBA supply chain to prevent contamination and maintain the desired product quality. Companies implement strict quality assurance protocols, including adherence to Good Manufacturing Practices (GMP), to ensure that TBA is handled, stored, and transported in a controlled manner. This includes proper labeling, packaging, and appropriate storage conditions to prevent degradation or unwanted reactions.
Conclusion
Innovations in tertiary butylamine production and supply chain management have brought significant advancements to the industry. Sustainable production processes, advanced catalysts, and enhanced efficiency have contributed to improved productivity and reduced environmental impact. Supply chain management strategies, quality control measures, and technological advancements ensure the seamless flow of TBA from production to end-users. The industry is also embracing sustainability initiatives to minimize waste, integrate renewable energy, and reduce its carbon footprint. With a positive market outlook and ongoing technological innovations, the future of TBA production and supply chain management looks promising.
Visit Vinati Organics to know more about tertiary butylamine
0 notes
Text
"Weakness" - Heizou x Gn!Reader SMAU

shikanoin heizou social media au!
warnings; cursing, crime (depicts dark situations), toxic parents, mentions of murder, investigating murder, angst further down the line, alcohol/drugs, tba.
might have slow updates, multiple chapters in written form!
[Characters] [Spotify Playlist]
Summary; Shikanoin Heizou runs a popular crime and conspiracy analysis youtube channel. Y/N is taking college for a criminal psychology degree. What happens after Y/N is searching for their friends in the crowd of a new area that they just moved to, but when they run up to the person they expect to be their friend and wrap them in a tight hug… It happens to be Shikanoin Heizou himself?
(BROWN - POSTED, WHITE/BLACK - UPCOMING)
☆ ° • ☆ 1. Coincidence?
☆ ° • ☆ 2. TBA
☆ ° • ☆ 3. TBA
#genshin#genshin impact#genshin smau#genshin impact smau#heizou#shikanoin heizou#heizou shikanoin x reader#genshin heizou#heizou x gender neutral reader#heizou x reader#hoyoverse#genshin x reader#fluff#genshin fluff#college au#genshin college au
78 notes
·
View notes
Text
Storytelling
English 1100C Global Lit Professor Lee Ann Brown
Fabulosity: The Importance of Stories
“A writer is always reading and a reader is always writing.”
—Robert Scholes
“In a newsletter as early as 1977, when asked in an interview why people should pay attention to storytelling when issues of social justice, housing, schools, and health care were the “real” issues of the day, Morrison was unapologetic in her reply, doubling down in her steadfast belief that it’s not an either/or proposition. She argued that supporting and protecting the art of storytelling is as crucial to human progress as any other issue:
"…that’s where truth lies—in our myths, in our songs, that’s where the seeds are. It’s not possible to constantly hone in on the crisis. You have to have the love, and you have to have the magic, that’s also life, and I regard it even though it may sound as though I’m dealing in fantasy. I don’t think so; I find it all terribly realistic because I regard my responsibilities as a black writer as someone who must bear witness. Someone who must record the way it used to be. The way it ought to be, I leave to the sociologists. But I want to make sure that a little piece of the world that I knew...doesn’t get forgotten."—Mary Gannon / Toni Morrison, CLMP newsletter, November 21, 2019.
This is an assignment designed to practice combining research with critical and creative writing skills. It is a two parts which should inform each other: One part Critical and one part Creative. In working incredibly rich and varied world of myth, fairytale and folktale you will encounter many issues and threads of traditional and innovative intertextuality. Both sections of the assignment should be informed by independent research: Use at least 2 primary sources, 2 critical sources and one reference source, and include a works cited page. Please use in text MLA-style citation.
Research: Read through and take notes on material from the world of global myth, fairy tale, and folktale. Gather further source material that adds to your stockpile of ideas, images, characters and motifs for your own story. Gather visual as well as intextual materials. Anything that can help you recombine materials until you spark some ideas for stories of your own. Work with your sources and notes to gather a kind of “look book,” or fantastic map, cut-up or collage of this material in your journal.
ESSAY:
Instructions: Choose one of the prompts below (or develop a topic of your own) and write a well-developed essay with an introduction and conclusion, answering the questions posed in the prompt. Use specific examples from your primary texts, including page numbers for reference. Each paragraph of your paper should cover a single main idea. 1000-2000 words, double-spaced and typed in 12 point New Roman type.
Choose a word, name of a character, or place name from a myth that is full of layered or hidden meanings. Explore etymological meanings, recurrences in other stories in other cultures, or in some way “unpack” the significance of that one term or name. Write an essay analyzing the significance of the word, phrase, name or saying to the work as a whole. Also add in commentary on how you are using these new insights in your own creative piece.
Focus on a single contemporary poem that uses elements from traditional fairytales, folklore or mythology and do a close reading of the work. Try searching keywords in websites such as the Academy of American Poets https://www.poets.org/ and The Poetry foundation https://www.poetryfoundation.org/
Add in commentary on how you are using these new insights in your own creative piece.
Select a fairytale, folktale or myth from any global culture that features a character whose origins are unusual, mysterious or intrigue you for some reason. Then write an essay in which you analyze how these origins shape the character and that character’s relationships, and how the origins contribute to the meaning of the work as a whole. Also add in commentary on how you are using these new insights in your own creative piece.
Many myths contain a character who intentionally deceives other. The character’s dishonesty may be intended either to help or to hurt. Such a character, for example, may choose to mislead others for personal safety, to spare someone’s feeling, or to carry out a crime. Choose a fairy, folktale, ballad or myth in which a character deceives others. Then, in a well-written essay, analyse the motives for that character’s deception and discuss how the deception contributes to the meaning of the work as a whole and how you are using parallel practices in your own creative piece.
It has often been said that what we value can be determined only by what we sacrifice. Consider how this statement applies to a character from a fairytale, folktale or myth. Select a character that has deliberately sacrificed, surrendered, or forfeited something in a way that highlights that character’s values. Then write a well-organized essay in which you analyze how the particular sacrifice illuminates the character’s values and provides a deeper understanding of the meaning of the work as a whole. Also add in commentary on how you are using these new insights in your own creative piece.
In literary works, such as fairytales, folktales, ballads or myths, cruelty often functions as a crucial motivation or a major social or political factor. Select a fairytale, folktale, ballad or myth in which acts of cruelty are important to the theme. Then wel a well-developed essay analyzing how cruelty functions in the work as a whole and what the cruelty reveals about the perpetrator and/or victim. Also add in commentary on how you are using these new insights in your own creative piece.
CREATIVE WRITING:
Write a short narrative by transforming, borrowing or subverting elements of the fairytale, folktale, ballad or world myth you wrote about in your paper. Look to Angela Carter’s rewrites of classic fairy tales for clues on how to do it your own way. You may want to combine characters, plot, themes, talismanic objects etc from two or more sources, then let your imagination go from there. 1000-2000 words
EXTRA CREDIT:
Transform / Translate your narrative (or part of it) into another narrative genre, or art form such as Comic Strip, Graphic Novel (see MAUS, PERSEPOLIS), Ballad (see CHILD BALLADS or those collected by CECIL SHARP and MAUD KARPELES), Dialogue Poem (see Frank O’HARA’s True Account of Talking to the Sun in Fire Island), Video, Screenplay, Poets Play (see work by KEVIN KILLIAN and others), Song, Painting, Collage (see JOSEPH CORNELL), Map (see Bruce Chatwin’s SONGLINES) etc. . .
Include a Works Cited Page at the end of your Essay:
Use at least 2 primary literary sources
At least 2 secondary (critical articles or journalism)
And at least 1 reference source
Relevant Readings:
Carter, Angela. The Bloody Chamber. (On Reserve)
Introduction to Angela Carter’s The Bloody Chamber by Marina Warner.
The Bloody Chamber”
“The Company of Wolves”
“Wolf Alice” etc
Handout of and literary rewrites and analysis of Red Riding Hood, including
Bruno Bettleheim, works by Olga Broumas, Roald Dahl and others.
Anthology of World Myth edited by Angela Carter (Reserves)
Textbook hand-out on writing short stories
Phillip Pullman essays on Writing Fairytales
Philip Pullman: recent interview in the New York Times and the New Yorker
Brewer’s Dictionary of Phrase and Fable (in Reference section of Library)
SCHEDULE
Friday, NOVEMBER 22, 2019: Bring in topic ideas (In class Writing)
Tuesday, NOVEMBER 26th, 2019 Independent work in Library writing and research
Friday, NOVEMBER 29th, 2019: Thanksgiving Break
Tuesday, DECEMBER 3rd, 2019: Bring in 1st Drafts of both pieces (In-class Workshop)
Friday, DECEMBER 6th, 2019: TBA - Please bring in 3 pages of best work from semester for class magazine with your name, email and class
Tuesday, DECEMBER 10th, 2019: TBA
Final Reading during Exam Period: TBA
First drafts due: December 3rd in class
Final Draft Due: In Final Portfolio
Final PORTFOLIO:
-Revised and expanded Letter to the Reader Please include a paragraph or two on how you worked together as a group, what your role was and what you observed about writing in collaboration
-Revision of first half of semester writing
-Collaborative“Poet’s” Tree Play
-Storytelling Project: Critical Essay and Creative Writing
2 notes
·
View notes
Text
Economics, Political Science, Public Administration, Business
ECONOMICS The programme functions as economics being self-sustainable. Ability is more important than being a con artist with curves/lines and synthetic problems. Yes, you do have options. Ambiance, the world, knowledge, skills and accountability. Economics curriculum: --Communication --> Scientific Writing I & II --Mandatory Courses --> Enterprise Data Analysis I & II (check GFIN); International Financial Statement Analysis I & II (check FIN); Corporate Finance (check FIN); Calculus for Business & Economics I-III; Probability & Statistics B; Mathematical Statistics --Core Courses --> Microeconomics I-II; Introduction to Macroeconomics; Intermediate Macroeconomics; Money & Banking; Macroeconomic Accounting Statistics; Economics of Regulation; Econometrics; Economic Time Series; Public Finance; Sustainability Measures; Empirical International Trade --Mandatory Instruments & Investment Courses --> Theory of Interest for Finance (check COMPUT FIN); Investment & Portfolios in Corporate Finance (check FIN). There are concentration track options for Economics majors. A choice is mandatory. Must choose one of the following tracks --- --MICROECONOMICS-FINANCE OPTION TRACK --> Microeconomics III; Industrial Organisation; Computational Studies of Mergers & Acquisitions; Corporate Valuation (check FIN); International Commerce (check FIN); Strategic Business Analysis and Modelling (check FIN) --OTHER MICROECONOMICS OPTION TRACKS --> Microeconomics III; Industrial Organisation; Computational Studies of Mergers & Acquisitions plus 3 additional courses out of the following: Computational Labour Economics Agricultural & Economic Sustainability Strategic Business Analysis and Modelling (check FIN) R Analysis (check Actuarial post) Personal Finance (check Actuarial post) Political Economy (check PS) Programme Evaluation I & II (check PA) < Both courses mandatory > Note: for Programme Evaluation I & II, economics majors will require Mathematical Statistics or Econometrics course as substitute for Quantitative Analysis in Political Studies I; also must complete Enterprise Data Analysis I & II; Upper Level Standing. --MACROECONOMICS OPTION TRACK --> Advanced Macroeconomics; International Macroeconomics; Fiscal Administration (check PA); Monetary Theory & Policy; Research Methods in Monetary Policy; Regional Economics NOTE: for Probability & Statistics B, Mathematical Statistics, students should check the actuarial post. Further description of some courses below: Microeconomics I Comprehension of basic modelling and economic interpretation with demand and supply, and to learn major microeconomic concepts, including utility, scarcity, elasticity, efficiency, output and costs, and externalities. By analysing markets and studying the decision-making process by consumers and producers, students will be able to comprehend and differentiate the market types—perfect competition, monopoly, monopolistic completion and oligopoly. Typical Text: TBA Mathematical tone --> You are expected to have at least concurrent registration and perpetual progression with Calculus II until term’s end. Labs --> Developing concepts and models in R from interpreted statements and data can be a strong indicator of a student’s capability, competence and seriousness about economics with professionalism. I can’t just assume such special development to be properly treated in the Calculus I-III sequence because calculus is the priority in such courses (and whatever ideologies or tribal structure or rent seeking for relevance). Hence, students will get their hands dirty with some basic computational modelling, coding and visualization development of some economic concepts and models in R. Students must draw conclusions based on their findings for all such topics. A. Calculus with R run-through --Geometry: plots, values at points, zeros, intersects, tangents, curve fitting --Differentiation: average rate of change, instantaneous rates of change, derivative values, critical points, relative extrema, concavity, absolute extrema --Integration: antiderivatives, area, economics applications, etc., etc. B. Elementary economics data analysis --Immersion with databases Basics of acquiring data sets from various sources Kaggle, Amazon AWS, USDA, agricultural marketing resource centres, FDA, Census, Bureau of Labor Statistics, NBER, FED, other gov’t databases, UNCTADstat, UN FAO, OECD, Capital Markets, etc., etc., etc. Quandl R package Data Assimilation/Cleaning/Manipulation basics Comprehension of measures of central tendency, variance, standard deviation. Generating summary statistics and interpretation The R packages, Stats and Tidyverse Statistical plotting (scatter plots, box plots, histograms, Q-Q) Single and matrix plots Correlation (types) Computation R packages (correlation, GGally, DataExplorer, ggplot2) Correlation matrices and heat maps with specifying type of correlation. Densities and Scatter plots. Regression models (bivariate and multivariate) along with summary statistics interpretation and forecasting Just follow the logistics and implement Data structure for time series. Salient characteristics identification and exhibition; models with summary statistics interpretation. Forecasting. C. Of the following text concern will be chapters 1-5: Dayal V. (2015). An Introduction to R for Quantitative Economics, SpringerBriefs in Economics. Springer It’s also possible to generate all such with naturally installed R packages, to compare and contrast with prior D. Ideal con Kool-Aid problem sets are not good enough. Sustainability goals: based on development from (A) through (C), students will apply real data sets with methods for determination of microeconomic models or characteristics. It’s important to have understanding of data structure and skills in data manipulation towards developing market models, and demand & supply models. You can draw a figure with lines that intersect or with paralel lines, so what? If you can’t develop things from the raw or primitively then you don’t understand it. Concerns the following areas: agricultural, commodities, service industry, retail industry, utilities, technology, etc., etc. For any R coding expected will be commentary among coding and to have axes labelling. Students will also be given statements to verify or debunk based on analyis of data.. Necessary topics of concern for development with use of R and RStudio: -Phases for Data Data Modelling (developed with real raw data) Note: data assimilation and manipulation will apply to succeeding topics Data Assimilation and Manipulation Supply and Demand curves (via regression); calculate changes in consumer surplus (taxation, subsidies, policies) as prices shift (if able). Elasticities: Price Elasticity of Demand: OLS versus log-log Cross Price Elasticity of Demand: multivariate, log Identifying complements and/or substitutes Price Elasticity of Supply: log-log Income Elasticity of Demand: log-log and Engle curve estimation Market models (prior lab topics will re-emerge): Pure Competition Pure Monopoly Monopolistic Competition Oligopoly Compare findings from prior market models activity to development from OECD literature and the Pindyck literature: OECD literature - Methodologies to Measure Market Competition Data Screening Tools in Competition Investigations Pindyck, R. S. (1985).The Journal of Law & Economics, 28(1), 193–222 Forecasting Market Trends (time series analysis, basic forecasting models and validation) Consumer Surplus and Producer Surplus (graphing surplus areas with integrating manually and with R; policy impact analysis concerning taxes or subsidies; plotting new curves and recalculating surplus after a policy change; validate or debunk statements based on raw data) Quizzes --> Complete your assignments, so you don’t have to worry about what you will encounter on quizzes. Don’t expect all questions to be multiple choice. Exams --> Students will have to pick a date and time convenient for them to take the final exam on or before the due date. The final exam will be a reflection of covered course material, assignments, quizzes and labs to evaluate students’ understanding of key concepts. Will have R usage as well. Open notes for R. Grading --> Status Quo Assignments 15% Labs 25% Quizzes 20% Final 40% Course Outline --> Week 1 -- Introduction. What is Economics? The Economic problem Week 2 -- Demand and Supply Week 3 -- Demand and Supply Demand and Supply, Elasticity Assignment 1 Due and Quiz 1 Week 4 -- Elasticity Week 5 -- Efficiency and Equity Week 6 -- Utility and Demand Week 7 -- Possibilities, Preferences, and Choices Assignment 2 Due and Quiz 2 Week 8 -- Reviewing Loose ends Week 9 -- Output and Costs Week 10 -- Perfect Competition Week 11 -- Monopoly Week 12 -- Monopoly Monopolistic Competition Assignment 3 Due and Quiz 3 Week 13 -- Oligopoly Oligopolistic Competition Week 14 -- Public Choices and Public Goods Week 15 -- Externalities and Environment Assignment 4 Due and Quiz 4 Week 16 -- Introduction to factors of Production, Economic Inequality Final Exam Prerequisites: Calculus I
Microeconomics II Most of the topics will include theoretical derivations as well as real life applications. Fundamental Comprehension --> Ability to use microeconomic terminology Highest-valued alternative foregone is the opportunity cost of what is chosen How individuals and firms make themselves as well off as possible in a world of scarcity How prices inform the decisions about which goods and services to produce, how to produce them, and who gets them How government policies affect the allocation of resources in a market economy How market structure influences the allocation of resources Applications --> Microeconomic principles and diagrams to understand and explain economic events and other social phenomena Calculus to solve optimization problems Use economic reasoning to explain the strategic choices of individuals or organizations Critique the economic content of articles or presentations Appreciate the usefulness of economic reasoning in personal decision making Typical Text --> Intermediate Microeconomics, by Hal Varian Accompanying Texts --> Intermediate Microeconomics with Calculus, Hal Varian Microeconomics, Jeffrey Perloff Problem Sets --> Will have the same tone and manner as in prerequisite, but at a more advanced and accelerated level based on course texts Labs (15 weeks) --> ---Generally, will have advanced repetition of (A) to (D) lab activities done in prerequisite (more intensified and much faster relevant to course topics). ---Based on prerequisites, thus leading to the assumption that students are capable with series expansions and basic ODEs, will begin converting some ODEs into difference equations in R. Package dde can accompany analytical modelling; else, and most likely coding manually for the long haul. The following gives an idea of what’s to be expected as a beginner: Dayal, V. (2020). Difference Equations. In: Quantitative Economics with R, Springer, Singapore. Fulford, G., Forrester, P., & Jones, A. (1997). Linear Difference Equations in Finance and Economics. In: Modelling with Differential and Difference Equations (Australian Mathematical Society Lecture Series, pp. 126-145), Cambridge: Cambridge University Press https://mjo.osborne.economics.utoronto.ca/index.php/tutorial/index/1/fod/t The following topics will be treated w.r.t. difference equations (uses, limitations, conditions and simulation development): a. Inventory based on prior period’s level b. Capital Accumulation; Adjustment Cost Models c. Logistic growth model and predator-prey models d. Dynamics of Market Price (linear and nonlinear entities) A market equilibrium model with price dynamics; dynamic stability and ensuring such Determining Dynamic Market Equilibrium Price Function Using Second Order Linear Differential Equations (applying difference equation rather) Todorova, T. (2012). The Economic Dynamics of Inflation and Unemployment. Theoretical Economics Letters. Vol.2 No.2, Paper ID 19278 d. Exchange rate overshooting model by Dornbusch (and alternatives) e. Solow Growth model ---Externalities field cases Note: will focus on financial quantitative development towards retention and sustainability, NOT conceptual curves. Cost-Benefit Analysis (NPV and/or IRR based) Overview Benefits (monetised and non-monetised impacts) Costs (monetised and non-monetised impacts) Benefits and Cost estimation guides/manuals (monetised and non-monetised impacts) Social discount rate methodology, OR rate of return determination Logistics and active implementation of CBA Externalities Positive Negative Adhikari, S.R. (2016). Methods of Measuring Externalities. In: Economics of Urban Externalities. SpringerBriefs in Economics. Springer, Singapore Quizzes --> We will have 4-5 quizzes. Quizzes will have limited typical questions from prerequisites mixed in with this course level problems. At the end of the term, we will drop your lowest grade and take the remaining into account. Don’t expect all questions to be multiple choice. Exams --> It will focus on the material covered in class, but in a manner not requiring you to cram with the latest instruction. Will have R usage. Open notes for R. Don’t expect all questions to be multiple choice. Course Pace --> Generally it will take 10 weeks to complete course, however, an additional 3 – 5 weeks can be applied concerning reinforcement and competency Grade --> Status Quo Problem Sets (10%) Labs (25%) Quizzes (20%) Midterm (20%) Final (25%) Course Outline --> WEEK 1 -- Chapter 1: The Market Chapter 2: Budget Constraint Chapter 3: Preferences WEEK 2 -- Chapter 4: Utility Chapter 5: Choice Quiz 1 WEEK 3 -- Chapter 6: Demand WEEK 4 -- Chapter 32: Exchange Quiz 2 WEEK 5 -- Chapter 19: Technology Chapter 20: Profit Maximization Quiz 3 WEEK 6 -- Midterm Exam Chapter 21: Cost Minimization WEEK 7 -- Chapter 22: Cost Curves Chapter 23: Firm Supply WEEK 8 -- Chapter 24: Industry Supply Chapter 25: Monopoly Chapter 26: Monopoly Behaviour Quiz 4 WEEK 9 -- Chapter 28: Oligopoly Quiz 5 WEEK 10 -- Chapter 29: Game Theory Chapter 14: Game Applications Quiz 6 Prerequisites: Calculus II; Microeconomics I Microeconomics III Course has a “duality” approach, namely, lectures make the “fundamentalist” and “snobbish” gauntlet; labs give traction and will be your “money maker” in the future. Theory and substance aren’t necessarily cut from the same cloth. Homework Problem Sets --> Students will have a week to complete the problem sets. R Labs --> NOTE: some things you will learn on the fly; you can’t expect everything to fall perfectly in place. A. Advance fast immersion into real world pricing of commodities and sustenance Joutz, F. L. et al (2000). Retail Food Price Forecasting at ERS: The Process, Methodology, and Performance from 1984 to 1997. Economics Research Service, USDA. Technical Bulletin No. 1885 For such above literature, after analysis then computational logistics, towards replication/implementation(s). Will then advance to other markets with inclusion of other commodities incorporating more modern data: Wheat, Rice, Sugar, Corn, Soybean, Cocoa, Coffee Includes equilibrium determination, utility, elasticity, etc. B. Hedonic modelling and estimation Experience from prerequisites labs means you’re good enough to hang in there with multivariate regression development. Various applications. C. Identification and validation of utility/production functions: Basic utility and production functions (must include Cobbs-Douglas, CES). The following text may not treat all types of interests but our intention is to have transparency and practicality concerning the following areas: bundles, general markets, production, efficiency, labour economics, etc. Coto-Millán, P. (2003). Utility and Production: Theory and Applications. Springer Physica, Heidelberg Calibrating Cobb-Douglas and CES (utility and production) Overview, logistics and code development Difference between calibrating & estimating for Cobb-Douglas and CES? Can the following be implemented in a computational environment such as R? Afriat, S. N. (1967). The Construction of Utility Functions from Expenditure Data. International Economic Review, 8(1), 67–77 Note: data sources and data subject to change. Pursue for various industries for different environments (regions or countries). Compare to method of determining optimal production based on marginal cost (with calculus, etc.). Try to extend from Cobbs-Douglas to CES function and compare to marginal cost approach. Biddle, J.E. (2011). The Introduction of the Cobb-Douglas Regression and its Adoption by Agricultural Economists. History of Political Economy, 43, pages 235-257. Note: try to extend all prior from Cobbs-Douglas to the CES function Introduction R microeconomic tools (limited exposure) micEcon, micEconAids, micEconCES, micEconSNQP D. Data Envelopment Analysis (firms, markets, industries, agriculture) Concept, modelling and analysis with field applications R Packages of Interest for DEA rDEA, deaR, Benchmarking Special case treatment after other interests: Agriculture DEA method to measure corporate performance Industries performance (banks, insurances, telecommunications, service, etc., etc.) Stock performance and stock selection Sengupta, J., Sahoo, B. (2006). Cost Efficiency in Models of Data Envelopment Analysis. In: Efficiency Models in Data Envelopment Analysis, Palgrave Macmillan, London. E. Stochastic Frontier Analysis (firms, markets, industries, agriculture) Modelling and analysis with field applications R Packages of Interest for SFA frontier, npsf, sfa, ssfa, semsfa, Benchmarking Will try to have counterpart applications development to DEA (hopefully data is robust) Advantages and disadvantages between DEA and SFA. PURSUIT: can Cobb-Douglas and CES functions be applied to SFA and DEA? F. Statistical Tools & Analysis for Partial Equilibrium and Markets Data Assimilation and Cleaning/Manipulation Descriptive statistics. Skew and kurtosis. Correlation measure (Pearson, Spearman and Kendall). Correlation heatmaps for three or more variables. Scatter plots and densities (ggplot2, GGpairs) Econometric development of supply and demand analysis; calculate changes in consumer surplus (taxation, subsidies, policies) as prices shift (if able). Elasticity types (restricted to OLS, log, log-log, Engle curve and instrumental variables technique); then cross-price elasticity to identify complements or substitutes. Duopoly Econometric Estimation in Cournot Markets (structural estimation and instrumental variables); Cournot Extension. Econometric Estimation in Bertrand Markets; Bertrand Extension Times series methods for comparative assessments. Note: may require standardization for different units of measure Speculation on behaviours and tools for verification: seasonality, trend cyclic, stationarity, cross-correlation, cointegration. G. Overlapping Generations Model and Microeconomic Aspects Based on prerequisites, thus leading to the assumption that students are capable with DEs and difference equations. OLG concept and structure Key Microeconomic elements (household elements, production side elements, gov’t policy, intergenerational transfers elements, market structure & imperfections elements). Calibrations, estimations, scenarios, etc. H. General Equilibrium Models Based on prerequisites, thus leading to the assumption that students are capable with DEs and difference equations. PART 1 - will begin pursuing contemporary general equilibrium models; idea, constituents and their properties in unification. PART 2 - DSGE Modelling and Simulation Role of production and utility functions Components Junior, C. J. C. and Garcia-Cintado, A. C. (2018). Teaching DSGE Models to Undergraduates. Economica A 19, 424 – 444 How capable or practical will the R package dde be? Logistics Investigation. To make use of DYNARE + OccBin Toolkit after prior Use of DynareR as well Estimations and scenarios Harrison, G.W. et al (2000). Using Dynamic General Equilibrium Models for Policy Analysis. Elsevier PART 3. CGE Modelling and Simulation (with GAMS): Role of production and utility functions Components Literature to develop on: Devarajan, S. and Go, D. S. (1998). The Simplest Dynamic General Equilibrium Model of an Open Economy. Journal of Policy Modelling 20(6): pages 677 – 714 Zhang, X. (2013). A Simple Structure for CGE models. GTAP Purdue Texts provide guidance for programming and simulation: Hosoe, N., Gasawa, K., & Hashimoto, H. (2010). Textbook of Computable General Equilibrium Modeling: Programming and Simulations, Palgrave Macmillan Limited. Chang, G. H. (2022). Theory and Programming of Computable General Equilibrium (CGE) Models: A Textbook for Beginners. World Scientific. After analysis and computational skills development will develop for concerns of interest Dixon, P. B. and Jorgenson, D. W. (2013). Handbook of Computable General Equilibrium Modelling SET, Volumes 1A and 1B. Elsevier I. Advance development of Externalities field cases lab from prerequisite course. Exams --> There will be two midterm exams and a cumulative final exam. Limited amounts of notes for use. I encourage students to use a calculator and a ruler in the exams. All exams will include R usage. Prerequisite course labs will also be thrown at you. Course Grade Constitution --> Homework 20% R Labs 35% 2 Midterm exams (15% each) Final exam (15%) Resonating Texts --> Varian H., Microeconomic Analysis, New York and London, Norton Mas-Colell A., Whinston M. D., & Green J. R., Microeconomic Theory, Oxford Kreps D., 1990, A Course in Microeconomic Theory, Princeton Course Outline --> Modelling and Forecasting in Microeconomics (to be precursor to labs A to B) Preferences and Utility Utility Maximization and Choice Income and Substitution Effects Demand Relationship Among Goods Production Functions Cost Functions Profit Maximization Markets Monopolistic Oligopolistic (include Cournot and Bertrand Competition) Competitive Markets Imperfect Competition OECD literature - Active Immersion wit R Methods to Measure Market Competition Data Screening Tools in Competition Investigations Overlapping Generations Model and Microeconomic Aspects To be precursor to lab G General Equilibrium and Welfare To be precursor to lab H Asymmetric Information Wolak, F. A. (1994). An Econometric Analysis of the Asymmetric Information, Regulator-Utility Interaction. Annales Deconomie et de Statistique - No 34 Externalities and Public Goods To be precursor to lab I Prerequisites: Calculus III; Microeconomics II.
Introduction to Macroeconomics Course prerequisite is a bit more advance than the norm. However, the goal of this course is to capture substance with meaningful quantitative and computational skills. Yes, you are here to acquire long term value, not just drawing intersecting lines and calling it macroeconomics. Note: I will not ask you to remember every equation on the fly. Mathematical tone --> You are expected to have at least concurrent registration and perpetual progression with Calculus II until term’s end. Labs and Assignments --> For each assignment set you will be advised on what pace you must keep up with, assuming strong comprehension and growing competence. As well, some questions will not be multiple choice. Have the maturity to review what you are uncertain about; ask questions. I can’t just assume such special development to be properly treated in the Calculus for Business and Economics I-III course sequence because calculus is the priority in such courses (and whatever ideologies or tribal motives). Hence, class will get their hands dirty with some basic maths and visualization of some economic concepts and models with R. Will get an early introduction the package R packages Tidyverse, Tidymodels, Quandl, data files and data from Kaggle, Fed, IMF, OECD, Bureau of stats, etc., etc. Labs will be based on the following areas: Quizzes --> We will have 5 quizzes. They will take no more than 30 minutes, and will be held at the beginning of class on chosen dates. At the end of the quarter, we will drop your lowest grade and take the remaining 5 into account. Don’t expect all questions to be multiple choice. Labs --> A. Elementary economics data analysis --Immersion with databases Basics of acquiring data sets from various sources Kaggle, Amazon AWS, USDA, agricultural marketing resource centres, FDA, Census, Bureau of Labour Statistics, FED, NBER, other gov’t databases, UNCTADstat, UN FAO, OECD, Capital Markets, etc., etc., etc. Quandl R package Data Cleaning/Manipulation basics Comprehension of measures of central tendency, variance, standard deviation. Generating summary statistics and interpretation The R packages, Stats, Tidyverse Statistical plotting (scatter plots, box plots, histograms, Q-Q). Regression with summary statistics interpretation and forecasting R packages (correlation, GGally, DataExplorer, ggplot2) Correlation matrices and heat maps with specifying type of correlation. Densities and Scatter plots. Data structure for time series. Salient characteristics identification, primitive models with summary statistics interpretation. Forecasting B. Of the following text concern will be chapters 1-5: Dayal V. (2015). An Introduction to R for Quantitative Economics, SpringerBriefs in Economics. Springer It’s also possible to generate all such with naturally installed R packages, to compare and contrast with prior C. Scott. W. Hegerty: https://github.com/hegerty/ECON343/ D. Time Series analysis: summary statistics; salient characteristics tools in R; recognising volatility and shocks; Consumption Investment Gov’t Expenditure Inflation Employment Nominal GDP versus real GDP Exports as share of GDP Debt to GDP Currency pairs Comparing different assets (having different units) via standardization (auto-correlation and co-integration) Forecasting with time series (no standardization) E. Estimation (open or closed economy) Estimation of Consumption Function Model (and forecasting) Estimation of Investment Function Model (and forecasting) Modelling and forecasting expenditure F. Short Run Closed Economy Models: 1. Review of elementary macroeconomic models: Algebraic development for IS curve and LM curve towards IS-LM. Followed by numerics concerning economic scenarios. Algebraic development for AD and AS towards AD-AS. Followed by numerics concerning economic scenarios. Algebraic development for AD and IA towards AD-IA. Followed by numerics concerning economic scenarios. 2. R development for macroeconomic models We Think Therefore We R. (2012). Revisiting Basic Macroeconomics: Illustrations with R. R Bloggers Will reinforce more development with IS-LM towards economic fluctuations and policy. Followed by R development for AD, IA, then R development for AD-IA concerning economic fluctuations and policy, and then R development for AD-AS concerning market influences and policy. G. Causes of Growth of Public Expenditures For the identified causes pursue exploratory data analysis and empirical analysis for verification. H. Short Run Open Economy Mundell-Fleming Algebraic development. Followed by numerics concerning economic scenarios. Extend F2 with Mundell-Fleming I. Dayal V. (2015). The Solow Growth Model. In: An Introduction to R for Quantitative Economics. SpringerBriefs in Economics. Springer Additional pursuits: Making Solow Growth model meaningful with data. Extensions of Solow and making meaningful to data. Quizzes --> Complete your assignments, so you don’t have to worry about what you will encounter on quizzes. Don’t expect all questions to be multiple choice. Poor performances on quizzes and track record with assignments can be taken as a strong argument against you. Exams --> Administered in a manner not requiring you to cram with the latest instruction. Don’t expect all questions to be multiple choice. The final exam will be a reflection of covered course material, assignments, quizzes and labs to evaluate students’ understanding of key concepts. Will have R usage as well. Grade --> Assignments (15%) Quizzes (10%) Labs (30%) 3 Exams (45%) Course Outline --> This course introduces the key macroeconomic variables and explain how they are defined and measured to interpret macroeconomic data properly. Course discusses how macroeconomic variables influence market agents at various levels and public activities. Establishing a foundation for the analysis of the mechanisms that drive macroeconomic variables. Identify the various sectors of the economy in function, and possible interdependencies driven by different processes or pursuits, towards a holistic view. You will be able to systematically assess the national and international economic environment. Note: a module doesn’t necessarily imply 1 week, namely, some modules wil be completed faster than others. STRUCTURING MACROECONOMICS (Module 1-6) -- -Module 1: Supply & Demand. Elasticity -Module 2: National Income Accounting: Concepts & Definitions for a Closed Economy Closed Economy definition Stock/Flow Distinction What Counts as Output Concepts: Market value; Final goods and services; Within a period of time; Factors of production located within that country Why Income Equals Output What Happens to Income Taxes, Consumption, Saving Who buys Goods Consumption, Government Purchases, Investment (Business Fixed Investment, Inventory Investment, Residential Fixed Investment) -Module 3: Putting the Categories Together Simple Economy: all income is spent on goods and services The Simple Economy plus Government The Simple Economy plus Government and Investment The Basic Closed Economy Framework; Fiscal Surpluses and Deficits -Module 4: The Income-Expenditure Model Macroeconomic Equilibrium Aggregate Supply and Aggregate Demand The Consumption Function Aggregate Expenditure and Equilibrium (with numerical examples and changes) Perspective: Does the IE model acknowledge inflation? -Module 5: Economic Activity Consumption function and the saving function; compare current income hypothesis with the permanent income hypothesis; predict the effect that temporary versus permanent changes in income will have on consumption; factors that can cause the consumption function to shift. Concerns Determining gov’t spending and reasons for such Determining the aggregate level of desired consumption Nominal interest rate and real interest rate Economic scenarios involving prior elements in economic activity. Practice problems -Module 6: Key Macroeconomic Indicators and Their Measurement Meaning of macroeconomic indicators like GDP (Nominal GDP, Real GDP, GDP deflator, base year), the unemployment rate, and inflation. How are they measured? How should the figures for such variables be interpreted? SHORT-RUN CLOSED ECONOMY (Module 7-9) -- -Module 7: Elementary Shift Models Keynesian model versus Classical Models Investment Saving (IS) and Liquidity Preference Money Supply (LM) IS and LM derivations, solutions and numerics IS-LM (algebraic, numerical, geometric) Analysing various economic activity scenarios (including the presence of inflation) Aggregate Supply (AS) and Aggregate Demand (AD) AD and AS derivations, solutions and numerics AD-AS (algebraic, numerical, geometric) Analysing various economic activity scenarios (including the presence of inflation) Modeling or investigating price level & output relationship -Module 8: Modelling and Measuring Inflation Review of measurement of economy’s production of goods and services What causes Inflation? Retail Price Index (RPI). Consumer Price Index (RPI). Inflation measurement with CPI and RPI. Naive forecast and regression forecast (to be implemented) Economic Fluctuations: AD-IA (algebraic, solutions, numerical, geometrical) Analysing various economic activity scenarios -Module 9: Monetary Policy and Fiscal Policy Fiscal: concerns, automatic stabilizers, systematic framework, liquidity traps, respective tools and guidance concerning state of economy. Monetary: concerns, systematic framework, policies, respective tools and guidance concerning state of economy. Use of AD-AS and AD-IA for analysing monetary and fiscal treatment; fluctuations, shocks, policies and rules; most rules are dynamic so conceptual idea of structure to be synthesized in an algebraic and numerical treatment with AD-AS and AD-IA. LONG-RUN CLOSED ECONOMY -- -Module 10: Long Run Economic Growth in Closed Economy Solow Growth Model (with and without government) Long-term economic analysis Extensions of Solow (counterpart to prior) OPEN ECONOMY -- -Module 10: Open Economy (extending modules 2-3 development) From Closed to Open Imports and Exports Foreign Savings and Foreign Investment The Rest of the World and Balance of Payments -Module 11: Assembling the Picture Trade Deficit: Structure and Formulas Trade Surplus: Structure and Formulas Algebra: Definitions and Fundamental Balances -Module 12: The Open-Economy Income-Expenditure Model Numerical Case Studies Algebra for Equilibrium and the Multiplier More Numerics with Equilibrium -Module 13: Money Market How do central banks influence the money market and the interest rate? What factors drive the supply and demand for money? SHORT RUN OPEN ECONOMY -- -Module 14: Nominal exchange rate, interest rate, and output Reasons for foreign exchange Forces on the currency exchange rate Asset-backed currency vs. Fiat currency: pros and cons Why does the foreign exchange market function as OTC? Spot Rate and Forward Exchange Rate How do the spot and forward exchange rates interact with the expected rates of future dates? Nominal Exchange Rate and Real Exchange Rate How do central banks influence the exchange rate? Modelling and dynamics pursuits: The interest rate determines the cost of capital, the opportunity cost of using money, and the exchange rate. Mundell-Fleming model (MFM) < en.wikipedia.org/wiki/Mundell–Fleming model > Can the MFM elaborate strongly on the following questions? How does the exchange rate interact with domestic and foreign prices to determine the competitiveness of an economy’s producers? How does the exchange rate affect the trade balance and foreign payments of an economy? Polices and rules via the MFM (algebraic and numeric) LONG RUN OPEN ECONOMY -- Module 15: Modelling Daniel, B. C. (1977). Inflation and Unemployment in Open Economies. International Finance Discussion Papers. No.114. Federal Reserve Open Economy Solow Model and Extensions Can the same conclusions be drawn from both Solow type models and the development of Daniel (1977)? Prerequisites: Calculus I Money & Banking Tools --> Sovereign ambiance analogy to the following < https://www.fdic.gov/bank/ > R Packages: FinCal, jrvFinance, tvm, YieldCurve, BondValuation Note: use of such R packages must succeed analytical development Problem sets --> Problem sets will be distributed for each topic and will be discussed in class the following week. These are not assessed, but will serve their purpose. Assessment --> 5 – 6 Quizzes 30% Lowest to be drop and average taken of the rest to serve Research Lab Activities (in groups) 20% Midterm 25% Noncumulative final examination 25% Labs --> Note: a lab can be multiple days. LAB1: Financial analysis of financial institutions Will make use of financial statements from SEC filings or SEC Edgar. Will be assigned various banks in groups to develop analysis; crash immersion for assessing capital adequacy, reserves, credit, liquidity, etc. Observation and analysis based on: https://www.fdic.gov/bank/ LAB2: Interest models and properties Time Value of Money, present value, net present value, future value Nominal interest rate, real interest rate Structure: principal with and without coupon Discrete and continuous compounding Pricing/valuation of bonds Internal Rate of Return, MIRR Accrued Interest, Effective Interest rate Duration types & Immunization types Interpolate a yield curve by (polynomial) regression analysis (bond market direction and speculation on where the economy might be going). LAB3: IPOs. Dividend Discount Models, DCF, and comparables. Developing regression models for stocks; beta and VaR for stocks; basic time series analysis for stocks. CAPM and multi-factor models for asset expectations and risk premiums (case for both bonds and stocks). LAB 4: Yield Curve Economic indicator Expectations of market participants about future changes in interest rates and their assessment of monetary policy conditions. Nelson-Siegel-Svensson model compared polynomial regression LAB5: Inflation and Predicting Inflation Consumer Price Index: Comprehension of structure Building baskets with specified assets and computation Personal Consumption Expenditure Comprehension of structure Exploratory Data Analysis for inflation and other economic variables Summary statistics, skew, kurtosis, histograms, Q-Q, scatter plot matrix, correlation heatmap Following standardization cointegration and auto-correlation Prediction Time Series methodology Regression methodology (variables selection, model estimation, model validation, forecasting) Avdiu, K. and Unger, S. (2022). Predicting Inflation—A Holistic Approach. J. Risk Financial Manag., 15, 151 Are gold and bonds good leading indicators of inflation? LAB6: Recital of short-term economic models: IS-LM, AD-AS and AD-IA Analytical derivations, solutions, numerics, and geometrical interpretations: IS, AD, AS, etc. Relevance and construction: IS-LM, AD-AS & AD-IA. Shifts, deducing or investigating rules, policies from such models and tools (empirical cases) Course Outline --> 1. Money and the Financial System 2. Treasury Purpose Agencies of the Treasury Tools in economic policy 3. Value of Money Pigou, A. C. (1917). The Value of Money. The Quarterly Journal of Economics, 32(1), 38–65. What is this article saying? Is such article relevant with real markets? 4. Financial Institutions Why and when did banks become a fixture in society? How do banks acquire or generate capital to establish themselves as financial institutions? Governance and regulation for banks to operate Management of Financial Institutions Capital, Liquidity, Credit Quality, and Deposit Insurance Banking policies for good mixture of liquidity, credit and capital Basel measures and recommendations Use of financial statements and requirements measures Why do banks borrow from each other? Federal funds rate and Interbank rate: differentiate between them. Regulation by central banks Economic Analysis versus performance of banks 5. Interest Based Investments Idea of interest Measures Time Value of Money (TVM) and Rate of Return (RoR) Compounding (discrete and continuous) Present Value, Net Present Value, Future Value Effective Rate of Interest, Accrued Interest Internal Rate of Return and MIRR 6. Fixed Income Investments Money Markets Hayes, A. (2024). Money Markets: What They Are, How They Work, and Who Uses Them. Investopedia Bond Structure: principal with and without coupon (discrete and continuous compounding) Effective Rate of interest Accrued Interest Government Securities General Instruments Sources for credit measure Auctions and Valuation CDs, Corporate bonds, loans, mortgages, etc., etc. General Instruments Sources for credit measure Vendors for such and their regulation Regulation Valuation Influences on interest rates Ross, S. (2021). How Does Money Supply Affect Interest Rates? Investopedia Lioudis, N. K. (2021). Who Determines Interest Rates? Investopedia Heakal, R. and Boyle, M. J. (2021). Forces that Cause Changes in Interest Rates. Investopedia Beers, B. (2021). Negative Interest Rate Definition. Investopedia Interest risk, duration types and immunization methods Credit Ratings (households & firms, and gov’t) Credit: households and firms Relative health of the markets and economy as a whole Yield Curve Economic indicator Models and assets applied Expectations of market participants about future changes in interest rates and their assessment of monetary policy conditions De facto measure of liquidity: bid ask spread Interest adjustment based on perceived risk with market agents CAPM and multi-factor models Does lender competition stabilize interest rates that results in caps beneath the measure of CAPM and multi-factor models? 7. Equity Market IPOs: Dividend Discount Models (DDMs), DCF, Comparables Regulation Influences on stock prices Beta, standard deviation and VaR CAPM and Multi-factor Models Relation between treasury yield rates and stocks 8. Money Supply Process Concept (short run and long run) Multplier (types) Determinants of Money Supply Equation of Exchange and its use in economic analysis Will investigate various behaviors and scenarios Measures of money supply (types and formulas) Inflation Wikipedia - Money Multiplier (applicable for assignment case scenarios with banks) 9. Central Bank Structure Preliminaries: Central Banks and the Federal Reserve System Why is a federal funds rate needed? What will such influence? Theories of Monetary Policy Transmission of monetary policy Goals, monetary policy, transmission channels, effects Policy Rules Tools of Monetary Policy and relation to rules Conduct of monetary policy How rules and transmission channels affect markets Interpretation of monetary policy, rule(s) and applied tools Rudimentary models: AD-AS and AD-IA Algebraic and numeric focused 10. Differentiation between central banks and treasuries Powers and responsibilities in regulation and economic policy Coexistence and complimentary tools in monetary economy Why not just print any amounts of money? For the consensus answer, can such be empirically validated? Pursue. 11. Fiscal Governance Taxes for goods and services Automatic Stabilizers and redistribution/funding for public services Public Budget and Budget Constraint Budget Deficit: consequences and counters Fiscal Indicators Measures for the following: budget balance, debt, revenue, expenditure, and fiscal sustainability. Recessions & Liquidity Traps Picking up where monetary policy reaches its limits Relevance of AD-AS, AD-IA to fiscal policy (algebraic, numerical) Coordinating Monetary Policy with Fiscal policy via AD-AS and AD-IA? Algebraic and numeric focused 12. Currency & Policy Economic reasoning for currency exchange From Bretton Woods to fiat to current, why? Foreign Exchange IMF - Classification of Exchange Rate Arrangements and Monetary Policy Frameworks: https://www.imf.org/external/np/mfd/er/2004/eng/0604.htm Economic arguments and various exchange rate regimes Conditions for good welfare The Foreign Exchange Market. Why permitted to function in such manner? Is it contrary to exchange regimes of countries? Value of money from the value of treasury notes (VOMTS) Means of analysing (active immersion assignments) Value of money from foreign exchange reserves (VOFXR) Means of analysing (active immersion assignments) Value of money from PPP (VOMPPP) Means of analysing (active immersion assignments) Analysis for possible disparities or interconnectedness between VOMTS, VOFXR and VOMPP (active immersion assignments). Which best reflects inflation? (active immersion assignments) Mundell–Fleming model (IS-LM-BoP) Algebraic and numeric focused Shifts, policies, rules and tools Prerequisite: Introduction to Macroeconomics, Calculus II Intermediate Macroeconomics This course is aimed to keep a pace of practical progression from prerequisite. Namely, continual advancement in developing practical macroeconomic models involving real world dynamic. One has to move forward rather than being sabotaged or hoodwinked with “interesting intersecting lines”. You can’t permit yourself to be subjugated by toxic scams over and over. Concerning the bigger picture, the algebraic and calculus structure directive is much more constructive long term versus watching intersecting lines; not possible to develop strongly with the latter. The expression, “have respect for your kidneys” is metaphorical here. While such pursuit still may not reflect the real economy as it is, they provide better economic insights for us. As you will also find out in the coming weeks, there is no one specific model that explains all facets of the economy concerning monetary management. Thus, I will introduce different economic models for you to use and compare. Homework 20% --> Advance reacquaintance with Intro Macro problems. For the growth models and the Multiplier-Accelerator model, David Romer’s “Advance Macroeconomics” text will apply ONLY FOR SUCH. For modules (8) to (10) in course outline there will be classical problems for static versions of IS-LM, AD-AS and AD-IA concerning shifts, policy and rules before dynamic development in an algebraic and numeric manner. Extending to problems with dynamic IS-LM and dynamic AD-AS. R LABS 20% --> --Advance fast repetition of labs (A) to (F) from Introduction to Macroeconomics course labs with possible augmentations. --Based on prerequisites, thus leading to the assumption that students are capable with series expansions and basic ODEs, will begin converting some ODEs into difference equations in R. Package dde can accompany analytical modelling; else, and most likely build manually in R for the long haul. The following gives an of what’s to be expected as a beginner: Dayal, V. (2020). Difference Equations. In: Quantitative Economics with R, Springer, Singapore. Fulford, G., Forrester, P., & Jones, A. (1997). Linear Difference Equations in Finance and Economics. In: Modelling with Differential and Difference Equations (Australian Mathematical Society Lecture Series, pp. 126-145). Cambridge: Cambridge University Press https://mjo.osborne.economics.utoronto.ca/index.php/tutorial/index/1/fod/t Developing difference equations and investigate dynamics and various conditions. Then, recognised parameter estimates compared to econometric parameter methods, and drawing conclusions (with holistic economic rationale): Solow-Swan Mankiw – Romer – Weil Ramsey – Cass – Koopmans Model Overlapping Generations Model Then compare manual computational construction and package dde use with Dynare + OccBin Toolkit and Dynare R development Multiplier-Accelerator model Exchange rate overshooting model by Dornbusch (and alternatives) --Yield Curve Modelling (development and contrast) Review of use Interpolation of the yield curve: making connection to your calculus skills. Data elements will be 3-4 at most. Interpolation in R 10+ data elements with R Nelson Siegel model Diebold Li Model (published version): Diebold, Francis X. and Canlin Li. (2006). Forecasting the Term Structure of Government Bond Yields, Journal of Econometrics, v130, 337-364 Nelson–Siegel–Svensson Schumann, E. Fitting the Nelson–Siegel–Svensson Model with Differential Evolution. Cran R Spline Method Fisher-Nychka-Zervos (Spline) --Analysis of Business Cycles Spotting Recessions Measuring and Dating the Business Cycle in R --Simulating Dynamic IS-LM, and DAD-DAS Shifts, policies and rules 4 Exams 60% Will include all HW problems Will concern lectures and labs in this course COURSE OUTLINE --> LONG TERM MODELS AND TOOLS -- 1. Growth Models in the Long Run. What can they tell you? Strengths and weaknesses comparatively. How useful are they? Key topics to investigate: savings and investment (short run vs. long run); population growth; investment; saving; aggregate production; consumption; full employment; returns to scale; expressing concepts in per capita terms; capital deepening and capital widening; long-run steady state; real interest and real wage; population growth variance; saving rate variance; dynamic scoring. Note: calibrations methodology with economy and so forth expected. Note: determine order yielding the most tangible, fluid, constructive and sustainable delivery Exogenous growth model Mankiw – Romer – Weil Ramsey – Cass – Koopmans Overlapping Generations (OLG) Multiplier-Accelerator 2. Growth Models Investigation Klenow, P. & Rodríguez-Clare, A. (1997). The Neoclassical Revival in Growth Economics: Has It Gone Too Far? NBER Chapters, in: NBER Macroeconomics Annual 1997, Vol 12, pages 73 – 114, NBER Research, Inc. Question: how to develop the following article relevant with modern data? Baumol, W. J. (1986). Productivity Growth, Convergence, and Welfare: What the Long-Run Data Show. The American Economic Review. 76 (5): pages 1072–1085. Note: extend with more modern data. 3. Overview of DYNARE + OccBin Toolkit and Dynare R towards OLG. 4. Yield curve and applying estimating methods 5. Analysis of business cycles: finding any relationship between household debt and impending economic downturn (augment with more modern data) Mian, A. R., Sufi, A. and Verner, E. (2015). Household Debt and Business Cycles Worldwide (NBER Working Paper 21581 Developing economies (demonstrations for countries with medium grade credit ratings) 6. Spotting Recessions The following literature to be guides for development in R Chappelow, J. & Barnier, B. (2020). Guide to Economic Recession, Investopedia The Economist – How To Spot a Recession: Economists have a new method for predicting big downturns Pickert, R. Tips for Spotting a U. S. Recession Before it Come Official. Bloomberg Are tools from (4) consistent with the identified methods of spotting recessions? 7. Measuring and Dating the Business Cycle in R Achuthan, L. (2020). Business Cycle. Investopedia From the above article to develop data analysis for measuring and dating business cycles. Then for different countries and to determine whether phases are consistent with each other. SHORT TERM DYNAMIC MODELS -- 8. Dynamic IS-LM Review of static IS and LM (algebraic, numerical) towards IS-LM Derivation (algebraic,) numerical, solutions and graphical Extending priors to IS-LM (algebraic, numerical and means of use) For shifts will try to match with causes based on economic data; policies and rules. Extending the IS-LM model to the dynamic case; solutions, calibrations, simulations, shifts policies and rules. Possible additional interest (to computationally replicate): De Cesare, L., & Sportelli, M. (2005). A Dynamic IS-LM Model with Delayed Taxation revenues. Chaos, Solitons and Fractals, 25(1), 233–244. Wang, X. H., & Yang, B. Z. (2012). Yield Curve Inversion and the Incidence of Recession: A Dynamic IS-LM Model with Term Structure of Interest Rates. International Advances in Economic Research, 18(2), 177–185. 9. Dynamic AD-AS (algebraic, numerical, graphical) Review of static AD and AS Derivation (algebraic), solutions, numerical and graphical Followed by AD-AS development (algebraic/c, numerical and means of use) Extending priors to DAD-DAS (and means of use) For dynamics based on simulation will try to match with economic conditions; policies and rules. Build on the following towards empirical cases studies concerning solution, policies, rules decisions (and critique): --https://personal.utdallas.edu/~d.sul/Macro/chap14.pdf 10. Dynamic AD-IA? Review of static AD and IA Derivation (algebraic), solutions, numerical and graphical Followed by AD-IA development (algebraic/c, numerical and means of use) Extending priors to dynamic version (and means of use)? For dynamics based on simulation will try to match with economic conditions; policies and rules. LONG-TERM OPEN ECONOMY MODELS -- 11. Daniel, B. C. (1977). Inflation and Unemployment in Open Economies. International Finance Discussion Papers. No.114. Federal Reserve 12. Open Economy Solow Model (OESM) Assessing International Capital Mobility Empirically The Feldstein-Horioka Puzzle The Lucas Paradox Open Economy Solow Model: Capital Mobility The Basic Model Empirical Issues 13. Can the following be extended to open economy? Empirical Investigation? Mankiw – Romer – Weil Ramsey – Cass – Koopmans 14. Can the same conclusions be brawn from (1), (12) and (13)? SHORT TERM DYNAMIC OPEN ECONOMY MODELS? Advance Review of the Mundell-Fleming Model Dynamic IS-LM-X Model Wang, P. (2017). A Dynamic IS-LM-X Model of Exchange Rate Adjustments and Movements. International Economics (Paris), 149, 74–86. Wang, P. (2020). The Dynamic IS-LM-X Model of Exchange Rate Movements. In: The Economics of Foreign Exchange and Global Finance. Springer Texts in Business and Economics. Springer, Berlin, Heidelberg Are all conclusions for economic scenarios, policies and rules with Mundell-Flemming consistent with the dynamic IS-LM-X Model? MONETARY TRANSMISSION MECHANISM -- Role of the Central Bank; Transmission Mechanism; Conduct of Monetary Policy. Will observe/analyse the structure. Will then identify rule(s) and tools for intended effects and transmission channels. INTRODUCTION TO MONETARY POLICY RULES -- For the following rules how does one arrive to such specific formulas? Pursue a transition sequence that emphasizes similarities and disparities to increasing unique attributes. Are the rules of exact form for all countries? Taylor rule Balanced-approach rule ELB-adjusted rule Inertial rule First-Difference rule Outcome-Based rule Nominal income targeting rule The references in the following may prove beneficial: https://www.federalreserve.gov/monetarypolicy/policy-rules-and-how-policymakers-use-them.htm Prerequisites: Introduction to Macroeconomics, Calculus II Macroeconomic Accounts Statistics Basic concepts, and principles and skills required to compile and disseminate macroeconomic and financial statistics. Note: all considered political scales (national, provincial and municipal) are assumed to be open economy. Note: I will not ask you to remember every equation. ESSENTIAL TOPICS (to resonate continuously throughout course) --> Differentiate institutional units and sectors Apply the concept of residence Record stocks and flows in an integrated manner Classify financial instruments and valuation Apply appropriate accounting rules Summarize IMF’s Data Standards Initiatives Requirements & Recommendation Evaluate macroeconomic inter-linkages. National Accounts Main elements with construction for each Circular Flow of Economic Identity Key identity: Production = Income = Expenditure? National Income and Product Accounts Measuring GDP Income Approach Expenditure Approach Production Approach Income and Saving Private Disposable Income Private Saving Net Government (Public) Income Government (Public) Saving National Saving Uses of National Saving Assessment of Taxes Fiscal Indicators (more than one) Measuring Capital Flows Claessens, S. and Naude, D. (1993). Recent Estimates of Capital Flight, World Bank WPS 1186 National Accounts for Economic Assessment Assessing Public Finance Assessing Economic Welfare Assessing Transitioning Economy Assessing Inflation Current Account Benchmark and Analysis How is the Intro Macroeconomics course relevant macroeconomic accounts statistics? Note: concerns how algebraic models and numerical inputs apply to observe dynamics with most prior topics/modules. STRUCTURAL GUIDE --> System of National Accounts 2008 < https://unstats.un.org/unsd/nationalaccount/sna2008.asp < https://unstats.un.org/unsd/nationalaccount/impUNSD.asp Towards the 2025 SNA < https://unstats.un.org/unsd/nationalaccount/Towards2025.asp AUGMENTATIVE LITERATURE --> NOTE: the following two literature only serves to expand upon the given essential tasks and structural guide with “waterdown” exercises, but don’t expect all course exercises to always be that superficial. National Accounts: A Practical Introduction. United Nations 2003. Studies in Methods Series F, No.85 Lequiller, F. and D. Blades (2014), Understanding National Accounts: Second Edition, OECD Publishing, Paris RESOURCES--> IMF data repositories UN Stats data repositories Bank for International Settlements Gov’t data repositories COURSE LABS ELEMENTS (with Excel and R use) --> Component A. Developing data skills towards macroeconomic data (GDP, GNI, consumption, expenditure, unemployment, inflation, currency exchange rates, and chosen commodities) Data acquisition and wrangling Summary Statistics Exploratory Data Analysis Time Series Analysis for Economic Data (including exchange rates and chosen commodities) Salient Characteristics Observation Time Series Forecasting Comparing economic indicators measured in different units Normalization or Standardization Indexing Cross-Correlation based on either of the priors priors Co-integration Component B. Logistics and development of the elements in National Accounts. NOTE: done on multiple occasions with course progression. Component C. Analysis of National Accounts Publications Economic measures determination + given technical analysis questions NOTE: done on multiple occasions throughout course progression. Component D. Using national accounts data to calibrate short-run models; to observe how real macroeconomic statistics development and dynamics influence such models. NOTE: to be done on numerous occasions. QUIZZES --> Concepts and multiple choice (based on structural guide) Prerequisite topics and questions from Intro Macro course Modules (2) to (5). Don’t worry, such is naturally in sync with this course. Algebraic manipulation of economics equations for various perspectives (with data inputs) Analysis of data found in National Accounts Publications towards reasoning and computation (straightforward questions and indirect reasoning) EXAMS --> Component 1. Prerequisite topics and questions from Intro Macro course Will reflect quizzes Component 2. SNA questions. GROUPS TERM PROJECT ELEMENTS --> Gathering economic activity data to tabulate statistics based on SNA 2008, but only at city or provincial level. Done in a quarterly manner but will account for four to six years. A. Will not rely on summarized data, rather, use of highly primitive data to tests your development skills. How primitive? In course progression you will be emulating all figures and tables from the structural guide, where they will be applied for development for the term project; develop logistics among all such towards your computations. You will be making extensive data searches concerning the public sector, public finance, households (all types), private sector, NPOs and NGOs, Assets, Liabilities, etc., etc. All major financial statements will be developed during the collective process. Proper citations and reference will make or break you as well. Proper procedure and mechanics will have much weight just as quantitative accuracy. As well to compute quarterly for four years: GDP, GDP per capita, real GDP, GNI, savings, assets and liabilities, debt and its variation. Real GDP growth rate. Public sector debt and its dynamic. B. All given essential topics will be relevant in your term project. C. To be given a grade I must observe that you are actually intimate with the whole process (also including citations), rather than being a con artist with public data summaries. D. How does GDP forecasting based on system of National Accounts data compare via time series compare to multivariate regression method involving selected predictor variables (thus applying heavy data)? E. How does inflation assessment based on system of “National” Accounts compare to econometric methods (thus applying heavy data)? Prerequisites: Enterprise Data Analysis I & II, International Financial Statements Analysis I & II, Introduction to Macroeconomics, Calculus II Advanced Macroeconomics A course with such notorious title often ends up as being one of confusion and discouragement with seeming “rancid mathematical fodder cascade”. The aim of this course is to graduate from simpler economic models to immersion into DSGE and CGE. However, skills with simpler economic models is something that should not be thrown away. Grading --> Problem Sets 20% Labs with Excel, R, Dynare, DynareR and GAMS 35% 3 Exams 45% Main Topics --> 1. Behrman, J. and Hanson, J. A. (1979). The Use of Econometric Models in Developing Countries. In: Short-Term Macroeconomic Policy in Latin America, NBER 2. Overlapping Generations Models and its relevance to fiscal policy 3. Advance review of monetary policy rules from Intermediate Macroeconomics. Observing how economic data encourages their implementation. 4. DSGE Models and Applications Development (active development) Identification & characteristics of constituent models & properties. Compare and contrast with the following concerning economic behaviour, dynamics, policy and rules: Dynamic IS-LM, Dynamic AD-AS (being DAD-DAS and NOT DAD-SAS). Applications of DSGE (active development) Monetary policy Fiscal Policy Forecasting Tradeoff Between Fixed & Floating Exchange Rates Financial Stability Analysis Labor Market Dynamics 6. GGE models and Applications Development (active development) Identification & characteristics of constituent models & properties. Compare and contrast with the following concerning economic behaviour, dynamics, policy and rules: Dynamic IS-LM, DAD-DAS and Dynamic IS-LM-X Applications of CGE (active development) Economic Assessment Trade Environmental regulations and policies Natural Disasters Problem Sets --> A. Review Algebraic and numerical concerning the constituents for structure, properties and conditions: IS, LM, IS-LM AD, AS and AD-AS Algebraic, calculus and calibrations applied for dynamic models concerning the constituents for structure, properties and conditions. Followed by simulations: Dynamic IS-LM DAD-DAS A Dynamic IS-LM-X Overlapping Generations Model Applications in growth and fiscal policy B. DSGE Notion and applications Constituents for structure Properties and conditions of such constituents Calibrations and estimations C. CGE Notion and applications Constituents for structure Properties and conditions of such constituents Calibrations and estimations Labs with Excel, R, Dynare, DynareR and GAMS --> 1. Chosen lab topics from prerequisites 2. National Accounting (3-4) System of National Accounts 2008 < https://unstats.un.org/unsd/nationalaccount/sna2008.asp < https://unstats.un.org/unsd/nationalaccount/impUNSD.asp Assess current standard of living or the distribution of income within a population Assess effects of various economic policies Inflation determination 3. For the adjective econometric in Behrman, J. and Hanson, J. A. (1979), will investigate how such comes in. Practice runs as well. 4. Cobb-Douglas and CES in macroeconomics. Role of Cobb-Douglas and CES in macroeconomics Difference between Calibration and Estimation of Cobb-Douglas and CES (utility and production)? Overview, logistics and code development for various applications 5. Transitional Dynamics in Growth Models Fast review of growth models and analysis key topics from prerequisite. Relevance of transitional dynamics in growth models to various economic terms, quantities and parameters of interest Methods, conditions and interpretations: analytical immersion Simulations in R 6. Overlapping Generations Models applied to fiscal policy To make use of DYNARE + OccBin Toolkit after analysis. DynareR can also be applied. 7. Model analysis and dynamics with simulations (likely will be in good flow with course outline: Hartley, J. (Ed.), Hoover, K. (Ed.), Salyer, K. (Ed.). (1998). Real Business Cycles. London: Routledge. Concerns Chapter 2, Chapter 3, Chapter 7 and other chapters (from such text). Will make use of both past eras and modern times. 7A. Monetary Transmission Mechanism Will observe/analyse the structure. Will then identify monetary rule(s) and tools for intended effects and channels. How do rules and tools influence the mechanism? 7B. Advance Review of Policy Rules For the following rules how does one arrive to such specific formulas? Pursue a transition that emphasizes similarities to increasing unique attributes. Are the rules of exact form for all countries? Compare rules and their results based on applying appropriate data Taylor rule Balanced-approach rule ELB-adjusted rule Inertial rule First-Difference rule Outcome-Based rule Nominal income targeting rule The references in the following may prove beneficial: https://www.federalreserve.gov/monetarypolicy/policy-rules-and-how-policymakers-use-them.htm 8. Simulation with General Equilibrium: General Equilibrium R packages (CGE, GE) Note: acronym above for package doesn’t mean specifically Computable General Equilibrium. Analyse given reference literature to comprehend package structure. Then analyse reference manual. Apply to ambiances of interest 9. Dynamic Stochastic General Equilibrium (DSGE) Junior, C. J. C. and Garcia-Cintado, A. C. (2018). Teaching DSGE Models to Undergraduates. Economica A 19, 424 – 444 To make use of DYNARE + OccBin Toolkit after analysis. DynareR can also be applied. Note: interests will go much further than article with development and simulation; sustainability with applications Calibrations/conditions. Estimation of open economy DSGE model, etc. Harrison, G.W. et al (2000). Using Dynamic General Equilibrium Models for Policy Analysis. Elsevier Devereux, M. (2000). A Simple Dynamic General Equilibrium Model of the Trade-Off Between Fixed & Floating Exchange Rates. London, Centre for Economic Policy Research. Attempts to apply conditions and circumstances for displays Case studies: from implementation of policies to withdrawal Estimations and forecasting 10. Computable General Equilibrium Will need some strong sessions for immersion with the GAMS environment before proceeding. Devarajan, S. and Go, D. S. (1998). The Simplest Dynamic General Equilibrium Model of an Open Economy. Journal of Policy Modelling 20(6): pages 677 – 714 Will have more advance models to treat common applications. Some resources: Burfisher, M. E. (2011). Introduction to Computable General Equilibrium Models, (2011). Cambridge University Press. Dixon, P. B. and Jorgenson, D. W. Eds. (2013). Handbook of Computable General Equilibrium Modelling SET, Volumes 1A and 1B. Elsevier Perali, F. and Scandizzo, P. (2018). The New Generation of Computable General Equilibrium Models: Modelling the Economy. Cham: Springer The following texts provide guidance for programming and simulation: Hosoe, N., Gasawa, K., & Hashimoto, H. (2010). Textbook of Computable General Equilibrium Modeling: Programming and Simulations, Palgrave Macmillan Limited. Chang, G. H. (2022). Theory and Programming of Computable General Equilibrium (CGE) Models: A Textbook for Beginners. World Scientific. --Note: after analysis will implement with use of data for wherever concerning interests; calibrations, estimations and forecasting 11. Comparing DAD-DAS and Dynamic IS-LM-X to DSGE and CGE concerning dynamics, forecasting, policies, rules and critique Prereqs: Macroeconomic Accounts Statistics, Intermediate Macroeconomics. Co-requisite: Probability & Statistics B International Macroeconomics Aside for concerns a country’s output, inflation, interest rates, exchange rates, & trade balance, course also considers the international linkages arising from capital & trade flows. Additionally, the course examines the effects of macroeconomic events on the international business environment. Note: some cases will be “learn as you go”; that’s just life. I can’t afford to have the math department create rents or be a “monopoly” upon mathematical and statistical ability; they do what they want, when they want, how they want...with no real consequences concerning time, space and resources...that’s definitely not international macro, nor any industrialized profession. Labs (done in a manner that’s harmonic to course progression development) --> 1.Economic Statistics (due date to be given) A. Determining the Trade balance Intimate process via SNA guides Where do you get the primitive data to compute? Logistics and implementation 3-4 examples to be done rather than just accepting the given numbers B. Which factors can Influence a Country’s Balance of Trade? Investopedia Means to validate the statements C. GDP forecasting (regression and time series) D. Gross National Income (GNI) World Bank Atlas method (develop and compare with organised data): https://datahelpdesk.worldbank.org/knowledgebase/articles/378832-the-world-bank-atlas-method-detailed-methodology E. Global PMI Analysis F. Inflation and Employment Inflation Forecasting Avdiu, K. and Unger, S. (2022). Predicting Inflation—A Holistic Approach. J. Risk Financial Manag., 15, 151 Is gold a good leading indicator for inflation? Employment Forecasting 2. National Accounts (2-3 countries) System of National Accounts 2008 < https://unstats.un.org/unsd/nationalaccount/sna2008.asp < https://unstats.un.org/unsd/nationalaccount/impUNSD.asp Identifying economic welfare Assessment of economic policy Can the following tools apply? Beneish, Dechow F, Modified Jones, and Altman Z 3. Currency Exchange DSGE for exchange rate tradeoffs. To develop and simulate for various conditions: Devereux, M. (2000). A Simple Dynamic General Equilibrium Model of the Tradeoff Between Fixed & Floating Exchange Rates. London, Centre for Economic Policy Research DYNARE + OccBin Toolkit after analysis; DynareR Floating Currency Pairs Forecasting 4.Indicators to Predict Economic Recessions Will apply the identified tools to past business cycles to determine predictive power (with some statistical indicators applied); future predictions as well. Yield Curve PMI Composite Index of Leading Indicators OECD Composite Leading Indicator < https://www.oecd.org/sdd/leading-indicators/41629509.pdf > Global PMI The TED spread ---Concept. Instructor must exhibit to students how to competently read and analyse market data observed: ---Credit risk and default risk observation ---Trade construction methodology ---Perturbation values, observation of hedge ratios (with any formula) ---Liquidity-related factors Note: for such above there are likely analogies to such for a respective developed ambiance of interest to create a “foreign TED spread”. Else, construct them. Also, with the possible replacement of LIBOR apply appropriate substitution. Assignments --> A combination of “status quo” problems COMBINED WITH assignment tasks mentioned in MANDATORY DEVELOPMENT. Exams --> Exams will reflect readings, assignments and labs Term Project --> Concerns development and implementation of 3 models in module 15 to compare or complement each other. I expect professional research paper development involving tools such as R, Excel, Dynare, DynareR, etc. For the case of R usage I expect commentary and latex throughout. Yes, the course obligations are hectic, but that’s just like real macroeconomics in play. However, this course is not in fashion with memorizing charms, sutras and incantations as though your life depends on such kinds of things. Grading constitution serves for you controlling your own destiny (an unfortunate troll upon lesser developed countries). Don��t panic or freak out; just be mature and accountable. Hah! Course Grade Constitution --> Assignments Sets Exams Labs Term Project NOTE: Course Literature --> TBA: must match mandatory development with level of topics and quantitative development. MANDATORY DEVELOPMENT --> NOTE: selected topics from texts will be chosen to accommodate (not dictate upon) the following listed mandatory topics: 1.COMPREHENSION OF A MONETARY ECONOMY AND CONCERNS 2.CONCERNING EQUILIBRIUM WHAT IS THE ROLE OF THE TREASURY IN A MONETARY ECONOMY COMPARED TO CENTRAL BANK POLICY? 3.THE MONEY SUPPLY PROCESS: Assisting literature for development Krugman & Wells 2009, Chapter 14: Money, Banking, and the Federal Reserve System: Reserves, Bank Deposits, and the Money Multiplier, pp.393-396. In: Macroeconomics. Macmillan. Mankiw 2008, Part IV: Money and Prices in the Long Run: The Money Multiplier, pp. 347 – 349. In: Principles of Macroeconomics. Cengage Learning Mankiw 2002, Chapter 18: Money Supply and Money Demand: A Model of the Money Supply, pp. 486 – 487. In: Macroeconomics. MacMillan Wikipedia - Money Multiplier (applicable for assignment case scenarios with banks) Determinants of Money Supply (exogenous and endogenous perspectives) The minimum cash reserve ratio The level of bank reserves The desire of the people to hold currency relative to deposits Latter two determinants together are called the monetary base or the high- powered money. High-Powered money and the money multiplier Other Factors: money supply is a function not only of the high-powered money determined by the monetary authorities, but of interest rates, income and other factors. The latter factors change the proportion of money balances that the public holds as cash. Changes in business activity can change the behaviour of banks and the public and thus affect the money supply. Hence the money supply is not only an exogenous controllable item but also an endogenously determined item. High-Powered money and the money multiplier (formulae) Equation of exchange Measures of money supply M1, M2, M3, M4, Money Zero Maturity (MZM) Definition Derivation of the money multipliers Velocity for measures Gorton, D. (2021). How Does Money Supply Affect Inflation? Investopedia Many statements to validate, as well, empirical exercises to validate Relation between Monetary intervention and money supply. IS-LM, AD-AS and AD-IA? Have algebraic and numerical emphasis mostly before consideration of any use of curves (as possible assignments) The Money Market Model. How is it relevant to IS-LM, AD-AS and AD-IA? Have algebraic and numerical emphasis mostly before consideration of any use of curves (as possible assignments) 4.REASONS OR AGENDAS FOR INTERNATIONAL TRADE General Agreement on Tariffs and Trade (GATT) What assets, products and services are applicable? Purpose of the WTO and its influence. Differentiation between WTO, UNCTAD and UNCITRAL. Non-Tariff Measures and the IBT Agreement. 5.EXCHANGE RATES Exchange rate regimes IMF: Classification of Exchange Rate Arrangements and Monetary Policy Frameworks < https://www.imf.org/external/np/mfd/er/2004/eng/0604.htm > Economic arguments for exchange rate regimes. Fixed and floating (fiscal and monetary management): requirements or conditions for good welfare Why does the currency exchange market exist? Why must/does it exist as an over-the-counter (OTC) marketplace? Is the currency exchange market contrary to exchange rate regimes of countries? Value of money from the value of treasury notes (VOMTS) Means of analysing (active immersion assignments) Value of money from foreign exchange reserves (VOFXR) Means of analysing (active immersion assignments) Value of money from PPP (VOMPPP) Means of analysing (active immersion assignments) Analysis for possible disparities or interconnectedness between VOMTS, VOFXR and VOMPP (active immersion assignments). Which best reflects inflation? (active immersion assignments) Statistical relationship between money supply, GDP, inflation, unemployment and exchange rate (via correlation, scatter plots, time series auto-correlation, time series cointegration) Nominal Exchange Rate and Real Exchange Rate Real Effective Exchange Rate (REER) Purpose Model development (analytical and R based) Uses (active immersion assignments) 6.MUNDELL-FLEMING MODEL (extending the IS-LM) Development (algebraic, numerical, solutions and graphical) Boughton, J. M. (2002). On the Origins of the Fleming – Mundell Model, International Monetary Fund. IMF Working Paper. WP/02/107 Gandolfo, G. (2016). The Mundell-Fleming Model. In: International Finance and Open-Economy Macroeconomics. Springer Texts in Business and Economics. Springer, Berlin, Heidelberg. Fleming, J. Marcus (1962). IMF Staff Papers. 9: 369–379. Mundell, Robert A. (1963). Canadian Journal of Economics and Political Science. 29 (4): 475–485. Deductions or guidelines for shifts, policies & rules (case assignments) Try to analyse, make sense of the following, then pursue replication, followed by countries of interest with more modern data Obstfeld, M. (2001). International Macroeconomics: Beyond the Mundell-Fleming Model. IMF Staff Papers Vol. 47, Special Issue 7. GLOBAL LIQUIDITY Why study global liquidity? Global Liquidity indicators - Overview | Bis Data Portal (2024b), < https://data.bis.org/topics/GLI > Global Liquidity Indicators - Overview | BIS Data Portal. (2024), < https://data.bis.org/topics/GLI#methodology > 8.OVERSHOOTING MODEL Dornbusch, R. (1976). "Expectations and Exchange Rate Dynamics". Journal of Political Economy. 84 (6): 1161–1176. Frenkel, J. A., & Rodriguez, C. A. (1982). Exchange Rate Dynamics and the Overshooting Hypothesis (La dynamique des taux de change et l’hypothèse du surajustement) (La dinámica de los tipos de cambio y la hipótesis del ajuste excesivo). Staff Papers (International Monetary Fund), 29(1), 1–30. Rogoff, K. (2002). Dornbusch ’s Overshooting Model After Twenty-Five Years, IMF Working Paper, WP/02/39 What is the relation or disparity between Dornbusch’s model and the Mundell-Fleming model? 9.DYNAMIC SHORT TERM OPEN ECONOMY MODELS Dynamic IS-LM-X Model (review) Wang, P. (2017). A Dynamic IS-LM-X Model of Exchange Rate Adjustments and Movements. International Economics (Paris), 149, 74–86. Wang, P. (2020). The Dynamic IS-LM-X Model of Exchange Rate Movements. In: The Economics of Foreign Exchange and Global Finance. Springer Texts in Business and Economics. Springer, Berlin, Heidelberg Are all conclusions for economic scenarios, policies and rules with the dynamic IS-LM-X Model consistent with the Mundell-Flemming and/or the Overshooting Model? (active investigation assignments for students) 10.FINANCIAL TRANSACTIONS Heakal, R. (2021). What is the Bank for International Settlements? Investopedia Scott, G. (2021). International Swaps and Derivatives Association (ISDA), Investopedia Chen, J. (2020). ISDA Master Agreement. Investopedia Balance of Payments For each type of account to identify respective uniqueness and what vital analysis stem from them; to have case examples from past periods Balance Sheet Current Account Capital Account Relationship between Current Account and Capital Account Errors and omissions Measuring Capital Flows (active investigation assignments for students) Claessens, S. and Naude, D. (1993). Recent Estimates of Capital Flight, World Bank WPS 1186 11.CURRENT ACCOUNT ANALYSIS Cases of (persistent) current account deficits: factors and evidence. Do deficits mean the economy is weak? What to worry about? What not to worry about? Does a surplus automatically mean that the economy is strong? How to reduce the current account deficit? Influence of current account deficit on terms of trade. Effect of devaluation on terms of trade. Current Account Benchmarks: Ca’ Zorzi, M., Chudik, A. and Dieppe, A. (2009). Current Account Benchmarks for Central and Eastern Europe. A Desperate Search? European Central Bank Working Paper Series No. 995 Coutinho, L., Turrini, A. and Zeugner, S. (2018). Methodologies for the Assessment of Current Account Benchmarks. EU Discussion Paper 086 (some implementable assignments) 12.NATIONAL INCOME The National Income Identity. Disparity between GNP and GDP National Income Identity in terms of the Current Account Income Determination in the Open Economy GDP vs Real GDP and GDP per capita vs real GDP per capita: the misconceptions 13. MONETARY POLICY & EXCHANGE RATE Review: IMF - Classification of Exchange Rate Arrangements and Monetary Policy Frameworks: https://www.imf.org/external/np/mfd/er/2004/eng/0604.htm Gianviti, F. (2014). Relationship Between Monetary Policy and Exchange Rate Policy. In: L. Satragno (Author) & T. Cottier, R. Lastra, & C. Tietje (Eds.), The Rule of Law in Monetary Affairs: World Trade Forum (pp. 545-569). Cambridge: Cambridge University Press. Kolasa, M., et al (2022). Monetary Policy and Exchange Rate Dynamics in a Behavioral Open Economy Model. IMF Working Paper, WP/22/112 14.FISCAL INTERVENTION: What are its goals in a monetary economy? Money supply and the consolidated government budget constraint What makes fiscal policy work well with monetary policy? Masson, P. & Blundell-Wignall, A. (1985). Fiscal Policy and The Exchange Rate in the Big Seven: Transmission of U.S. Government Spending Shocks, European Economic Review, Elsevier, vol. 28(1-2), pages 11-42. Note: appropriate parameter values to be pursued. Fiscal Indicators (to implement assignments) Standard macroeconomic measures View from a corporate finance perspective Financial ratios (with whatever needed financial statements adjustments) Beneish, Dechow, Modified Jones, Altman Z 15.DEBT SUSTAINABILITY Concept Debt Sustainability Models Market-Access Debt Sustainability Model Low-Income Country Key models and techniques Deterministic (baseline projections and debt dynamics equation) Stochastic models Stochastic Debt Sustainability Analysis (SDSA), Monte Carlo Simulations DSGE (Macro-Fiscal DSGE models with policy impact analysis) Panel data models (Cross-Country Debt Sustainability Models, Fixed and Random Effects Models) Cointegration and Error correction models (long term relationships, error correction mechanism) Debt Sustainability Indicators < https://www.worldbank.org/en/programs/debt-toolkit > 16.DEBT TO GDP (some of the literature requires data updating for development assignments) Caner, Mehmet; Grennes, Thomas; Koehler-Geib, Fritzi, 2010, Finding The Tipping Point -- When Sovereign Debt Turns Bad,” Policy Research Working Paper Series 5391, The World Bank Pescatori, A., Sandri, D. and Simon, J. (2014). Debt and Growth: Is There a Magic Threshold? IMF Working Paper WP/14/34 Hennerich, H. (2020). Debt-to-GDP Ratio: How High Is Too High? It Depends, Federal Reserve Bank of St. Louis 17.BALANCE OF PAYMENTS CRISES Krugman, P. (1979). A Model of Balance-of-Payments Crises. Journal of Money, Credit and Banking, Vol. 11, No. 3, pp. 311-325 Calvo, G. A. (2000). Balance-of-Payments Crises in Emerging Markets: Large Capital Inflows and Sovereign Governments. In: Currency Crises. University of Chicago Press, p. 71 - 97 Pattillo, C. A. et al (2000). Anticipating Balance of Payment Crises: The Role of Early Warning Systems. IMF Occasional Papers (there may be some implementable tasks as assignments) Coutinho, L., Turrini, A. and Zeugner, S. (2018). Methodologies for the Assessment of Current Account Benchmarks. European Economy, Discussion Paper 086 (some implementable assignments) Evidence of capital flight (active investigation assignments for students) 18.CURRENCY CRISIS Radcliffe, B. (2021). What is a Currency Crises? Investopedia Krugman, P. R. et al (1999). Currency Crises. In: International Capital Flows. University of Chicago Press, p. 421 - 466 Krugman, Paul (2014). "Currency Regimes, Capital Flows, and Crises". IMF Economic Review. 62 (4): 470–493. Predicting Currency Crisis (requires implementation assignments) Berg, A. and Pattillo, (1998). Are Currency Crises Predictable? A Test. IMF WP/98/154 Berg, A. and Pattillo, C. (1999). Predicting Currency Crises: The Indicators Approach and an Alternative, Journal of International Money and Finance, Volume 18, Issue 4, Pages 561-586 Peltonen, T. A. (2006). Are Emerging Market Currency Crises Predictable? A Test. ECB Working Paper Series NO. 571 Inoue, A., & Rossi, B. (2008). Monitoring and Forecasting Currency Crises. Journal of Money, Credit and Banking, 40(2/3), 523–534. Xu, L., Kinkyo, T., & Hamori, S. (2018). Predicting Currency Crises: A Novel Approach Combining Random Forests and Wavelet Transform. Journal of Risk and Financial Management, 11(4), 86. MDPI AG Probit model Vlaar, P. J. G. Early Warning Systems for Currency Crises. Bank of International Settlements 19.QUALITATIVE VIEW OF ECONOMIES Global PMI and the OECD System of Composite Leading Indicators How to interpret Assignments: will empirically investigate its accuracy in prediction for various past periods 20.ELEMENTS OF FINANCIAL CRISIS Stylized facts of Credit Booms and Sudden Stops Mendoza, E. G. and Terrones, M. E. (2012). An Anatomy of Credit Booms and Their Demise. NBER Working Paper 18379 Arena, M. et al (2015). Credit Booms and Macroeconomic Dynamics: Stylized Facts and Lessons for Low-Income Countries. IMF Working Paper WP/15/11 Borrowing Constraints and Fisherian Amplification Bianchi, J. and Mendoza, E. G. (2020). A Fisherian Approach to Financial Crises: Lessons from the Sudden Stops Literature. NBER Working Paper No. 26915. Note: there can be simulation development to follow. 21.MACROPRUDENTIAL INDICATORS & INSTRUMENTS PART A (requires implementation assignments) Evans, O. et al. (2000). Macroprudential Indicators of Financial System Soundness, IMF Occasional Paper 00/192 Hilbers, P., Krueger, R., Moretti, M. (2000). New Tools for Assessing Financial System Soundness, Finance and Development 37(3) PART B (concepts and logistics only) Lim, C. et al (2011). Macroprudential Policy: What Instruments and How to Use Them? Lessons from Country Experiences. IMF Working Papers 238 Capital Instruments Balla, E. and McKenna, A. (2009). Dynamic Provisioning: A Countercyclical Tool for Loan Loss Reserves. Economic Quarterly—Volume 95, Number 4—Pages 383–418 Leverage Ratios Restrictions on profit distribution 22.SPECIAL DRAWING RIGHTS Kenton, W. (2002). Special Drawing Rights (SDRs). Investopedia For the latter two articles there is obligation to have follow-ups on data and updates on use by countries for speculation or confirmed objectives. May augment with other EDA techniques. Arauz, A. and Cashman, K. (2021). November Data Shows More Countries Are Using Special Drawing Rights; Over 30 Countries Have Actively Used Most of Their New SDRs. CEPR Cashman, K., Arauz, A. and Merling, L. (2022). Special Drawing Rights: The Right Tool to Use to Respond to the Pandemic and Other Challenges. CEPR 23. BASEL ACCORDS History and observation of the tangible/practical significant measures for each reform 24. Global Supply Chain Pressures, International Trade, and Inflation di Giovanni, J. et al (2022). Global Supply Chain Pressures, International Trade, and Inflation. Federal Reserve Bank of New York Staff Reports, No. 1024 Focus on section 3 and after 25. Montiel, P. J. (2002). "11 The Long-Run Equilibrium Real Exchange Rate: Theory and Measurement". In Macroeconomic Management. USA: International Monetary Fund. (requires implementation assignments) Prerequisites: Microeconomics II, Intermediate Macroeconomics, Money & Banking, Macroeconomic Accounts Statistics, Probability & Statistics Economics of Regulation Course will introduce role of government in markets where competitive equilibria is “good” or “fail.” Course will emphasize the importance of market structure and industrial performance, including the strategic interaction of firms. We will examine the behaviour of individual markets in some detail, focusing on cost analysis, the determinants of market demand, investment behaviour, market power, and the implications of government regulatory behavior. Reference Textbook --> Viscusi, W. K, Vernon, J. M. & Harrington, J. E. (2000). Economics of Regulation & Antitrust, MIT Press Resources (for group term report for assigned regulation) --> OECD (2009), Regulatory Impact Analysis: A Tool for Policy Coherence, OECD Reviews of Regulatory Reform, OECD Publishing, Paris OECD (2014), OECD Framework for Regulatory Policy Evaluation, OECD Publishing, Paris Emissions Trading in Practice, Second Edition: A Handbook on Design and Implementation. World Bank Group 2021 Course Grade Constitution --> Status Quo Problem Sets Tasks Empirical Measurement & Modelling Labs Price Regulation Analysis Simulation Games (optional) 2 Exams Module 16 In-Class Activity Price Policy Auditing Term Project EMPIRICAL MEASUREMENT & MODELLING LABS --> Note: empirical modelling done according to flow of course. A. Will choose various markets from different regions of the globe to measure market competition and monopoly power. The following literature (all of them) will be applied to current data: OECD (2021), Methodologies to Measure Market Competition, OECD Competition Committee Issues Paper OECD (2022), Data Screening Tools in Competition Investigations, OECD Competition Policy Roundtable Background Note Pindyck, R. S. (1985). The Measurement of Monopoly Power in Dynamic Markets. The Journal of Law & Economics, 28(1), 193–222. < https://core.ac.uk/download/pdf/4379734.pdf > Based on provided prior literature, for cases will pursue means to classify out of the following w.r.t. circumstances for consumers; measurement of consumer surplus and producer surplus. Competitive Monopolistic Competition Monopsony Oligopoly Oligopsony B. Methods of measuring externalities (to implement) Adhikari, S.R. (2016). Methods of Measuring Externalities. In: Economics of Urban Externalities. SpringerBriefs in Economics. Springer, Singapore. C. Causation Identification with Econometrics Impact Evaluation for Regulation Policies (comprehensive and computationally intensive) SIMULATION GUIDES/TOOLS (optional)--> Note: for any simulation game a group corresponds to a player. Notes and data recorded during games to prove quite essential. After each game students will be asked to generate a written summary based on questions developed by instructor to be rated. Questions will be relevant to the many topics in lectures. A. Externalities: Games: < https://serc.carleton.edu/introgeo/games/examples/62222.html > Freeway Game: http://www.thefreewaygame.com B. Regulatory Impact & Decision Making: Musshoff, O. & Hirschauer, N. (2014) Using Business Simulation Games in Regulatory Impact Analysis – The Case of Policies Aimed at Reducing Nitrogen Leaching, Applied Economics, 46:25, 3049-3060 Ayadi H, et al (2014). SimPhy: A Simulation Game to Lessen the Impact of Phytosanitaries on Health and the Environment--the Case of Merja Zerga in Morocco. Environ Sci Pollut Res Int. 21(7): 4950-63 M. Buchholz, M., Holst, G. & Musshoff, O. (2016). Irrigation Water Policy Analysis using a Business Simulation Game. Water Resources Research, 52(10), pp. 7980-7998 Carbon Market Simulator – Vivid Economics CarbonSim – Environmental Defense Fund PRICE REGULATION ANALYSIS --> Note: will be assigned at appropriate time during course progression. Groups assigned difference ambiances (regional or foreign) A. Price-Cap Regulation Model (PCRM) How to determine the efficiency factor? Pursue (verify with data analysis). Time series analysis and forecasting B. Revenue-Cap Regulation Model Same development as PCRM Firms applicable to (A) are also applicable to (B). Establish comparative analysis concerning the profit-efficiency “manifold” between (A) and (B). D. Yardstick Regulation Model Will (just for fun) compare the firm with the highest price cap to results from Data Envelopment Analysis for determining performance; well observe if performance rank and price caps align. E. Profit-Sharing Regulation Model How to determine Target profit level set by the regulator? Pursue(verify with data analysis). How to determine the sharing percentage (percentage of excess profit to be shared with consumers)? Pursue (verify with data analysis) Studying a profit-sharing regulation model Cost-Benefit Analysis (benefits to consumers, costs to the firm) Quantify both benefits and costs, and calculate the net benefit; may not be as direct as it sounds. Economic Impact Analysis Firm’s Financial Health Analysis; complement prior with horizontal analysis, vertical analysis, cash flow analysis, Beneish, Dechow, modified Jones, and Altman Z, Ohlson O-Score . Investment Levels: analyse if profit-sharing impacts the firm’s willingness to invest in infrastructure or service improvements. Use financial models and historical data to assess trends in investment and profitability before and after the implementation of profit-sharing. Regulatory Impact Assessment Regulatory Goals: analyse if the profit-sharing model meets the goals of controlling excessive profits and protecting consumers. Compliance and Enforcement: assess how effectively the model is implemented and monitored. Review regulatory documentation, compliance reports, and enforcement outcomes to assess the impact. F. So, how does average cost pricing rule fit in or relate to (A) through (D)? EXAMS --> Exams to comprise two components: Component 1 (0.65) Vocabulary; multiple choice; matching concepts to cases/conditions; T/F Component 2 (0.35) Status quo problems PRICE POLICY AUDITING TERM PROJECT --> Apply 2-3 utility firms in different regions. 1.Steps to audit the pricing policy Revenue and earnings Analysis Compare Earnings with Regulatory Allowances Profit Margins Earnings Volatility Cost Analysis (Operating, Capital, Allocation of Shared Costs) Price-Setting Methodology reviews based on priors and other elements Demand and Revenue forecasting Validate accuracy used in pricing policy (development) Assess whether over- or under-estimation of demand could lead to unfair pricing or excessive earnings. Cross-subsidization Check Subsidies and Incentives Identify any government subsidies or incentives and evaluate their treatment in the pricing model. 2.Tools and Techniques Earnings Comparisons: Compare reported earnings with regulatory benchmarks or peer utilities. Financial measures and analysis: to assess the fairness of pricing. Vertical analysis and Horizontal Analysis Variance Analysis: Analyse variances between projected and actual revenues to identify anomalies. Beneish, Dechow F, Modified Jones, Altman Z, Ohlson O-Score Cost-Benefit Analysis: Ensure pricing reflects a balance between service quality and consumer affordability. 3.Challenges with Auditing Information Asymmetry Regulatory Lag Political and Social Pressures: Balancing regulatory fairness with societal demands for affordable services. Outcomes of the Audit Confirm whether the utility’s pricing policy justifies its earnings within regulatory guidelines. Highlight overpricing, inefficiencies, or cross-subsidization. Recommendations Course Outline --> 1. The Role of Government Introduction to the course. The making of a regulation. Possible instrument choices. Why one instrument over another? Social Cost Benefit Analysis. Consequences of regulation. 2. Markets Types of markets: competitive, monopoly, monopsony, oligopoly, oligopsony, and monopolistic competition. Measurement of consumer surplus and producer surplus. The competitive market and economic efficiency. Monopolies and dead weight loss. Excluding (highly) competitive markets, can dead weight loss exist in other mentioned types of markets? If so, Are they as severe as the monopolistic case? Gains and losses from government intervention: price controls, price supports, taxes, subsidies, tariffs, import quotas. Oligopoly and collusion. Cournot-Nash equilibrium. Bertrand. competition. More on efficiency, relative to the perfectly competitive market model. 3. The Dominant Firm and Strategic Competition The dominant firm and the competitive fringe. Limit pricing and methods for deterring entry. 4. Introduction to Economic Regulation. Motivation behind economic regulation potential instruments for regulation. Goals of regulation. Historic background Stigler, G. J. (1971). The Theory of Economic Regulation. The Bell Journal of Economics and Management Science, 2(1), 3–21. 5. Public Enterprise The origins of public ownership as a way to regulate economic activity. Public vs Private ownership. Does the threat of nationalization/municipalization discipline private firms? 6. Regulating Natural Monopolies Electric Power, Natural Gas & Water Service Examples. Theory of natural monopoly. TASK: Monopolistic Pricing development for the prior mentioned services. (1) Hedonic Pricing as a gauge for willingness to pay (2) identifying and verifying cases of monopolistic pricing practices, where ambiances to vary: Price Discrimination (first, second and third degree); Peak-Load Pricing; Two-Part Tariff; Penetration Pricing Average Cost Pricing Rule Hayes, A. (2022). Average Cost Pricing Rule. Investopedia Kwoka, J. E. (2006). The Role of Competition in Natural Monopoly: Costs, Public Ownership, and Regulation. Review of Industrial Organization, 29(1/2), pages 127–147 TASK: after analysis of above article there’s much interest in development counterparts for ambiances of interest. 7. Franchise Bidding Concept and Examples Using franchise bidding as an alternative to regulation in the case of a natural monopoly. Issues with franchise bidding. Zupan, Mark A. (1989). The Efficacy of Franchise Bidding Schemes in the Case of Cable Television: Some Systematic Evidence. The Journal of Law & Economics 32, no. 2: 401–56 Identifying resolutions for issue(s) identified in prior article. 8. Dynamic Issues in Natural Monopoly Regulation What should a regulator do when an industry transforms over time due to exogenous changes that can either (1) change the optimal price or (2) change the industry from a natural monopoly into “something else”? Telecommunication Example. The regulation of wireless telephony. The importance of common standards. Lessons from Europe. Spectrum Auctions. 9. Transportation Regulation Surface Freight (Railroads and Trucks) 10. Effects of Regulation Joskow, P. L. and Rose, N. L. (1989). The Effects of Economic Regulation. In: R. Schmalensee & R. Willig (ed.), Handbook of Industrial Organisation, Edition 1, volume 2, chapter 25, pages 1449-1506, Elsevier. TASK: much emphasis on applying section 4, “Methodologies for Measuring the Effects of Regulation” to real cases based on above literature. Chambers, D., Collins, C.A. & Krause, A. (2019). How Do Federal Regulations Affect Consumer Prices? An Analysis of the Regressive Effects of Regulation. Public Choice 180, 57–90 TASK: first, for known cases will attempt to verify causal relation between gov’t regulations and consumer prices (or welfare). Pursue with ambiances of interest to draw conclusions. Bootleggers and Baptists Yandle, B. (1989). Bootleggers and Baptists in the Market for Regulation. In: Shogren, J.F. (eds) The Political Economy of Government Regulation. Topics in Regulatory Economics and Policy Series, vol 4. Springer. Is such the same as rent seeking? 11. Regulations and programmes targeted for elimination In any ambiance there are often may regulations or acts targeted for elimination; however, policy impact can go beyond welfare loss. What methods are there to determine whether regulation is “doing what it was meant to do”, alongside non-monetised impacts? Impact Evaluation overview. AGAIN: policy impact can go beyond welfare loss. What methods are there to determine whether regulation is “doing what it was meant to do”, alongside non-monetised impacts? Impact evaluation overview: Wikipedia Contributors. (2024). Impact Evaluation. Wikipedia Note: will have intimate tangible and practical logistics for impact evaluation with chosen case studies. 12. Externalities Cost-Benefit Approach (CBA): Harvey, J. (1994). Externalities and Cost-Benefit Analysis. In: Economics Revision Guide. Palgrave, London. Development for positive and negative cases: TASK: for CBA will not shove “Kool-Aide” stats and indifference curves to your face; you will build real evaluation examples with intelligence and real raw data. For the monetised case make use of credible cost estimation guides for development; likewise for benefits. Identifying costs and benefits from the potential agents or elements. Note: non-monetised benefit estimation guides also exist. How to tabulate or model w.r.t. discount rate(s) concerning NPV or IRR? To really comprehend one must know how to build. Impact Evaluation methods review TASK: Impact Evaluation for market failure (chosen ambiances) Modelling Externalities for Environmental Regulation: Fritsche, U.R. (1994). Modelling Externalities: Cost-Effectiveness of Reducing Environmental Impacts. In: de Almeida, A.T., Rosenfeld, A.H., Roturier, J., Norgard, J. (eds) Integrated Electricity Resource Planning. NATO ASI Series, vol 261. Springer, Dordrecht. TASK: can we make the literature of Fritsche practical for ambiance of concern? Attempt with development logistics and tangible data (sources). Ross, S. (2021). How is a Market failure Corrected? Investopedia TASK: gov't intervention such as taxes, tariffs, subsidies, and trade restrictions to correct market failure. How are such modelled or how are the quantities derived to correct market failure? 13. The Value of Life Why do we need to put an economic value on life? The calculation of the value of life and how it is used in economic analysis. Is there adjustment for value of a statistical life (VSL) concerning inflation and Real Income Growth? Albrecht, Gary R. (1992). Issues Affecting the Calculated Value of Life, Journal of Forensic Economics, vol. 5, no. 2, pp. 97–104 TASK: method in above article may be adopted. Will like active pursuits with such. Incorporate inflation and real income growth if not incorporated. Disability-adjusted life year (DALY) Concept and role in health economics Calculation Quality-adjusted life years (QALYs) Concept and role in health economics Calculation Supporting Articles: Prieto L, Sacristán JA. (2003). Problems and Solutions in Calculating Quality-Adjusted Life Years (QALYs). Health Qual Life Outcomes.1:80. Sassi, F. (2006). Calculating QALYs, Comparing QALY and DALY Calculations, Health Policy and Planning, Volume 21, Issue 5, Pages 402–408 TASK: to compute DALY and QALY for various ambiances of interest; above prior two articles for active pursuits. Cost-Effectiveness Analysis Analytical structure of Cost-Effectiveness Analysis Quantitative structure of Cost-Effectiveness Analysis Has logistical flow as well 14. Environmental Regulation Background of environment regulation [in the ambiances of concern]. Price versus quantity restrictions. Command and control versus market-based incentive programs. Markets for clean air Idea and basics of auctions The example of markets for SO2 permits and how they operate. Assisting literature: Emissions Trading Programmes: (How Do Emissions Trading Programs Work? | US EPA, 2024) Frequent Questions about the Acid Rain Program Allowance Auction | US EPA. (2023, September 20) TASK: the following two articles to analyse, then pursue development with more modern data and compare with years treated in the articles-- Joskow, P. L., Schmalensee, R., & Bailey, E. M. (1998). The Market for Sulfur Dioxide Emissions. The American Economic Review, 88(4), 669–685. Hitaj, C. & Stocking, A. Market Efficiency and the U.S. Market for Sulfur Dioxide Allowances. Congressional Budget Office, WP 2014-01 Electricity Tariff Design Concept Model Freier, J. And von Loess, V. (2022). Dynamic Electricity Tariffs: Designing Reasonable Pricing Schemes for Private Households. Energy Economics 112, 106146 Rahman, T. et al (2024). Methods and Attributes for Customer-Centric Dynamic Electricity Tariff Design: A Review. Renewable and Sustainable Energy Reviews, Volume 192, 114228 TASK: for such two articles to develop ETs for ambiances in question; compare to realised ETs if they exist. 15. The Regulation of Workplace Safety Regulatory approaches to safety evaluation and enforcement. Assessment of the benefits of health and safety legislation TASK: the following article to be analysed, then pursuit of development for ambiance and industry of interest: Thiede I. & Thiede M. (2015). Quantifying the Costs and Benefits of Occupational Health and Safety Interventions at a Bangladesh Shipbuilding Company. Int J Occup Environ Health. 21(2):127-36 16. Economics Models in Economics of Regulation Public Interest Theory of Regulation; Capture Theory of Regulation (Stigler-Peltzman); Peltzman model; Principal-Agent models; Moral Hazard and Adverse Selection Models; Cost-Benefit Analysis. Building empirical cases for each prior: Hypothesis Formation -> Data Collection (firm-level data, market outcomes, regulatory filings, political contributions, etc.) -> Methodology Selection (regression, hedonic, differences-in-differences, etc., etc., etc.) -> Empirical Analysis (conduct the analysis, testing the hypothesis against the data. Look for patterns that either confirm or challenge the theoretical model ) -> Interpretation Note: to have active in-class development for each. Prerequisites: Microeconomics II, Calculus for Business & Economics III, International Financial Statements Analysis I & II
Industrial Organisation Industrial Organisation is concerned with the study of imperfect competition (i.e., functioning of markets with few competitors). The course will explore various market structures and the competitive and cooperative strategies employed by profit maximizing firms when there are few firms, entry barriers, differentiated products, and/or imperfect information. Textbook of Interest --> Pepall, L., Richards, D. & Norman, G. Industrial Organization: Contemporary Theory and Empirical Applications, Wiley Assisting Text --> Choi, P., Dunaway, E. and Munoz-Garcia, F. (2021). Industrial Organisation – Practice Exercises with Answer Keys. Springer Cham Assessment --> Class Participation 4-5 Problem Sets Labs 2-3 Examinations Term Project(s) LABS --> NOTE: labs concern data analysis and simulations/games. Labs will align with course topics. 1. Simulations: for the simulations/games a player will consist of a certain number of students in a group. Notes and data recorded during games to prove quite essential. After each game students will be asked to generate a written summary based on questions developed by instructor to be rated. Questions will be relevant to the many topics in lectures. Scheduled simulations/games activities from the following: < https://economics-games.com < https://www.moblab.com/moblab-industrial-organization-courses 2. Advance repetition of chosen activities from Economics of Regulation course. 3. Demand Estimation A. The quality of empirical work depends heavily on the data used. Richer data, when accessible and cost-effective, is preferable to relying on assumptions. However, research involves navigating these tradeoffs and being transparent about them.For demand estimation, data typically includes: Observation Unit: Quantity of product purchased (e.g., 12 oz Bump Belly beer) with its price, for a specific time period and location (e.g., store, ZIP code, or state). Market Definition: Define the relevant market and set of products, including an outside option (e.g., non-purchase). Data Types: Consumer-level purchase data is abundant but often aggregated. Less aggregated data allows for more detailed models. Supplementary Information: Product characteristics (e.g., alcohol content, calories) can be merged with census data for consumer demographics. Date information can help track input prices. Data Sources: Industry organizations, marketing firms (e.g., AC Nielsen), proprietary manufacturer data, and consumer expenditure surveys. Challenges: Obtaining good data often requires creativity, persistence, and substantial effort. While theory can help fill gaps, robust data is crucial for credible research. Note: Data collection and wrangling are essential for credible demand estimation, requiring careful and creative investigation. B. Guiding text for manual R development: Berry, S. T. & Hale, P. A. (2021). Chapter 1 – Foundations of Demand Estimation. In: Handbook of Industrial Organisation, 4(1), pages 1 – 62 C. Development with the R package BLPestimatoR; given package comes with a vignette. This package will be applied despite whatever results from (B). Compare with any findings from (B). TERM PROJECTS ---> A. Regulation and Market Entry Note: since regulation can vary drastically across industries, focus on one industry. Focus on an industry with heavy regulations. Project Idea: Analyse how government regulations impact market entry and the behavior of new firms. Key Questions: How do government regulations act as barriers to entry? What are the common behaviors and strategies of new firms in heavily regulated markets? How do these regulations affect competition and innovation? Data Sources: regulatory filings, market entry data, case studies of industries with heavy regulation. Data Analysis (descriptive analysis, regression models (not necessarily OLS, case study analysis) Behavioural Analysis of New Firms (regulatory compliance, innovation & adaptation, market positioning) Note: research concerns typical APA research/report format. I want an IDE based version with R or Python. Commentary with code develop and LaTeX use throughout. B. Innovation and Market Structure Project Idea: Examine how different market structures (monopoly, oligopoly, etc.) influence the rate and direction of innovation within an industry. Key Questions: How do monopolistic and oligopolistic market structures affect innovation compared to competitive markets? What is the relationship between market concentration and the rate of innovation? How does the structure of the market influence the direction of innovation (e.g., product vs. process innovation)? Data Sources: Patent data (USPTO and EPO ) R&D expenditure data Company financial statements, industry reports, or databases like Compustat for R&D spending. Gather data on the R&D expenditure as a percentage of revenue across different firms and industries Market concentration metrics. Calculate market concentration using metrics like the Herfindahl-Hirschman Index (HHI) and Concentration Ratio (CR4). Obtain market share data from industry reports, databases like IBISWorld, or government sources (e.g., FTC). Data Analysis Descriptive Analysis, Summarize the market structure of each industry based on concentration metrics. Visualize the relationship between market structure and innovation indicators like patent counts and R&D spending. Regression models Use regression analysis to explore the relationship between market structure (HHI, CR4) and innovation outputs (patents, R&D expenditure). Include control variables like firm size, industry growth, and technological intensity. Innovation Direction Analysis Classify patents into categories (e.g., product vs. process innovation) and analyze the direction of innovation. Assess whether certain market structures favor specific types of innovation. Behavioural Analysis Firm Behavior: examine strategies in R&D, innovation, and market adaptation across different market structures. Cross-Market Analysis: compare the behavior and innovation approaches of firms in monopoly, oligopoly, and competitive markets. Note: research concerns typical APA research/report format. I want an IDE based version with R or Python. Commentary with code develop and LaTeX use throughout. COURSE TOPICS --> 1- Introduction • Introduction to Industrial Organization: PRN Chapter 1. • Review of Basic Microeconomic Theory: – Technology and Costs. PRN Chapter 4.1 (excluding 4.1.3). – Competition versus Monopoly. PRN Chapter 2 (excluding 2.3 and 2.4). 2- Market Structure and Market Power • Concentration Measures and Evidence. PRN Chapter 3. • Cost and Non-Cost Determinants of Market Structure. PRN Chapter 4 (excluding 4.1.1, 4.1.2, and 4.6). 3- Monopoly Pricing Schemes • Durable Goods. PRN Chapters 2.3.3, and 2.3.4. • Third degree price discrimination. PRN Chapter 5 (excluding 5.6). • First degree price discrimination. PRN Chapter 6 (excluding 6.1.2, and 6.4). • Second degree price discrimination. PRN Chapter 6(excluding 6.1.2, and 6.4). • Tie-in sales and bundling. PRN Chapter 8 (excluding 8.1.1, 8.1.2, 8.1.3, and 8.5). 4- Product Variety and Quality Under Monopoly • Product Variety. PRN Chapters 7.1, 7.2 and 7.3. • Product Quality. PRN Chapter 7.5.1. 5- Basic Oligopoly Models • Game Theory: Static Games. PRN Chapters 9.1-9.3 or Gibbons Chapter 1 (pp 1-12). • Static Competition: – Homogeneous Goods: PRN Chapters 9.4-9.5 and 10.1. or Gibbons Chapter 1.2.A. – Differentiated Goods: PRN 10.2-10.3, or Gibbons Chapter 1.2.B. • Game Theory: Dynamic Games. PRN Chapter 11 (excluding 11.5), or Gibbons Chapters 2.1, 2.2 and 2.3 (skip the complex applications). 6- Anticompetitive Behavior and Antitrust Policy • Entry Deterrence. PRN Chapters 12 (excluding 12.2.2, 12.3.1, and 12.5), 13.2.2 and 13.3.2. • Predatory Conduct. PRN Chapter 13 (excluding 13.3.1, 13.3.3, and 13.6). • Price Fixing, Repeated Interaction, and Antitrust Policy. PRN Chapter 14 (excluding 14.4.1 and 14.5) and Appendix to Chapter 1. 7- Mergers • Horizontal Mergers. PRN Chapter 15 (excluding 15.5.2, and 15.7). • Vertical and Conglomerate Mergers. PRN Chapter 16 (excluding 16.3, 16.4, 16.6, and 16.7). 8- Non-Price Competition • Advertising. PRN Chapter 19 (excluding 19.5 and 19.6). 6 • Innovation (Research and Development). PRN Chapter 20 (excluding 20.3, 20.5, and 20.6) Prerequisites: Microeconomics III, Mathematical Statistics. Co-requisite or Prerequisite: Economics of Regulation Computational Studies of Mergers & Acquisitions Course serves to introduce students to practical methods and tools for the investigation of markets and industries welfare. Course structure serves to able students to administer case studies and possible future scenarios intimately. Complacency, effort and devotion are keys to success in this course. COMPONENTS OF COURSE: (A) Empirical Investigations (with R environment). The following are “stand-by articles” to possibly further develop technical hurdles in (B) if deemed constructive. Sectors or industries are subject to change in the interest of (B) and more modern data availability; also possibly serving as extra credit. Sumner. (1981). Measurement of Monopoly Behavior: An Application to the Cigarette Industry. The Journal of Political Economy, 89(5), 1010–1019. Goldberg. K, (1995). Product Differentiation and Oligopoly in International Markets: The Case of the U.S. Automobile Industry. Econometrica, 63(4), pages 891–951. Mullin, W. & Genesove, D. (1998). Testing Static Oligopoly Models: Conduct and Cost in the Sugar Industry, 1890-1914. The Rand Journal of Economics, 29(2), 355–377 Nevo, A. (2011). Empirical Models of Consumer Behaviour, Annual Reviews, Volume 3, pp 51 – 75 Valletti, T., and Zenger, H. (2021). Mergers with Differentiated Products: Where Do We Stand? Rev Ind Organ 58, 179–212 (B) Immersive Computational Participation (with R environment) (B1) Market Power: Concentration Ratio, Herfindahl-Hirschman Index and Lerner index Baker, J. B. & Bresnahan, T. F. (1988). Estimating the Residual Demand Curve Facing a Single Firm, International Journal of Industrial Organisation, 6(3), pp 283-300 Bresnahan, T. F. (1989). Chapter 17 – Empirical Studies of Industries with Market Power. In: Handbook of Industrial Organisation, Volume 2, pages 1011 – 1057 Nevo, Aviv. 2001. “Measuring Market Power in the Ready-to-Eat Cereal Industry.” Econometrica, 69(2): 307–42 Note: consider other industries today besides cereal Market Definition (to pursue): Market Definition - EE&MC GmbH. (n.d.). https://www.ee-mc.com/tools/market-definition.html > (B2) Demand Estimation Development: Review and advance recital of labs (A) and (B) from IO course. BLPestimatoR R package immersion and its motivation Berry, S., Levinsohn, J., & Pakes, A. (1995). Automobile Prices in Market Equilibrium. Econometrica, 63(4), 841–890. Note: consider other industries today besides automobiles Nevo, Aviv. 2000. “A Practitioner’s Guide to Estimation of Random-Coefficients Logit Models of Demand.” Journal of Economics and Management Strategy, 9(4): 513–48 Gandhi, A. & Nevo, A. (2021). Chapter 2 – Empirical Models of Demand and Supply in Differentiated Products. In: Handbook of Industrial Organisation, 4(1), pages 63 – 139 (B3) Merger Simulation Models Oliver Budzinski & Isabel Ruhmer, (2010), Merger Simulation in Competition Policy: A Survey, Journal of Competition Law and Economics, 6(2): pages 277-319. Merger Simulation Models - EE&MC GmbH. (n.d.). https://www.ee-mc.com/tools/merger-simulation-models.html Further literature (optional): Epstein, Roy J., and Daniel L. Rubinfeld. (2002). Merger Simulation: A Simplified Approach with New Applications. Antitrust Law Journal 69, no. 3: pages 883–919. Wen-Jen Tsay & Wei-Min Hu (2022) Merger Simulation based on Survey–Generated Diversion Ratios, European Competition Journal, 18:2, 249-264 (B4) Merger Simulation via designated R package antitrust Package also comes with a vignette for antitrust R package: https://cran.r-project.org/web/packages/antitrust/vignettes/Reference.html (B5) Merger Guidelines Note: stages B1 to B4 serve as “walkthrough” to apply guidelines. Premerger & Acquisition Guidelines Project (2-3 mergers or acquisitions) Horizontal merger guidelines: Department of Justice & Federal Trade Commission Merger Guidelines (check website or use search engine). Also, apply also its commentary document) Supporting literature Wang, X. and Vistnes, D. (2013). Economic Tools for Evaluating Competitive Harm in Horizontal Mergers. Thomson Reuters Vertical mergers literature: Wong, E. K. (2018). Antitrust Analysis of Vertical Mergers: Recent Developments and Economic Teachings. ABA Antitrust Source Additional literature: Walker, J. (2020). Economic Analysis in Merger Investigations. 2020 OECD Global Forum on Competition Discussion Paper (B6) Evaluating the Performance of Merger Simulation (C) Collusion literature to emulate for interests: Bolotova, Y., Connor, J. & Miller, D. (2008). International Journal of Industrial Organization. 26. 1290-1307. Bonnet, C. & Bouamra-Mechemache, Z. (2019). Empirical Methodology for the Evaluation of Collusive Behaviour in Vertically-Related Markets: An Application to the "Yogurt Cartel" in France. International Review on Law & Economics, 61, 105872 (D) Cartel Detection methods Price Parallelism (correlation coefficients and Granger causality tests) Price Dispersion (coefficient of variation, standard deviation, range of prices) Analysis of market share stability Production Quotas (examining production levels against capacity utilization) Structural Break Tests (Chow test, Bai-Perron test) Structural Models (estimating models with and without collusion scenarios and comparing fit) Reduced Form Models (regression analysis) Variance screen (calculating variance ratios) (E) Damage Calculation Damage Calculation - EE&MC GmbH. (n.d.). https://www.ee-mc.com/tools/damage-calculation.html (F) Antitrust Cases (F1) Analysing antitrust cases (2-3). Develop a framework for analysing antitrust court cases. Acquire the legal documentation and other needed data. Will make use of acquired intelligence, skills and tools stemming from (A) through (E). Do cases outcomes agree with your analyses? (F2) Predicting Mergers and Acquisitions Note: various other industries may be pursued. Training and testing of models expected. Adelaja, A.O., Nayga, R.M., & Farooq, Z. (1999), Predicting M&A in the Food Industry. Agribusiness, 15(1), 1-23. R. Moriarty, H. Ly, E. Lan and S. K. McIntosh, "Deal or No Deal: Predicting Mergers and Acquisitions at Scale," 2019 IEEE International Conference on Big Data (Big Data), 2019, pp. 5552-5558 Prerequisites: Microeconomics III, Industrial Organisation, Mathematical Statistics
Public Finance The branch of economics that assesses the government revenue and government expenditure of the public authorities, and the adjustment of one or the other to achieve desirable effects and avoid undesirable ones. Course is just as important as monetary policy courses, hence prerequisites given are necessities, forcing upper level standing for recognition of the importance of practical skills in public finance, and for strong activity development in short time; sound footing for good reacquaintance with advance pursuits in the future. NOTE: an 18 weeks course, with 2 hours per session and 3 sessions per week; labs hours are unique to session hours. Course Literature --> NOTE: there will be no standard text for this course. Topics and literature given to be applied. Tools for labs and written paper --> Gov’t Accounts (municipal, provincial and national) R + RStudio Microsoft 365 Assessment --> Quizzes 10% Groups Labs (highly quantitative substance) 50% Note: for labs instructor traverses thoroughly the ideas, purposes and logistics for implementation; implementation is the responsibility of student groups. The given labs to be done in the most constructive order THAT CONNECTS WELL WITH THE MANDATORY COURSE TOPICS: Tasks mentioned in mandatory course topics 20% Group Written Term Paper 20% --> Groups will complete a term paper (15 to 20 pages) on a fiscal policy of their choice. A policy must be selected by no more than one group (on a first come basis). You will document your fiscal policy in a way that uses the theories, skills and tools from course topics and labs. The assignment guide will give more refined details. Due 1 week after final lab. GROUP LABS --> 1. Redistribution A. Public Revenue for 30-40 years compared to various dynamics (employment, household income, household taxes and business taxes)in quarterly increments. Exploratory data analysis development in R. Note: time series analysis (including cross-correlation and cointegration) is also applicable. B. Density plots for income distribution and apply log transformation... Income density plots for a society with inequality at the bottom and a society with inequality at the top. Development of income thresholds: Low income: income that is less than 60% of the median Middle income: income between 60% and 200% of the median High income: income that is greater than 200% of the median To really understand the difference between the two societies, we need to look at the income distributions using a logarithmic transformation. Under a (”one-to-one”) log transformation: {1, 10, 100, 1000} --> {0, 1, 2, & 3}; such compresses the distribution, allowing to better see both the left and right tails. Seeing these tails is important because that’s where the inequality lives. Using a log transformation, replot our income density curves. Evolution of income distribution for chosen amount of years Estimating elasticities of taxable income for various income brackets for a chosen economy and years with a common method. C. Measuring Redistribution Note: analytical structure and logistics before implementation. Compare development with related R packages. Measuring vertical distribution Gini coefficient and Lorenz curve; Kakwani Index; Suits Index; Effective Tax Rate; Redistributive Effect) Regression models for impact of taxation or gov’t spending on inequality; causal designs Measuring horizontal distribution Tax incidence Analysis; Coefficient of Variation ; Concentration Index; Regional Disparities; Benefit Incidence Analysis; Decomposition Methods Regression models to compare how similar income groups are treated. D. Microsimulation Models Note: structure, key components and logistics of chosen models before implementation. Based on the article of Bourguignon and Spadaro in course outline. TAXSIM with usincometaxes, or EUROMOD Simulate tax system to assess distribution of taxes and benefits across individuals or households, Can measure both horizontal and vertical equity by observing ow tax reforms impact different income groups or regions. 2. National Accounting Assists for this lab: SNA 2008 < https://unstats.un.org/unsd/nationalaccount/sna2008.asp < https://unstats.un.org/unsd/nationalaccount/impUNSD.asp Statistics for production levels identifying shifting labour forces. Using aggregate National Accounts data to estimate future tax revenues for main taxes. Methods (as in plural) for measuring the size of gov’t (ask ChatGPT and pursue multiple tangible and practical methods) Note: may not exclusively depend on national accounts. 3. Elements in a Budget Analysis (BA) Balaguer-Coll M.T. (2018) Budget Analysis. In: Farazmand A. (eds) Global Encyclopedia of Public Administration, Public Policy, and Governance. Springer, Cham. PP 401 - 409 Analysis of BA public record at DD/MM/YYYY Also entitlement versus discretionary profiling Analysis of Public Expenditure at “end cycle” compared to prior; include applying the mentioned budget indicators in above literature with real data. 4. Forecasting (quantitative and qualitative techniques) Literature options for development: International Monetary Fund. (1985). " Chapter 9 WORKSHOP 7 Revenue Forecasting". In Financial Policy Workshops. USA: International Monetary Fund GFOA: Financial Forecasting in the Budget Preparation Process Williams, D. and Calabrese, T. (2019). The Palgrave Handbook of Government Budget Forecasting. Palgrave Macmillan Model for baseline budget projections. Will implement some elements. 6. Tools for Measuring Taxes Related to Capital and Labour Will choose topics from the following texts to implement Sorensen, P. B. (2022). Measuring the Tax Burden on Capital and Labour. MIT Press Li, H. and Pomerleau, K. Measuring Marginal Effective Tax Rates on Capital Income. Fiscal Fact No. 687, 2020 Li, H. (2017). “Measuring Marginal Tax Rate on Capital Assets. Tax Foundation. Overview of the Tax Foundation’s Tax and Growth Model”. Tax Foundation 7. To analyse and develop towards fiscal policy concerns: Auerbach, A. J. and Kotlikoff, L. J. (1983). National Savings, Economic Welfare, and the Structure of Taxation." Behavioral Simulation Methods in Tax Policy Analysis, edited by Martin Feldstein. Chicago: University of Chicago Press, (1983), pp. 459-498. Note: NBER version exists Try to use such to project respective policy or scenario for a past period; set prior conditions/parameters/values towards the simulations, and observe accuracy. Note: not concerned with periods of economic shocks. 8. Auerbach, A. J., & Kotlikoff, L. J. (1987). Evaluating Fiscal Policy with a Dynamic Simulation Model. The American Economic Review, 77(2), 49–55 Try to use such for a past period; set prior conditions/parameters/values towards the simulations. Compare to realised data; account for economic shocks. Will also project a future scenario. 9. Dynamic Scoring (to implement/simulate for various conditions) Coherent concept Scope of structure and modelling. Logistics towards implementation The following gives a more rounded idea: Mankiw, N. G. and Weinzierl, M. (2004). Dynamic Scoring: A Back-of-the-Envelope Guide. NBER Working Paper 11000 Lynch, M. S. and Gravelle, J. G. (2021). Dynamic Scoring in the Congressional Budget Process. CRS Report R46233 10.Tax Incentives Cost EITC Cost Williams, E., Waxman, S. and Legendre, E. (2020). How Much Would a State Earned Income Tax Credit Cost in Fiscal Year 2021? Centre on Budget and Policy Priorities Interest in above article is applying: -Data Sources (substitute country data of interest) -Three Steps to Estimating the Cost of a State EITC Note: there are benefits (monetised & non-monetised) to consider for the respective EITC Cost-Benefit Analysis (CBA) Chen, D. (2015). The Framework for Assessing Tax Incentives: A Cost – Benefit Analysis Approach. UN Paper for Workshop on Tax Incentives and Base Protection New York, 23-24 April 2015 Kronfol, H. and Victor Steenbergen, V. (2020). Evaluating the Costs and Benefits of Corporate Tax Incentives: Methodological Approaches and Policy Considerations. The World Bank Group Note: highlight non-monetised benefits as well. 11. Cost-Benefit Analysis for public projects/investments From provincial or city agendas will identify some proposed projects or investments and apply Cost-Benefit Analysis. There are professional guides to build your CBA rather than accepting “phantom numbers”. Monetised impacts. Make use of cost estimation guides for development; likewise for benefit. RIMS II, IMPLAN, Chmura, LM3 or REMI may have use. Non-monetised impacts There exists guides Discounting development Gollier, C. (2002). Discounting an Uncertain Future. Journal of Public Economics, Vol. 85 Issue 2, pp. 149 – 166 Weitzman, Martin, L. 2001. Gamma Discounting. American Economic Review, 91 (1): 260-271. Freeman, M. C. and Groom, B. (2016). How Certain are We about the Certainty-Equivalent Long Term Social Discount Rate? Journal of Environmental Economics and Management, Vol 79, pp. 152 – 168 Campbell, H., & Brown, R. (2003). Benefit-Cost Analysis: Financial and Economic Appraisal using Spreadsheets (pp. 194-220). Cambridge: Cambridge University Press 12. Externalities (positive and negative) How to identify externalities in the real world Measuring Externalities (to be implemented) Cost of Damages and Cost of Control Adhikari S.R. (2016) Methods of Measuring Externalities. In: Economics of Urban Externalities. SpringerBriefs in Economics 13. Fiscal Measures (with gov’t data) PART A Benz, U. and Fetzer, S. (2006). Indicators for Measuring Fiscal Sustainability: A Comparison of the OECD Method and Generational Accounting, FinanzArchiv/ Public Finance Analysis, Vol. 62, No. 3, pp. 367-391 (25 pages). PART B Fiscal Health Analysis for chosen public services, etc. Scale choices (provincial or city or borough). Assisting guides for pursuits: Suarez V., Lesneski C. and Denison, D. (2011). Making the Case for using Financial Indicators in Local Public Health Agencies. Am J Public Health 101(3), pages 419-25. McDonald, B. D. (2018). Local Governance and the Issue of Fiscal Health, State and Local Government Review, 50(1), 46–55. NOTE: augment with Beneish, Dechow F, Modified Jones and Altman Z 14. Fiscal Consolidation with General Equilibrium Treatment (pursuit development for ambiance of interest) Wouters, R. (2014). Fiscal Consolidation in General Equilibrium Models, Bank of International Settlements Hurnik, J. (2004). Fiscal Consolidation in General Equilibrium Framework – the Case of the Czech Republic. Prague Economic Papers. vol. 2004(2), pages 142-158. 15. Public Pension Projections Economic Policy Committee and Directorate-General for Economic and Financial Affairs. (2007). Pension Schemes and Projection Models in EU-25 Member States. European Economy Occasional Papers, No.35 The goal is to develop projections for future years. The process for projects will involve comprehension of the schemes, models and relevant data towards projections. Compare with projections of the governments. Determine which scheme and model best projects a public pension in your ambiance. MANDATORY COURSE TOPICS --> 1.Introduction 2.The Public Sector 3.The Idea of Redistribution Vertical distribution and horizontal distribution 4.National Income Accounting 5.Public Goods 6.Public Provision of Private Goods 7.Social Insurance and Redistribution 8.Bourguignon, F., Spadaro, A. Microsimulation as a Tool for Evaluating Redistribution Policies. J Econ Inequal 4, 77–106 (2006). 9.Size of Gov’t & Efficiency PART A Methods of measuring the size of gov’t (ask ChatGPT) PART B In-class comparative development with the following (with ambiances of interest): Berry, W. D., & Lowery, D. (1984). The Measurement of Government Size: Implications for the Study of Government Growth. The Journal of Politics, 46(4), 1193–1206. Garand, J. (1989). Measuring Government Size in the American States: Implications for Testing Models of Government Growth. Social Science Quarterly, 70(2), 487–496. PART C In-class comparative development with the following (with ambiances of interest): Diamond, J. (1990). "9 Measuring Efficiency in Government: Techniques and Experience". In Government Financial Management. USA: International Monetary Fund. Cepal (2015). Methods of Measuring the Economy, Efficiency and Public Expenditure, Annex 7 10.The Institutions and Theory of Taxation (incidence, inefficiencies, optimisation) 11. Taxation in Society (national, provincial, local) Purpose, means of creation, enforcement. Tax models Determining the Marginal Propensity to Consume (MPC) Tax Multiplier Varying MPC among different households. How to determine a practical tax multiplier? Gale, W. G. and Samwick, A. (2014). Effect of Income Tax Changes on Economic Growth. Brookings Institute. Inquisition also with data analysis What macroeconomic models can explain the taxation and labour supply relationship? Followed by analysis of data to vindicate models. Relevance of AD-AS and DAD-DAS with taxation. Analytic modelling/algebraic structure, numerics and simulation scenarios are the concern, NOT curve shifts. 12. Automatic Stabilizers Automatic Stabilizers Design of income tax instruments (households, businesses, sales tax) concerning economic shocks, recessions and expansion. Transfers (unemployment, food funds assistance, Medicare, child credits, other credits, subsidies, etc., etc.). Do all transfers have built in mechanisms for inflation? Identify the quantitative elements. Supporting literature for development for automatic stabilizers (adjust to ambiance and settings): Eilbott. (1966). The Effectiveness of Automatic Stabilizers. The American Economic Review, 56(3), 450–465. Chalmers, & Fischel, W. A. (1967). An Analysis of Automatic Stabilizers in a Small Econometric Model. National Tax Journal, 20(4), 432 Follete, G. and Lutz, B. (2010). Fiscal Policy in the United States: Automatic Stabilizers, Discretionary Fiscal Policy Actions, and the Economy. Federal Reserve Board Mattesini, F. & Rossi, L. (2012). Monetary Policy and Automatic Stabilizers: The Role of Progressive Taxation. Journal of Money, Credit and Banking, 44(5), 825–862. Russek, F. and Kowalewski, K. (2015). How CBO Estimates Automatic Stabilizers. Congressional Budget Office, Working Paper 2015-07 Maravalle, A. and Rawdanowicz, L. (2020). How Effective are Automatic Fiscal Stabilizers in the OCED Countries? OECD Economics Working Papers No. 1635 Tax burden on savings versus tax burden on consumption. Means to vindicate with data analysis. Determining the Marginal Propensity to Save (MPS) Varying MPS among different households. The interaction between MPC and automatic stabilizers. The interaction between MPS and automatic stabilizers. Means to show how government taxation and spending change automatically when real GDP changes (either direction) in the short run with the AD-AS model; analytic modelling/algebraic structure and numerics are the concern, NOT curve shifts. Augment with DAD-DAS modelling and simulation. How to credibly verify that taxation or automatic stabilizers as the cause of significant economy change? 13. Liquidity Trap: key characteristics; examples and causes; consequences; fiscal policy (with the assumption that monetary policy is ineffective) 14.Dynamic Scoring 15.Treasury Budget Investopedia Team (2021). U.S. Treasury Budget. Investopedia Above article has many statements to clarify, and mandatory verification by use of economic models (with real market data) and statistical methods. Such monthly report is observed as a useful indicator of the government's current financing needs, which influences market interest rates. For a deficit, the report details the mix of long, medium, and short maturity debt used to finance it. Concerning bonds, notes and bills, how is the “debt portfolio” constructed to meet the budget or deal with deficits concerning maturities? Should be related to deficit and revenue expectations/forecasting. Is cash flow matching linear programming (or asset-liability LP) practical? If so, is it the best method? Miller, P. J. (1983). Higher Deficit Policies Lead to Higher Inflation. Federal Reserve Bank of Minneapolis. Quarterly Review, Winter Is the title of the article relevant in more modern times? Apply causation validation method(s)? Different ambiances to be considered as well. Catao, L. & Terrones, M. E. (2003). Fiscal Deficits and Inflation. IMF Working Paper WP/03/65 Inquisition upon literature with data. Are the prior two literature harmonic? 16.Budget Analysis and Public Expenditure Management Budget Analysis What is it? Where can you find it? How to analyse such? Balaguer-Coll M.T. (2018) Budget Analysis. In: Farazmand A. (eds) Global Encyclopedia of Public Administration, Public Policy, and Governance, Springer, Cham. PP 401 - 409 Entitlement Spending and Discretionary Spending. Implicit Obligations(Medicare costs, retirement benefits, social welfare). Are such unique to entitlement spending? Borcherding, T. E. (1985). The Causes of Government Expenditure Growth: A Survey of the U. S. Evidence. Journal of Public Economics 28(3), 359 – 382 Does above journal article capture all causes in Chand’s article? Relevant to modern data? Potter, B. H. and Diamond, J. (1999). Guidelines for Public Expenditure Management. International Monetary Fund Note: establish provincial/city counterparts to prior [with identification of the balanced budget requirement law(s), ex-post BBR and ex-ante BBR]. Design and Conduct of Public Expenditure Reviews. Effect of Gov’t Spending on Economy Gov’t Spending Multiplier How to credibly verify that gov’t spending is the cause of significant economy change?. Crowding-Out Effect (COE)? What macroeconomic models can explain COE? Relationship between the multiplier effect and COE. How to establish? Public Deficit. Policies or routines for failure to meet deficit target 17.Budget Forecasting Williams, D. and Calabrese, T. (2019). The Palgrave Handbook of Government Budget Forecasting. Palgrave Macmillan Focus on identifying a robust, fluid framework/model. Then fluid and practical quantitative elements involved. 18. Public Debt Probasco, J. (2021). The National Debt Explained. Investopedia. Evolving debt modelled on prior debt, interest paid on prior debt and prior deficit. Can such be used for highly accurate forecasts? Validate or discredit, along with other forecasting alternatives. Blanchard, O. (2017). Chapter 22 – Fiscal Policy: A Summing Up. In: Macroeconomics. Pearson. Cole, Harold L., (2019). Chapter 16 - Modelling Government Debt and Inflation, In: Finance and Financial Intermediation: A Modern Treatment of Money, Credit, and Banking, Oxford Academic Intemporal Budget Constraint (BC): relating present discounted value (PDV) of gov’ts obligations to the PDV of its revenues. Some of the elements to consider PDV of remaining tax payments of existing generations PDV of tax payments of future generations PDV of all future gov’t consumption Inflation Current gov’t debt What models best represent or analyse w.r.t. such above elements? Will be implemented and tested. Fiscal Indicators Involving: budget balance, debt, revenue, expenditure. Analysis of IMF’s semi-annually published Fiscal Monitor. Options for Managing a Sudden Rise in Public Debt Particularly for Fiscal consolidation the following may be good development with inclusion of modern data, but countries outside of OECD may be an issue: Molnár, M. (2012). Fiscal Consolidation: What Factors Determine the Success of Consolidation Efforts? OECD Journal: Economic Studies, Vol. 2012/1. 19.Cost-Benefit Analysis (CBA) Must be well rounded and highly logistical to serve computational pursuits Recognition of stakeholders Costs and Benefits Monetised elements Non-monetised elements Discounting (active development) Gollier, C. (2002). Discounting an Uncertain Future. Journal of Public Economics, Vol. 85 Issue 2, pp. 149 – 166 Weitzman, Martin, L. 2001. Gamma Discounting. American Economic Review, 91(1): 260-271. Freeman, M. C. and Groom, B. (2016). How Certain are We about the Certainty-Equivalent Long Term Social Discount Rate? Journal of Environmental Economics and Management, Vol 79, pp. 152 – 168 Tools such RIMS II, IMPLAN, Chmura, LM3 may factor into CBA. 20. Externalities Positive Externalities Negative Externalities & Resolutions 21.Public Transactions Finance, Pricing and Penal Transactions A. Finance and Revenue Management in Public Transportation A1.Financial modelling via financial statements for chosen service A2. Empirical Modelling and Forecasting: Skinner, D., Waksman, R. & Wang, G. H. (1983). Empirical Modelling & Forecasting of Monthly Transit Revenue for Financial Planning: A Case Study of SCR TD in Los Angeles. Transportation Research Board, Issue # 936. Note: active immersion inquisition upon literature. A3. Conventional Pricing Methods in Public Transportation. Flat-fare, distance-based, zonal, time-based (off-peak discounts), fare capping, subscription/pass-based, means-based (income-based), demand-based. For the mentioned pricing to highlight the advantages and challenges; accompanied by the “algebraic” or mathematical models for each. A4. Social and Economic impacts on Public Transportation Pricing Methods Geographic distribution of population; income inequality and social equity; demographic changes and population dynamic; economic cycles and employment (trends); gov’t subsidies and funding; technological advancements; environmental and sustainability goals; ridership behaviour and elasticity of demand; competitiveness with other transportation modes. A5. For each type of analysis pricing model how can one develop forecasting? Univariate: time series analysis and time series models Multivariate time series treatment Key/prospect variables and feature selection/importance Model selection, estimation, validation, forecasting for specific cases Multivariate regression Key/prospect variables and feature selection/importance Scatter plot matrix for variable pairs (behaviours) Model selection, estimation, validation, forecasting for specific cases A6. Impact Evaluation (instrumental variables, regression-discontinuity, difference-in-differences, co-integration) Validating the claimed causes for hikes or price model change(s). Analysing socioeconomic polices. B. Other Public Services (gov’t IDs, driver’s licenses, postage, etc., etc.) Justifying pricing C. Revenue from Fines Examples: fines from securities exchange commission, trade commission, transportation, and the many other common infractions penalised by other agencies at various gov’t levels. How do fines/penalties contribute to society? Identify the redistribution transmissions for each case. Models for such pricing/fines. Concerning such fines, does the Cost of Damages method, or Cost of Control method, or those of Adhikari S.R. (2016) for measuring externalities translate well? 22. Tax Evasion Richupan, S. (1984). Measuring Tax Evasion: An introduction to Measurement Techniques, Finance & Development, 0021(004), A011 Note: will explore at least two methods that are practical in terms of data acquisition ease and time constraints. Prerequisites: International Financial Statements Analysis II; Microeconomics II; Macroeconomics II, Econometrics, Economic Time Series Econometrics Course will be centered on the R environment with RStudio, with heavy usage of data from various sources for meaningfulness with modelling and forecasting. Students must hone their skills in programming and computation that best serves them towards highly successful completion of course. An intention of this course is not to get cascaded and lost/drowned with (economic and statistical) theory despite prerequisites. Course is about applied econometrics. NOTE: data and computational assignments given to students follow only analytical setup by instructor. Note: this is NOT a frolic theory course where things are done just for the hell of it. You have real goals. Note: it will be quite rare for me to give you “kool-aid” summary statistics; the majority of the times you will be responsible for such development in assignments, projects and exams. NOTE: for competency and relevancy course to encounter applications where structuring and modelling from lectures will serve to introduce such following applications. Applications not necessarily to be introduced in the following sequential order, and WILL be applied multiple times for different topics -- *Cross Sectional Data *Panel Data *Latent Variables (empirical models, observables, unobservables) *Endogeneous Variables versus Exogeneous Variables *Model with Transformed Endogeneous Variables *Forecasting and Error (prevalent throughout course) *Demand and Supply Curves *Elasticities (PED, YED, XED, PES) *Hedonic modelling and estimation *Consumer Growth *Cobb-Douglas and CES *Stochastic Frontier Analysis *Balance of Trade *Gravity Model Estimation (Trade) *Currency Exchange *Real Effective Exchange Rate *Gross Domestic Product 11 variables of interest: gov’t spending, taxation, consumer spending, investment, trade balance, employment, interest rates, inflation, debt, industrial production & manufacturing, sentiment indicators. *Labour Economics applications (logistic models and censored count data) Prototypical Status-Quo Lecturing Textbooks --> Wooldridge, Jeffrey M. Introductory Econometrics: A Modern Approach, Mason, OH: Thomson/South-Western Goldberger, Arthur S. A Course in Econometrics. Cambridge, MA: Harvard University Press R texts (for homework, projects and exams) --> Gentleman, R., Hornik, K., and Parmigiani, G., Use R!, Springer Kleiber C., Zeileis A. (2008). Applied Econometrics with R. Springer-Verlag Sheather, S. J., A Modern Approach to Regression with R, Springer Multiple texts likely will be applied to acquire practical DEVELOPMENT of models with data and R usage; often for personal footing and progress multiple texts are often used. Consult with CRAN if all fails. Note: apart from problems found in textbooks and R sources there will be great initiative to make use of data relevant to the listed above applications. Make use of the above applications topics at times most appropriate towards the given structure outline (may be applied multiple times). Some mentioned applications can be represented by both linear and multi-linear models. Note: course will have multiple R packages conventionally applied to regression. Students must become decent with data acquisition, data wrangling, summary statistics generation and various plots (includes residuals). There will be homework and test problems with natural raw data, given summary statistics for students to verify and/or interpret, etc. In ALL FUTURE projects and assignments students must justify their variables in models with appropriate methods. Will ALSO include the use of training sets, test sets and cross-validation (R packages tidyverse, tidymodelsm mlr3 to serve well for first two and feature importance/selection). NOTE: emphasis on Training/Test sets and Validation NOTE: all projects will be constituted by the R environment with rmarkdown and conversion to pdf documents. Having commentary throughout project, accompanied by written analysis in a word processor (with use of mathematical palette throughout). Some projects may be assigned topics while others to be exploratory. NOTE: for most subjects in this course, cases and problems will not be able to be done by hand, so don’t get intimidated or hoodwinked by professors or instructors who spend most of their time writing rigid things on a board. NOTE: for bivariate models, data to be applied will be small sets (around 25-50 elements at least and at most). NOTE: exams with modules 5 and beyond, the professor will draw some questions with high volume data sets heavily to ACTIVELY apply, hence, students must become well versed in computational skills with R and will be allowed to use their notes. “Watching someone sail a boat is completely different to being on a boat and sailing it in various types of weather.” Besides developing regression models with analysis of parameters students must also be able to interpret summary statistics. Analytical descriptions on paper will also be required. NOTE: projects will increase in difficulty as more topics are treated. Students will also be required to develop a final project. Professor will have a preliminary synopsis of projects to be turned in. NOTE: final major regression project must treat the following: multilinear, Quantile & Logistic. NOTE: emphasis on Training/Test sets and Cross-Validation Grade constitution --> Bivariate Models (exam + homework) 10% Multivariate Regression Models 55% Homework 0.1 Projects 0.5 Exams 0.4 Final Major Regression Project 35% Course will have procured time for lab sessions where professor will only provide analytic modelling guidance. Apart from R packages and R sources conveyed in the “Goody Bag” post the following information can help one in further reducing manual building of models (if one is fast with schemes to be constructive): https://cran.r-project.org/web/views/Econometrics.html COURSE OUTLINE --> 1. INTRODUCTION --Types of Economic Data, Data Access and Reliability A. Data sources, APIs (National Accounts, IMF, OECD, BIS, World Bank, central banks, Eurostat, EUROPA, UN structures and agencies, census, balance of payments, gov’t statistics, etc., etc.). Database introspection, queries with R (using either URL sites, APIs, DBI, dplyr, dbplyr, odbc or R packages). B. Handouts: use of text files, script files, csv files, excel files, addresses, etc. towards R. C. Handouts for data frames: dim(), head(), str(), glimpse() N/A identification. Extraction, or mean input or median input. Dong, Y. and Peng, CY.J. (2013). Principled Missing Data Methods for Researchers. SpringerPlus 2, 222 The $-operation in R when needed dplyr: filter(), select (), mutate(), order(), join(), merge(), scan(), rename() 2. FAST REVIEW OF PREREQUISITE STATISITCS WITH R Probability distributions and their properties Summary Statistics generation Intelligence gathering from skew, kurtosis, density plots, Q-Q plots Correlation types. ggpairs() function, etc. Correlation heat maps Statistical methods for fraud detection with R 3. GLANCE AT ECONOMETRIC MODELS & THE RELEVANT DATA TYPES lance at econometric models, data types -The Idea of Econometrics -TAKE HEED: AFTER MODULE 4, it’s important to determine whether weighted least squares or general least squares is more appropriate than OLS. 4. BIVARIATE REGRESSION BASICS (very short endeavor, but informative towards advanced modules) -Comprehending the variables (what they measure) -Graphical analysis (scatter plot, box plot and density plot) -Correlation -Simple linear regression: finding the means of variables, SDs of variables and correlation coefficient towards obtaining the regression coefficient and intercept. -Ordinary Least Squares (OLS) and the assumptions -Coefficient of determination -Interpretation of summary statistics via OLS -Residuals versus fitted values (RvF), and goodness of fit -Heteroscedasticity in bivariate models? RvF: case with CAPM -Variability in errors; distribution of errors with large sample size -Advance interpretation of summary statistics -Train, Test, Validation -A common mistake people make when describing the relationship between two quantitative variables is that they confuse association and causation. Case: fire damage and number of firefighters sent --> the seriousness of the fire Brian L. Joiner (1981) Lurking Variables: Some Examples, The American Statistician, 35:4, 227 – 233 5. FEATURE SELECTION Note: a feature is the same as a predictor variable; a target is equivalent to a response variable. First, will explore a feature selection method. Will identify the concepts, followed by (practical, tangible and fluid) analytical structure of the method. Then implementation logistics. Then implementation in the R environment. Will make use of datasets with considerable amounts of features. Univariate feature selection method (will be hands-on) Second, will develop correlation heatmaps following. Note: will be emphasized in all modules following. 6. MULTIPLE REGRESSION (MR) NOTE: must independently recognise whether weighted least squares or generalised least squared is better suited than OLS. Mandatory crucial topics are listed --> -Role of Ordinary Least Squares (OLS) in multiple regression -Evidence for variables Heinze, G., Wallisch, C., & Dunkler, D. (2018). Variable selection - A Review and Recommendations for the Practicing Statistician. Biometrical Journal. Biometrische Zeitschrift, 60(3), 431–449. -Role of AIC, BIC, Vuong and HQC Ludden, T.M., Beal, S.L. & Sheiner, L.B. Comparison of the Akaike Information Criterion, the Schwarz criterion & the F test as guides to model selection, Journal of Pharmacokinetics and Biopharmaceutics (1994) 22: 431. Pho, K., et al (2019). Comparison among Akaike Information Criterion, Bayesian Information Criterion & Vuong's test in Model Selection: A Case Study of Violated Speed Regulation in Taiwan. Journal of Advanced Engineering & Computation, 3(1), 293-303. Hannan–Quinn Information Criterion (HQC) contrast to priors -Feature Selection review from (5) compared to priors -olsrr: Tools for Building OLS Regression Models; compare to Heinze et al and module (5) -WLS and/or GLS in multiple regression -Distribution of the OLS/WLS/GLS estimator Get to the point (WLS and GLS treatment also expected): https://www.econometrics-with-r.org/4-5-tsdotoe.html https://www.econometrics-with-r.org/6-5-the-distribution-of-the-ols-estimators-in-multiple-regression.html -Heteroscedasticity in multiple regression and R tools for such -The multiple coefficient of determination -Interpretation of summary statistics via OLS/WLS/GLS for MR estimator in multiple regression. -Train/Test sets and Validation -Wage variations Prospect variables to validate: education, work experience, unionization, industry, occupation, region, and demographics) Coefficients via OLS/WLS/GLS Model Validation Wage conditional probabilities and conditional expectations (for various predictor variables, one at a time or in bulk) w.r.t. data. -Marginal Effects Idea and analytical description of effects Use of R package margins Applications -Multiple Regression applications in Economics -Differences-in-differences Concept and logistics R tools 7. MULTIPLE REGRESSION (continued) Heteroscedasticity, consequences of Log transformations First: observation of the scatter plot matrix to compare the target and possible features; observation of behaviours to observe whether a respective feature should be of higher order or of some other analytical form; or pointless. Second: to adjust for heteroscedastic disturbances and possible limitations or setbacks Implementation cases OLS summary statistics versus Log transformation with OLS, versus WLS summary statistics versus GLS. Serial correlation in time series, consequences of Quasi-differencing; common-factor-restriction; Durbin-Watson test for serial correlation and Breusch-Watson statistic. 8. MULTICOLINEARITY: Detection, consequences and remedies -Correlation matrix for predictor variables. What can you learn? -Distinguish between structural multicollinearity and data-based multicollinearity. -Understand variance inflation factors and how to use them to help detect multicollinearity. -Ways of reducing data-based multicollinearity: Collecting additional data under conditions Different experimental or observational conditions Correlation Heatmaps -Feature Importance/Selection regression method Then compare to univariate feature selection method and module (5) review; then judgement with correlation heatmaps. 9. DUMMY VARIABLES Prior module will reverberate (and possibly the margins package) 10. INSTRUMENTAL VARIABLES (IV), MEASURMENT ERROR, 2SLS, REGRESSION-DISCONTINUITY DESIGNS -Instrumental Variables Holland, S. (2020). Supply, Demand and the Instrumental Variable. Towards Data Science Angrist, J.; Krueger, A. (2001). "Instrumental Variables and the Search for Identification: From Supply and Demand to Natural Experiments". Journal of Economic Perspectives. 15 (4): 69–85. Bound, J., Jaeger, D. A. and Baker, R. M. (1995). "Problems with Instrumental Variables Estimation when the Correlation between the Instruments and the Endogenous Explanatory Variable is Weak". Journal of the American Statistical Association. 90 (430): 443. -Measurement error Wald, A. “The Fitting of Straight Lines if Both Variables are Subject to Error.” Annals of Mathematical Statistics 11:3 (1940): 284–300. Note: there can be other applications. -Two-Stage Least Squares (2SLS) -Regression-Discontinuity (RD) designs --> Imbens G., Lemieux T. Regression Discontinuity Designs: A Guide to Practice, Journal of Econometrics. 2008; 142 (2): 615 - 635 McCrary (2008). "Manipulation of the Running Variable in the Regression Discontinuity Design: A Density Test". Journal of Econometrics. 142 (2), pages 698 – 714 Lee, D. S. and Lemieux, T. Regression Discontinuity Designs in Economics, Journal of Economic Literature 48 (June 2010): 281 – 355 Extend RD to 2SLS? 11. QUANTILE REGRESSION Quantile Regression (quantreg package with manual and vignettes) Scatter Plots are a useful first step in any analysis because they help visualize relationships and identify possible issues (e.g., outliers) that can influence subsequent statistical analyses, or need of regression beyond simple OLS, say, quantile regression (or generalized nonlinear models). Waldmann, E. (2018). Quantile Regression: A Short Story on How and Why. Statistical Modelling, 18(3–4), 203–218. Davino, C., Furno, M., & Vistocco, D. (2014). Quantile regression: Theory and Applications. Wiley Das, K., Krzywinski, M. and Altman, N. (2019). Quantile Regression. Nat Methods 16, 451–452 Comparing with OLS/WLS/GLS (summary statistics and performance). Applications of interest: Growth equations Fitzenberger, B., Koenker, R. and Machado, J. A. F. (2002), Economic Applications of Quantile Regression. Physica-Verlag Heidelberg 12. LOCAL REGRESSION Notion of local regression, model structures and components. Logistics, implementation and summary statistics (compared to OLS and quantile) LOESS (locally estimated scatterplot smoothing) LOWESS (locally weighted scatterplot smoothing) SPLINE Multivariate development as well -- Are the trends (positive or negative or whatever) in the scatter plot matrix involving the variables absolute compared to OLS? Implications for multivariate models and forecasting. Multivariate development OLS versus Quantile versus LOESS/LOWESS versus Spline Observing summary statistics as well Models validation 13. LOGISTIC REGRESSION Note: will focus on labour economics applications, censored count data and political economy Motives Model Structure and Computational Structure Evidence for variables Model fitting pursuit Summary Statistics analysis Calculating Probabilities/Predicted Probabilities Marginal Effects Feature Importance logistic regression method Then compare with appropriate methods encountered earlier Multiple logistic regression (extend all prior) Prereqs: Mathematical Statistics (check Actuarial post), Macroeconomics II, Microeconomics II.
Economic Time Series Without the use of raw data and an enforced computational environment this course will not be meaningful. I can’t just give you chalkboard written models and condensed “Kool-Aid” summary data then expect you to really understand what’s really there. This course doesn’t have much time to spend on statistical theory. Two status quo texts conventionally applied --> Enders, Walter. 2015. Applied Econometric Time Series, Wiley Kleiber, C. & Zeileis, A. 2008. Applied Econometrics with R (use R!), Springer R guides for homework, take-home assignments, projects --> Farnsworth, G. 2008, Econometrics in R. CRAN R Project Time Series Analysis with Applications in R, by Jonathan Cryer and Kung-Sik Chan, Springer Time Series Analysis and its Applications with R Examples, by R. H. Shumway and D. S. Stoffer. Introductory Time Series with R, by P. S. P. Cowpertwait and A. V. Metcalfe Supportive general texts likely to be referred to in course --> Hayashi, F. 2000. Econometrics. Princeton University Press Hamilton, J. D. 1994. Time Series Analysis. Princeton University Press Juselius, K. 2007. The Cointegrated VAR Model: Methodology and Applications. Oxford Press. L¨utkepohl, H. 2005. New Introduction to Multiple Time Series Analysis, Springer. Assessment --> --Homework (analytical and R skills) --5 take-home assignments. The assignments will be handed out in class and will be due in about 7-10 days; they will involve solving end-of-chapter problems, data analysis, and data computation exercises with time series. If I’m giving you at least 1 week…then that says something about what I expect. Take home assignments may not be exact replicas of lecturing and literature applied. --Projects will be based on lecturing and literature (texts AND assigned journal articles; data likely will be augmented). Projects will come when instructor deems class is exposed to enough material. Prerequisites will haunt you. Journal articles listed in course topics concern active computational development in lecturing. --Final exam done in a room with disabled WIFI, disabled LAN with an environment that rejects hot-spots. You will use your computers or room computers with R ability. 24 hours prior, say, you will be given various data files with no assignments structure, where you must know how to apply them towards time series pursuits. At exam time questionnaires will be handed out. To complete questions you will rely on your statistics and time series knowledge/skills (analytical and R). Open notes and can make use of past assignments and projects for reference. Final exam will be comprehensive. --The paper will involve either (a) and/or (b): (a) replicating the developments and results of an existing paper, and critically extending it further (ambiance of interest, incorporation of new data, etc.) (b) presenting the results of original research. Typically, the paper will be chosen by the student in consultation with the instructor and should have the following characteristics: (1) the paper must analyse a development question (2) the paper must use substantial time series econometric analysis, preferably multiple large areas covered in this class. CONTENT, MECHANICS, EFFORT, QUALITY. Concerning course outline, for any journal articles applied the mentioned textbooks will be applied first before introducing journal articles, as means to develop needed foundation. Journal articles serve as meaningful and practical applications. Students are expected to read and apply preliminary analysis for chosen journal articles before scheduled lecture. Concerning any applications or applied journal articles, to also critique the models, and use of data from general sources. In other words, one will not just assume observed times series in journal articles are efficient. One needs to definitively develop how economic theory and economic models are reflected by the times series applied; quite crucial with multivariate time series. This course is NOT a playground for reckless and inconsiderate mathematicians and statisticians about their own interests; contrary behaviour requires that you be placed in a corner with 1000 element data sets to figure things out with a slide rule, probability chart, your fingers and a noise modulator…. with your cherished intellect. Some idea with cross validation (but not limited to): Moudiki, T. (2020). Time Series Cross-Validation Using crossval. R-bloggers NOTE: such above example for training/test/validation data is only one means since the R environment fortunately often encourages development towards comfort (with different packages); concern as well for multivariate times series. Applied journal articles concern applications for topics and assignments or projects. NOTE: for each major topic you will have to make sense of what you’re learning in regard to real raw data and R usage. NOTE: in each module summary statistics for time series will be included and analysed. Done emphatically throughout each module. NOTE: MAPE, MSE and MAE treatment expected throughout NOTE: this isn’t a matrix algebra course. You should know what a matrix is independently. Lengths and arrays of data are too big to be wasting other people’s time with perverted trivial manual matrix operations circus shows. NOTE: you are not mastering stereotypical exams with memory, pen/pencils and paper. You master things on your own when you get a good feel for what you’re immersed in. Tools --> Will employ R with RStudio employing various packages. R package use likely to vary in progression MANDATORY FOCUS TOPICS --> 1. DATA SOURCES OF INTEREST, FILE TYPES, APIs. IMPORTING & DATA WRANGLING 2. GRAPHICAL EXAMINATION OF TIME SERIES, DISTRBUTION DETERMINATION & SUMMARY STATISTICS 3. CONSTRUCTIONS (2-3 sessions) Deterministic difference equations Lag operators Conditional expectation How are all such prior relevant in modelling data? 4. TYPES OF TIMES SERIES DECOMPOSITION Importance of knowing which components are in your time series Modelling. 5. ADVANCE DETECTION OF SALIENT CHARACTEREISTICS OF TIME SERIES (3-4 sessions) NOTE: focus will be concepts and R computation goals. Such are for cross-referencing/validating with module (4) prior. Seasonality Properties, models and tests implementation Stable Seasonal Pattern Forecasting Model Non-parametric tests HAC Non- Parametric Tests of Mean of Differences Friedman’s Non-parametric test Datta, D. D. and Du, W. (2012). Nonparametric HAC Estimation for Time Series Data with Missing Observations. Board of Governors of the Federal Reserve System International Finance Discussion Papers Number 1060 (apply to real world cases) Trend tests Properties, models, tests implementation Deterministic Trend/Seasonal Forecasting Model Buys-Ballot Plots DTDS Cyclicity Properties, models, tests implementation Box-Pierce-Ljung Portmonteau Test Stationarity Properties, models and tests implementations Augmented Dickey-Fuller test (ADF Test) Kwiatkowski-Phillips-Schmidt-Shin test (KPSS test) 6. COINTEGRATION (assumption of same unit of measure among various time series. 7. UNOBSERVABLE COMPONENT FORECASTING MODEL (2-3 sessions) 8. BOX-JENKINGS PROCESS (3-4 sessions) Model Identification Stationarity and Seasonality Detecting Stationarity Seasonality Differencing for Stationarity Seasonal Differencing p and q identification Model Estimation Model Validation 9. BOX-JENKINGS FORECASTING MODEL (2-4 sessions) Forecasting for Stationary, Non-Seasonal Time Series Non-Seasonal, Stochastically-Trending Time Series Seasonal, Stochastically-Trending Time Series For all priors use of MAE, MAPE and RMSE is expected 10. EXPONENTIAL SMOOTHING Single, double and triple 11. TRANSFER FUNCTION MODEL (2-3 sessions) Montgomery, Douglas C. & Weatherby, G. (1980). Modelling and Forecasting Time Series Using Transfer Function and Intervention Methods, A I I E Transactions, 12:4, 289-307 Conflicts with Box-Jenkins? Limitations with linearity? 12. STATE SPACE MODELS (SSM) What is it? Why State-Space Formulation? NOTE: will only focus on SSM as an alternative to Box-Jenkins concerning the alleged issue that in "the economic and social fields, real series are never stationary however much differencing is done", from Commandeur & Koopman (2007, §10.4) Commandeur, J. J. F.; Koopman, S. J. (2007). Introduction to State Space Time Series Analysis. Oxford University Press Verify the concern of Commandeur & Koopman with real data against B-J implementation State-Space Formulation Structural Models AR, MA, ARMA and ARIMA models in state-space form Develop the counterpart process for Box-Jenkins How does forecasting and forecasting error compare to B-J? Filtering and Smoothing: The Kalman Filter and EM Algorithm 13. FURTHER EXPLORATORY DATA ANALYSIS Anomaly Detection: Implementing various tests to identify and analyze outliers or unusual patterns that could impact the overall results. Note: this is not a “status quo Z-score course”. Stationarity Tests and Cointegration review (assumption of common unit of measure): Such tests will be crucial in understanding the time series properties of our data, ensuring that any models we develop are statistically sound. Cross-Correlation Analysis (assumption of common unit of measure): To help explore with the relationships between multiple time series, providing insights into how different variables might influence each other. 13. GOVERNMENT SIZE-ECONOMIC GROWTH RELATION WITH TIME SERIES Example literature for development (there are others): Ram, R. (1986). Government Size and Economic Growth: A New Framework and Some Evidence from Cross-Section and Time-Series Data. The American Economic Review, 76(1), 191–203 V. V. Bhanoji Rao. (1989). Government Size and Economic Growth: A New Framework and Some Evidence from Cross-Section and Time-Series Data: Comment. The American Economic Review, 79(1), 272–280 O. Faruk Altunc & Celil Aydin (2013). The Relationship between Optimal Size of Government and Economic Growth: Empirical Evidence from Turkey, Romania & Bulgaria. Procedia - Social & Behavioral Sciences 92, pp 66 – 75 14. COMPARING ECONOMIC INDICATORS MEASURED IN DIFFERENT UNITS (GDP, Inflation, Unemployment, Currency Exchange, Treasuries, Commodities) Methods to apply Normalization or Standardization Indexing Cross-Correlation based on either of the priors Co-integration 15. VECTOR AUTOREGRESSIVE TIME SERIES MODELS (4-6 sessions) Needed concepts that are practical Models development and summary statistics interpretation Model validation Forecasting of macroeconomic variables: GDP, inflation, unemployment, interest rates, exchange rate. Note: disregard (14) for this topic. Moench, E. (2005). Forecasting the Yield Curve in a Data-Rich Environment: A No-Arbitrage Factor-Augmented VAR Approach, ECB Working Paper No. 544 16. FEATURE IMPORTANCE/SELECTION METHODS FOR MULTI-DIMENSION TIME SERIES DATA Note: must comprehend and develop the influence on (15) 17. SHOCKS IN ECONOMY (2-3 sessions) Methods for identifying shocks & estimating impulse responses- constructive analysis, logistics and implementation The given journal articles and literature will be analysed. Will determine how well the articles’ development conforms with our methodology process. Then replicate them to best of ability. Then augment with more modern data and sovereignty of interest. May require additional literature. Monetary policy shocks Bachmann, R., Gödl-Hanisch, I. and Sims, E. R. (2021). Identifying Monetary Policy Shocks using the Central Bank’s Information Set. NBER Working Paper 29572 Fiscal shocks Auerbach, A. J. and Gorodnichenko, Y. (2014). Effect of Fiscal Shocks in a Globalised World. 15th Jacques Polk Annual Research Conference, International Monetary Fund Montasser GE, et al (2020). The Time-series Linkages between US Fiscal Policy and Asset Prices. Public Finance Review, 48(3):303-339. Financial Shocks of Natural Disasters Miao, Q., Hou, Y. and Abrigo, M. (2018). Measuring the Financial Shocks of Natural Disasters: A Panel Study of U.S. States. National Tax Journal 71.1: pages 11–44 Benali, N., Mbarek, M.B. & Feki, R. (2019). Natural Disaster, Government Revenues and Expenditures: Evidence from High and Middle-Income Countries, J Knowl Econ 10, 695–710 VAR: forecasting the likelihood of financial crisis 18. FORECAST EVALUATION OF SMALL NESTED MODEL SETS Concept and structure of nested models Hubrich, K. and West, K. D. (2010). Forecast Evaluation of Small Nested Model Sets. Journal of applied Econometrics 25: 574 – 594 Clark, T. E and McCracken, M. W. (2009). Nested Forecast Model Comparisons: A New Approach to Testing Equal Accuracy. The Federal Reserve Bank of Kansas City, RWP 09 – 11 Granziera, E., Hubrich, K. and Moon, H. R. (2013). A Predictability Test for a Small Number of Nested Models. ECB Working Paper Series, No. 1580 19.MULTIPLE FORECAST COMPARISON & FORMING EFFICIENT “COMBINATION” FORECASTS (3-5 sessions) Multiple Forecast Tests Morgan-Granger-Newbold (MGN) Harvey, Leybourne and Newbold (HLN) Meese-Rogoff (MR) Diebold-Mariano (DM) How applicable is the following R packages to prior topic(s)? CRAN R.(n.d.). Getting Started with Modeltime Ensemble. CRAN R Multivariate counterparts for priors (if need be) Combination Forecasting Some Basic Theorems on Diversification of Forecasts (survey only) Nelson Combination Method Granger-Ramanathan Combination Method Combinations with Time-Varying Weights Application literature Clark, T. E and McCracken, M. W. (2007). Combining Forecasts From Nested Models. Finance and Economics Discussion Series, Federal Reserve Board 2007 – 43 20. FORECASTING FINNCIAL CRISES WITH WITH TIME SERIES & CLASSIFICATION ALGORITHMS For various financial crisis in history ambiance and/or foreign, past data (economic and financial) leading up to respective event to apply. Will also make forecasts for the current future. R packages exist to treat all of the following. Vector Autoregressive (VAR) models Threshold Autoregressive (TAR) models Smooth Transition Autoregressive (STAR) models Markov Switching Autoregressive (MSAR) models Logit/Probit Support Vector Machine Prerequisites: Mathematical Statistics (check Actuarial post), Microeconomics II, Macroeconomics II
Monetary Theory and Policy --An introduction to modern monetary economics for advanced undergraduates. Course presents the core New Keynesian model and recent advances, taking into account financial frictions, and discusses recent research on an intuitive level based on simple static and two-period models, but also prepares readers for an extension to a truly dynamic analysis. Lecturing Text--> Cao, J. and Illing, G. (2019). Money: Theory and Price. Springer Texts in Business and Economics. Springer Assessment --> Problem Sets from lecturing text 5 Quizzes Labs Course Phases --> Part I: Long-run perspective, addressing classical monetary policy issues such as determination of the price level and interaction between monetary and fiscal policy. Part II: Core New Keynesian model, characterising optimal monetary policy to stabilize short-term shocks. Rules vs. discretion and the challenges arising from control errors, imperfect information and robustness issues. Optimal control in the presence of an effective lower bound. Part III: limited to the following Modelling financial frictions Identification of transmission mechanisms of monetary policy via banking and introduces models with incomplete markets. Presenting a tractable model for handling liquidity management and demonstrating that the need to sell assets in crisis amplifies the volatility of the real economy. Relation between monetary policy and financial stability, addressing systemic risk and the role of macro-prudential regulation. Problem Sets --> Questions for AD, AS and AD-AS, DAD-DAS Algebraic, numerical Questions and simulations for DAD-DAS Problems from lecturing text Problems for constituents of DSGE and CGE; properties and conditions of the constituents. Some simulations implemented. Quizzes --> Based on problem sets and lecturing Labs --> Labs will be done in particular bundles with to be determined sequence among labs, having fluid relation, high coherency, tangibility and practicality going from one lab to the next. Considerable amount of various data to apply. Specified labs detailed are a rare opportunity, where you are the beneficiary. 1. PRIMITIVES -Review of the derivation and relevance of the IS, LM, AD and AS curves with solutions; construction of AD-AS and IS–LM–FEs. Reviewing circumstances with shifts, policies and rules. -Review of creating DAD-DAS and investigating (via simulation) different scenarios/policies/rules. -Analysis of the following section, then investigate for other countries with different time periods Flaschel, P. (2009). Keynesian DAD-DAS Modeling: Baseline Structure and Estimation. In: The Macrodynamics of Capitalism. Springer, Pages 305-333 Note: this lab is a special case where topics and problems will be done on multiple occasions, unlike the other labs. 2. NEW KEYNESIAN MODELS Note: literature for calibration and simulation pursuits -- Dennis, Richard. 2003. “New Keynesian Optimal Policy models: An Empirical Assessment.” FRBSF Working Paper 2003-16 (2005). Monetary Policy in the New Keynesian Model. In: Monetary Policy and the German Unemployment Problem in Macroeconomic Models. Kieler Studien - Kiel Studies, vol 334. Springer, Berlin, Heidelberg. De Vroey, M. (2016). Second-Generation New Keynesian Modeling. In A History of Macroeconomics from Keynes to Lucas and Beyond (pp. 307-336). Cambridge: Cambridge University Press. Alla, Z., Espinoza, R. and Ghosh, A. R. (2017). FX Intervention in the New Keynesian Model. IMF WP/17/207 Sims, E. and Wu, J. C. (2019). The Four Equation New Keynesian Model, FRBSF 3. TOOLS OF MONETARY POLICY Investopedia Team (2021). Monetary Policy. Investopedia Chen, J. (2021). Foreign Exchange Intervention. Investopedia For each identified tool of monetary policy what rule(s) will be appropriate for control? Will like to verify with case examples based on economic data? Open Market Operations Discount Rate Reserve Requirements 4. DSGE BEGINER SOURCE PART A De Grauwe, P., The Scientific Foundation of Dynamic Stochastic General Equilibrium (DSGE) Models, Public Choice (2010) 144: 413–443 Costa Junior, C. J. and Garcia-Cintado, A. C. (2018). Teaching DSGE Models to Undergraduates. EconomiA 19, 424 - 444 DYNARE Heavy immersion Note: interests will go much further than article with development and simulation; sustainability with applications Note: OccBin Toolkit in Dynare may be of interest, however, one must comprehend any limitations or hindrances of a first-order approach implemented in general. DynareR package for R is also possible. Guerrieri, L. & Lacoviello, M. (2014). OccBin: A Toolkit for Solving Dynamic Models with Occasionally Binding Constraints Easily. Finance and Economics Discussion Series. Division of Research & Statistics & Monetary Affairs. Federal Reserve Board Guerrieri, L. & Lacoviello, M. (2015). OccBin: A Toolkit for Solving Dynamic Models with Occasionally Binding Constraints Easily. Journal Monetary Economics, Volume 70, pages 22 – 38 Note: package DynareR to investigate (concerns for OccBin Toolkit) PART B Note: apart from comprehension of models structure there can be comparative analysis with their implementation -- Policy Analysis Using DSGE Models Sbordone, A. et al (2010). Policy Analysis Using DSGE Models: An Introduction, FRBY Economic Policy Review FRBNY DSGE meets Julia <https://github.com/FRBNY-DSGE/DSGE.jl > The given above link provides the DSGE code in the Julia language. However, if one can develop the code in R, then that’s fine as well. PART C FRS/US Model: https://www.federalreserve.gov/econres/us-models-package.htm PART D Bayesian DSGE: RAMSES (optional) Adolfson, M. et al (2007a), Journal of International Economics vol.72(2), pages 481-511. Adolfson, M. et al, (2007b), Sveriges Riksbank Economic Review 2, pp 5-39 Adolfson, M. et al (2011). Board of Governors of the Federal Reserve System International Finance Discussion Papers Number 1023 Adolfson, M. et (2014). Monetary Policy Trade-Offs in an Estimated Open-Economy DSGE model. Journal of Economic Dynamics & Control, vol.42, pqges 33-49 PART E Monetary Transmission Channels in DSGE Labus, M. and Labus, M. (2019). Monetary Transmission Channels in DSGE Models: Decomposition of Impulse Response Functions Approach. Comput Econ 53, 27–50 PART F Vector autoregressions (VARs) for testing dynamic stochastic general equilibrium (DSGE) models. 5. Computable General Equilibrium development with GAMS To build a practical, tangible and fluid computational foundation. The following are invaluable texts: Burfisher, M. E. (2011). Introduction to Computable General Equilibrium Models. Cambridge University Press. Hosoe, N., Gasawa, K., & Hashimoto, H. (2010). Textbook of Computable General Equilibrium Modeling: Programming and Simulations. Palgrave Macmillan Limited. Dixon, P. B. and Jorgenson, D. W. (2013). Handbook of Computable General Equilibrium Modelling SET, Volumes 1A and 1B. Elsevier Perali, F. and Scandizzo, P. (2018). The New Generation of Computable General Equilibrium Models: Modelling the Economy. Cham: Springer. The following texts provide guidance for programming and simulation: Chang, G. H. (2022). Theory and Programming of Computable General Equilibrium (CGE) Models: A Textbook for Beginners. World Scientific. 6. Validating the Fisher Effect 7. Monetary Policy Rules The references in the following may prove beneficial: https://www.federalreserve.gov/monetarypolicy/policy-rules-and-how-policymakers-use-them.htm From past economic periods investigate how such rules are to be implemented. Are DSGE and CGE simulation means to implement such rules w.r.t. monetary tools? How does, data, econometrics, DSGE and CGE lead to choice implementation; retractions as well. Are simple economic models (DAD-DAS) just as formidable? What discretion is considered regardless? For the various monetary tools available to central banks from (3), how do such tools either in expansionary policy or contractionary policy relate to such rules? Legacy mention (optional): McCallum, B. T. (2000). Alternative Monetary Policy Rules: A Comparison with Historical Settings for the United States, the United Kingdom, & Japan. Federal Reserve Bank of Richmond Note: pursue with more modern data, also with incorporation of candidate rules mentioned in the given federal reserve link. 8. Money Supply process Bajpai, L. (2020). How Central Banks Control the Supply of Money. Investopedia Kenton, W. (2021). Reserve Ratio. Investopedia Using financial statements of banks to compute reserve ratio and reserve requirement. Velocity of Money Means of money supply control What tools and data are applied for determination of choice of money supply control method? Will acquire the logistics and implement the means. Will try to observe data that exhibits the TRUE response from money supply control methods upon in industries, consumer spending, loans (particular types), mortgages, securing financing by companies, etc., etc. Time series may be most appropriate. At the macro level will try to observe data that exhibits the TRUE response from money supply control method, say, influence on interest rates, inflation and unemployment, towards models development. Time series may be most appropriate. 9. National Accounts (analysis, measures and benchmarks) Balance Sheet, Current, Capital, Financial Assists for lab: SNA 2008 (https://unstats.un.org/unsd/nationalaccount/pubsDB.asp) Are the following applicable to national accounts? Beneish Model, Dechow, F, Modified Jones, Altman Z Model Logistics for determination of GDP and GNI via national accounts Assessing the effects of various economic policies Income/wealth distribution (compared to Lorenz and Gini) Inflation determination compared to CPI and PCE 10. PMI analysis 11. Modelling, analysing and forecasting the yield curve with the Nelson-Svensson-Siegel model For comparative development: YieldCurve R package Enrico Schumann. Fitting the Nelson–Siegel–Svensson model with Differential Evolution. CRAN R Prerequisites: Microeconomics II, Money & Banking, Advanced Macroeconomics, Mathematical Statistics Co-requisites or Prerequisites: Econometrics, Economic Time Series Research Methods in Monetary Policy Course hours applied will be considerably longer than a conventional term, AND requirement of at least 3 hours per lab session. Guiding Literature --> Much literature will stem from the given articles in the EA outlines, else literature will be provided if not stated. Grading --> -EA labs MONETARY POLICY LABS (EAs) --> Specific EAs will be done after coverage of related course lectures. Will consistently be highly data relevant and computational. Class will be partitioned into groups, where all groups will be held accountable for EAs 1 – 13 towards applied monetary workings (tangible/practical and fluid applications). Focus will be adjustment to assigned nation. Group scoring will be based on qualitative development and quantitative development. NOTE: knowledge and skills from prerequisites will be essential. NOTE: EAs to be done in chosen particular bundles, granted that all EAs in a particular bundle to be appropriately sequenced, having decent relation, high coherency, tangibility, practicality and fluidity going from one to the next. EAs are a rare opportunity, where you are the beneficiary. REMINDER: monetary intervention concerns impartial decision marking. There’s no role for socio-political rhetoric, divisiveness and policies. Despite having to deal with "shocks” stemming from the legislative and executive branches, a central bank is an independent agency. HAVE FORESIGHT OF THE OUTCOME WITH A CONTRARY STANCE. REMINDER: stay fresh and sharp with knowledge and skills from prerequisites. Essential Attributes (EA) --> 1. Review Federal Funds Rate Baldwin, J. G. (2021). Impact of Interest Rate Changes by the Federal Reserve. Investopedia 2. Assets A. Balance Sheet Singh, M. (2021). Understanding the Federal Reserve Balance Sheet, Investopedia Concerning the federal reserve “thinning” or “expanding” its balance sheet, what open market operation is applied? Buying corporate bonds in an aggressive manner concerning unfavourable economic shocks, etc. Will review numerous past balance sheets to acquire dynamic and try to comprehend strategy. What appropriate conditions must arise to apply such tool or operation? Guidelines for retraction with such operation. When to completely withdraw? Assisting literature: Galema, R. and Lugo, S. (2021). When Central Banks Buy Corporate Bonds: Target Selection and Impact of the European Corporate Sector Purchase Programme. Journal of Financial Stability 54 100881 Concerning a central banks’ balance sheets for corporate bonds in assets. Industries, firm valuations and respective market share (if able). What risk management frame work exists? Do Beneish, Dechow F, Modified Jones, Altman Z and Merton default model (or KMV model) apply for selection of bonds? Are default correlations and liquidity standard considerations before such transactions towards balance sheets? Is it possible for federal reserves to invest in corporate bonds and foreign corporate bonds plainly as investments? Are Off-Balance Sheet notes applicable to Central Banks? B. Foreign Assets Foreign notes/currencies (types) Purpose, and influence of levels of such foreign assets on respective exchange rates and domestic treasuries. Exchange Risk Measurement of exposure Use of VaR type models Currency baskets to smooth risks (will have development for such) C. Portfolio risk preference of the Fed from balance sheets at various periods of the business cycle (asset types and weights). Hopefully there’s enough transparency to identify strategies in a “investment portfolio type manner”. Do rebalancing techniques for portfolios in finance apply to central banks? 3. Forecasting PART A (Inflation and Employment) PCE and CPI Time Series Multivariate Variables Selection VAR time series (model estimation, validation, forecast) Webb, Roy H. 1995. “Inflation Forecasts from VAR Models.” Journal of Forecasting pp. 267-285. Multivariate Regression model (variables selection Tallman, Ellis W. 1995. “Inflation and Inflation Forecasting: An Introduction”, Federal Reserve Bank of Atlanta Economic Review, pages 13-27. Avdiu, K. and Unger, S. (2022). Predicting Inflation—A Holistic Approach. J. Risk Financial Manag., 15, 151 Note: develop employment counterpart afterwards. PART B (Fed Products) Survey of Professional Forecasters (SPF); CBO; Cleveland FRS BVAR Identifying and interpreting models (classifications and variables applied in models’ structure towards forecasting. Validating models with forecast data. Some guidance: Variables, transformations, and files in the survey: www.philadelphiafed.org/-/media/frbp/assets/surveys-and-data/survey-of-professional-forecasters/spf-documentation.pdf Stark, T. (2010). Realistic Evaluation of Real-Time Forecasts in the Survey of Professional Forecasters. Federal Reserve Bank of Philadelphia PART C Serge de Valk, Daiane de Mattos and Pedro Ferreira. Nowcasting: An R Package for Predicting Economic Variables Using Dynamic Factor Models. The R Journal Vol. 11/01, June 2019 Note: pursue other economic variables besides GDP. Then, will take a more intimate approach in developing prediction models for economic variables, to compare with prior. PART C After analysis of the following, to be concerned with development with more modern years: Knotek II, E. S. et al (2016). Federal Funds Rates Based on Seven Simple Monetary Policy Rules, Federal Reserve Bank of Cleveland, Economic Commentary. Number 2016-07 Holtemöller, Oliver, 2002. "Structural Vector Autoregressive Models and Monetary Policy Analysis., SFB 373 Discussion Papers 2002, 7, Humboldt, University of Berlin, Interdisciplinary Research Project 373: Quantification and Simulation of Economic Processes. Paramanik RN, Kamaiah B. A Structural Vector Autoregression Model for Monetary Policy Analysis in India. Margin: The Journal of Applied Economic Research. 2014;8(4):401-429. 4. Inflation Concept Review PART B (Output Gap) Concept, purpose and controversies Being an inflation gauge and needed link to unemployment Classical Method Cerra, V. & Saxena, S. C. (2000). Alternative Methods of Estimating Potential Output and the Output Gap: An Application to Sweden, IMF WP/00/59 Pursue means of determining relation between CPI, PCE and output gap. PART C (NAIRU) Kramer, L. (2020). How Do Governments Reduce Inflation? Investopedia. Non-Accelerating Inflation Rate of Unemployment (NAIRU) Murphy, C. B. and Kelly, R. C. (2024). Non-Accelerating Inflation Rate of Unemployment (NAIRU). Investopedia Guides to assist: Staiger, Douglas, James H. Stock, and Mark W. Watson. 1997. “The NAIRU, Unemployment and Monetary Policy.” Journal of Economic Perspectives (Winter) pp. 33-49. P. McAdam & K. Mc Morrow, (1999). The NAIRU Concept – Measurement Uncertainties, Hysteresis and Economic Policy Rule, European Economy – Economic Papers 2008 -2015, Directorate General Economic and Financial Affairs (DG ECFIN), European Commission Turner, D. et al (2001). Estimating the Structural Rate of Unemployment for the OECD Countries. OECD Economic Studies No. 33, 2001/II Amano M. (2013). The NAIRU, Potential Output, and the Kalman Filter: A Survey and Method of Estimation. In: Money, Capital Formation and Economic Growth. Palgrave Macmillan, London. Victor V. Claar (2006) Is the NAIRU More Useful in Forecasting Inflation than the Natural Rate of Unemployment? Applied Economics, 38:18, 2179-2189 5. DSGE and CGE Models Comprehension of computational models and construction in a transparent, coherent, fluid and tangible manner; spectrum of uses for each. If you don’t treat this now with effort and quality, chances are you will never get back to it. NOTE: make choice(s), but active implementation is mandatory. you have been well expsoed to DSGE and CGE prior, so this should be easy to tread. PART A: FRBNY DSGE Model meets Julia < https://github.com/FRBNY-DSGE/DSGE.jl > FRS/US Model < https://www.federalreserve.gov/econres/us-models-package.htm > BEQM Model < Harrison, R., Nikolov, K. et al. (2005). Bank of England > ; < Nikolov, Kalin. (2013). European Central Bank > Bank of Canada ToTEM III < Dorich, J. et al (2013). > < Corrigan, P. et al (2021). > Note: Dynare + OccBin Toolkit, and DynareR are also useful. PART B Vector autoregressions (VARs) for testing dynamic stochastic general equilibrium (DSGE) models; subjugating part A. PART C (CGE Models with GAMS) General Literature: Burfisher, M. E. (2011). Introduction to Computable General Equilibrium Models. Cambridge University Press. Dixon, P. B. and Jorgenson, D. W. (2013). Handbook of Computable General Equilibrium Modelling SET, Volumes 1A and 1B. Elsevier Perali, F. and Scandizzo, P. (2018). The New Generation of Computable General Equilibrium Models: Modelling the Economy. Cham: Springer. Literature for programming and simulation: Hosoe, N., Gasawa, K., & Hashimoto, H. (2010). Textbook of Computable General Equilibrium Modeling: Programming and Simulations. Palgrave Macmillan Limited. Chang, G. H. (2022). Theory and Programming of Computable General Equilibrium (CGE) Models: A Textbook for Beginners. World Scientific. 6. Monetary Transmission Channels/Mechanisms & Conditions Validating the Fisher Effect Monetary Transmission Mechanism Kuttner, K, N. and Mosser, P. C. (2002). The Monetary Transmission Mechanism: Some Answers and Further Questions. FRBNY Economic Policy Review Ireland, P. N. (2005). The Monetary Transmission Mechanism. Federal Reserve Bank of Boston, Working Papers No. 06‐1 Note: for the following literature use of DSGE (Dynare + OccBin and DynareR), or CGE with real data, or (Structural) VAR, etc. may be necessary to acquire a strong sense of verification of dynamics. Labus, M. and Labus, M. (2019). Monetary Transmission Channels in DSGE Models: Transmission mechanism of monetary policy Decomposition of Impulse Response Functions Approach. Comput Econ 53, 27–50 Beyer, A. et al (2017). The Transmission Channels of Monetary, Macro- and Microprudential Policies and their Interrelations. European Central Bank Occasional Paper Series – No. 191 7. Policies & Rules in Monetary Policy PART A - Monetary Policy literature: Walsh, C. E. Using Monetary Policy to Stabilize Economic Activity. Kansas City Fed. pp 245 – 296 Berg, A., Karam, P. and Laxton , D. A Practical Model-Based Approach to Monetary Policy Analysis – Overview. IMF Working Paper WP/06/80 Berg, A., Karam, P. and Laxton , D. Practical Model-Based Approach to Monetary Policy Analysis – A How to Guide. WP/06/81 Adolfson, M. et al (2008a), "Optimal Monetary Policy in an Operational Medium-Sized Model: Technical Appendix," Working Paper PART B - Rules NOTE: one will like to make sense of policies and rules with the real world involving past and present data, economics dynamics, and monetary tool. Relevance of economic data, time series, DSGE, CGE to all such. Taylor, J. B. and Williams, J. C. (2010). Chapter 15 – Simple and Robust Rules for Monetary Policy. Pages 829 – 859. In: Handbook of Monetary Economics, Volume 3 Kahn, G. A. Estimated Rules for Monetary Policy. Federal Reserve Bank of Kansas City. Economic Review, Fourth Quarter 2012 Devereux, M. B., Engel, C. and Lombardo, G. (2020). Implementable Rules for International Monetary Policy Coordination. IMF Econ Rev 68, 108 – 162 8. Monetary Tools-Open Market Operations (OMOs) Quantitative Easing (QE); Quantitative Tightening (QT); Yield Curve Control (YCC); Interest on Reserves (IOR); Overnight Reverse Repurchase Agreement (ONRRP); Foreign Exchange Intervention (FXI); Reserve Requirements (RR) Why are QE and YCC considered unconventional monetary policies? For all considered monetary tools, is there is a hierarchy preference, or does choice primarily depend on economic circumstances at hand? (QE) as unconventional monetary policy Purpose of QE Historical origins and cause for such prominence and acceptance What data analysis, rules, tools and models are applied to implement QE policy? How? Steps for successful implementation and retraction. What data analysis, models, rules and tools are applied to gauge and control QE policy? Implementation mechanism of QE: Song, Z. and Zhu, H. (2018). Quantitative Easing Auctions of Treasury Bonds, Journal of Financial Economics, 128, 103 – 124 Will like to validate for period in question and other periods. Also applicable to other foreign places where QE is acknowledged, but the internal yield curve model may differ from one to the next. How is the intensity or effect from QE determined or captured? Demonstrations required. Develop the following papers with relevant ambiance data of your interest, and/or determine consistency with part A development: Kabaca, S. (2016). Quantitative Easing in a Small Open Economy: An International Portfolio Balancing Approach. Bank of Canada Working Paper 2016 - 55 < https://www.bankofcanada.ca/wp-content/uploads/2016/12/swp2016-55.pdf > All that was done for QE generally to be done for QT, YCC, IIOR, ONRRP, FXI and RR. However, some of such OMOs may not be popular in practice, thus, may be restricted to simulation activity. compared to QE (bonds quantity) are the effects of the alternative OMOs more intense short term and long term? Assisting YCC literature: Pol, E. (2021). The Economic Logic of the Yield-Curve Control Policy, Economic Papers, 41 (1) Price Stability literature: Orphanides, A. and Wieland. V. (1998). Price Stability and Monetary Policy Effectiveness when Nominal Interest Rates are Bounded at Zero. Board of Governors of the Federal Reserve System Svensson L.E.O. (1999). Price Stability as a Target for Monetary Policy: Defining and Maintaining Price Stability. National Bureau of Economic Research. Working Paper 7276 Bernanke, B. S. (2006). The Benefits of Price Stability. Board of Governors of the Federal Reserve System Assisting Inflation Targeting literature: Doh, T. (2007). What Does the Yield Curve Tell Us About the Federal Reserve’s Implicit Inflation Target? The Federal Reserve Bank of Kansas City RWP 07 – 10 Svensson L.E.O. (2010). Inflation Targeting. National Bureau of Economic Research. Working Paper 16654 Assisting Reserve Requirements literature: Reserve Requirements: Current Use, Motivations and Practical Considerations, OECD 2018 Gray, S. (2011), IMF Working Paper WP/11/36 Federico, P., Vegh C., and Vuletin G. (2014), NBER Working Paper No 20612 Montoro, C. and Moreno, R. (2013), BIS Quarterly Review, March 2011 9. Fiscal Policy Influence (FPI) Differentiating fiscal policy from monetary policy FPI on consumer spending, markets, inflation and employment Liquidity Trap (LT) Features Resolutions Using a CGE model to estimate the consequences of an expansive (contractionary) fiscal policy for ambiance Means to determine when withdrawal is appropriate, and what/when monetary policy should be taken up Using a mix of monetary and fiscal policies towards control on economic phenomena. Assisting literature: Cantore, C. et al (2017). Optimal Fiscal and Monetary Policy, Debt Crisis and Management. International Monetary Fund. Working Paper No. 17/78. Stock number: WPIEA2017078 10.Statistical Analysis and Evaluation of Macroeconomic Policies PART A (Speculation Literature) Note: such literature to be analyses and replicated. New data can be introduced afterwards to critique literature. Rotemberg, Julio, and Michael Woodford. (1997). An Optimization-Based Econometric Framework for the Evaluation of Monetary Policy.” In Ben Bernanke and Julio Rotemberg, eds., NBER Macroeconomics Annual. Cambridge, MA: MIT Press. PART B (Succeeding Literature) Note: such literature to be analyses and replicated. New data can be introduced afterwards to critique literature. Romer, C. D. and Romer, D. H. (1990). New Evidence on the Monetary Transmission Mechanism. Brookings Papers on Economic Activity Kashyap, A., K. and Stein, J. C. (1999 draft). What Do A Million Observations on Banks Say About the Transmission of Monetary Policy? NBER Working Paper Hoover, K. D. and Jordá, O. (2001). Measuring Systematic Monetary Policy, Federal Reserve Bank of St. Louis. Bean, C., Larsen, J. and Nikolov, K. (2002). Financial Frictions and the Monetary Transmission Mechanism: Theory, Evidence and Policy Implications. European Central Bank Working Paper No. 113 Boivin, J. and Giannoni, M. (2002). Assessing Changes in the Monetary Transmission Mechanism: A VAR Approach. FRBNY Economic Policy Review Boivin, J., Kiley, M. T. and Mishkin, F. S. (2010). How Has the Monetary Transmission Mechanism Evolved Over Time? Federal Reserve Board, Finance and Economics Discussion Series (FEDS) Staff Working Papers. Franta, Michal; Horváth, Roman; Rusnák, Marek (2012) : Evaluating Changes in the Monetary Transmission Mechanism in the Czech Republic, IES Working Paper, No. 11/2012, Charles University in Prague, Institute of Economic Studies (IES), Prague Rebei, N. (2017). Evaluating Changes in the Transmission Mechanism of Government Spending Shocks. IMF Working Paper WP/17/49 PART C The given journal articles beneath claim statistical analysis and evaluation techniques of macroeconomic policies. Liu, Z., Cai, Z., Fang, Y. et al. (2020). Statistical Analysis and Evaluation of Macroeconomic Policies: A Selective Review. Appl. Math. J. Chin. Univ. 35, 57–83 (2020). 11. Asset Price Bubbles & Monetary Policy PART A Concept of APB and consequence(s) Literature Phillips, P. C. B. and Shi, S. (2020). Chapter 2. Real-Time monitoring of asset Markets: Bubbles and Crises. Pages 61 – 80. In: Vinod, H. D. and Rao, c. R. Handbook of Statistics volume 42. Financial, Macro and Micro Econometrics Using R. North Holland. Cowles foundation Discussion Paper No.2152 version: https://cowles.yale.edu/sites/default/files/files/pub/d21/d2152.pdf It’s important that one becomes actively acquainted with R package psymonitor with various data of different times. R vignettes: Phillips, P. C. B., Shi, S. and Caspi, I. (2018). Real-Time Monitoring of Bubbles: The S&P 500. CRAN R Phillips, P. C. B. (2018). Real-Time Monitoring of Crisis: The European Sovereign Sector. CRAN R Supporting literature: Phillips, P. C. B., Shi, S. and Yu, J. (2015). Testing for Multiple Bubbles: Historical Episodes of Exuberance and Collapse in the S&P 500. International Economic Review, volume 56, number 4. < http://korora.econ.yale.edu/phillips/pubs/art/p1498.pdf Phillips, P. C. B., Shi, S. and Yu, J. (2015). Testing for Multiple Bubbles: Limit Theory of Real-Time Detectors. Cowles Foundation Discussion Paper No. 1915, Available at SSRN: https://ssrn.com/abstract=2327633 PART B How well does the various prior (Phillips et al) literature/algorithm stack up against methods out of the following for various past events? Gurkaynak, R. S. (2005). Econometric Tests of Asset Price Bubbles: Taking Stock. Federal Reserve Board Robert Jarrow (2016). Testing for Asset Price Bubbles: Three New Approaches, Quantitative Finance Letters, 4:1, 4-9 PART C The following two articles are good to analyse. Past bubbles will be treated/modelled with such articles Filardo, A. (2004). Monetary Policy and Asset Price Bubble: Calibrating the Monetary Policy Trade-Offs. BIS Working Papers No.155 Evegenidis, A. and Malliaris, A. G. (2020). To Lean or Not to Lean Against an Asset Price Bubble? Empirical Evidence. Economic Inquiry. Vol. 58(4), 1958 – 1976 Prerequisites --> International Financial Statement Analysis II, Money & Banking, Monetary Theory & Policy, Econometrics, Economic Time Series
Regional Economics The study of regions in economics with the advent of “local” competition for attractive industries, as well as the increasing responsibility of local, state, and national governments for development issues. Will be focused on countries whose provinces/states and municipalities have strong economic independence and accountability: Canada, USA, Australia, U.K., Mexico, etc., etc. The course is composed of labs components A, B, and C towards groups term report assessment (D): A. Intimate Tools Tax Transfer Policy Estimate gross tax revenue Identify Tax Sources then Calculate Revenue from Each Tax Source Aggregate Total Tax Revenue Estimate Total Transfers Identify Transfer Programs Calculate Cost of Each Transfer Program Aggregate Total Transfers Determine Net Revenue Net Revenue = Gross Tax Revenue − Total Transfers Interpretation of positive or negative net revenue Elasticity of Tax Revenue = (Percentage Change in Tax Revenue) divided by (Percentage Change in the Tax Base (e.g., GDP, income)); result is either elastic, inelastic, unitary. Consider unique types of taxes and aggregate tax case. Then to generate a time series to compare with tax base measures (e.g., GDP, income) time series. Speculate on economic conditions, tax structure and possible policy changes for time periods. Note: concerning total transfers, for Marginal Propensity to Consume (MPC), the consumption amount will be a guess; would also vary among income groups, so abstain from it. Fiscal Health Analysis development Public Education (primary, secondary, high school, collegiate) Public Services Government Accounting Following, develop trend analysis for prior 3 Regional economic measures < Location Quotient (LQ); Economic Base; Export Employment; Input-Output; Multiplier Effects; Leakage Effects; Shift-Share > Also, determine the industries that are driving growth/stability in the “market”. Is observation of the trend in such measures annually a good indicator of industries’ direction? Data Envelopment Analysis and Stochastic Frontier Analysis (meaningful with specified markets or industries for efficiency and perforance). Analytical structure before computation/simulation. Efficiency in identified markets, industries, markets, sectors, agriculture, etc. R Packages of interest for DEA rDEA, deaR, Benchmarking R Packages of interest for SFA frontier, npsf, sfa, ssfa, semsfa, Benchmarking Hedonic Models Housing, land, and neighbourhood characteristics Rents and wages, respectively Zabel, J.E. (2008). Using Hedonic Models to Measure Racial Discrimination and Prejudice in the U.S. Housing Market. In: Baranzini, A. et al (eds) Hedonic Methods in Housing Markets. Springer Yinger, J. (2016). Hedonic Estimates of Neighborhood Ethnic Preferences, Public Finance Review, 44(1), 22-51. Logistic regression poverty model development Logistic regression review Variables Selection Model Estimation and Summary Statistics Model Validation Spatial Microsimulation development out of the following msm or MicSim R packages; Modgen; JAS-mine Note: various literature exist to support such above tools. B. Development with REAT R package Wieland T. (2019). REAT: A Regional Economic Analysis Toolbox for R, REGION, 6(3), R1–R57 Note: data of preference may be a challenge, say, having the form and elements to suit the operations of package functions. One can probe various data sets in the package with glimpse() or str(); the worst case scenario is considerable data wrangling to structure data sets with data from different sources. As well, it’s important to comprehend the modelling and measures for your pursuits and to properly incorporate the data for implementation. C. CGE modelling and implementation (with GAMS): Mark D. Partridge & Dan S. Rickman (2010) Computable General Equilibrium (CGE) Modelling for Regional Economic Development Analysis, Regional Studies, 44:10, 1311-1328 Note: look at every damn page in the article. Supporting literature: Burfisher, M. E. (2011). Introduction to Computable General Equilibrium Models, (2011). Cambridge University Press Perali, F. and Scandizzo, P. (2018). The New Generation of Computable General Equilibrium Models: Modelling the Economy. Cham: Springer. The following text provides guidance for programming and simulation: Hosoe, N., Gasawa, K., & Hashimoto, H. (2010). Textbook of Computable General Equilibrium Modelling: Programming & Simulations. London: Palgrave Macmillan Limited Chang, G. H. (2022). Theory and Programming of Computable General Equilibrium (CGE) Models: A Textbook for Beginners. World Scientific. NOTE: elements (A) through (C) serve towards student groups term projects. D. For student groups term projects, a respective student group will choose a region for which to write an economic profile nd assessment. By collecting data through official sources and applying the tools learnt and applied throughout the course, students should be able to develop a profile and assessment worthy of presentation to the respective environments’ government. Note: use GitHub or whatever as your repository. The assigned study should consist of the following elements --> Title Abstract 1.Introduction 2.Historical backgrounds Trace the ambiances from when founded/settled This should also include cultural influences, political structure, etc. 3.Current economic profile using available secondary data Population, housing (and real estate), income, employment data, and other demographics Comparison to other similar “communities” 4.Assessments based on (A) 5.Estimating Exports (assets are not the only type of export, A REMINDER). Assists: Pfister R.L. (1980) The Minimum Requirements Technique of Estimating Exports: A Further Evaluation. In: Pleeter S. (eds) Economic Impact Analysis: Methodology and Applications. Studies in Applied Regional Science, vol 19. Springer, Dordrecht Pratt, R. (1968). An Appraisal of the Minimum-Requirements Technique, Economic Geography, 44(2), 117-124 Annual trend in estimates 6.Economic Structure Analysis Assisting guides: Rita Almeida (2007) Local Economic Structure and Growth, Spatial Economic Analysis, 2:1, 65-90 Sudhir K. Thakur (2011). Fundamental Economic Structure and Structural Change in Regional Economies: A Methodological Approach., Region et development, Region et Development, LEAD, Universite du Sud, - Toulon Var, vol. pp 9 – 38 Nebojša Stojčić, Heri Bezić, Tomislav Galović. (2016). Economic Structure and Regional Economic Performance in Advanced EU Economies. South East European Journal of Economics and Business, Volume 11(1), 54-66 Note: economic shocks and their causes in timelines should be noted for fair assessment; shocks can be observed with R packages of interest. If any recessions, to identify the causes(s), and policies applied towards recovery; complemented by data analysis identifying recession start to current state. Note: likely comparative view with (4) and (5). 7. Assessments based on (B) Note: additionally to also compare/contrast the social welfare or quality of life elements done in (A) and (B). 8. Assessments based on (C) 9.Policy assessment for regional development Culture of the “community” Policy changes, economic incentives, etc. Comparisons to other similar “communities” 10.Economic Forecasting Based on the following elements to draw conclusions -- Review of empirics from (9); Findings from (4) through (8); Government Budget Analysis 11.Summarization Generalization to other similar “communities”? Lessons that can be learned from this particular ambiance’s history of development and future prospects. 12.Compare your unique and non-plagiarizing development to regional economic reports from banks and credit rating agencies. Tools for course --> Government and IGO databases Microsoft 365 or Google tools as alternative R + RStudio Mentioned microsimulation tools REAT R package GAMS for CGE Grading --> Components (A) through (D) Prerequisites: Scientific Writing I & II, Microeconomics II, Advance Macroeconomics, Econometrics, Economic Time Series Sustainability Measures Course explores various measures and indicators for sustainable development at different scales. Case studies, field studies and labs will be used to stimulate learning, provide practical experience and have retention. Note: assume up to 18 weeks for this course. Assessment --> Quizzes 10% Quantitative/computational group assignments 40% Labs/Field Project(s) 50% NECESSARY TOOLS (for all tasks in course) --> R with RStudio Microsoft 365 COURSE TOPICS --> 1.Ambiance Economic Profiling Geopolitical Boundaries: provincial, county, city A. Economic Accountability. General constituents of the public finance economy (goods and services) and linkages to the private sector for region within the particular boundary of consideration (data acquisition, modelling & dynamic) : Public Sector (note: the public sector can also be segmented) Employment, churn rate, job creation Public Services Public Goods or Community/government programmes Taxation Household taxes Business taxes (classifications) Sales taxes (various) Property taxes Estate and Gift taxes Public Transactions (various fees, tolls, penal codes fines, etc.) Note for penal codes: from petty things to various markets commissions; it’s a really broad spectrum. Pension Premiums (if gov’t run) Possible also at the provincial scale (else determine contribution by county or municipality) Gov’t Insurances Possible also at the provincial scale (else determine contribution by county or municipality) Public Investment Gov’t Auctions Markets Assets Valuations Accrued interest for credit/debt instruments Lotteries & Gambling Liabilities Balances, invoices, debts, Cash flow, debts payoff, invoices/balances payoff forecast Real Estate Private Sector Employment, churn rate, job creation, payrolls Private Sector linkages Highfill, T. et al (2020). Measuring the Small Business Economy, BEA Working Paper Series, WP2020-4 Kotz, H. (2022). Measuring Business: Accounting for Companies' Value Creation and Societal Impact. VoxEU CEPR Income distribution Agricultural Economy (if applicable) Tourism (how to segment from public transactions?) Private investments into region (non-Tourism) B. Even at municipal levels the notion of open economy is practical. From the Macroeconomic Accounts Statistics course concerning accounting what constituent elements are not accounted for with all priors when observing (A)? C. Gov’t Metrics Measuring the Size of Gov’t (ask ChatGPT and pursue multiple tangible and practical methods) Measuring gov’t & efficiency Diamond, J. (1990). "9 Measuring Efficiency in Government: Techniques and Experience". In Government Financial Management. USA: International Monetary Fund. Cepal (2015). Methods of Measuring the Economy, Efficiency and Public Expenditure, Annex 7 D. Economic value for goods and services (pursue): Willing to pay Hedonic pricing E. Comparing Regions: Location Quotient (LQ); Economic Base; Export Employment; Input-Output; Multiplier Effects; Leakage Effects; Shift-Share. Identify leading industries based on such prior measures. Include trends in such measures when comparing with other regions. F. Industries and firms (efficiency/productivity) Data Envelopment Analysis Stochastic Frontier Analysis G. Fiscal Health Analysis for public services (to be implemented) Segmentation choices (provincial, city, borough, district) Framework, computational logistics & implementation 2.Project Evaluation Capital Budgeting (framework and computational logistics) Cost-Benefit Analysis (monetised and non-monetised) Overview of process Monetised cost-benefits guides/manuals Non-Monetised Impacts: amenity, aesthetics, environment, ecological, heritage, culture Non-Monetised Benefits Manual: Qualitative and Quantitative Measures, Waka Kotahi NZ Transport Agency 2020 Discounting (NPV, IRR, Risk adjusted gamma) Data, Computational Logistics 3.Public-Private Partnerships (to develop) Grossman, S. A. (2012). The Management and Measurement of Public-Private Partnerships: Toward an Integral and Balanced Approach. Public Performance & Management Review, 35(4), 595–616. Koontz, T. M. & Thomas, C. W. (2012) Measuring the Performance of Public-Private Partnerships, Public Performance & Management Review, 35:4, 769-786 4.The Principal-Agent Problem Principal-Agent Problem in Government Concept and examples Instruments and Mechanisms (subject to costs and benefits) Performance metrics/evaluation and compensation: aligning the interests of both principal and agent. Note: may comprise of both quantitative and qualitive elements. Monitoring and Reporting Systems (types) Auditing & Verification (types) Gov’t oversight/inspection agencies (assumption of neutral agenda) Agents’ equity welfare/standing with project/programme Requires constant review Performance bonds or insurance? 5.Better Business Analysis of the following: Alfaro, L. et al (2021). Doing Business: External Panel Review. Final Report, World Bank Pre-Concept Note Business Enabling Environment (BEE) February 4, 2022, World Bank How to implement the identified measures from prior articles? Pursue such. 6.Healthcare To develop: Alemayehu, B., & Warner, K. E. (2004). The Lifetime Distribution of Health Care Costs. Health Services Research, 39(3), 627–642. Market Deviations: Mwachofi, A. & Al-Assaf, A. F. (2011). Health Care Market Deviations from the Ideal Market. Sultan Qaboos University Med. Journal, 11(3), 328–337. To develop with ambiance of interest: Friesen, C. E., Seliske, P. & Papadopoulos, A. (2016). Using Principal Component Analysis to Identify Priority Neighbourhoods for Health Services Delivery by Ranking Socioeconomic Status. Online Journal of Public Health Informatics, 8(2) Yu, J., Castellani, K., Forysinski, K. et al. (2021). Geospatial Indicators of Exposure, Sensitivity, and Adaptive Capacity to Assess Neighbourhood Variation in Vulnerability to Climate Change-Related Health Hazards. Environmental Health 20, 31 7.Applying the Overlapping Generations Model (OLG) Model overview and applications Dynare + OccBin Toolkit and DynareR can treat 8.National Accounts (NA) Assist for topics: SNA 2008 < https://unstats.un.org/unsd/nationalaccount/sna2008.asp < https://unstats.un.org/unsd/nationalaccount/impUNSD.asp Multiple approaches to measure GDP Assess the distribution of income within a population Assess inflation via NA. Is the assessment of inflation equivalent to CPI or PCE? Assess effects of various economic policies 9. Statuses in the Measure of Production of Goods and Services GDP vs Real GDP GNI vs Real GDP Critique of GDP per Capita Harvie, D., Slater, G., Philp, B., & Wheatley, D. (2009). Economic Well-being and British Regions: The Problem with GDP Per Capita. Review of Social Economy, 67(4), 483–505. Ratio of national debt to GDP Note: apply the intelligence gathered from both literature for assessment. May have to extend such with more modern data. Hennerich, H. Debt-to-GDP Ratio: How High Is Too High? It Depends, Federal Reserve Bank of St. Louis Caner, Mehmet; Grennes, Thomas; Koehler-Geib, Fritzi. (2010), Finding the Tipping Point -- When Sovereign Debt Turns Bad. Policy Research Working Paper no. WPS 5391. World Bank. Real GDP versus the labour market and labour forecasting. 10.Fiscal Indicators (computation development and forecasting) Fiscal Indicators Involving: budget balance, debt, revenue, expenditure, and fiscal sustainability. Analysis of IMF’s semi-annually published Fiscal Monitor. Benz, U. and Fetzer, S. (2006). Indicators for Measuring Fiscal Sustainability: A Comparison of the OECD Method and Generational Accounting, FinanzArchiv / Public Finance Analysis, Vol. 62, No. 3, pp. 367-391 (25 pages). 11.Inequality Measurement and Redistribution (active development) Income density plots for a society with inequality at the bottom and a society with inequality at the top. Development of income thresholds: Low income: income that is less than 60% of the median Middle income: income between 60% and 200% of the median High income: income that is greater than 200% of the median To really understand the difference between the two societies, we need to look at the income distributions using a logarithmic transformation. Under a (”one-to-one”) log transformation: {1, 10, 100, 1000} --> {0, 1, 2, & 3}; such compresses the distribution, allowing to better see both the left and right tails. Seeing these tails is important because that’s where the inequality lives. Using a log transformation, replot our income density curves. Evolution of income distribution for chosen amount of years Cost of Living methodology Poverty levels used to determine eligibility for social welfare programmes Means to determine poverty levels; implications for the amount to access to social welfare programmes Income Inequality Measures: De Maio F. G. (2007). Income Inequality Measures. Journal of Epidemiology and Community Health, 61(10), 849–852 King, M. A. (1983). An Index of Inequality: With Applications to Horizontal Equity and Social Mobility. Econometrica, 51(1), 99–115 Alternatives: FGT index, Palma index & Wolfson Polarization index R packages of consideration for contrasts with prior development and public databases: acid, affluenceIndex, dineq, gglorenz, ineq, lorenz, Survgini Redistribution Vertical Equity Measuring vertical distribution Horizontal Equity Measuring horizontal distribution Microsimulation Will analyse structure of chosen models before implementation Bourguignon, F., Spadaro, A. Microsimulation as a Tool for Evaluating Redistribution Policies. J Econ Inequal 4, 77–106 (2006). R package for NBER TAXSIM: usincometaxes Euromod Jonathan Anomaly, J. (2015). Public Goods and Government Action, Politics, Philosophy & Economics, Vol. 14(2) 109–128 On pages 112 for the 7 given questions to pursue data wise w.r.t. to appropriate models. 12.Human Development Human Index (HDI) & WB’s World Development Indicators Analysis of Models and scrutinizing data integrity 13.Economic modelling of externalities Cost and Benefits: monetised and non-monetised treatment Positive externalities Negative production externalities Negative consumption externalities Measuring externalities (to implement) Cost of Damages and Cost of Control Adhikari S.R. (2016) Methods of Measuring Externalities. In: Economics of Urban Externalities. SpringerBriefs in Economics Corrections for negative externalities (production and consumption, respectively) 14.Environmental Economy A. Environmental Externalities concept Determining measurement practicality offered by the following articles: Mark, J. H. (1980). A Preference Approach to Measuring the Impact of Environmental Externalities. Land Economics, 56(1), 103–116. Bemow, S., Biewald, B., Marron, D. (1991). Environmental Externalities Measurement: Quantification, Valuation and Monetization. In: Hohmeyer, O. and Ottinger, R.L. (eds) External Environmental Costs of Electric Power. Springer Are methods from module (14) more practical and representative than prior articles? B. Environmental Economy Measures (to develop) Hedonic Pricing Method Ecosystems Environmental Attributes Travel Cost Method with environmental goods Contingent Valuation Method MAJOR LABS/FIELD PROJECTS --> Note: Instructor should provide ideas on what they’re looking for (in mode of professional administrative development). Note: to be done in groups (with changing constituents). Groups will present their developments. Some labs/field projects will be done in bundles. 1.Census and Demography with R For ambiance in question the databases, APIs, wrangling, etc. Interests of concern: A. Demography The following literature to serve as guides for development in R, where choice of packages and style may vary. The quality-quantity manifold concerning your development will naturally have its critics and proponents. United Nations. Manuals on Estimating Population Yusuf, F., Martins, J. M. and Swanson. D. A. (2014). Methods of Demographic Analysis. Springer Netherlands, 310 pages The Springer Series in Demographic Methods and Population Analysis B. Exploratory Data Analysis: Summary Statistics R Packages CADStat and Tidyverse Variable Distributions Histograms Boxplots Q-Q Plots Scatter Plots Scatterplots are a useful first step in any analysis because they help visualize relationships and identify possible issues (e.g., outliers) that can influence subsequent statistical analyses, or need of regression beyond simple OLS, say, quantile regression or generalized nonlinear models. Note: concerns for the amount of variable pairs. Correlation Analysis (Pearson or Spearman?) Heat Maps ggpairs() function Conditional Probability Analysis (CADStat) Feature Importance/Selection 2.Spatial Microsimulation development Note: crime is not the only interests. Note: Instructor should develop goals and computational logistics before R based immersion development; other tools may also apply. FOCUS LITERATURE FOR DEVELOPMENT O’Donoghue, C., Baltagi, B., & Sadka, E. (2014). Handbook of Microsimulation Modelling (Vol. 293). Emerald Publishing Limited Edwards, K. and Tanton, R. (2012). Spatial Microsimulation: A Reference Guide for Users. Springer Netherlands Harland, K. et al (2012). Creating Realistic Synthetic Populations at Varying Spatial Scales: A Comparative Critique of Population Synthesis Techniques, JASSS. 15(1) 1. TOOLS FOR DEVELOPMENT Packages msm and MicSim may accompany such above texts. Some assists for both packages: Sabine Zinn, 2014. The MicSIM Package of R: An Entry-Level Toolkit for Continuous-Time Microsimulation. International Journal of Microsimulation, International Microsimulation Association, vol. 7(3), pages 3-32. Jackson, C. H. Multi-State Models for Panel Data: The msm Package for R. Journal of Statistical Software, January 2011, Volume 38, Issue 8. Lovelace, R. and Dumont, R. (2016). Spatial Microsimulation with R. Chapman and Hall/CRC Modgen < https://www.statcan.gc.ca/eng/microsimulation/modgen/modgen Assisting test for Modgen: Alain Bélanger, A. and Sabourin, P. (2017). Microsimulation and Population Dynamics, An Introduction to Modgen 12, Volume 43. Springer JAS-mine Alternative tool: http://www.geog.leeds.ac.uk/courses/other/crime/microsimulation/practical1.html 3.Economic Efficiency Modelling Data Envelop Analysis & Stochastic Frontier Analysis Analytical development before computation/simulation. Applications in agriculture, industries, public sectors & environmental efficiency R Packages of Interest for DEA rDEA, deaR, Benchmarking R Packages of Interest for SFA frontier, npsf, sfa, ssfa, semsfa, Benchmarking 4.CBA, SROI & PPP COST – BENEFIT ANALYSIS (NPV or IRR based): Literature Assists: Campbell, H., & Brown, R. (2003). Benefit-Cost Analysis: Financial and Economic Appraisal using Spreadsheets (pp. 194-220). Cambridge: Cambridge University Press Sener Salci & Glenn P. Jenkins, 2016. “Incorporating Risk and Uncertainty in Cost-Benefit Analysis”, Development Discussion Papers 2016-09, JDI Executive Programmes. Non-Monetised Benefits Manual: Qualitative and Quantitative Measures, Waka Kotahi NZ Transport Agency 2020 Various projects such as infrastructure, transportation, service branch operations, etc., etc., etc., but environmental and/or ecological impacts are always connected critical issues: Project/Investment description Stakeholders (social, environmental, ecological, economic) Choose a manual or guide or literature that will aid in identifying, quantifying, and evaluating the future costs and benefits of alternative solutions; as well assist in identifying the optimum course of action for decision making purposes. Monetised: Cost and Benefits. Make use of cost estimation guides for development; likewise for benefit. Non-Monetised Impacts Discounting (NPV, IRR, risk adjusted gamma) Tools such as RIMS II, IMPLAN, Chmura, or REMI may factor in B/C ratio Computational logistics for implementation Keep in mind that longer horizons likely will result in likely higher quantitative inaccuracy and various risks. SOCIAL RETURN ON INVESTMENT (SROI): Folger, J. (2021). What Factors Go Into Calculating Social Return on Investment (SROI)? Investopedia Will apply to (past) projects and investments. If Analytic Hierarchy Process is used there are some R packages to accommodate. PUBLIC-PRIVATE PARTNERSHIPS Use the literature from course lecture module (3) 5. Environmental Measures A. LIFE CYCLE ASSESSMENT (LCA) Note: applying LCA will not be lip service Foundation and Guides: ISO 14000 Series Curran, M. A. (2012). Life Cycle Assessment Handbook: A Guide for Environmentally Stable Products. Wiley Heijungs, R, and Suh. S. (2002). The Computational Structure of Life Cycle Assessment. Springer Netherlands Groen, E.A., Bokkers, E.A.M., Heijungs, R. et al. (2017). Methods for Global Sensitivity Analysis in Life Cycle Assessment. Int J Life Cycle Assess 22, pages 1125–1137 For whatever projects or topics chosen such above literature to be guide in analytical development towards a quantitative structure/model. Then, to apply specialized software: OpenLCA or Brightway2 or SimaPro (Community Edition), ACV-GOST, OpenIO, One Click LCA. Can LCA be used to critique Cost-Benefit Analysis and SROI concerning environmental accountability? B. ECONOMIC INPUT-OUTPUT LCA (EIO-LCA) Hawkins, T. & Matthews, D. (2009). A Classroom Simulation to Teach Economic Input−Output Life Cycle Assessment. Journal of Industrial Ecology. Volume 13 Issue 4, pages 622 – 637 EIO-LCA < http://www.eiolca.net > < http://www.eiolca.net/cgi-bin/dft/custom.pl > Further literature Assists: Economic Input-Output Life-Cycle Assessment (EIO-LCA) Hendrickson, C. T. et al. "Comparing Two Life Cycle Assessment Approaches: A Process Model vs. Economic Input-Output-Based Assessment," Proceedings of the 1997 IEEE International Symposium on Electronics and the Environment. ISEE-1997, 1997, pp. 176-181 Hendrickson, C.T., Lave, L.B., & Matthews, H.S. (2006). Environmental Life Cycle Assessment of Goods and Services: An Input-Output Approach (1st ed.). Routledge. 6. World Climate Simulation https://www.climateinteractive.org/world-climate-simulation/ Prerequisites: Enterprise Data Analysis II, International Financial Statements Analysis I & II, Microeconomics II, Introduction to Macroeconomics, Macroeconomic Accounts Statistics, Economics of Regulation, Econometrics, Economic Time Series Empirical International Trade THIS IS NOT A THEORY OF INTERNATIONAL TRADE COURSE. Course emphasizes applicable computational tools for goods that are tradable across borders; goods aren’t necessarily physical. Emphasis on applicable computational development also concerns eliminating the stereotype or misconception of impracticality/intangibility. Obligations may seem congested and hectic in this course; I would be screwing you over if I didn’t make it so; goods in trade across borders is actually a hectic operation. When the dust settles (subject to your dedication), you will have “awakened abilities” for your future. NO GUTS NO GLORY. NOTE: an 18 weeks course. Course will be highly labourious in the R environment; I’m not kidding about that. Prerequisites stated will be invaluable; efficiency and success will depend on them. The effort applied will determine how far you will go. What you have developed will be your “war chest" of computational tools for your future aspirations. Lecturing Texts IN UNISON --> Bacchetta, M. et al. (2012). A Practical Guide to Trade Policy Analysis, World Trade Organisation Yotov, Y. V. et al (2016). An Advanced Guide to Trade Policy Analysis: The Structural Gravity Model (Volume 2), World Trade Organisation Plummer, M. G., Cheong, D. and Hamanaka, S. (2010). Methodology for Impact Assessment of Free Trade Agreements, Asian Development Bank Porto, M. (2020). Using R for Trade Policy Analysis: R Codes for the UNCTAD and WTO Practical. Springer International Publishing Regulations and cooperative frameworks stem from the following --> UNCTAD, WTO, UNCITRAL Further Resources --> https://www.wto.org/english/res_e/reser_e/PracticalGuideFiles.zip https://www.wto.org/english/res_e/reser_e/AdvancedGuideFiles.zip Databases --> UNCTAD, WTO, UNCITRAL, UN Comtrade, OECD, UNFAO, World Bank WITS, World Bank Trade, Production and Protection Database, IMF, CEPII, ITPD-E, Dynamic Gravity Dataset, GTAP, UNSD Grading --> R exercise problems being adjusted and/or augmented (EPAA) Course labs in R and GAMS environment R Development Major Assignments (MA) TBA Group Term Projects (GTP) Literature use: 1.Baccheta, M et al (2012) for (EPAA) and (MA) 2.Yotov, Y. V. et al (2016) for (EPAA) and (MA) 3.Plummer, M. G. et al (2010) for (MA) 4.Porto, M. (2020) for (EPAA) and (MA) 5.Costinot, A. and Rodríguez-Clare, A. (2014). Chapter 4, Trade Theory with Numbers: Quantifying the Consequences of Globalization. In: Handbook of International Economics, Volume 4. Elsevier, pp 197 – 261 (MA) 6.Trade Policy Simulation Models only for GTP UNCTAD Trade Policy Simulation Model Sam Laird and Alexander Yeats UNCTAD-FAO Agricultural Trade Policy Simulation Model (ATPSM) Ralf Peters and David Vanzetti NOTE: for group term projects students must report their developments at designated periods along with consultation with instructor. Students are responsible for R development. COURSE OUTLINE --> Bacchetta et al: Chp 1 – 2 Chp 3 to be augmented by Chp 1 of Yotov et al Chp 4 Chp 5 to be augmented by Chp 2 of Yotov et al Computable General Equilibrium structural development review and use Comparative: limitations of CGE Analysis ang Gravity models Plummer et al: Chp 2 (confined to 2.1) Chp 3 (confined 3.1 – 3.2) Bacchetta et al: Chp 6 COURSE LABS --> Instructor develops the concepts and logistics, then left for students to develop mainly in R. Depending on the lab students will be assigned different ambiances concerning the mentioned goals. Labs will be bunched into groups. 1. Comparative Advantage Review Comparative Advantage Indices Types and respective structure Constructing and Testing Kiyota, K. (2011). A Test of the Law of Comparative Advantage, Revisited, Rev World Econ 147, 771 Choi, Nakgyoon, (2011). Empirical Tests of Comparative Advantage: Factor Proportions, Technology, and Geography. KIEP Research Paper No. Working Paper-11-01 Ballance, R. H., Forstner, H., & Murray, T. (1987). Consistency Tests of Alternative Measures of Comparative Advantage. The Review of Economics and Statistics, 69(1), 157–161. 2. Barriers to Trade and Non-Tariff Trade Measures (Overview) Barriers to Trade WTO’s Technical Barriers to Trade (TBT) Agreement UNCTAD - Non-tariff measures (NTMs) 3. Active Comparative Analysis of Partial Equilibrium Models From the text of Bacchetta et al, namely, pp 146 – 171 (and Yotov et al), will be comparing such models and uses to those from the following: Hallren, R. and Riker, D. (2017). An Introduction to Partial Equilibrium Modelling of Trade Policy. USITC Economic Working Paper Series, Working Paper 2017-07-B Khachaturian, T. and Riker, D. (2016). A Multi-Mode Partial Equilibrium Model of Trade in Professional Services. USITC Economic Working Paper Series, Working Paper 2016-11-A. Note: consider services or markets of interest 4. Literature to analyse and simulate for various conditions: Devereux, M. (2000). A Simple Dynamic General Equilibrium Model of the Tradeoff Between Fixed & Floating Exchange Rates. London, Centre for Economic Policy Research. Simulate various conditions/circumstances DYNARE + OccBin Toolkit Package DynareR 5. Real Exchange Rate Structure and Alternatives EUROSTAT-OECD Methodological Manual on Purchasing Power Parities (PPPs), European Union / OECD, 2012 Schmitt-Grohé, S., Uribe, M. and Woodford, M. (2022). Chapter 9, Real Exchange Rate. In: International Macroeconomics: A Modern Approach, Princeton University Press Moosa I.A., Bhatti R.H. (1997) Purchasing Power Parity: Model Specification and Related Econometric Issues. In: International Parity Conditions. Palgrave Macmillan, London. 6. Real Exchange Rate Measures Salto, M. and Turrini, A. (2010). Comparing Alternative Methodologies for Real Exchange Rate Assessment. Economic Papers 427. European Commission Methodologies to develop 7. Time Series for Demand Exports Models Mahmoud, E., Motwani, J., & Rice, G. (1990). Forecasting US Exports: An Illustration using Time Series and Econometric Models. Omega-international Journal of Management Science, 18, 375-382 Senhadji, A. S., & Montenegro, C. E. (1999). Time Series Analysis of Export Demand Equations: A Cross-Country Analysis. IMF Staff Papers, 46(3), pages 259 –273 Imports Models Agbola, F. W. and Damoense, M. Y. (2005), Time‐Series Estimation of Import Demand Functions for Pulses in India, Journal of Economic Studies, Vol. 32, Number 2, pp. 146-157 Keck, A., A. Raubold and A. Truppia (2010), "Forecasting International Trade: A Time Series Approach", OECD Journal: Journal of Business Cycle Measurement and Analysis, vol. 2009/2 8. Determining price elasticities of import demand and export supply Kee, H. L., Nicita, A., & Olarreaga, M. (2008). Import Demand Elasticities and Trade Distortions. The Review of Economics and Statistics, 90(4), 666–682 Imbs, J. and Mejean, I. (2010). Trade Elasticities: A Final Report European for the European Commission. Economic Papers 432 Tokarick, S. (2010). A Method for Calculating Export Supply and Import Demand Elasticities, IMF Working Papers, 2010(180), A001. Fontagné, L. G., Guimbard, H. & Orefice, G. 2019. Product-Level Trade Elasticities: Worth Weighting For. CEPII Working Paper No 2019-17 9. Gravity Models Concept and purpose. Strengths and weaknesses of Gravity Models. NOTE: use of R package “gravity” compared to direct development in R. Chaney, T. (2013). The Gravity Equation in International Trade: An Explanation. NBER Working Paper Series, Working Paper 19285 Econometric estimation of gravity equations: Baltagi B.H., Egger P.H., Erhardt K. (2017) The Estimation of Gravity Models in International Trade. In: Matyas L. (eds) The Econometrics of Multi-Dimensional Panels. Advanced Studies in Theoretical and Applied Econometrics, vol 50. Springer, Cham Shepherd, B., Doytchinova, H. and Kravchenko, A. (2019). Gravity Model of International Trade: A User Guide' (R version). Bangkok: United Nations ESCAP 10. Barriers to Trade, Basic Analysis of Tariffs, and Gravity Model Revisited Barriers to trade and Non-Tariff Measures (review) Basic Analysis of a Tariff Nasreen Nawaz (2019) A Dynamic Model for an Optimal Specific Import Tariff, The International Trade Journal, 33:3, 255-276 How to test? Gravity Model for Barriers Explaining barriers to trade with the Gravity Model Gravity model for tariffs Using the Gravity Model to Estimate the Costs of Protectionism How do firms or countries evade Tariffs? Counter tactics? Case Studies. 11. CGE Trade Modelling (with GAMS) Try to make the following real data relevant as possible: Zhang, X. G. (2006). Armington Elasticities and Terms of Trade Effects in Global CGE Models. Productivity Commission Staff Working Paper. Melbourne Lofgren, H. and Cicowiez, M. (2018). Linking Armington and CET Elasticities of Substitution and Transformation to Price Elasticities of Import Demand and Export Supply: A Note for CGE Practitioners. CEDLAS, Working Papers 0222 Burfisher, M. (2021). Trade in a CGE Model. In: Introduction to Computable General Equilibrium Models. Cambridge University Press. pp. 194-218 Whalley, J. (2012). General Equilibrium Global Trade Models. The Tricontinental Series on Global Economic Issues: volume 1 Helpful CGE literature: Hosoe, N., Gasawa, K., & Hashimoto, H. (2010). Textbook of Computable General Equilibrium Modeling: Programming and Simulations. London: Palgrave Macmillan Limited. Chang, G. H. (2022). Theory and Programming of Computable General Equilibrium (CGE) Models: A Textbook for Beginners. World Scientific. Premier Models (choice of 2-3) OECD- METRO trade model CEPII MIRAGE - E GTAP models (standard model, Dynamic GTAP, GTEM, MYGTAP) < https://www.gtap.agecon.purdue.edu/default.asp > Worldbank-Linkage CPB Worldscan PEP Standard CGE Models 12. Real Effective Exchange Rate (REER) What is real effective exchange rate (REER)? – IMF DATA Help. (n.d.). Datahelp.imf.org. https://datahelp.imf.org/knowledgebase/articles/537472-what-is-real-effective-exchange-rate-reer World Development Indicators | DataBank. (2015). Worldbank.org. https://databank.worldbank.org/source/world-development-indicators/Series/PX.REX.REER# Comprehending the REER formula. How to develop to compare against (IMF or world Bank) data? Discussion paper to develop: Coutinho, L. et al (2021). Methodologies for the Assessment of Real Effective Exchange Rates. European Economy Discussion Paper 149 Working paper to develop and comparative counterpart development to prior: Mayer, T. and Steingress, W. (2019). Estimating the Effect of Exchange Rate Changes on Total Exports. BIS Working Papers No 786 Highlight the key takeaways in the following source and pursue such assessments: Hayes, A. (2020). Real Effective Exchange Rate – REER Definition, Investopedia 13. Balassa-Samuelson Effect (BSE) Model development Measurement Analyse & develop the measures to compare with the database: Couharde, C. et al (2019). Measuring the Balassa-Samuelson- Effect: A Guidance Note on the RPROD Database. CEPII Working Paper, Paris Will there be differences in prices and incomes across countries as a result of differences in productivity? Analyse and replicate, then use of more modern data: MacDonald R. and Ricci, L. A. (2001). PPP and the Balassa-Samuelson Effect: The Role of the Distribution Sector. IMF Working Paper WPIEA0382001 To validate: BSE “explains why using exchange rates vs. purchasing power parity to compare prices and incomes across countries will give different results”, Investopedia. 14. Analysis of the Current Account and benchmarks (implementable) Analysis of the Current Account Ca’ Zorzi, M., Chudik, A. and Dieppe, A. (2009). Current Account Benchmarks for Central and Eastern Europe. A Desperate Search? European Central Bank Working Paper Series No. 995 Coutinho, L., Turrini, A. and Zeugner, S. (2018). Methodologies for the Assessment of Current Account Benchmarks. EU Discussion Paper 086 15. Montiel, P. J. (2002). "11 The Long-Run Equilibrium Real Exchange Rate: Theory and Measurement". In Macroeconomic Management. USA: International Monetary Fund. (requires implementation assignments) Prerequisites: Microeconomics III, (or Advanced Macroeconomics), Econometrics, Economic Time Series. Computational Labour Economics The objective of the course is to immerse students into applicable and practical tools of modelling, computation and econometrics for labour economics. In a manner that provides sustainability for future academic and professional interests. Hence, prerequisites for this course are a bit more advanced than the typical “ social fodder” or “in one ear, out the next” undergrad course. This is neither a course in sociology, nor psychology, nor social welfare, nor political science, nor philanthropy. PREREQUISITES ARE PREREQUIITES; WILL NOT “HIT THE BREAKS” FOR ANYONE CONCERNING PREREQUISITES. YOU ARE IN THIS COURSE BECAUSE THE PREREQUISITES ARE MET. LAB MODULE 1 A. Integration of modern data sources (e.g., .xlsx, .csv and APIs from BLS, NBER, OECD, IMF, UNSD). Emphasis on advanced data wrangling, summary statistics, exploratory data analysis, correlation matrices, heatmaps, time series analysis. B. CPS Data Flinn, C. “Econometric Analysis of CPS-Type Unemployment Data.” J. of Human Resources (1986) 21: 456-484. Analyse, replicate and develop to ambiance of interest. C. Median Duration of In-Progress Unemployment Spells: Time Series and salient features LAB MODULE 2 A. Okun’s law and beyond. Use of various data sets to tests; possibility of different time frames and unique ambiances. B. Relationship between fed fund rate and unemployment Sam, K. A. (2014). The Federal Funds Rate and Unemployment Relationship: Does Business Confidence Matter? University of Wisconsin-Stout Journal of Student Research, 13, 112-126. Article to be analysed/critiqued. Followed development of all displays; pursuit of more modern time periods as well with multiple countries. C. Conventional economic variables for employment modelling and forecasting. Model identification, estimation, forecasting & error. Some candidate predictor variables of features: Fed Funds Rate Inflation Gov’t Spending Gov’t Deficit Public Debt Business payroll taxes (might be a bit tricky with data wrangling) Purchasing Management Index Industrial Production Index Trade Balance GDP D. Analyse, replicate and pursue ambiances of interest: Lafourcade, P. et al (2016). Labour Market Modelling in Light of the Financial Crisis. Occasional Paper Series, No. 175. European Central Bank Note: applicable to other crises w.r.t. ambiances E. Fiscal Policies and Labour (also treat more modern times) Bovaa, E., Kolerus, C. and Tapsoba, S. J. A. (2014). A Fiscal Job? An Analysis of Fiscal Policy and the Labour Market. IMF WP/14/216 F. Tax Burden Will choose topics from the following text to development and implement Sorensen, P. B. (2022). Measuring the Tax Burden on Capital and Labour, MIT Press G. Developing the Beveridge Curve H. Regis Barnichon & Christopher J. Nekarda, 2013. The Ins and Outs of Forecasting Unemployment: Using Labor Force Flows to Forecast the Labor Market. Finance and Economics Discussion 2013 - 19, Board of Governors of the Federal Reserve System (U.S.). Note: may compare with (C) concerning forecasting. LAB MODULE 3 Search and Matching Model in Labour Economics (concept and structure serving in labour economics) To develop for ambiances of interest: Lubik, T. A. (2009). Estimating a Search and Matching Model of the Aggregate Labour Market. Economic Quarterly—Volume 95, Number 2—Pages 101–120 Robalino, D. A. & Weber, M. (2016). Simulations of Labour Policies in Tunisia with a Structural Job-Search Model. World Bank Demirel, U. D. (2020). Labor Market Effects of Tax Changes in Times of High and Low Unemployment. Congressional Budget Office, Working Paper 2020-05 Lancaster, T. (1979). Econometric Methods for the Duration of Unemployment, Econometrica, 47(4), 939-956. LAB MODULE 4 A. Wage Model Development Prospect predictors to validate: education, work experience, unionization, industry, occupation, region, demographics, etc. Coefficients via OLS and Quantile Model Validation Wage conditional probabilities and conditional expectations (for various predictor variables, one at a time or in bulk) w.r.t. data. Marginal effects (margins package) B. Long-Run Asymmetries Kölling, A. (2020). Long‐Run Asymmetries in Labor Demand: Estimating Wage Elasticities of Labor Demand Using a Fractional Panel Probit Model, Labour, 34(1), pp. 26-47. Note: try logit as well. C. Wage Characterisation Note: determine constructive succession order, or choose which is most practical, time effective and progressive. Cahuc, P., Postel-Vinay, F., & Robin, J.-M. (2006). Wage Bargaining with On-the-Job Search: Theory and Evidence. Econometrica, 74(2), 323–364. Postel-Vinay, F. and JM Robin. (2002). Wage Dispersion with Worker and Employer Heterogeneity. Econometrica70: 295-350 Moscarini, G. (2005). Job Matching and the Wage Distribution. Econmetrica 73: 481 - 516 Hofler, R. A., & Murphy, K. J. (1994). Estimating Reservation Wages of Employed Workers Using a Stochastic Frontier. Southern Economic Journal, 60(4), 961–976. Krueger, A. B. and Mueller, A. I. (2014). A Contribution to the Empirics of Reservation Wages. NBER Working Paper Series, Working Paper 19870| D. Wage Forecasting For the following develop with exclusion of NFIB: Knotek, E. S. (2015). Difficulties Forecasting Wage Growth. Federal Reserve Bank of Cleveland Note: for BVAR one can compare model determination with the BVAR package and bvartools in R. E. Hedonic Wage model Prospect predictors to validate Coefficients via OLS and Quantile Model Validation F. Employment Cost Employment Cost Index (ECI) Ruser, J. W. (2001). The Employment Cost Index: What Is It? Monthly Labor Review < https://www.bls.gov/opub/mlr/2001/09/art1full.pdf Relationships between Wages, Prices, and Economic Activity One to pursue development/critique of the analytical/time series models. Data will be used to validate. To apply more modern data afterwards. Knotek, E. S. and Zaman, S. (2014). On the Relationships between Wages, Prices, and Economic Activity. Economic Commentary. Federal Reserve Bank of Cleveland G. Logistic/Probit Regression in Labour Economics Fluid analysis and computational logistics towards implementation. Can adjust to places of interest with data relevance (incorporating modern data) in development. Options: Ciecka, J., & Donley, T. (1996). A Logit Model of Labor Force Participation, Journal of Forensic Economics, 9(3), 261-282. Kiiver, H. and Espelage, F. (2016). The Use of Regression Models in Labour Market Flow Statistics. European Conference on Quality in Official Statistics Ciuhu (Dobre), Ana-Maria & Caragea, Nicoleta & Alexandru, Ciprian, (2017), Modelling the Potential Human Capital on the Labour Market Using Logistic Regression in R. Romanian Statistical Review. 65. 141-152. Strzelecka, A., Kurdyś-Kujawska, A. and Zawadzka, D. (2020). Application of Logistic Regression Models to Assess Household Financial Decisions Regarding Debt. Procedia Computer Science 176, 3418–3427 The household and employment determinants of poverty for households different time points. COURSE OUTLINE --> MODULE 1 (Introduction to Labour Economics) Labour Supply Labour Demand Competitive Equilibrium Cairo, I., Fujita, S. and Morales-Jiménez, C. (2019). Elasticities of Labor Supply and Labor Force Participation Flows. Federal Reserve Bank of Philadelphia, Working Paper 19-03. NOTE: acquiring data to model all such (for ambiances of interest) MODULE 2. (Macroeconomic Influences on Employment) MODULE 3. (Labour Market Dynamics) Advance review of labour demand and supply: theory and empirical analysis. Structural models in labour economics: Matching models, search models. Empirical estimation of labour market models MODULE 4. (Wages Analysis) Wage determination: Human capital, experience, and education Wage differentials and inequality: Empirical analysis Arai, M. (1994). Compensating Wage Differentials versus Efficiency Wages: An Empirical Study of Job Autonomy and Wages. Industrial Relations, Volume 32, Issue 2, pages 249 – 262 Fairris, D., & Alston, L. J. (1994). Wages and the Intensity of Labor Effort: Efficiency Wages versus Compensating Payments. Southern Economic Journal, 61(1), 149–160. The following can be situated to more modern data: Card, D. (1996). The Effect of Unions on the Structure of Wages: A Longitudinal Analysis. Econometrica, 64(4), 957–979 Gurtzgen, N. (2016). Estimating the Wage Premium of Collective Wage Contracts: Evidence from Longitudinal Linked Employer-Employee Data, Industrial Relations (Berkeley), 55(2), 294–322 Barth, E., Bryson, A. and Dale-Olsen, H. (2020). Union Density Effects on Productivity and Wages, The Economic Journal, Volume 130, Issue 631, Pages 1898–1936 MODULE 5. (Labour Market Policy Evaluation) Introduction to active labour market policies (ALMPs) Evaluation methods: Difference-in-differences, propensity score matching Case studies: Evaluating the effectiveness of ALMPs MODULE 6. (Minimum Wage Simulations) Theoretical foundations of minimum wage effects Empirical evidence on the impact of minimum wage laws Simulation models for minimum wage policies An accessory: Wolff, E., & Nadiri, M. (1981). A Simulation Model of the Effects of an Increase in the Minimum Wage on Employment, Output, and the Price Level. In: Report of the Minimum Wage Study Commission (Vol. 6). U.S. Government Printing Office. Flinn, C. J. (2006). Minimum Wage Effects on Labour Market Outcomes under Search, Matching & Endogenous Contact Rates. Econometrica, Vol. 74, No. 4, 1013–1062 MaCurdy, T. (2015). How Effective is the Minimum Wage at Supporting the Poor? Journal of Political Economy Volume 123, Number 2 MODULE 7. (Week Labour Market Inequality and Mobility) Measuring labour market inequality: Gini coefficient, Theil index Labour mobility and migration: Theoretical and empirical perspectives Policy implications of labour market inequality and mobility MODULE 8. (Costs and Production) Human Capital ROI (upon public sector elements) Development and verification via financial statements, annual reports, etc. For whatever entities of interests (among cities, or provinces) Thomas E. Lambert. (2016). Do Efficiency and Productivity Pay Off for Capital and Labor? A Note Using Data Envelopment Analysis. World Review of Political Economy, 7(4), 474–485. MODULE 9. (Other Topics) Non-standard work arrangements: Gig economy, part-time work Analysing the Gig economy with modern datasets Labour market consequences of technological change Replicate findings then apply to more modern data Horgos, D. (2009). Labour Market Effects of International Outsourcing: How Measurement Matters. International Review of Economics and Finance 18, pages 611–623 VAR models in Labour economics Prerequisites: Microeconomics III, Introduction to Macroeconomics, Econometrics, Economic Time Series
Agriculture & Economic Sustainability Course serves to introduce basic agricultural research and incorporation of economic measures and tools. Course will be lab and field based. Each module will be accommodated by labs. Note: 3 hours per lab session. Lab sessions serve as logistics for lecture sessions. A lab session will highly likely accommodate multiple lab topics. Tools and skills from prerequisite courses will be invaluable for labs; students will be responsible for computational development and reports. Note: ambiances assigned may vary among students on multiple occasions. As well, identified commodities may be substituted by other commodities, specifically for produce. Conversions Reference (CR) --> Weights, Measures, and Conversion Factors for Agricultural Commodities and Their Products. Economic Research Service in cooperation with the Agricultural Marketing Service, the Agricultural Research Service, and the National Agricultural Statistics Service, U.S. Department of Agriculture. 1992, Agricultural Handbook No. 697 Outline --> 1. Agricultural conversions. CR given will be applied for various (field/lab) exercises. 2. Sustainability Planning A. Cropping Systems Blanco-Canqui, H., Lal, R. (2010). Cropping Systems. In: Principles of Soil Conservation and Management. Springer, Dordrecht. Identify/characterize types in ambiance Yang, T., Siddique, K. H. M., & Liu, K. (2020). Cropping Systems in Agriculture and their Impact on Soil Health-A Review. Global Ecology and Conservation, 23, [e01118] Amsili, J. P. et al (2021). Cropping System and Soil Texture Shape Soil Health Outcomes and Scoring Functions. Soil Security 4, 100012 Make relevant to ambiance data B. Multicriteria Decision Analysis Note: example articles to emulate for ambiances of interest. GRASS GIS with MCDA add-ons to be applicable. Part A ( Land Use) Herzberg, R. et al. (2019). Land, 8(6), 90. MDPI AG. Wotlolan, D.L., Lowry, J.H., Wales, N.A. et al. (2021). Agroforest Syst 95, 1519–1532 (2021). Part B (Water Management) Ravier, C. et al (2015). Land Use Policy , vol. 42 pp 131 – 140 Radmehr, A., Bozorg-Haddad, O. & Loáiciga, H.A. (2022). Sci Rep 12, 8406 (2022). C. Crop Rotation (subjugated by A and B) Overview Crop Rotation Simulation Asseng, S. et al (2014). Simulation Modelling: Applications in Cropping Systems. Encyclopedia of Agriculture and Food Systems. Pages 102 – 112 The most common models used to simulate crop rotations are DSSAT, EPIC, APSIM, CropSyst, STICS, SALUS, and root zone water quality model (RZWQM). Hopefully choices (at least 2) are accessible, fluid and practically implementable. D. Can (A) through (C) be efficiently integrated? 3. Supply and Demand for Commodities A. Estimating demand curves and supply curves with regression B. Estimating elasticities of supply and demand Kennes, W. (1983). European Review of Agricultural Economics, 10(4), pages 357–376 Wohlgenant, M. K. (1985). Western Journal of Agricultural Economics 10(2): 322-329. Helen, D., and L. S. Willett. (1986). Northeastern Journal of Agricultural and Resource Economics, pp. 160-167. Helen, D. and G. Pompelli. (1988). Western Journal of Agriculture Economics. 13: 37-44 Price, D. W., & Mittelhammer, R. C. (1979). Western Journal of Agricultural Economics, 4(1), 69–86. Huang, K. [US Demand for Food: A Complete System of Price and Income Effects.] United States Department Of Agriculture, Economic Research Service, Technical Bulletin 1714 Huang, K. S., and B. Lin. (2000). Estimation of Food Demand and Nutrient Elasticities from Household Survey Data. Food and Rural Economic Division, Economic Research Service, US Department of Agriculture, Technical Bulletin, Number 1887 Brester, G. W., and M. K. Wohlgenant. (1993). Correcting For Measurement Error in Food Demand Estimation. The Review of Economics and Statistics. 75: 352-356 Roberts, M. J., & Schlenker, W. (2013). The American Economic Review, 103(6), 2265–2295. [NBER version exists] Al Rawashdeh, R. (2022). Estimating Short-Run (SR) and Long-Run (LR) Demand Elasticities of Phosphate. Miner Econ (2022). C. Recollection: what conclusions can be conventionally drawn from development of (A) and (B)? 4. Agricultural Household Models: Theory and Applications Note: goal is to have such literature be relatable to data of interest. Singh, I., Squire, L., & Strauss, J. (1986). A Survey of Agricultural Household Models: Recent Findings and Policy Implications. The World Bank Economic Review, 1(1), 149–179 Benjamin, D. (1992). Household Composition, Labor Markets, and Labor Demand: Testing for Separation in Agricultural Household Models, Econometrica, Vol. 60, No. 2, pp. 287-322 Singh, Inderjit; Squire, Lyn; Strauss, John [editors]. Agricultural Household Models: Extensions, Applications, and Policy (English). Washington, D.C. World Bank Group Taylor, J.E. and Adelman, I. (2003). Agricultural Household Models: Genesis, Evolution, and Extensions. Review of Economics of the Household 1, 33–58 5. Farm Size and Productivity Relationship Note: goal is to have literature be relatable to data of interest. 6. Market Analysis in Agriculture PESTEL and SWOT are applicable 7. Soft Commodities Pricing Methods PART A Given literature to analyse, computationally replicate, and augment with more modern data (for countries and commodities of interest). Westcott, P. C. and Linwood A. Hoffman. (1999). Price Determination for Corn and Wheat: The Role of Market Factors and Government Programmes. Market and Trade Economics Division, Economic Research Service, U.S. Department of Agriculture. Technical Bulletin No. 1878 PART B Given literature to analyse, computationally replicate, and augment with more modern data (for countries and commodities of interest). Joutz, F. L. et al (2000). Retail Food Price Forecasting at ERS: The Process, Methodology, and Performance from 1984 to 1997. Economics Research Service, USDA. Technical Bulletin No. 1885 PART C Given literature to analyse, computationally replicate, and augment with more modern data (for countries and commodities of interest). Knittel, C. R. and Pindyck, R. S. (2016). The Simple Economics of Commodity Price Speculation. American Economic Journal: Macroeconomics, 8(2): 85–110 8. Weather Data Exploratory Data Analysis in R for regions of interest Identify reliable data sources. Data size will be extremely huge. Introspection of data. Concerns are periods relevant to agricultural activity and time length of data. Querying with parameters specified. Generate summary statistics R Packages CADStat, Tidyverse, Tidymodels Data Wrangling Summary Statistics, Skew, Kurtosis Variable Distributions Histograms Boxplots Q-Q Plots Scatter Plots Scatterplots are a useful first step in any analysis because they help visualize relationships and identify possible issues (e.g., outliers) that can influence subsequent statistical analyses, or need of regression beyond OLS, say, quantile regression or generalized nonlinear models. Note: concerns for the number of variable pairs. Correlation Analysis (Pearson or Spearman?) Conditional Probability Analysis In cases in which many different variables interact, multivariate approaches for exploring data may provide greater insights: Feature Importance/Selection methods Note: apart from regression, time series (salient characteristics via decompositions, cointegration, forecasting), and other ML algorithms. 9. Environmental Safety Concerning Floods Flood Inundation Mapping and Simulation. HEC-RAS and HEC-FIA may be serviceable for considered environment; succeeds credible geology assessment with GIS application (say GRASS GIS) and historical data. Food Safety US FDA (2011) - Guidance for Industry: Evaluating the Safety of Flood-affected Food Crops for Human Consumption 10. Risk Assessment Choudhary, Vikas, et al (2016). Agricultural Sector Risk Assessment: Methodological Guidance for Practitioners (English). Agriculture Global Practice Discussion Paper, no. 10 Washington, D.C., World Bank Group. NOTE: prior to be used for profiling chosen environment. Along with (8) and (9), the following may be integrable with prior, or a stand alone pursuit -- AgMIP – https://agmip.org/data-and-tools-updated/ 11. Cash Crops Motivation for cash crop production. Why a balanced agriculture portfolio over cash crops? Disasters and causes with cash crops. 12. Tools of consideration for crop production planning: Mean-Variance Analysis (MVA) Target MOTAD (TMOTAD) Articles following as guides for development. However, will be working with real agriculture data from farmers/producers in environments of interest for development. Tauer, L. W. (1983). Target MOTAD. American Journal of Agricultural Economics, 65(3), 606–610. Watts, M. J., Held, L. J. and Helmers, G. A. (1984). A Comparison of Target MOTAD to MOTAD. Canadian Journal of Agricultural Economics, 32(1), pages 175 -186 Curtis, C. E. et al. (1987). A Target MOTAD Approach to Marketing Strategy Selection for Soybeans. North Central Journal of Agricultural Economics, 9(2), 195–206. Berbel, J. (1990). A Comparison of Target MOTAD Efficient Sets and the Choice of Target. Canadian Journal of Agricultural Economics, 38(1),149 -158 Comparative Assessment: MVA versus TMOTAD 13. Life Cycle Assessment (LCA) in Agriculture General guide structure: LCA from ISO 14000 series Note: OpenLCA or Brightway2 or SimaPro (community Edition), ACV-GOST, OpenIO, One Click LCA may be serviceable. General: Haas, G., Wetterich, F. & Geier, U. (2000). Life Cycle Assessment Framework in Agriculture on the Farm Level. Int. J. LCA 5, 345 De Rosa, M. (2018). Land Use and Land-use Changes in Life Cycle Assessment: Green Modelling or Black Boxing? Ecological Economics, volume 144, pages 73 – 81 van der Werf, H.M.G., Knudsen, M.T. & Cederberg, C. (2020). Towards Better Representation of Organic Agriculture in Life Cycle Assessment. Nat Sustain 3, pages 419–425 Pesticide Relevant Margni, M. et al. (2002). Life Cycle Impact Assessment of Pesticides on Human Health and Ecosystems. Agriculture, Ecosystems & Environment. 93(1-3). Pages 379-392. Hellweg, S. and Geisler, G. (2013). Life Cycle Impact Assessment of Pesticides, Int J LCA 8, 310–312 Xue, X., Hawkins, T.R., Ingwersen, W.W. et al. (2015). Demonstrating an Approach for Including Pesticide use in Life-Cycle Assessment: Estimating Human and Ecosystem Toxicity of Pesticide use in Midwest Corn Farming. Int J Life Cycle Assess 20, 1117–1126 Peña, N. et al. (2018). Freshwater Ecotoxicity Assessment of Pesticide use in Crop Production: Testing the Influence of Modelling Choices. Journal of Cleaner Production. 209. Pages 1332-1341 Note: honourable mention -- Sponsler, D. B. et al (2019). Pesticides and Pollinators: A Socioecological Synthesis. Science of the Total Environment 662, 1012 – 1027 14. Environmental/Habitat Impact PART A (likely inquisition from 13) Van der Werf HMG, Tzilivakis J, Lewis K, Basset-Mens C. (2007), Environmental Impacts of Farm Scenarios According to Five Assessment Methods. Agriculture, Ecosystems & Environment 118(1-4): 327-338 Van der Werf HMG, Petit J. (2002). Evaluation of the Environmental Impact of Agriculture at the Farm Level: A Comparison and Analysis of 12 Indicator-Based Methods. Agriculture, Ecosystems and Environment 93: 131-145 15. Overview of licenses and registrations for particular services and products in agriculture 16. Agriculture Sustainability FAO Sustainable Goals: https://www.fao.org/sustainable-development-goals/indicators/241/en/ Methodology Data Collection & Reporting E-Learning FAO - A Literature Review on Frameworks and Methods for Measuring and Monitoring Sustainable Agriculture. Further Literature: Bockstaller, C., Guichard, L., Keichinger, O. et al. (2009). Comparison of Methods to Assess the Sustainability of Agricultural Systems. A Review. Agron. Sustain. Dev. 29, 223–235 Hayati, D., Ranjbar, Z., Karami, E. (2010). Measuring Agricultural Sustainability, In: Lichtfouse, E. (eds) Biodiversity, Biofuels, Agroforestry and Conservation Agriculture. Sustainable Agriculture Reviews, vol 5. Springer, Dordrecht. 17. Productivity and Efficiency in Agriculture PART A Food and Agriculture Organization of the United Nations (FAO). (2017), Productivity and Efficiency Measurement in Agriculture: Literature Review and Gaps Analysis USDA Documentation and Methods: https://www.ers.usda.gov/data-products/international-agricultural-productivity/documentation-and-methods/ PART B Data Envelopment Analysis and Stochastic Frontier Analysis R Packages of Interest for DEA rDEA, deaR, Benchmarking R Packages of Interest for SFA frontier, npsf, sfa, ssfa, semsfa, Benchmarking 18. Livestock PART A - Livestock Systems Overview PART B - Sustainable Livestock Systems Moran D. and Blair K. J. (2021). Review: Sustainable Livestock Systems: Anticipating Demand-Side Challenges. Animal 15(1), 100288 19. Financial Models & Valuation Developing a Farm Financial Model: Note: for a real farm based on assets, agriculture data, real estate data and expenditure needs data, to develop a farm financial model. Heavy on spreadsheets (and some R). Farms to vary among student groups. Step 1: Define the Scope of the Model < farm type, time horizon, (net income or cash flow or ROI) > Step 2: Revenue Projections (identify revenue sources, revenue calculation out of crops, livestock, subsidies/grants, and other; revenue calculation) Step 3: Cost Estimates Operating costs (variable, fixed) Capital Expenditures Purchase of machinery, equipment, land improvements Amortize large capital expenses over their useful life. Step 4: Cash Flow Analysis Cash Inflows Sales Revenue Loan Proceeds Government Payments Cash Outflows Operating Expenses Capital Expenditures Loan Repayments Taxes Net Cash Flow Net Cash Flow = Cash Inflows - Cash Outflows Develop a monthly or quarterly cash flow projection. Step 5: Financial Statements (develop the major three) Step 6: Sensitivity Analysis Identify Key Variables: Yield per acre, market prices, input costs, interest rates. Run Scenarios: Best-case, worst-case, and base-case scenarios. Impact Assessment: Analyse how changes in key variables affect the farm’s financial performance. Step 7: Financial Ratios and Metrics (from adjust the 3 FS) Profitability Ratios Gross Margin & Net Profit Margin Liquidity Ratios Current Ratio & Quick Ratio Efficiency Ratios Asset Turnover & Inventory Turnover Step 8: Reporting and Visualization Dashboard Creation: Use Excel or R to create visual dashboards. Include key metrics, charts, and summaries. Regular Updates: Update the model with actual data periodically. Decision Support: Use the model to support decision-making (e.g., expansion plans, cost-cutting strategies). Step 9: Risk Management Insurance Planning: Include insurance costs and evaluate coverage options. Diversification Strategies: Consider crop diversification, value-added products. Contingency Plans: Plan for adverse scenarios like crop failure, market crashes. Step 10: Review and Adjustment Regular Review: Periodically review the model for accuracy. Adjust Assumptions: Update assumptions based on actual performance and market trends Farm Valuation: Edwards, William M. (2017). How Much Is That Farm Really Worth—A Comparison of Three Land Purchase Decision Tools. Journal of Applied Farm Economics 1(1), Article 2 Jeanneaux, P. et al (2022). Farm Valuation: A Comparison of Methods for French Farms. Agribusiness 38(4), pp 786-809 Ma, S., & Swinton, S. M. (2012). Hedonic Valuation of Farmland Using Sale Prices versus Appraised Values. Land Economics, 88(1), 1–15. Prerequisites: Intrnl. Financial Statements Analysis II, Microeconomics II, Econometrics, Economic Time Series FOR ACTIVITIES IN THE “SUMMER” AND WINTER” SESSIONS ALL PARTICIPATING STUDENTS, ASSISTING/ADVISING INSTRUCTORS AND PROFESSORS MUST BE OFFICIALLY RECOGNISED; REQUIRES BOTH CIVILIAN ID AND STUDENT/FACULTY ID FOR CONFIRMATION OF INDIVIDUAL. THERE WILL ALSO BE USE OF IDENTIFICATIONS FOR ACTIVITIES FOR RESPECTIVE SESSION. SECURITY AND NON-PARTICIPATING ADMINISTRATION WILL ONLY IDENTIFY RESPECTIVE ACTIVITY BY IDENTIFICATION CODE. SECURITY AND NON-PARTICIPATING ADMINISTRATION MUST NEVER KNOW WHAT ACTIVITIES IDENTIFICATION CODES IDENTIFY: < Alpha, Alpha, Alpha, Alpha > - < # # # # # > - < session > - < yyyy > It may be the case some activities can be grouped and given a major title together; however, detailed descriptions will be required. Activities repeated can be added to transcripts upon successful completion. Repeated activities later on can be given a designation such as Advance “Name” I, Advance “Name” II. As well, particular repeated activities serve to towards developing true comprehension, competency and professionalism. Secured Archives < Note to self >: further investigation of gEcon for R The Economic Scenario Generator activity is open to Economics constituents. CHECK NEAR BOTTOM OF PAGE Macroeconomic Statistics Accounting Advance treatment of structure, methods from course Open to ECON students Measuring Capital Flows Claessens, S. and Naude, D. (1993). Recent Estimates of Capital Flight, World Bank WPS 1186 NOTE: adjust to regions of interest incorporating modern data. International Macroeconomics Advance treatment of structure, readings and methods from course Deposit Insurance (CHECK ACTUARIAL POST) Demography Development and Analysis Open to Political Science, Public Administration and Operations Management/Operational Research constituents. Concerns labs 1 and 2 from the Sustainability Measures course. Much more time will be dedicated to acquiring stronger comprehension and competence. Economic Impact Analysis Note: analytical modelling and computational logistics are essential before active implementation with such tools. Find documentation for such. Economic Impact Analysis (all of them to pursue in constructive order): Input-Output Model: RIMS II, IMPLAN, Chmura, LM3 World Bank Partial Equilibrium Analysis Multi-market Models Reduced-Form Estimation Impact Analysis: Tools linking microeconomic distribution or behavior to macroeconomic frameworks or models From Rutgers University: R/ECON™ I-O: An Economic Impact Model Simulation Models: Computable General Equilibrium, REMI Areas of interest: Communities, Cities and Provinces with projects/development Proposed legislation or regulatory changes Infrastructure Industries/Sectors Fiscal Policy (expansionary or contractionary) Social Welfare For highly localised cases, an LM3 example: Mitchell, A., & Lemon, M. (2019). Using the LM3 Method to Evaluate Economic Impacts of an On-Line Retailer of Local Food in an English Market Town. Local Economy, 34(1), 51–67. --Reference for RIMS II: RIMS II: An Essential Tool for Regional Developers and Planners. Bureau of Economic Analysis, USDOC --Additional intelligence: Pleeter S. (1980) Methodologies of Economic Impact Analysis: An Overview. In: Pleeter S. (eds) Economic Impact Analysis: Methodology and Applications. Studies in Applied Regional Science, vol 19. Springer, Dordrecht. Input-Output Models for Short Term Assessment of Natural Disasters Okuyama, Y., Hewings, G.J.D., Sonis, M. (2004). Measuring Economic Impacts of Disasters: Interregional Input-Output Analysis Using Sequential Interindustry Model. In: Okuyama, Y., Chang, S.E. (eds) Modeling Spatial and Economic Impacts of Disasters. Advances in Spatial Science. Springer, Berlin, Heidelberg. Computable General Equilibrium Models for Short Term and Long Term Assessment of Natural Disasters (with GAMS) PART A (preliminary development guides) Perali, F., & Scandizzo, P. (2018). The New Generation of Computable General Equilibrium Models: Modelling the Economy. Cham: Springer. Hosoe, N., Gasawa, K., & Hashimoto, H. (2010). Textbook of Computable General Equilibrium Modelling: Programming and Simulations. London: Palgrave Macmillan Limited. Chang, G. H. (2022). Theory and Programming of Computable General Equilibrium (CGE) Models: A Textbook for Beginners. World Scientific PART B (CGE short term Natural Disaster models to develop) Yoshio Kajitani & Hirokazu Tatano (2018) Applicability of a Spatial Computable General Equilibrium Model to Assess the Short-term Economic Impact of Natural Disasters, Economic Systems Research, 30:3, 289-312 PART C (common CGE long term Natural Disaster models to develop) Xie, W. et al (2014). Modelling the Economic Costs of Disasters and Recovery: Analysis Using a Dynamic Computable General Equilibrium Model. Nat. Hazards Earth Syst. Sci., 14, 757–772 Verikios, G. Chapter 5: CGE Models of Infectious Diseases: with a Focus on Influenza. In: Bryant, T. (2016). The WSPC Reference In Natural Resources and Environmental Policy in the Era of Global Change. World Scientific Note: other types of diseases as well Dixon, P. et al (2017). Economic Consequences of Terrorism and Natural Disasters: The Computable General Equilibrium Approach. In A. Abbas, M. Tambe, & D. Von Winterfeldt (Eds.), Improving Homeland Security Decisions (pp. 158-192). Cambridge University Press. Integrated Global System Modelling (IGSM) Framework (Check Meteorology & Oceanography post) A collaboration activity between Economics constituents and constituents of Meteorology and Oceanography. Economics constituents will be responsible for development with the following: Human System Model --> Economic Projection and Policy Analysis (EPPA) Meteorology & Oceanography constituents will be responsible for development with the following: Earth System Model --> The MIT Earth System Model (MESM) Integrated Assessment Models (check Meteorology & Oceanography post) Tax Models & Fiscal Policies 1. Capital Tax models A. Corporate Income tax model B. Small Business tax model C. Household tax models 2. Russek, F. and Kowalewski, K. (2015). How CBO Estimates Automatic Stabilizers. Congressional Budget Office, Working Paper 2015-07 3. Empirical tools in public finance Data sources (bureau of labour statistics, census bureau, treasury, bureau of economic analysis, bureau of economic research, CPS data, compustat) and interests 4. Empirical tools for taxes Will choose topics from the following text to implement Sorensen, P. B. (2022). Measuring the Tax Burden on Capital and Labour. MIT Press Li, H. and Pomerleau, K. Measuring Marginal Effective Tax Rates on Capital Income. Fiscal Fact No. 687, 2020 Li, H. (2017). “Measuring Marginal Tax Rate on Capital Assets. Tax Foundation. Overview of the Tax Foundation’s Tax and Growth Model”. Tax Foundation 5. National Savings, Economic Welfare, and the Structure of Taxation (to be implemented for various concerns) Auerbach, A. J. and Kotlikoff, L. J. (1983). National Savings, Economic Welfare, and the Structure of Taxation." Behavioral Simulation Methods in Tax Policy Analysis, edited by Martin Feldstein. Chicago: University of Chicago Press, (1983), pp. 459-498. Note: NBER version exists 6. Dynamic Scoring (to be implemented) Coherent concept The following gives a more rounded idea: Mankiw, N. G. and Weinzierl, M. (2004). Dynamic Scoring: A Back-of-the-Envelope Guide. NBER Working Paper 11000 Lynch, M. S. and Gravelle, J. G. (2021). Dynamic Scoring in the Congressional Budget Process. CRS Report R46233 Scope of models and logistics towards implementation for various fiscal interests Implementation 7. Tax-benefit Models The following are often open-source tools to pursue research. HOWEVER, a tool is no good if you don’t have strong comprehension of the modelling and logistics applied towards implementation. Will have analysis of 3-5 tools. Australia: APPSIM, STINMOD+ Canada: DYNACAN European Union: EUROMOD (a favourite since it’s flexible with data choice) Finland: TUJA France: TAXXIP Sweden: SWEtaxben Germany: IZAΨMOD, MIKMOD-ESt Ireland: SWITCH USA: NBER TAXSIM (a favourite since it’s flexible with data choice) R package for TAXSIM: usincometaxes Tax Foundation Stephen J. Entin, Huaqun Li, and Kyle Pomerleau, “Overview of the Tax Foundation’s General Equilibrium Model,” Tax Foundation, April 2018 8. Using Aggregate National Accounts data, typically relied upon to estimate future tax revenues for main taxes. For the 3-5 chosen tools will have comparative implementations with numerous fiscal numerous. Fiscal Analysis PART A: Fiscal Simulation Auerbach, A. J. and Kotlikoff, L. J. (1987). Dynamic Fiscal Policy, Cambridge University Press Logistics for computation & active implementation for fluid & applicable analysis. Will apply proposed or ongoing fiscal policies, fiscal notes or various economic scenarios. Note: there are various modifications of the Auerback-Kotlikoff Model. Ludwig, Alexander. (2005). Moment Estimation in Auerbach-Kotlikoff Models: How well do they match the data? Mannheim Research Institute for the Economics of Aging, University of Mannheim, MEA discussion paper series 05093 Try to use such to project respective policy or scenario for a past period; set prior conditions/parameters/values towards the simulations, and observe accuracy. Note: not concerned with periods of economic shocks. PART B: Fiscal Multiplier From the following paper, after analysis identify the tools and techniques required to implement a meaningful evaluation. Will pursue real world evaluations (with incorporation of much modern data) Batini, N. et al (2014). Fiscal Multipliers: Size, Determinants, and Use in Macroeconomic Projections. International Monetary Fund PART C: Evaluating Fiscal Policy Auerbach, A. J., & Kotlikoff, L. J. (1987). Evaluating Fiscal Policy with a Dynamic Simulation Model. The American Economic Review, 77(2), 49–55 Try to use such to project respective policy or scenario for a past period; set prior conditions/parameters/values towards the simulations, and observe accuracy. Note: not concerned with periods of economic shocks. PART D1: Fiscal Indicators From the following papers, after analysis identify the tools and techniques required to implement a meaningful evaluation. Will pursue real world evaluations (with incorporation of much modern data) Larch, M. and Martins, J. N. (2007). Fiscal Indicators. European Economy – Economy Papers Number 297 Benz, U. and Fetzer, S. (2006). Indicators for Measuring Fiscal Sustainability: A Comparison of the OECD Method and Generational Accounting, FinanzArchiv / Public Finance Analysis, Vol. 62, No. 3, pp. 367-391 (25 pages) PART D2: Fiscal Health Monitoring in the Public Sector Will be applied to sectors such as schools for whatever regional scale. Can also be done for utilities and other public goods or services. Much financial statements/data required. Assisting guides for pursuits for public goods, public services (provincial, municipal and borough levels): Suarez V., Lesneski C. and Denison, D. (2011). Making the Case for using Financial Indicators in Local Public Health Agencies. Am J Public Health 101(3), pages 419-25. McDonald, B. D. (2018). Local Governance and the Issue of Fiscal Health, State and Local Government Review, 50(1), 46–55. PART E: Management in the Public Sector Tasks from the following with public data: Wang, H. (2014). Financial Management in the Public Sector: Tools, Applications, and Cases. Routledge PART F: Fiscal Consolidation with General Equilibrium Treatment (pursuit development for ambiance of interest) Wouters, R. (2014). Fiscal Consolidation in General Equilibrium Models, Bank of International Settlements Hurnik, J. (2004). Fiscal Consolidation in General Equilibrium Framework – the Case of the Czech Republic. Prague Economic Papers. vol. 2004(2), pages 142-158. Stochastic Models for long term projections O’Harra, J., Sabelhaus, J. and Michael Simpson, M. (2004). Overview of the Congressional Budget Office Long-Term (CBOLT) Policy Simulation Model. Technical Paper Series Congressional Budget Office Washington, DC, 2004-1 Schwabish, J. A. (2013). Modeling Individual Earnings in CBO’s Long-Term Microsimulation Model. Working Paper 2013-04 Cheng, A. W. (2004). A Stochastic Model of the Long Range Financial Status of the OASDI Programme. Actuarial Study No.117. SSA Pub. No. 11-11555 Try to use such to project respective policy or scenario for a past period; set prior conditions/parameters/values towards the simulations, and observe accuracy. Note: not concerned with periods of economic shocks. Note: open to actuarial students Budget Stress Testing For a province or region of autonomy applying stress testing for various circumstances such as natural disasters, shocks, recessions, etc. Budget Stress Testing (model example): State Budget Stress Testing User Guide: A Collaborative Endeavor of the Kem C. Gardner Policy Institute and the Utah Office of the Legislative Fiscal Analyst: https://gardner.utah.edu/wp-content/uploads/PEW-State-Budget-Stress-Test-User-Guide.pdf Cost Estimates for Bills Goal is to develop estimation of advanced bills or passed bills. Will like to see how our estimates compare to data of the congressional budget office; for cases of high disparity to speculate on possible causes and try to amend to best of ability. The following literature to be development guides: Congressional Budget Office 2018, How CBO Prepares Cost Estimates, Publication 53519 GAO 2020. Cost Estimating and Assessment Guide: Best Practices for Developing and Managing Program Costs. GAO-20-195G Recession prediction development (back testing and future) Literature to assist (for ambiances of interest): Watson, M. W. (1991). Using Econometric Models to Predict Recessions, Federal Reserve Bank of Chicago, Economic Perspectives Stock, J. H. and Watson, M. W. (1993). A Procedure for Predicting Recessions with Leading Indicators: Econometric Issues & Recent Experience. In: Business Cycles, Indicators & Forecasting. University of Chicago Press, pp. 95 – 156 Fornari, F. and Lemke, W. (2010). Prediction Recession Probabilities with Financial Variables over Multiple Horizons. ECB Working Paper Series No. 1255 Liu, W. and Moench, E. (2014). What Predicts U.S. Recessions? Federal Reserve Bank of New York Staff Reports No. 691 Note: will be comparing with the following A. Global PMI B. OECD Composite Leading Indicator < https://www.oecd.org/sdd/leading-indicators/41629509.pdf > C. The TED spread Concept. Instructor must exhibit to students how to competently read and analyse market data observed: ---Credit risk and default risk observation ---Trade construction methodology ---Perturbation values, observation of hedge ratios (with any formula) ---Liquidity-related factors Note: for such above there are likely analogies to such for a respective ambiance of interest to create a “foreign TED spread”. Else, construct them. Also, with the replacement of LIBOR apply appropriate substitution. Measuring the Business Cycle Chronology & identifying Business Cycle Turning Points Articles to be analysed then replication, followed by countries of interest Gehringer, A. and Mayer, T. (2021). Measuring the Business Cycle Chronology with a Novel Business Cycle Indicator for Germany. J Bus Cycle Res 17, 71–89 (2021).
Agricultural Macro Welfare PART A (Input-Output models for Agriculture) Note: goal is to have such literature be relatable to data of interest. Heady, E. O., & Schnittker, J. A. (1957). Application of Input-Output Models to Agriculture. Journal of Farm Economics, 39(3), 745–758. Harris, T. R., Deller, S., Goetz, S. (2014). Linkages of the Agricultural Sector Models and Precautions., In Neal van Alfen (Ed.), Encyclopedia of Agriculture and Food Systems, Vol. 4. (pp. 148-155). Elsevier Inc. PART B (Measurement of Agricultural Protection) Strak, J. (1982). Measurement of Agricultural Protection. Palgrave Macmillan London Cahill, Carmel & Legg, Wilfrid. (1990). Estimation of Agricultural Assistance Using Producer and Consumer Subsidy Equivalents: Theory and Practice, OECD Economic Studies 13. William A. Masters (1993) Measuring Protection in Agriculture: The Producer Subsidy Equivalent Revisited, Oxford Agrarian Studies, 21:2, 133-142 Effland, A. (2011). Classifying and Measuring Agricultural Support: Identifying Differences Between the WTO and OECD Systems. Economic Information Bulletin No. (EIB-74) 24 pp PART C (Land Usage Analysis) LANDIS-II: https://www.landis-ii.org Computational Studies of Mergers & Acquisitions ADVANCE SKILLS DEVELOPMENT Successful completion of course is a prerequisite. Health Decision Sciences with R (check Actuarial post) Open to Economics AND Public Administration students CGE for Environmental Impact Interest is GAMS or Dynare/DynareR development A. OECD-Environment Modelling Tools ENV-Linkages Model (to develop) Château, J., R. Dellink and E. Lanzi (2014) Château, J., C. Rebolledo and R. Dellink (2011) Dellink, R., et al. (2021) Other pandemics with future effects too B. The MIT Emissions Prediction and Policy Analysis (EPPA) Model (to develop) Paltsev, S. et al (2005): The MIT Emissions Prediction and Policy Analysis (EPPA) Model: Version 4. Joint Program Report Series Report 125 C. Forecasting Environmental Decision Making (to develop) J. Scott Armstrong (1999). Forecasting for Environmental Decision Making. In: V.H. Dale and M.E. English, eds., Tools to Aid Environmental Decision Making, Springer-Verlag, pp. 192-225. D. US EPA SAGE CGE Model Marten, A., Schreiber, A., and Wolverton, A. 2021. SAGE Model Documentation (2.0.1). U.S. Environmental Protection Agency Implementing US EPA SAGE CGE Model (at least with GAMS) Forecasting Financial Crisis with Time Series and Classification Algorithms Models of interest are: Vector Autoregressive (VAR) models Threshold Autoregressive (TAR) models Smooth Transition Autoregressive (STAR) models Markov Switching Autoregressive (MSAR) model Logistic/Probit Support Vector Machine For various crisis in history, past data (economic & financial indicators) leading up to respective event to apply. Future forecasting as well. Climate Stress Testing Jung, H., Engle, R. and Berner, R. (2023). CRISK: Measuring the Climate Risk Exposure of the Financial System. Federal Reserve Bank of New York, Staff Reports No. 977 # POLITICAL SCIENCE Curriculum: The Political Science environment concerns cerebral functional growth, ingenuity, adaptation and advancement from acquired knowledge and skills. Political Science is not Economics. Political science is the study of government and diplomacy. A political scientist is mostly observant of political climates and activity. The curriculum is constituted by crucial courses towards knowledge and building skills in the following: 1. Government and Legal Foundations 2. History and Observation 3. Compare and Contrast 4. Critical Thinking 5. Recognised legal contests/suits and rulings where positions are recognised and analysed with outcome 6. Bills in the legislature (major perspectives and outcomes) 7. Economics Integrity 8. Political Commerce 9. Data Analysis Curriculum has no requirement of literature writing, rather, only political writing courses. ----Mandatory courses Enterprise Data Analysis I & II (check FIN); International Financial Statement Analysis I & II (check FIN); Calculus for Business & Econ I & II, Introduction to Computational Statistics for Political Studies ----Core courses 1.Political & Policy Writing << Elementary Writing for Political Science; Advance Writing for Political Science >> 2.Government << Constitutional Law; Legislative Process; Executive Process; Judicial Process; Comparative Politics; Comparative Electoral Systems >> 3.Economics Integrity (check ECON) << Introduction to Macroeconomics; Macroeconomic Accounting Statistics >> 4.Political Commerce << Public Policy; Public Policy Formulation & Implementation (check PA); Public Policy Analysis; Analysis Tools in Political Theory; Political Economy; Fiscal Administration (check PA); >> 5.International Relations << International Governance >> 6.Political Science Research << Quantitative Analysis in Political Studies I & II; Survey Research; Research Methods In Political Studies (check PA); Methods of Political Analysis >> Note: It’s recommended that student have advance placement and/or plan to take general education appeasement courses in the “winter” or “summer” sessions. Course descriptions: Introduction to Computational Statistics for Political Studies: In this course, we will focus on learning various practical statistical techniques and their applications that will assist you in making business decisions. The primary objective of this course is to enable students to perform and understand statistical analysis of data, with the view of being able to critically evaluate statistical reports or findings. Objectives: 1. Explain the concepts of descriptive statistics and use sample statistics to make inferences about population characteristics. 2. Recognise different models of statistical processes such as hypothesis testing through Chi-square, linear and multiple regression, etc. 3. Explain statistical processes and choose which process to use for particular data analysis applications 4. Learn to interpret statistical results as a basis for decision-making 5. Learn to use applicable statistics software 6. Collaborate effectively to use statistical analysis to address business challenges 7. Communicate your interpretation of the results of statistical analysis logically and persuasively in speaking and writing. 8. Course is only for political studies. SO MIND YOUR DAMN BUSINESS. Statistics without solid experience in a computational environment doesn’t mean much. Course will make extensive usage of R involving RStudio with real world data to accommodate theory and analytical modelling. Students will be required to learn how to import and manipulate data extensively. Students will be assigned statistical activities during course towards development of skills and practical maturity. Will make use of real-world data. Course literature will cater for the R environment Course Grade Constitution --> Status Quo Homework 10% R Environment Assignments + R projects in course 30% Heavy emphasis on Data Wrangling and Exploratory Data Analysis 3 Exams 60% Will reflect homework (3 zombie questions only) 0.15 Ability to show comprehension and mechanics 0.35 R skills with much more emphasis on the latter 0.5 Limited open notes Course Outline --> -Introduction -Data Acquisition via R Acquiring data from addresses, databases, file types. Generate and manipulate data frames: basic wrangling. -Descriptive statistics will real data -Generating Histograms with real data -Box plot with real data -Probability: Basic Concepts -Random Variables (theory, discrete r.v. and continuous r.v.) Standard topics and random variable generation/simulation Apart from general exercises will also make use of real data -Binomial, exponential and Poisson distributions -Normal Distribution -Synthetic data from distributions -Sampling Distributions It’s not done just to look smart, else it would have the same value as a conversation about whether leprosy or Alabama Rot looks better. Applications will be focused on being able to get it done competently. -MLE & MoM -Confidence Intervals (not confined to normal) -Chi-Square distribution The bottom line is to establish the flow of the uses competently with applications involving real raw data. Comprehending categorical data sets and ordinal data sets Organisation of data and sensitivity of categories concerning traits of interest. Test for independence McHugh ML. (2013). The chi-square Test of Independence. Biochem Med (Zagreb). 23(2): 143-9. Using Fisher’s Exact Test as an alternative Test of homogeneity Test of variance Applications of the Chi-Square distribution with confidence intervals -T Distribution Not concerned with zombie problems. If no normality, then T-test is not applicable. Kim T.K. & Park J. H. (2019). More About the Basic Assumptions of T-test: Normality and Sample Size. Korean J Anesthesiol. 72(4): 331-335. Sample size determination Population parameter estimation Confidence intervals -Goodness of Fit Primitives Summary Statistics Skew and Kurtosis Density Plots Q-Q plots Statistical Tests Definition, Null hypothesis One-sided & two-sided tests of hypothesis Types of test statistics Comprehending critical values for ideal distributions Significance levels Determining Distributions Q-Q plots review Chi-Square Test Kolmogorov-Smirnov Test Anderson-Darling test Shapiro-Wilk Test Maximum Likelihood Estimation -Hypothesis Testing (exploratory Module with R) NOTE: Goodness of Fit module will be crucial. No assumption of the distirbution will be taken on. We are and not concerned with zombie problems. Majaski, C. (2021). Hypothesis Testing. Investopedia Differences in population without assumption of normal distribution Mean, median, variance -Covariance & Correlation (real massive data immersion). Standard Introduction Mukaka M. M. (2012). Statistics Corner: A Guide to Appropriate Use of Correlation Coefficient in Medical Research. Malawi Medical Journal: The Journal of Medical Association of Malawi, 24(3), 69–71. Correlation heatmaps development. -Simple Linear Regression -Multiple Linear Regression (AT LEAST 3 sessions) Multilinear regression structure Variables selection OLS Summary Statistics for Regression -Fraud Detection Methods (to be implemented) Prerequisites: Calculus for Business & Economics I & II Elementary Writing for Political Science Course assumes students are well nurtured in academic essay writing, say, experience in various academic writing styles before matriculating into college. Course is designed to assist in learning research, analytical, writing concepts and skills in the political science field. Course encompasses both objective and persuasive writing. This course will familiarize the student with analytical, research and writing skills in all four areas of the political science major: Regional Politics, Political Theory, International Politics, and Comparative Politics. The course methodology assists the student in learning by presenting all of these skills and concepts in a system that presents basic skills and concepts in short assignments, and then builds on these basic skills and concepts to support their goal towards mastery in longer and more complex assignments. Course concerns the student gaining ability to demonstrate: 1. Clear and accurate understanding of political science writing in all four areas of the major 2. Ability to produce effective written and oral communication in all four areas of the major; including competent citation, clear and careful organization around a competent thesis, professional format, grammatical presentation, analytical accuracy and intellectual depth 3. Mastery of basic and more complex forms of argument in political science, including knowledge of types of political science writing, competent presentation of, and support for, both objective and persuasive analysis in all four areas of the major 4. Effective engagement in the creative processes of intellectual political science writing, research, and analysis, including techniques for brainstorming, collaboration, revising, flexibility in thinking and research and reflecting on feedback, and 5. Competent research skills in all four areas of the major. Specialized tasks (order to follow course outline) --> Traditional, and computer-assisted sources, with basic bibliography citation of 10 sources (3 tasks) Class Exercises detailed throughout Group Oral Presentations Developments & Assignments Objective, Persuasive, Position Research Development Issue/topic, Supporting literature for topic(s) Research phase, thesis, tentative outline, and list of sources Note: “--” segmentation corresponds to a week Course Outline --> --Conventionally-used political science sources and how to cite them 1. Introduction to course and the four substantive areas of the major 2. (“CMS”) and (“APA”) look up and read relevant references. Why the use of citation in political science writing 3. Transitioning to the (CMS) style for documentation, and basic differences among bibliography, footnote, and endnote form 4. Transitioning to (APA) style for documentation 5. Library usage, traditional and computer-assisted sources in political science 6. Proof-reading your citation form, and basics to help you master both accuracy and reuse of citation form. --Basic, objective political analysis, research and writing 1. What Is a Research Paper? Finding the Evidence. 2. What are “objective” or neutral” research, neutral analysis and neutral writing in political science? 3. Taking into account the nature and identity of the “audience” 4. Objective writing style, grammar, vocabulary, format, organisation 5. What is Political Theory? 6. What is Politics? Local, global 7. Use of data to support objective assertions and analysis 8. Dealing with ambiguities or conflicts in or among sources 9. Different types of political science writing that are “objective” in all four areas of the major 10. Critical reading in the political science field. 11. Key concepts in researching political science: i) professional vocabulary; ii) starting efficiently when you know an area; iii) starting efficiently when you don’t know an area; iv) what makes a source “relevant”; v) what makes a relevant source “better” or “best,” and vi) the number of sources you need to support an assertion. 12. Formation of objective, analytical theses in the four categories of the politics major. --Continuation of prior week 1. Where Do I Begin? 2. Formation of a complex, objective, analytical thesis: class exercise 3. Basics of the objective, expository introduction and conclusion 4. outlining: adding sub-issues to the main issue outline: class exercise 5. Adequacy of objective analysis: clarity, relevance of data and concepts, substantive rigor, level of appropriate detail, and responsiveness to question asked. 6. Cite checking as distinguished from citation form 7. Writing organization: topic sentences and paragraph structure 8. Proofreading your work --Expanding and applying objective analysis and writing to address more complex problems in political science 1. What is Comparative Politics? 2. Differences and similarities in objective and persuasive essay writing 3. Organization of essay, quick outlining and “labeling” as organisational techniques, substantive accuracy,” effective timing, appropriate level of detail, your instructor as your audience. Class exercise, “labeling” 4. What is constructive feedback and what is its value for you and others? In-class exercise: learning from reviewing, assessing, and giving Feedback on the work of others (with instructor “rubric” and using article summaries from last week). --Expanding objective research, analysis and writing in political science to more complex problems 1. Improving your use of data to support assertions: class exercise 2. Dealing with ambiguities in sources in objective, analytical writing 3. Flexibility in approach: to footnotes: how long & how detailed should they be 4. Use of external sources and plagiarism: academic honestly, proper attribution of data, quotations, ideas, and paraphrases. Note: out of specialized tasks there are assignments declared that’s appropriate for this module. Determine appropriate time. --Transitioning from objective research, analysis and writing in political science to “position” research, analysis and writing 1. Finding the Evidence: Review relevant parts 2. More complex analytical objective research, analysis and writing 3. Objective research methodologies and techniques vs. persuasive research methodologies and techniques 4. Determining when you have found the “answer” / how many sources does it take? 5. Sufficiency of research: knowing when to stop: objective vs. argumentative research and analysis 6. Review: reliability of data 7. Cite checking and citation form revisited 8. Purpose and form for footnotes within text, revisited 9. Flexibility of approach: relationships among research data, issues, thesis, and outline. --Transitioning to more complex problems in political science that require an argumentative position 1. Developing “position” analysis: format, credibility and ethics 2. The thesis in argumentative writing. 3. Introduction to making an oral presentation: objective vs. argumentative 4. Oral presentations: style, tone, format, professionalism 5. Oral presentations: fielding easy and hard questions 6. Oral presentations: clarity, accuracy, use of supporting data, level of detail 7. The elements of good timing in oral presentations Note: out of specialized tasks there are assignments declared that’s appropriate for this module. Determine appropriate time. --Expanding research, analysis and/or writing into the oral presentation 1. ORAL PRESENTATIONS 2. STUDENTS NOT PRESENTING PLEASE BE PREPARED TO ASK QUESTIONS! Note: out of specialized tasks there are assignments declared that’s appropriate for this module. Determine appropriate time. --Argumentative or advocacy writing in the political science, continued 1. Writing your persuasive paper: “Critical Papers” 2. Making the transition from objective to persuasive/advocacy writing and analysis, con’t. 3. Specific types of political science writing that involve advocacy or persuasive writing 4. Taking into account sources that weaken or contradict your position --The Complex Position or Persuasive Paper 1. Understanding the task, reviewed 2. Research strategies, reviewed 3. Objective analysis as the basis of “position” analysis, reviewed 4. Citation form, end notes, footnotes, bibliography, reviewed 5. Keeping track of sources, reviewed. 6. Types and sufficiency of data, reviewed 7. Effective organization of persuasive analysis, con’t. Note: Begin research on final paper --More complex forms of persuasive or advocacy writing in political science 1. Researching persuasive problems, con’t.: intellectual honesty and examining both positive and negative sources or data. 2. Revisiting how to find and take into account data and sources that support the position argued. 3. Revisiting how to find and take into account data and sources that weaken the position argued 4. Revisiting how to take into account ambiguities in data and sources that contradict the position argued 5. Developing more specific methods for taking into account “negative” sources or data: distinguishing, discounting, acknowledging ambiguity or conflict, or demonstrating weak relevance or, demonstrating irrelevance Note: Continue research on final paper. Tentative outline, tentative thesis and preliminary list of sources for final paper. --Research Time Week (no classes) 1. Turn in outline, thesis, and source list at end of week 2. The complex political science problem: next steps 3. When should you try to use humor? --The final phase of working on the complex argumentative or persuasive problem in political science 1. Text: Review all relevant parts needed 2. Return, review, and discuss final paper outline, thesis, etc. 3. Research strategies revisited 4. Honing the issues, thesis, and analysis for the complex argumentative paper 5. Review of flexibility in approach, position taken, thesis statement, feedback received, and new research data or information found 6. Putting it altogether in the complex, argumentative paper Out of specialized tasks there are assignments declared that’s appropriate for this module. Determine appropriate time. Prerequisite: Introduction to Computational Statistics for Political Studies Advance Writing for Political Science Regardless of the specific field of interest, all writing in political science strives to be objective in its approach, emphasizing clear and logically presented arguments, even-handed consideration of likely counterarguments, and thorough evaluation of relevant evidence for and against your primary claim. MEMO: critique may/will be brutal. The prerequisite course outline is structured to guide you. SERIOUSLY. Course Assessment --> Tasks Components: A, B, C & D COMPONENT A --> Argument essays (2-3) Analytical responses to articles, briefs, reports, or events (2-3) Op-ed pieces (1-2) For argument essays and analytical responses, development from prerequisite will be used extensively. Namely, such will be used to build your development pathway with logistics; will be collected. Followed by drafts to be submitted. COMPONENT B --> The scientific method is a way of discovering general truths about the world we live in. Its primary assumptions are that there is such a thing as objective reality and that it is knowable through a person’s faculty of reason. Its primary mechanism is theory testing. This means that a possible explanation of how the world works is tested against the evidence of the real world. In the social sciences, it is usually either impractical or unethical to use active experiments, so there’s heavy reliance on historical data. We test our explanations against the past in the hopes of understanding the present and better predicting the future. What this means in practical terms is that we develop a theory (or thesis) before we have seen the evidence, so that we can test it honestly. COMPONENT C --> Research Design You go through the following steps but may stop short of collecting and analysing evidence/data: 1.Choosing a Topic 2.Background Reading 3.Choosing a Puzzle Some question about the topic that you think is particularly interesting. Keep in mind that political scientists are interested in relations of cause and effect. This means that, while they consider purely descriptive work to be interesting and useful, they think of it as data, and not political science. Various questions conjured will not be appropriate puzzles. 4.Formulating a Thesis/Theory Your thesis/theory is essentially your general answer to the puzzle. Having done the background reading, you probably have a guess as to […]. In your theory, you state your guess clearly and concisely in terms of variables. The independent variable (I.V.) is the factor you are arguing causes something to happen. Note: will mostly like be multivariate (and not necessarily continuous variables). The dependent variable (D.V.) is what is caused by (depends on) something. Note: also can have binary or multinomial instances. 5.Defining Key Terms (operationalizing) The scientific method requires your work to be very clear so that anyone else could repeat exactly what you did to test your honesty and the reliability of your results. This includes being clear about what complex words mean. Definition simply explains what something is Operationalization explains what something is in terms that can be measured or observed. 6.Formulating Hypotheses if-then statements which take all the possible values of the independent variable(s) as the “if”-side and link the possible values of the dependent variable as the “then”-side. 7.Control Variables – ceteris paribus 8.Collecting Data Note: it’s good to become tenacious with identifying credible data sources for research in question. As well, comprehending the depth and quality of data acquired. It may be stressful, but “it is what it is”. 9.Analysing Data 10. Model Selection 11.Concluding, Reasoning, Interests and Possible Expansion COMPONENT D --> Research development pursuit Prerequisite: Elementary Writing for Political Science Constitutional Law The purpose of this class is to acquaint you with the legal principles under-girding the federal system of government. You will study the nature and powers of the Parliament, Executive and the Courts. The course will rely highly on the legal case study method as a learning strategy for understanding key principles of Constitutional law. One of the most vital aspects of politics: interpreting and applying the nation's fundamental rules. Case law provides insight into how actual Constitutional controversies are resolved and can have a binding effect on the resolution of subsequent cases, so the case study method helps judges, lawyers, and students understand the law and predict the outcome of future cases. Students are expected to read and think about the assigned material before each class. Likewise, you are expected to contribute to the classroom discussions on both a voluntary and involuntary basis. I will call on you. Your participation may impact your grade at the margins. Exams concern historical knowledge, constitutional knowledge & amendments. Course outline range --> COMPARATIVE (3-4 weeks) Note: at designated periods will introduce the following methods of comparative politics at a moderate level in labs concerning purpose, preparation, logistics and implementation: The Comparative Method Case Studies Qualitative Data Cross-National Quantitative Research NOTE: there will be further topics for labs not mentioned below to accommodate such above methods. Topics: 1.Monarchial forms of government. Republican forms of government. One-party states and military governments. What is your nation’s classification? 2.Will identify dominant theories on the creation of a constitution, with comparative view among different nations through time to support such. 3.Democracy Models 4.Does a parliamentary political system require any impeachment structure? If yes, identify. Are there any sovereign “no” examples. Comparison/Contrast to the provincial levels. 5.Role or influence of constitutions with the existing strength of federalism and legal reservation with provinces/states. 6. Emergence of totalitarian governments and role of the gov’t branches Non-democratic origins Transformation from democracy models 7.Is there a benchmark constitution? AMBIANCE FOCUS (11-12 weeks) Within course the following elements will resonate for the AMBIANCE FOCUS TOPICS IN SECOND PART OF COURSE (not necessarily in given order, and such elements may apply on numerous occasions): -Socio-political conflicts and the constitution -Historical Judicial Reviews -Supreme Court Cases -Historical Acts and Amendments -Judicial ruling on executive policies -Judicial ruling on legislative actions Students may also encounter hypothetical cases from instructor, where students will provide constitutional analysis to the best of their abilities based on acquired knowledge from individual personal readings and course instruction. Some hypothetical cases will be group assignments while others will be done individually. Topics: 1.Founding of the constitution and its evolution (focus on ambiance). Will identify in detail delegates, emissaries, officials, ministries, agencies playing pivotal roles in development of the constitution. Agendas/interests of such entities. 2.Nature of the Constitution 3.Separation of Powers 4.Organisation of the Branches based on constitutional powers of the branches 5.Constitutional supremacy, power of interpretation and early controversies. 6.The action of judicial review and interpretation is a “fear” gauge on whether an established government is truly committed to abide by its structure. True or false. 7.Executive prerogatives and associated checks by other branches of government: foreign policy, emergency, military action and war. Creating executive departments. Executive leader powers with appointments and removals. Removals and policy on the enforcement of law. Executive orders. Suspension of parliament and government shutdowns. 8.Congressional influence on executive leadership of government. Review of a parliamentary/semi-presidential political system versus presidential system. Do executive appointments require parliamentary approval or is such only characteristic of presidential forms of government? For prior question, have comparison/contrast to the provincial and city levels. 9.Congressional Oversight 10.Judicial Branch Federal Review of the constitutional relevance of the judicial body Organisation and the selection process Process for high court hearings and trials Provincial (counterparts to priors) Legal routine or process between provincial and federal level 11. Congressional powers and limitations over judicial ruling. 12.Taxing, Spending and Administration of Foreign Aid 13.Legislative influence on the constitution and the judicial body. 14.Removal of judicial constituents (federal and provincial, respectively) International Governance Course concerns the review of some of the major institutions and tools for cooperation among transnational actors, towards negotiating responses to problems or interests that affect more than one state or region. Observation of the limited or demarcated authority to enforce compliance. The modern query of world governance exists in the context of globalization and globalizing regimes of power: politically and economically. Resonating elements in course are history, stability, security, economic welfare and globalization. Course has a government classification option. Course also has social/society classification option. Course also appeases the “History” classification option since it concerns civilisation and “advancement” of the human species from 18th through 21st century. Standard Applied Course Engagement --> Activities and tasks identified in course topics. Additionally, there can be numerous analytical/critical thinking topics/questions and historical events/periods that are tangibly and fluidly relevant to each module. Instructor to provide additional such not mentioned in course outline based on various texts, articles, other forms of literature and acceptable sources not listed. Analytical topics, critical thinking questions and historical events/periods will be unique to questions or concerns expressed in lecture outline. Some of the “Yakety-yak” literature (but not limited to): Coicaud J.-M. & Heiskanen V. (2001). The Legitimacy of International Organisations. United Nations University Press Tallberg, J. and Zürn, M. (2019). The Legitimacy and Legitimation of International Organizations: Introduction and Framework. Rev Int Organ 14(4), pages 581–606 Dellmuth, L., Scholte, J., & Tallberg, J. (2019). Institutional Sources of Legitimacy for International Organisations: Beyond Procedure Versus Performance. Review of International Studies, 45(4), 627-646 Hopefully, such literature will not sabotage your course obligations. NEVERTHELESS, course is primarily geared towards students having meaningful comprehension of IGOs structure and sense of good utility with IGOs, rather than being con artists; all in course outline MUST be treated. UN Literature --> UN Official Documentation System: https://documents.un.org/prod/ods.nsf/home.xsp Websites Navigation (group activities) --> There are multiple tasks throughout the term where student groups must independently navigate websites of agencies, organisations, offices & affiliates to acquire general information, charters, policies, databases, data, manuals, guides, guidelines, working papers, technical papers, published journals, evaluation kits/tools/software, etc., etc., etc.; questions and research will be based on such elements. Citations and references are mandatory. NOTE: skills from ALL prerequisites will be put to good use. NOTE: will not be the stereotypical charted pursuits. There will be places and sites areas pursued that are typically not ventured. NOTE: will require good effort and independent skills for exploratory pursuits or “treasure hunts”. Entities of interest (EOI): United Nations: major bodies; family of organisations; specialized agencies NATO, OSCE, Interpol, Europol BIS, OECD, WTO (World Trade Organisation), UNCITRAL, UNCTAD Supranational entities (EU, EC, CC) and its agencies/ministries/offices Sovereign states executive branch (offices and departments) Tools and tasks for EOI: Frameworks, guides, manuals and logistics. Analysis of diplomacy, polices or treaties or conferences Policies, operations, finance and outcomes for events, periods, etc. Sovereign states executive branch (offices and departments) and legislative branch concerning policies and actions in foreign affairs compared to IGO policies and actions. Discovery and use of tools, software and kits. Data Analysis Wrangling Exploratory data analysis Econometric/statistical modelling with forecasts Things not thought of yet Labs --> 1.UN Agencies, Bodies, Organisations, Funds & Programmes operations: -Students must be competent in acquiring external information (articles, documentation and data) from the authentic and credible sources. Technological skills with sites, addresses, databases APIs. Probing and cleaning (if needed). -Annual operations reports. Analysis of operations (different periods). -For assigned IGO agencies acquire annual (or quarterly) audited financial statements for the past five periods. Present the results of your analysis in a brief class presentation. You will prepare an accounting written report of approximately 2-3 pages summarizing the accounting classification and the accepted accounting principles treatment for your chosen entity Financial Statements Integrity and Financial Analysis (different periods). Fraud Analysis (different periods). Can fiscal health analysis be done? If so, develop. 2.Measuring Legitimacy: PART A Gilley, B. (2006). The Meaning and Measure of State Legitimacy: Results for 72 Countries. European Journal of Political Research 45: 499 – 525 Analysis Replicate Incorporate more modern data For past 20 - 40 years what are the trends in such measure for chosen countries? Then for countries recognised with high legitimacy based on findings, identify their levels of participation and/or influence in international governance (mainly economics, international security, human rights) with staffing and executive positions. Does state legitimacy correlate well with influence in international governance? PART B WBG Worldwide Governance Indicators: < https://info.worldbank.org/governance/wgi/ > Intension Indicators & Methodology Kaufmann, D., Kraay, A. and Mastruzzi, M. (2010). The Worldwide Governance Indicators: Methodology and Analytical Issues, World Bank Policy Research Working Paper No. 5430 Quality and credibility of data (practicality and criticisms) Preliminary personal criticism of indicators. What don’t you understand? Do poorer countries who likely lack corporate commerce, industrialization and self-reliance fall victim to the interest of foreign entities from developed countries? Academic Inquisitions Kaufmann, D., Kraay, A. and Mastruzzi, M. (2007). Worldwide Governance Indicators Project: Answering the Critics. World Bank Policy Research Working Paper No. 4149 Thomas, M. (2009). What Do the Worldwide Governance Indicators Measure? European Journal of Development Research. 22 (1): 31–54 Langbein, L. and Knack, S. (2010). The Worldwide Governance Indicators: Six, One, or None?". Journal of Development Studies. 46(2): 350–370 Further Resource Malito, D. V., Umbach, G. and Bhuta, N. (2018). The Palgrave Handbook of Indicators in Global Governance. Palgrave Macmillan PART C Analyse and replicate, followed by inclusion of more modern data: Binder, M. and Heupel, M. (2021). The Politics of Legitimation in International Organisations, Journal of Global Security Studies, 6(3), ogaa033 3.The Global Conflict Risk Index (to apply): https://drmkc.jrc.ec.europa.eu/initiatives-services/global-conflict-risk-index#documents/1059/list Note: methodology and other documentation must be analysed before use. 4.Active operations with the following: INFORM RISK INFORM SEVERITY INFORM WARNING Note: for each the methodology and other documentation must be analysed before use. 5.Comparative analysis between (3) and (4): Product SWOT analysis. Compliment to each other? Do any indicators from (2) serve as alternatives? 6.Analysing video of chosen UN Security Council meeting: Reviewing the process for initiating meetings, and acquire summoning or agenda literature published by UN Security Council to analyse. Procedures. Priors will be aligned to whatever particular meeting event. Conflicts, perspectives and policy, circulated proposals for vote; arguments for policy or proposals by respective sovereignty in council. Outcomes/resolutions: analyse resulting UNSC position from published literature compared to video. Analysis of chosen response(s) and policies from subjugated ambiances/nations. Note: instructor can provide critical thinking interests throughout. 7.Evaluation for IGOs' policies, programmes, projects: Identifying the Needs Assessment or Goodwill Programme Theory Impact Evaluation (specified methods) Gertler, P. et al (2016). Impact Evaluation in Practice: Second Practice, World Bank Publications The following may be adapted to treat UN agencies’ humanitarian programmes of choice: Larson, B. A. & Wambua, N. (2011). How to Calculate the Annual Costs of NGO-Implemented Programmes to Support Orphans and Vulnerable Children: A Six-Step Approach. J Int AIDS Soc.;14:59 Benefits Estimation (monetised and non-monetised counterparts) Quizzes --> Elements in quizzes can apply various components. Knowledge and activities from modules and lectures (including financial analysis), analytical responses, etc., etc. In general, you may get 3 days advance notice for quizzes. There will be 4-5 quizzes, where the lowest will be dropped. Lack of participation or failure to keep a respectful environment can warrant incorporating pop quizzes. 3 Exams --> Part of exams will involve historical knowledge and common knowledge; will be closed book. Students must disable all electronic devices of communication. Such parts of exams will be timed. Such parts of exams will be carried out before any other parts. Part of exams will involve case scenarios and/or current events. Will concern critical thinking and analytical processing. Students must disable all electronic devices of communication. Part of exams will involve accessing credible sources, annual reports and financial data/accounting data towards operations analysis, accounting analysis to provide assessment; proper citation will compliment such. Students will make use of their communication devices. Formality --> NOTE: wars from imperialism, failure of the League of Nations, World War II, Cold War spills, NATO (and its many activities), nuclear bomb drills, WMDs, Middle East Crises (off and on), epidemics/pandemics, human trafficking, drug trafficking, massacres, genocide, various migrant crises, terrorism, incursions and annexations can’t be identified with one race. NOTE: despite course considering only the 18th to 21st century, on planet Earth, various history, cultures, commerce and religions existed before the 1300s and 1400s. Don’t get hung up with bamboozles, or opportunistic, parasitic, megalomaniac cultural penetration in the latter years following. Attendance and Conduct Policy --> Conduct that’s detrimental to the quality and integrity of the course can lead to students forfeiting 69% of final grade. Conduct that’s detrimental to the safety or social well-being of other students and instructor(s) in course can lead to students forfeiting 69% of final grade, along with legal consequences and exercise of campus security and safety policies. I will not tell you explicitly how lack of attendance and punctuality will affect your grade; certain elements of assessment will be targeted. ASSESSMENT --> Standard Applied Course Engagement Websites Navigation Labs Quizzes (course topics) Exams (course topics) Attendance and Conduct Policy TOPICS IN COURSE PROGRESSION --> ---MODULE 1 Before the League of Nations (18th-19th century) Key themes with specified geographic focus: colonialism, imperialism through militaristic enforcement, international human rights. **Significant global interactions changing the course of history. **Significant international treaties (eastern and western hemisphere). **Enterprises and companies. Was mercantilism the main driver of imperialism, and colonialism? What forms of equity or commissions existed towards the respective sovereign state concerning international endeavours and interests? How as stake ensured? How did competing sovereignties or even competing firms become knowledgeable of each other’s foreign interests, ventures or exploits? **What were the standing notions of international humanitarian aid and peacekeeping in such two centuries among sovereign states? Was there a typical procedure? What was the best policy? For organisations such as churches, the Salvation Army, International Red Cross etc. being international organisations of service, how were they perceived and treated by sovereign governance in such era(s)? ---MODULE 2: Security and Stability NOTE: for mentioned IGOs, institutions and multilateral governance will have investigation for history, governance structure. A. Paris Peace Conference Identifying the history, governance structure. Identifying the interests of the major sovereignties involved and the resulting diplomacy or politics (influence, security interest and economic agendas as well). Associated Treaties. B. League of Nations Establishment and reasons for such Diplomatic Infrastructure Diplomatic Methods & Practices Consensus Building & Essential Steps Was there any structure of policy to facilitate humanitarian and economic development? Reason(s) for its failure (consensus or questionable reasons for such) C. United Nations Founding purpose UN charter and its major subjects Structure of the following: General Assembly, Security Council, Human Rights Council, the Economic & Social Council, Trusteeship Council, the Secretariat, the International Court of Justice. Includes sequencing among the establishments relating to consensus interests and the advancement of sustainability. Vienna Convention on the Law of Treaties Vienna Convention on Diplomatic Relations The UN and Democracy < https://www.un.org/en/global-issues/democracy > < Guidance Note of the Secretary-General on Democracy > Membership process UN Security Council United Nations Security Council Provisional Rules of Procedure Sievers, L., and Daws, S. (2014). The Procedure of the UN Security Council, Oxford Academic Genser, J., & Stagno Ugarte, B. (Eds.). (2014). The United Nations Security Council in the Age of Human Rights. Cambridge University Press. Must all members of the U.N. security council full-fledged constituents of all such agencies? What statutes or policies ensure or permit a sovereign nation to be a member of the U.N. security council? Identify the UN Specialized Agencies and “authorities” vested with each. For such specialized agencies or firms what were the drivers/causes for such establishments? How do they relate to economic and political interests? For chosen specialized agencies: diplomatic infrastructure, policy development, diplomatic methods/practices, consensus building towards essential steps. Can a nation be completely expulsed from the UN? If so, what conditions must reside? Review the differences between the UN and the League of Nations concerning sustainability. D. Functionality & Audits Literature: Regulations and Rules Governing Programme Planning, the Programme Aspects of the Budget, the Monitoring of Implementation and the Methods of Evaluation < https://hr.un.org/content/regulations-and-rules-governing-programme-planning-programme-aspects-budget-monitoring > PART 1 What robust and adaptable methods can be applied to evaluate the functionality of IGO specialized agencies, WBG, EU and OECD? The mentioned “Yakety-yak” literature provided may help. Will have implementation of such methods in lab sessions and draw conclusions. PART 2 How does one validate the annual reports and accounting/finance of the UN institutions, agencies and affiliates w.r.t. to time settings? E. UN’s International Court of Justice Review purpose and history What gives this court power? How is it’s structure and operations different to sovereign courts? Overview the ICJ articles Jurisdiction Legitimate Judicial Candidates Selection Process & Judicial Election process Prosecutor/Claimant and Defence selection by gov’ts How is a ICJ matter created? Procedures for hearings and Cases. ICJ Articles for evidence Further reads (but not limited to such): Devaney J. Fact-Finding and Expert Evidence. In: Espósito C, Parlett K, eds. The Cambridge Companion to the International Court of Justice. Cambridge Companions to Law. Cambridge: Cambridge University Press; 2023:187-207 Devaney JG. A Coherence Framework for Fact-Finding Before the International Court of Justice. Leiden Journal of International Law. 2023;36(4):1073-1094 Max Lesch, Contested Facts: The Politics and Practice of International Fact-Finding Missions, International Studies Review, Volume 25, Issue 3, September 2023, Noticeable convictions, won suits or acquittals in history Such above three literature (and others) can be used to simulate outcome(s); analysis of simulated outcome(s) versus realised outcome(s). Schulte, C. '1 Methodology', Compliance with Decisions of the International Court of Justice, THE INTERNATIONAL COURTS & TRIBUNALS SERIES (Oxford, 2004; online edn, Oxford Academic, 1 Jan. 2010) Challenges to ICJ relevance/authority/jurisdiction and consequences. Relationship between UN Security Council and ICJ. F. Rome Statute and the International Criminal Court Review purpose, formal proposal & establishment, and history Analogous development/treatment to all in (E). How is it’s structure and operations different to the ICJ? Possible relation between the ICC and UN’s ICJ. Why is there co-existence between the ICC and ICJ? Who has more authority or influence internationally between the two judicial structures and possible reasons for such? Are ICC operations considered a preliminary development to motivate the ICJ? Analysis of 1-2 particular countries with the following designations: Signatory that has not ratified State party that subsequently withdrew its membership Signatory that subsequently withdrew its signature Non-party, non-signatory Speculation and supporting evidence for the observed above designations. Guantanamo confinement. How so? ICJ or ICC approach? Trump’s administration sanctions Conflict with ICJ statutes (towards Iran) Respective arguments, actions and consequences. Sanctions on ICC judicial elements Respective arguments, actions and consequences. G. UN Treaties Collection Where to locate? Quick run-through General constitutional foundation and delegation process among the nations. Treaties making process (TMP) From the following resource there are many statements where case examples must be pursued: https://archive.unu.edu/unupress/unupbooks/uu25ee/uu25ee09.htm After, will try to map out the development of chosen treaties with TMP, incorporating the theories, principles, literature and laws/regulations that apply to the chosen treaties. H. Supranational treaties towards external countries or regions Possible literature of interest: https://rm.coe.int/168004ad95 (with possible counterparts from other regions as well) I. Security Cooperation NATO and Warsaw Pact Compare/Contrast Spheres of influence Cause(s) for establishment Articles of Agreement Courts & Tribunal Funding Financial Regulations and Financial Rules & Procedures Membership Process Concurrent jurisdiction under the [..] status of forces agreement Jurisdiction of the Receiving State over Forces of the Sending State under the NATO Status of Forces Agreement Case studies for Finland and Sweden before and during/after 2022 Russia-Ukraine conflict. J. Organisation for Security and Cooperation in Europe (OSCE) Flexibility in the Helsinki Final Act as a non-binding status Nonintersecting elements between the Helsinki Final act and the Paris Charter. Despite the organisation’s formal title, observed are participants of North America, Northern Africa, Asia, and Oceania. For such participants not being geopolitically what types of interest make them relevant, and what roles do the play? What are the interests? Between the UN, EU and OSCE whose efforts are more effective historically? Chronology comparison of financial contribution from member states; identify interests related to the financing. Why is the non-binding charter of the OSCE quite effective with financial contributions? K. Modern Diplomacy Structure 1. Negotiation Models -- Druckman D. (2007) Negotiation Models and Applications. In: Avenhaus R. and Zartman I. W. (eds) Diplomacy Games. Springer, Berlin, Heidelberg 2.Decision Theory -- Spector, B. I. Chapter 3. Decision Theory: Diagnosing Strategic Alternatives and Outcome Trade-Offs. pp 73 – 94. In: Zartman, I. W. (Editor). 1994. International Multilateral Negotiation – Approaches to the Management of Complexity. Jossey – Bass, Inc. Based on the prior two literature (Spector, Druckman) try to apply to 2 or 3 ongoing or past diplomacy/conflicts. Situation, actors and/or the subjugated, catalysts, policies, consequences, etc. can stem from legislative actions, executive branch actions and judicial actions from respective countries and/or multilateral policies. Note: data will be invaluable to apply structuring/models, and to make sense of options, positions, probabilities, etc., etc. Then to identify realised outcomes via state department publishing, legislature record, international gov’t organisations or NGOs, etc., and evaluate outcome(s) based on decision theory and negotiation models; contrast to the other possibilities in regard to likelihood, rationality, favourable or unfavourable positions. Are realised outcomes identified in prior developments? L. Supranationalism (European Union, Eastern Caribbean and Caribbean Community) -Comparative analysis of attractiveness and interests for joining -Comparative counterparts of: Treaties among the regional counterparts. Will have a comparative analysis of the establishment and political structure. -Possible literature of interest: https://rm.coe.int/168004ad95 (with the counterparts from other regions as well) -Copenhagen Criteria. How can the political, economic and legislative requirement elements be validated with credibility? Will also have case studies for nations based on such criteria; from recognition of application to current standing. For economic conditions specifically will identify the specific indicators or measures that must be consistently met. -Explanation for Haiti being allowed CC membership based on sound political and economic rational, indicators and models with credible evidence? -Comparative analysis for conditions to remain in union based on treaties -Comparative analysis of: How legislative representation is appointed How executive positions are appointed -Comparative analysis of general court (history, functions, composition, jurisdiction & powers) Additionally: Judicial Candidates Selection Process & Judicial Election process for the different courts -Court of Justice of the European Union (CJEU) History, composition, jurisdiction & powers Legitimate Judicial Candidates Selection Process & Judicial Election process for the different courts Does the Court of Justice have more relevance/weight than UN’s ICJ or ICC? What differentiates this court from ICJ and ICC with reviews and rulings? -European Court of Human Rights History, functions, composition, powers & jurisdiction Legitimate Judicial Candidates Selection Process & Judicial Election process for the different courts Disparities and weight against UN structures -Eastern Caribbean Supreme Court History, functions, composition, powers & jurisdiction Legitimate Judicial Candidates Selection Process & Judicial Election process for the different courts Conflicts between the ECSC and the Caribbean Court of Justice concerning jurisdiction? -Reviewing the conditions for membership, respectively. Interest in Article 50 of the EU and if possible EC, CC counterparts. -Between the EC and CC concerning trade and other topics identify any conflicts in the past. How were the conflicts resolved? Generally who is at a disadvantage? -Economic foundations and economic tools (EU, EC and CC, respectively). With member countries being both collaborators and competitors among themselves, what framework or policies encourage stability and growth with such dilemma? Does empirical evidence exhibit higher geo-economic development (rate) with supranationalism? Does a WTO court (or UNCITRAL) have more power or influence than the general court in supranationalism concerning trade? Can such UN IGOs judicial entities overrule the general court with credibility? -Concerning, Switzerland, Norway, the U.K., Hungary and Belarus will identify the social, economic and (geo)political issues that are generators of skepticism, conservatism and disengagement against regional membership. How do such issues compare with the social, economic and political metrics for EU membership? -Regional security policies and programmes Will identify whether policies and statues in such unions lead to more security and human welfare than disjoint existences. Concerning human rights and financial regulation will identify universalities among sovereignties. Will identify implicit competencies (belonging to lower levels of government) and explicit competencies. Has supranationalism encouraged or reduced immigration within the region of concern? For whatever answer, what variables are highly influential? Note that jurisdictional competition may a subject matter that bulks together various variables. Is supranationalism a boon to United Nations for monitoring, management and operations with national/homeland security? M. FATF-GAFI Development and administration FATF Methodology, Guidelines and Risk Indicators The following to be used to profile ambiances of interests: Barker, A. G. (2013). The Risks to Non-Profit Organisations of Abuse for Money Laundering and Terrorists Financing in Serbia, Council of Europe N. UNODC Identifying the causes for its creation and the major framers/developers. UNODC governance structure Legal administration How are its executives selected? UNODC University Module Series-Organised Crime: < https://www.unodc.org/e4j/tertiary/organized-crime.html > Note: choice of modules in the above Will review some UNODC guidelines or manuals for detection of narcotics (and fetanyl) and illegal drugs concerning port authority or homeland security administrations. How are such manuals or guidelines developed? Sources of scientific research and empirical research for such guidelines. Analysis of UNODC Open Data O. Interpol History, legal foundations and statutes, administration, procedure and conditions for membership. Jurisdiction. Protocols What conditions must be met to establish international warrants and operations with Interpol? Comprehension of intervention abilities. What are the linkages between Interpol and the UN concerning global governance? Concerning Interpol identify any residing bureaucratic or constructive relationship involving the UNOCD? Does the lack of corporation with Interpol have any considerable influence on international diplomacy and commerce? How does a country get expelled from Interpol? Case Studies? ---MODULE 3 International Government Organisations (formation and diplomacy) Johnson, T., & Urpelainen, J. (2014). International Bureaucrats and the Formation of Intergovernmental Organizations: Institutional Design Discretion Sweetens the Pot. International Organization, 68(1), 177-209. Barnett, Michael and Finnemore, Martha. "2. International Organizations as Bureaucracies". Rules for the World: International Organizations in Global Politics, Ithaca, NY: Cornell University Press, 2012, pp. 16-44. Cortell, A. P., Peterson, S. (2022). Autonomy and International Organisations. J Int Relat Dev 25, 399–424 Cao, X. (2009). Networks of Intergovernmental Organizations and Convergence in Domestic Economic Policies. International Studies Quarterly, 53(4), 1095–1130. Statistical and ecobometric activities can be emulated for applied data sets and more modern data sets. ---MODULE 4 Economics and Trade NOTE: for the mentioned organisations or institutions will have identification for history and governance structure. This module will be a bit more condensed due to the number of elements, but acquisition and use of financial data will be reinforced. Respective financing and operations (excluding the 1700s and 1800s). Issues of transparency (within and dealing with sovereign states). A. International Trade (1700s and 1800s) Who were the initiators, coordinators and regulators? Mercantilism Period and controlling routes? B. For the (1700s and 1800s) how were records of transactions and balances honoured or deemed legally admissible among foreign nations before modern establishments? C. Free Trade in the 19th century? D. Bank for International Settlements (BIS) Origin, goals, framework, administration & regulations Concerning the European Central Bank (ECB) and Eastern Central Caribbean Bank (ECCB) what are the relationships and rules for such two intergovernmental banks with the BIS? E. Forward thinking Analysis of institutions such as the IMF and WBG being conceived before the end of WWII. F. Free trade and (versus) Domestic Production G. 1948- General Agreement on Tariffs and Trade (GATT) Highlight the drivers and initiators. Role of asset backed currencies and fiat currencies post-GATT. H. IMF and the World Bank International Monetary Fund: -> James M. Boughton, The IMF and the Force of History: Ten Events and Ten Ideas That Have Shaped the Institution. IMF Working Paper WP 04/75. Primary functions Prerequisites to be relevant to the organisation. Process of immersion and integration into this global system. Articles of Agreement of the International Monetary Fund Analytical discussions and possible participant conflicts in history is possible What are the models and metrics for determining loans or transactions to particular countries? Compare with a PESTEL format for such. World Bank: -> Catalysts or influences for the creation of the World Bank Primary functions Prerequisites to be relevant to the organisation. Process of immersion and integration into this global system. Administration Articles of agreement Analytical discussions and possible participant conflicts in history is possible. What are the models/metrics for determining loans or transactions to particular countries? Compare with a PESTEL format for such. International Monetary Fund. (2020). IMF and the World Bank: https://www.imf.org/en/About/Factsheets/Sheets/2016/07/27/15/31/IMF-World-Bank Driscoll, D. D. (1996). The IMF and the World Bank, How do They Differ? International Monetary Fund I. OECD Further: von Lampe, M., K. Deconinck and V. Bastien (2016), Trade-Related International Regulatory Co-operation: A Theoretical Framework, OECD Trade Policy Papers, No. 195, OECD Publishing, Paris, OECD (2017), International Regulatory Co-operation and Trade: Understanding the Trade Costs of Regulatory Divergence and the Remedies, OECD Publishing, Paris, J. World Trade Organisation (WTO) and Balance of Trade 1. Review of GATT Prerequisites to be relevant to the organisation. Process of immersion and integration 2. Design of administrations to support charters, various missions and objectives. Recognition/analysis of agendas and related operations. 3. Judicial court/structure in the WTO Functions, composition, powers & jurisdiction 4. What are the major subtleties between the general structure of the WTO and trade structures of the EU, NAFTA, Eastern Caribbean and the African Union? 5. Policies and initiatives towards crypto currencies with DeFi concerning laws/rules. 6. What prior foundation existed as the predecessor to the WTO? Compare its structure to what was developed via (1) through (4). The Technical Barriers to Trade (TBT) Agreement K. Special Drawing Rights Kenton, W. (2002). Special Drawing Rights (SDRs). Investopedia Laws and Articles for SDRs Process to access SRDs L. World Intellectual Property Organisation (WIPO) Prerequisites to be relevant to the organisation. Process of immersion and integration into this global system. For a country such as Guyana and others identify the causes for lack of progression with intellectual property towards firms or enterprises (corporate, entertainment, humanities, etc.). What are the economic, commerce and political effects for lack of intellectual property development? Is poor FDI highly correlated with such? Are the results same for macroeconomic and development measures? M. World Trade IGOs UNCITRAL, UNCTAD & WTO Differentiating in terms of functions, service, global governance and abilities. What is the constructive flow of operations and governance among such three? N. Recall the Caribbean Community structure and Eastern Caribbean structure What distinguishes the CC from the EC concerning economics? Open Market notion (purely economic definition) Identify advantages and disadvantages of EC against the CC Can judicial rulings of the EC concerning economics and trade be much more regarded than judicial rulings of the CC? If any existing trade agreements between external nations and the CC block, how does EC interests work? Can there be both CC and EC trade agreements with any same outside sovereignty? Are free trade agreements or open market agreements ever in conflict with WTO, UNCITRAL & UNCTAD statutes or foundations concerning the EC and CC existence? ---MODULE 5 NGOs & NPOs Resonance Korey, W. (1999). Human Rights NGOs: The Power of Persuasion. Ethics & International Affairs, 13, 151-174. Spiro, Peter J. (2008). NGOs and Human Rights: Channels of Power. Research Handbook on Human Rights, Edward Elgar, 2009, Temple University Legal Studies Research Paper No. 2009-6 What are the major elements for credible human rights development, growth and sustainability? Are such three highly correlated? Why or why not? The following two articles concern: Analysis -> Replication -> Incorporate more modern data -> Pursue analysis for other NGOs Henry, L.A., Sundstrom, L.M., Winston, C. et al. NGO Participation in Global Governance Institutions: International and Domestic Drivers of Engagement. Int Groups Adv 8, 291–332 (2019) Allard, G. and Martinez, C. A. (2008). The Influence of Government Policy and NGOs on Capturing Private Investment. Global Forum on International Investment 27 – 28 March 2008. OECD. ---MODULE 6 Technology and Advancement NOTE: for the mentioned organisations & associations will have identification for history and governance structure A. United Nations Standards Coordinating Committee (UNSCC) B. International Organization for Standardization (ISO) How did this organisation become relevant? Governance. Prerequisites to be relevant to the organisation. If one assumes weighted voting for particular “delegates” in such organisation, how can such be validated? Who is relevant to advance agendas and interests? Concerning elements representation for a single country, how does one evaluate the credibility and integrity of such an individual? For a respective country with questionable social and political levels/standings, how does the ISO evaluate or legitimize the credibility of meaningful presence? Conflicts or contradictions with the UNSCC? C. ECMA International (counterpart to B) D. Information Technology Agreement (ITA) and Basic Telecommunications Agreement (BTA) Relevance or interpretation or policy with the following Economic cooperation International banking Synchronization or coordination with FATFA International security Travel and Customs E. International Telecommunication Union (ITU) Under the auspices of UNESCO, IFIP is recognised by the United Nations. Position or policy on net neutrality. Position or policy on monopolistic and oligopolistic media conglomerates/enterprises internationally. F. International Federation for Information Processing (IFIP) Under the auspices of UNESCO, IFIP is recognised by the United Nations G. IETF & IANA H. ISACA How did this organisation become relevant and dominant? What relationships or policies reside with the UN structure? I. Establish a bureaucratic scheme, commerce or constructive relation between (A) - (I) ---MODULE 7 International Media Communications The International Press Telecommunications Council (IPTC) and International Press Institute (IPI) History, governance structure Prerequisites to be relevant to such organisations. Process of integration. What relationships or policies are there with the UN foundations? Polices on intellectual property rights. Policies on intellectual property rights Information Interchange Model (IIM) What levels/types of technologies and policies/guidelines are incorporated to maintain authenticity in (meta)data and recognition of proper sources concerning issues of plagiarism, false claims of ownership, intellectual property, fraudulent media, etc.? Is the IIM a system officially recognised by many/most countries concerning their reputation, national security or interests, whether for intelligence pursuits or censoring? Is the IIM often in conflict with gov’t policy? Role of the WTO in international media communications Role of the WIPO in international media communications What types of conventional commerce are there between the IPI and IPTC? For international mergers or takeovers involving telecommunications giants, apart from respective national regulatory influence what roles do the IOTC, IPI, WTO and WIPO have? Do such institutions have policies against oligopoly structures or attempts against distributed market share in relation to corporate headquarters residencies and political affiliations of the administration in question? Issues of reduction in media pluralism and independent views. With foreign sovereignty having their limitations or strong interests, how is the conveyance of media orchestrated with credibility? How is there authenticity and integrity? Methods in foreign policy and law by a sovereign state that assure authentic and credible media. Concerning geo-political/human crisis how is authentication of such events established with the international community and international governance? ---MODULE 8 Aviation and Air Transportation A. International Civil Aviation Organisation (ICAO) History, governance structure Airspace sovereignty (civil and military operations) Prerequisites to be relevant to the organisation. Process of immersion and integration into this global system. How does a sovereign state acquire air travel commerce with international firms? Concerning international air traffic, how does a respective sovereign state determine whether incoming foreign air traffic meet safety, security and energy standards sans being a constant business impedance? How does the ICAO determine whether a port or sovereignty maintains upkeep with international standards? How does an airport become certified nationally and internationally? How does an airport acquire air transportation services? What is the consensus amount of regulations for air travel and security agreed upon by recognised sovereign states related to post-9/11? How was this done? Case of International air disasters: foreign airlines in international air space versus foreign airline in sovereign airspace. For the case of foreign airspace and international airspace (both developed nations and third world), how is credibility of investigations determined? B. International Air Transport Association (IATA) History, governance structure Relevance to airspace sovereignty Prerequisites to be relevant to the organisation. Process of immersion and integration into this global system. For policies and agreements generated through the IATA, will such have considerable influence on the relevance or decision making of the ICAO? Are their emissaries operating for both the ICAO and IATA? Cartel history of the IATA, and current regulation against cartel standing. Concerning price fixing, are there any recognised historical cartel actions among airlines carried out apart from the IATA? Cite price fixing evidence if so. Is there cultural or formal lobbying between the IATA and ICAO? Possible case of entities of IATA with official ties within the ICAO and vice versa. Does the WTO have relevance in aviation and air transportation policy and standards? Consider major the international airlines concerning market share operations in the continents of North America, South America, Europe, Asia and Australia. Can entities of such firms be formally recognised as having major roles in the IATA, ICAO and WTO? C. Production and commerce in the Aerospace industry Statement to prove or disprove: there are many countries with the ability to produce commercial aircraft, however, often its commonly circulated that air transportation permission into foreign territories is extremely correlated in the same direction with the aircraft components incorporated. Support with statistics and 5C Analysis development. Airbus, Boeing, Bombardier, Lockheed Martin, etc., etc. Thales Group, Northrop Grumman Corporation & other avionics specialists Jet engine companies Keep in mind there’s nearly 200 countries today, so how are countries without aerospace engineering prowess convinced with new products in short time and safety standards? Is it constructive to limit change in market share in the aerospace industry concerning intellectual property, accountability, quality and labour stability? Apart from incidents and media what intelligence allowed for the suspension of Boeing’s 737 Dreamliner? Are inquiries, probe, hearings, etc. more extensive than elsewhere than in the United States? Is it a challenge to prosecute or apply embargoes on Boeing due to an oligopoly with exclusive industry services for aircraft and the components manufacturing “cartel”? Is the commercial aerospace industry the only realm where an oligopoly can thrive on international governance? What are the causes or catalysts for the creation and thriving of oligopolies in international governance? D. Aircraft Engine Environmental Analysis ICAO Aircraft Engine Emissions Databank Will try to collect data sets for the last 20-25 years. The aim with such data sets is to develop a model that confirms some level of environmental initiative. Consideration of how variables and/or parameters relate to emissions performance as aircraft engine development advances. How are performance/emissions data reporting by firms authenticated as credible? Between aerospace engineering firms, airlines, environment agencies of gov’ts, and aviation agencies of gov’ts, who has the biggest muscle? Determining benchmarks in emissions standards: nations compared to IGOs. ICAO Models and Databases (to investigate): https://www.icao.int/environmental-protection/pages/modelling-and-databases.aspx ICAO Environmental Tools (to investigate): https://www.icao.int/environmental-protection/Pages/Tools.aspx ---MODULE 9 Environment Initiatives Models (EIMs) A. What are they? How do EIMs become accepted by international bodies? B. Economic Input-Output Life Cycle Assessment 1.Analysis of method; guides and logistics before implementation 2.Building a customized model: http://www.eiolca.net/cgi-bin/dft/custom.pl C. Integrated Assessment Models (IAM) Vaidyanathan, G. (2012). Core Concept: Integrated Assessment Climate Policy Models have Proven Useful, with Caveats. PNAS Vol. 118 No. 9 e2101899118 Comparative Analysis with IAMs Note: will have some actual implementation and analysis of findings comparatively -- 1.Exploring the DICE model: logistics and Excel use 2.Framework for Uncertainty, Negotiation and Distribution (FUND) Analyse and acquire source code 3.Global Change Analysis Model (GCAM) Source: < http://www.globalchange.umd.edu/gcam/ > 4.REgional Model of Investment and Development (REMIND) Source: https://www.pik-potsdam.de/en/institute/departments/transformation-pathways/models/remind D. Identification of economic incentives for cooperation (countries and firms) E. Which nations are typically respected or take on leadership roles with environmental “policing” or enforcement? Why? What makes them legitimate leaders? ---MODULE 10 Marine Regulation A. International Maritime Organisation (IMO) United Nations Convention on the Law of the Sea (UNCLOS) International Tribunal for the Law of the Sea (ITLOS) International Seabed Authority (ISA) International Convention for the Prevention of Pollution from Ships (MARPOL) Will identify various significant conflicts throughout history that lead to the following four entities: UNCLOS, ITLOS, ISA and MARPOL Annex I-VI Administrative structure and judicial selection process and for UNCLOS, ITLOS, and ISA, respectively. What is operating relationship between such three? B. COLREGS, SOLAS 1974 + ISPS For particular articles in COLREGS will like to determine causes for its development. What are the disparities between COLREG and rules of your ambiance? Is there an acceptable limit for disparities between ambiance rules and COLREGS? For particular articles in SOLAS 1974 + ISPS will like to determine stimuli that lead to their development. Relation between naval architecture codes and SOLAS 1974 + ISPS ---MODULE 11 Territorial Principle (TP) How was TP established with/in the UN? TP versus state legitimacy. What/who can be trusted? Monitoring due process? Articles to build further discussions: Cormier, M. & Vagias, M. (2015). The Territorial Jurisdiction of the International Criminal Court, Journal of International Criminal Justice, 13(4), pp 895–896 Review ICJ counterpart as well. Maillart, JB. (2019). The Limits of Subjective Territorial Jurisdiction in the Context of Cybercrime. ERA Forum 19, 375–390 ---MODULE 12 Determinants for the Preference in Upholding Specific IGO Regulations – ask ChatGPT (or other AI) Identify 7-8 key factors Model for determinants influencing IGO regulation preference Econometric model(s) development for prior and validation? ---MODULE 13 Sanctions 1.UN’s Charter addressing sanctions 2.Process (multilateral, UN) Agendas and claims Legislation/Litigation process Means of credible evidence and validation to pursue 3.Conditions for UN to oppose external multilateral sanctions 4.Sanctions and the administrative channels for gov’ts Diplomatic Executive Economic 5.Analysis of chosen sanctions based on literature from state department, executive office, parliament, treasuries (OFAC, HM Treasury, etc. etc.), EU, UN, use of trusted media, etc. Will choose 3-4 past or current sanctions for analysis (targets and outcomes). Earlier structuring (1 through 4) will be used towards: A. Setting, conflict/plot B. Targets, intended effects, outcomes Analyse effects upon targets, general “market agents” & sovereignty 1. Diplomatic: resulting effects and responsive/counteracting tools with effects; may take much effort 2. Economic: observed effects (which may take much effort) Basic time series analysis with means to identify shocks and degradation: banks (equity, capital, credit/default risk), stock markets, major sources of income, gov’t securities (ratings, liquidity), exchange rate with benchmark currencies, foreign reserve dynamic, monetary policies/applied tools, fiscal policy, trade balance, FDI. Some advance structuring/development literature to further expand upon (A) and (B) (adjust to ambiances of study): Doxey, M. (1972). International Sanctions: A Framework for Analysis with Special Reference to the UN and Southern Africa. International Organization, 26(3), 527–550. Crawford, N.C., Klotz, A. (1999). How Sanctions Work: A Framework for Analysis. In: Crawford, N.C., Klotz, A. (eds) How Sanctions Work. International Political Economy Series. Palgrave Macmillan, London Haider Ali Khan, & Oscar Plaza. (1986). Measuring and Analysing the Economic Effects of Trade Sanctions against South Africa: A New Approach. Africa Today, 33(2/3), 47–58. Allen., S. H. (2008). The Domestic Political Costs of Economic Sanctions, The Journal of Conflict Resolution, 52(6), 916–944. 6. Global impact of economic sanctions (based on significant conflicts) Basic time series analysis with means to identify shocks and degradation: commodities (raw, hard, soft); energy; food prices; gov’t securities liquidity in advanced economies; stock markets in advanced economies; benchmark currencies compared to remaining G20 members, etc., etc. 7.Meissner, K. (2022). How to Sanction International Wrongdoing? The Design of EU Restrictive Measures. Rev Int Organ. Analyse, use of QCA and SetMethods R packages Prerequisites: at least upper sophomore level, respective writing sequence, International Financial Statements I & II, Introduction to Computational Statistics for Political Studies (or Mathematical Statistics) Legislative Process This course will examine the origin of the legislative branch ambiance government and the unique role it plays in representing all of the people of the country. Its history reveals the development of country and how the Parliament has adjusted, modified and changed internally and independently---all within the constitutional constraints designed by the Constitution’s authors. Parliament is often comprised of two similar yet each uniquely different legislative bodies. We will examine the differences and the role each legislative body plays to develop and refine public policies resulting in statutory law. We will examine the budget process which influences and controls all emerging public policies. We will scrutinize the role of parliamentary oversight of the executive branch and the role of the judiciary in our constitutional form of government. In examining how parliament really works, we shall explore common public criticisms as well as discuss ways in which parliaments’ effort could be improved. Lastly, we will look into the important role civic participation plays in demanding improved performance of this complex and diverse branch of government. NOTE: aside from national/federal legislature will also include treatment of provincial level and city level legislatures in comparative manner with the national or federal level for all topics. Activities for Assessment (some not necessarily in specific order and/or may be done on multiple occasions at unique stages in time) --> --We shall read various literature, and official (municipal, provincial, federal) law/bill libraries and repositories. Apply our insights in practical exercises that require reading, thoughtful analysis, writing and representation of a particular vested interest. --Political ideology and organisation in the legislature (based on module) Group assignments for provincial and municipal levels, however, all groups will be accountable for the federal level. --Case Studies: Welfare of bills. Review past/current bills (federal, provincial, municipal) in the legislative process (pass and fail) with analyses to give course substance in progression. --Bill Analysis Memorandum Methodology --Evaluation of 2-3 Bill Analysis. Accompanied by identification and profiling of legitimate stakeholders. Programme Theory. Bill cost estimation. Non-monetised impacts. --Analysing the correlation between lobbying expenditures, public opinion and legislative outcomes. Provincial, national and foreign cases, EU, and CC, respectively. Data: lobbying disclosure reports, public opinion, bill sponsorship data, voting records. --Case Studies: Judicial review/ruling of bills and parliamentary response. --Take 3-5 quizzes throughout course (based on lectures, T/F, history, and analytical short responses) Any past topic treated (including judicial rulings can re-emerge. --Take 2-3 examinations (will reflect quizzes) --Impact Evaluation (design) for a passed bill 2-4 years following Gertler, P. et al (2016). Impact Evaluation in Practice: Second Practice, World Bank Publications --Write a Legislative Bill Analysis Memorandum in lieu of a Final Examination. Documentation & Tools (crucial to undercurrent activities) --> Parliamentary repositories and databases Bill Analyses Cost Estimation data Bill Tracker Legislative voting record or databases Lecturing Outline --> NOTE: aside from national/federal legislature will also include treatment of provincial level and city level legislatures in comparative manner with the national or federal level for all topics. --Overview of the National Constitution --Constitutional structure for a legislature (federal, provincial, municipal comparatively). Framers and establishment. Review constitution concerning legislative branch powers and checks by the other branches. --Parliamentary structure, representation, service (time and term limits), elections process. Sessions and Cycles Federal, provincial and municipal --Parliamentary demographics (federal, provincial and municipal). Parliament and Law-making. --Political ideology and organisation in the legislature PART A: Liberal, Moderate and Conservative. How to definitively distinguish one from the other? Will be based on the social, political and economic realms. PART B: city, provincial and national levels of legislature, accessing legislative voting record versus ideology/political characterisation campaigns to model and analyse, comparing with the demography of the voters that support(ed) respective representation or candidate. PART C: database of individuals and individuals who have made contributions to federally registered political committees. Some exploratory data analysis and clustering will be applied. PART D: MONIMATE (scaling method) Poole, Keith T.; Rosenthal, Howard (1985). A Spatial Analysis for Legislative Role Call Analysis. American journal of Political Science, 29(2): 357–384. Extend to W-NOMINATE and DW-NOMINATE as well. R environment will be applied PART F: for one’s ambiance will apply similar structures as the following: GovTrack.us Analysis Methodology https://www.govtrack.us/about/analysis#overview R environment will be applied PART G: Bipartisan Index Concept. Developing the index formula and assimilating data into such formula. The Lugar Center-McCourt School Bipartisan Index (or alternative) PART H: analysis of development and function of committees in the legislature. Regulations for committees. PART I: Does a legislature serve best when its bipartisan dominated? --Lower House structure, representation, and selection process. Lower House Rules Committee Resolutions and Reports. --Scheduling Lower House Legislation & House Floor Procedures --Upper House structure, representation, and selection process. Upper House Rules Committee Resolutions and Reports --Scheduling Upper House Legislation & Upper House Floor Procedures --Differentiating powers of each house along with identification of constitutional framework for such. Power Resolving Lower House/Upper House Differences & Legislative Oversight. Dynamic Process. Some history. --Lobbying Regulations Overview of Legal provisions and congressional ethics rules --Preliminary legislative action and role of committees in agenda setting (for both upper and lower houses). --Bill Process (federal, provincial, municipal comparatively): life or death in in the legislature; executive veto and the possibility of legislative overrule. Case Studies. --Organising and Drafting Legislation --Transparency laws in the legislative process --Tools or systems used to track legislation. Hands-on activities --Track a bill's journey through committees, analyzing how amendments and debates within the committee affect its final form and passage likelihood. Data: committee reports, hearing transcripts, bill amendments, and legislative outcomes --Bill Analysis Memorandum Methodology (overview) --Study the speed and nature of legislative responses in emergencies, comparing them to standard legislative processes. Analyze the balance between expediency and thoroughness. Data: Emergency legislation, executive orders, legislative debates. --Case studies: legislative process and judicial review/ruling, and parliamentary response. --Budget Office serving parliament (federal, provincial, municipal) Responsibilities with nonpartisan policy. Survey of duties and literature development from databases/repositories/archives, say, common knowledge, procedures, technical terms, working papers, technical papers, research, etc. --Parliamentary Budget Process (with inclusion of the role of budget office) --Comparative observation of federal, provincial and local legislatures: structure, procedures, some history and demographics (of a chosen few); budgeting processes also included. --National congress having significant power and responsibility to respond to Supreme Court decisions. On statutory matters, there is no question that Congress may negate a Supreme Court interpretation by enacting new legislation. Structure/power towards (T&T) presidential decisions. --National Parliamentary grounds. Library and Databases immersion. --Tobago House of Assembly Library and Databases immersion --Finish Legislative Bill Analysis Memorandum. Legislative Bill Analysis Memorandum Due Prerequisites: Constitutional Law Executive Process Note: “noise” questions for outline to be answered throughout progression What is the bureaucracy? What tools does the bureaucracy have for implementing federal programs? How does the President exert control over the bureaucracy? What resources are available to President? What are different structural arrangements available? Is the bureaucracy responsible to the Executive Branch or to the Legislative Branch? How does Congress exercise oversight? Is Congressional oversight part of the solution or part of the problem? What actions can the President take unilaterally? What is the basis for such actions? What are some of the constraints on using such authority? What can Congress do to counteract presidential unilateral actions? Do Presidents act because Congress has not? How are the foreign policy roles of Congress and the President balanced? What issues arise with the bureaucracy? How does the president balance role of commander in chief and chief diplomat? What is the role of the executive branch in the federal budget? What mechanisms does the Executive Branch use to improve budget performance? COURSE OUTLINE: --Role and influence in a system of checks and balances --Selection process of the executive leadership. Influence of demography and ideology. Service (time and term limits). --Organisation of the executive branch, and how it is affected by the executive leader’s management style or agendas: 1. Executive Office Structure 2. Executive Branch Organisation 3. Transmissions and/or function between (1) and (2) 4. Group Assignment: observe a respective executive leader’s nominations or confirmations for cabinet positions, departments, ministries, commissions, agencies, etc. What are the backgrounds of such nominees (education, occupation history, ideals/rhetoric, sociopolitical record)? Administering a competent background investigation concerning prior question? Sources and references are expected. Do candidates identify well with the consensus executive policy or ideology? 5. Group Assignment: for the executive administration in question choose a programme or policy to apply the following elements of programme evaluation: A. Identifying new (or specific changes in) policy (both general and budgetary impact) B. Identification of the various stakeholders C. Programme Theory. Executive channels and permeation into provincial level. D. Legal challenges, possible judicial reviews and rulings (if relevant) E. Outcomes Evaluation RAND Corporation - Evaluate Outcomes of the Programme: < https://www.rand.org/pubs/tools/TL114/manual/step8.html > F. Impact evaluation (selected methods): Gertler, P. et al (2016). Impact Evaluation in Practice: Second Practice, World Bank Publications. NOTE: from Gertler to choose 1 or 2 methods that are feasible. NOTE: systematic black swans, natural catastrophes/disasters, fiscal management, global economy and geopolitics may influence without executive policy/programme at fault. Much emphasis on citations and references for assignment throughout. Can also be done for respective province municipality. 2-3 out of the following areas -- Agriculture Energy Environment Economic Policy (also includes financial industry) Trade Socioeconomic Development/Social Welfare Health & Human Services Justice (attorney general’s guidelines towards states/provinces) National Security Immigration Government Size (there are multiple methods for analysis) --Organisation of the executive branch for respective province or city, and how it is affected by the executive leader’s management style or agendas. Note: similar analysis to most of prior module, but omission of irrelevant elements regarding provincial level and city level. --Social Scientific Dimensions A. Drawing the line between the conservative and the liberal. Establish. B. Consistent realised outstanding ideals. Political History: Prior legislative and/or executive political record background of individual in question; track record on policies from priors via executive and legislative databases. C. Psychological dimensions of executive leader service, including executive leader character types Group Assignment: for chosen executive leaderships draw conclusions based on application of (A) to (C). Note: (A) to (C) may also be done for respective province and city. --Executive engagements with the legal process 1. Executive relations with Congress, and the factors that shape presidential success in Congress. 2. Lobbying the executive branch Executive Agency (or office) Lobbying Lobbying restrictions/disclosure acts 3. Attempted policies and the response of congress considering political makeup. 4. The influence of congressional elections results on success of executive policies; lower house and upper house, respectively. Are congressional elections results a strong gauge on feasibility of executive policies? 5. For democracies consider the executive leader’s relations with bureaucrats, and why they often resist the executive leader’s preferences 6. The mutual influences of the executive leader and the judicial branch on each other. --System of Balance and Checks review Structure and case studies with the executive role highly illuminated in terms of abilities, influence and restrictions. --Judicial reviews and rulings on executive orders Notable articles of the constitution for such and how prior executive actions stimulate reviews or judicial rulings. Process and cases in history. --The executive leader’s relationship with the press. Comparing America’s press engagement and etiquette with other countries. --Public opinion toward the president, its trends, sources and consequences Approval ratings and polls: structure of polls, ratings and credibility. Welfare of polls and ratings. --The concept of executive (leader) opportunity, and how it influences a leader’s performance in office. --Federal Budget Executive Budget Request (EBR): structure and analysis Group Assignment: Part A: comparative assessment of EBR with counterproposals of major factions in the legislature. Pat B: comparative assessment between predecessor and successor (or executive having “opposite political ideology” prior) Course Assessment --> 1. Attendance and Participation 2. Quizzes History, T/F, Executive Orders/Policy (EOP), EOP vs Judicial Review/Rulings, short responses 3. Group Assignments (through term) 4. Midterm (will reflect earlier quizzes) 5. Final Exam (features TBD) Prerequisites: Constitutional Law, Introduction to Computational Statistics for Political Studies Judicial Process To comprehend what the law actually is in practice, and to understand how it evolves over time, it’s necessary to understand how judges decide cases. The purpose of this course is to survey the social scientific literature on how judges make decisions. Topics include theories of decision making; judicial selection; constraints under which judges operate; the agenda and litigation process; collegial courts; intercourt relations; the separation of powers; and, the public. Course materials will be drawn from chosen text, judicial record AND original published studies. NOTE: THERE WILL BE historical review of court cases incorporated at various times. Will also identify historical judicial hearings and their fates due to the courts. Elements for course assessment --> 1. Lack of participation will make things much more difficult for you; making yourselves easier targets with the instructor’s creativity. 2. At four times during the term you will be required to write a 1-2 page reaction memorandum. These memoranda must be solely your work. On the first day of class you will receive, by lot, the sessions for which you are responsible for circulating a discussion memorandum. The memos will form the basis for class discussion. You should plan to read them before the seminar meets. Lack of effort or lack of memo submission on time, and lack of memo reading will make things much more difficult for you; making yourselves easier targets with the instructor’s creativity. 3. Essay: each student will write a 15-page essay over the course of the semester. The topic of the essay can be chosen by the student, but requires approval of the instructor. There are three types of essays students can choose to write: – Critical Literature Review. Critically review a literature related to judicial decision making. Contain a clear thesis, a discussion of what we know (and, perhaps, what we do not know), and the implications of what we know to legal practice. These essays might, also, contain a discussion of the normative implications of a particular literature. – Case Analyses. An analysis of a set of cases, typically in a single area of law or constitution, through the lens of one or more literature related to judicial decision making. Carefully select cases that provide analytical leverage for the thesis of the essay. Includes notable articles of the constitution or law (provincial or national), and how prior cases possibly influence reviews or rulings in question. – Original Empirical Research. Some original research conducted by the student. Written as research notes, that situate the research question within a literature, posit a clear research design, and—using existing or original data—conduct suitable statistical analysis. Submit by given date a 1-2 paragraph description of the essay one plans to undertake. I will, then, meet with each student on two decided days to provide feedback and guidance. On or before a following given date, each student is responsible for submitting, in hard copy, a full outline of their essay, including citations to cases and/or the literature that will be referenced. I will provide written feedback on these outlines and meet with students as needed; after deadline penalty can vary drastically or minimally. Final essays are due on date noted. Essays must have designated particular format, and converted to pdf file before submitting. Footnotes, endnotes, tables, figures, and a bibliography do not count toward the page limit. 4. Judicial Intelligence Students are expected to be knowledgeable on judicial structure, operations, processes, placement (local, provincial and federal). All such will be present in quizzes and exams. 5. Students are expected to be knowledgeable about particular amount of “landmark cases” and decisions: supreme, collegiate, appellate, trial, civil and opinion writing for the ambiance in question. There will be quizzes and exams incorporating all such. Concerning court cases: –For given excerpts students must identify the court case –True or False questions –Giving historical summaries –For general circumstances or dilemmas students to reference appropriate court case; there can possibly be multiple references as long they’re considerably “in the ball park” and relevant to current exercises of law. Process for cases to be heard by supreme courts (federal and provincial). Will include analysis of attempts (both failing to the reach the supreme court and those successful for case). Filling in critical statements, points and features. All such will be present in quizzes and exams. 6. Development of chosen measures from module 7 7. Simulations: plea bargain; civil case development and procedures Students are expected to be well prepared with legal knowledge and logistics. Good representation and performance are crucial for legal success. References and law repositories will be provided that are relevant. There will be those of professional legal background as guidance and evaluators. For each simulation there will be a process walkthrough without exhibiting much details of respective strategies and tactics before actual simulation. 8. All topics are applicable to quizzes and exams Assessment --> Participation Quizzes Memorandums 2 Simulations 2-3 Exams Essay Topic Outline --> 1. Separation of Powers. Foundations and Sources of Law 2. The Judicial Branch Identity development Causes of Judicial Review Problem of Judicial Review The Role and Identity of the Judge 3. Provincial and Federal Court Systems Structure of Provincial and Federal Court Systems Organisational Meetings, Agendas and Procedures. The network of committees 4. Provincial and Federal Court Selection of Judges Role and influence of executive body and legislature makeup on selection and confirmation. 5. Constitutional powers and limits (checks) on the Court Systems Federal Provincial Coexistence between provincial supreme courts and the federal supreme court: reviews and rulings in regard to executive branch policy (federal and provincial) and/or legislative branch policy (federal and provincial). SIMULATION: the process for both provincial supreme court and federal supreme court with whatever hypothetical sociopolitical issue. Students must be well prepared to properly and competently orchestrate the transitioning or involvement procedure. Cases between provincial and federal. Followed by case studies. 6. Law and Constraint 7. Ideology May rely heavily on journal articles Gaining the concepts of common measures: A. Segal-Cover Score B. Judicial Common Space C. Campaign Contributions Methodology Adam Bonica, Michael J. Woodruff, A Common-Space Measure of State Supreme Court Ideology, The Journal of Law, Economics, and Organization, Volume 31, Issue 3, August 2015, Pages 472–498, D. Party-Adjusted Surrogate Judge Ideology (PAJID) scores developed by Brace, Langer, and Hall (2000), which are focused on ideology for justices on state supreme courts. E. Martin-Quinn Score Note: excluding (E) some measures may be implementable w.r.t. limited time available. 8. Judicial Conduct Bangalore Principles of Impartiality and Integrity, and progressive efforts for measures Code of Conduct for Judges (Federal, Provincial, Municipal, respectively) Commission for Judicial Conduct (Federal, Provincial, Municipal, respectively) Establishment and Authorities Procedures involving role of commission intervention and action Case studies for judges under inquisition and outcomes 9. Intra-Court Bargaining and Opinion Writing Case studies in opinion writing (concerns and comparative arguments). Make use of Court Opinion Writing Databases. 10. Race, Gender, and Other Ascriptive Characteristics 11. Collegial Courts 12. Criminal Procedure and Trials 13. Assessing the Theory and Practice of Criminal Sentencing 14. Plea Bargain Simulation 15. Data Analysis for Criminal Offences Statistics for levels of punishment w.r.t. type of criminal offence Deterrence Hypothesis Probe models development, replicate or amend. Then pursue ambiance or region of interest with more modern data (determine best model). Followed by marginal effects versus forecasting. Taylor, J. B. (1978). Econometric Models of Criminal Behaviour: A Review. In: Heinke, J. M. Economic models of Criminal Behaviour. North-Holland Publishing Brier, S. S., & Fienberg, S. E. (1980). Recent Econometric Modeling of Crime and Punishment: Support for the Deterrence Hypothesis? Evaluation Review, 4(2), 147–191. Simester, D. I. and Brodie, R. J. Forecasting Criminal Sentencing Decision, International Journal of Forecasting 9 (1993) 49-60 North-Holland Schildberg-Hörisch, H. and Strassmair, C. (2012). An Experimental Test of the Deterrence Hypothesis, The Journal of Law, Economics, and Organization, Volume 28, Issue 3, Pages 447–459. Issues of disproportionality with race and wealth 16. Civil Court Civil Trials and Procedures SIMULATION: with tools and resources. Development process of a civil case, from filing to trial. 17. Existence of retention elections in local governance 18. Appellate Divisions Civil cases, criminal cases, provincial supreme court, federal supreme court, Surrogate’s Court, Family Court, and Court of Claims. Prerequisite: Constitutional Law, Introduction to Computational Statistics for Political Studies Comparative Electoral Systems Representative democracy concerns a set of rules to determine who wins elections and gets to govern. The rules in consideration can drastically vary in regard to how votes are cast, counted, and translated into seats, and differences in the rules can produce significantly different political outcomes, both directly (due to the way in which votes are counted) and indirectly (due to incentives that affect the behaviour of political actors, such as voters and political parties). --Know and understand the basic mechanical differences between electoral systems. --Use electoral results to obtain key measures of analysis, such as the effective number of parties and level of (dis)proportionality (being just one of many). --Compare and contrast the electoral systems used by different countries, and evaluate how observed differences in the politics of those countries may be related to the electoral systems. --Recognise the possibilities and limitations of electoral system design and reform. Typical Texts (in unison): The Politics of Electoral Systems (PES). 2008. Eds. Michael Gallagher and Paul Mitchell. Oxford University Press Electoral System Design: The New International IDEA Handbook (IDEA), 2008. Eds. Andrew Reynolds, Ben Reilly, and Andrew Ellis Reference: Colomer, J. M. (2004). The Handbook of Electoral System Choice. Palgrave Macmillan UK PES contains country-specific chapters, which are usually divided into the following sections: (1) Historical background of the country’s political system (2) Origins of the current electoral system (3) The electoral system as it stands today (4) Political consequences of the electoral system (5) The politics of electoral reform When thinking about the origins of electoral systems and debates about their reform, it's important to remember that they are usually adopted by the very actors–– politicians and parties––who will be most affected. Ask yourself: who stood to benefit from the adoption of certain rules, and who were the major players in these deliberations? Pay attention to the critical electoral variables in Section 3. When you are done reading, you should be able to answer the following types of questions: - What is the ballot’s structure (does it allow for intraparty competition)? - How many votes does each voter get and are they cast at the party or candidate level? - When the election is over, to what level do votes “pool” (can votes for one candidate help another)? - How many seats are allocated in each district? By what rule or formula? Section 4 will help you think about the theoretically relevant consequences of these rules for important dimensions of the political system: - How do political parties or candidates interact with their (potential) supporters? - What types of campaigning activities do candidates or parties pursue? - What types of candidates are attractive to parties, and to voters? - How cohesive are party members in terms of legislative voting? - What kinds of parliamentary activities are important to legislators? - What is the process of government formation (e.g., coalitions, cabinet post distribution)? - How stable (long-lived) are governments? ELECTIONS IN HISTORY --> Will treat past elections where the electoral college vote was contested, or with resonating controversy. Roles and actions of the following branches: Executive Legislature Judicial The various perspectives, rulings and/or resolutions, progression. ELECTION ANALYSIS PAPER --> Imagine you are a country expert who has been asked to write a post-election analysis for the State Department, an NGO, or the news media. You will choose a specific election in some country, -Explain the electoral system -Describe the parties or candidates that contested the election -Discuss the outcome, focusing in particular on how the electoral system helped shape the results, and applying the key measures of analysis (e.g., indices of fragmentation, disproportionality and others) you have learned from the course. You may choose any election in any democracy after 2005 (the last year covered in PES, the main textbook), except for an election that is included in the readings or already extensively covered. The election case you choose must be approved by whatever assigned date. You must consult (and cite) a minimum of four sources, including at least one academic source––meaning a peer reviewed journal article or a book published by a major press. You may also make use of web-based sources, such as newspapers, specialized blogs, or data archives. In addition, it would be helpful to consult primary sources (e.g., government, NGO, or international organization publications about electoral systems or elections). Since the point of the election analysis is to advance an argument that helps the reader understand what was significant––in your considered judgment––about the election and the electoral system, your paper should have a clear thesis statement and your argument should be carefully developed with supporting evidence. Topics may include such questions as: --How did the electoral system shape the conduct of the campaign and/or the outcome of the election? --How might the results (i.e., the distribution of seats) have been different under a different electoral system? --Was there any coordination failure among parties or candidates? Why, and how did this affect the results? --Was some party or minority group advantaged or disadvantaged by the electoral system? --Would a reform of the electoral system help resolve some perceived problem related to the current electoral system? Students with more advanced statistical skills are welcome to analyse the raw election data, if such data are available, but this is not required. If you need help narrowing your topic, or finding information or data for the election you’ve chosen, please consult me. As you read about each country case, you should focus on getting the basics of the rules correct, and then thinking about how those rules help to determine which behaviours make the most sense for politicians and parties to pursue. The above types of questions may also help to motivate your response papers and class discussion. QUIZZES --> Quizzes will arise every 2 – 3 weeks. Pop quizzes can arise when participation and discussions are poor. ELECTIONS INTEGRITY (concerns week 14-15) --> NOTE: Due to the issues of security clearance, time & space, and safety, only computational analysis of voter data will be pursued; qualitative methods however will be well highlighted. A. Literature for general comprehension -- BBC – Vote Rigging: How to Spot the Tell-Tale Signs Wikipedia – Election Fraud Alvarez, R. M., Hall, T. E., & Hyde, S. D. (2008). Election Fraud: Detecting and Deterring Electoral Manipulation. Brookings Institution Press. Hicken, A. and Mebane, W. R. (2017). A Guide to Election Forensics. USAID, Research and Innovation Working Paper series Rozenas, A. (2017). Detecting Election Fraud from Irregularities in Vote-Share Distributions. Political Analysis, 25(1), 41-56. B. Hands-On Computational Analysis -- For the following the methods, the structure and logistics to be developed, followed by implementation with data: 1.Statistical Analysis (Benford’s Law, Over-Dispersion Tests, Digit Analysis) 2.Voter Turnout Analysis Turnout Anomalies – Investigate unusual spikes in voter turnout in specific precincts or regions. Extremely high turnout rates, especially compared to historical averages, can be a red flag. Cross-refencing Voter Rolls (in our case may be challenging) – Check voter rolls for duplicate entries, deceased voters, or improbable voting patterns (e.g., voters registered in multiple locations). 3.Machine Learning & AI Pattern Recognition – algorithms to detect patterns of voting that are inconsistent with legitimate voting behavior. This can include identifying outliers in voting times, ballot submissions, or results. Anomaly Detection – AI tools can scan through large datasets to identify irregular voting patterns, suspiciously timed vote submissions, or inconsistencies across different types of voting (e.g., mail-in vs. in-person). 4.Geographic & Demographic Analysis Spatial Analysis – Examine the geographic distribution of votes to detect gerrymandering, ballot stuffing, or other forms of electoral manipulation. Demographic Cross-Checks – Analyze voter demographics to spot inconsistencies between voter rolls and census data or between registered voters and actual voters. 5.Polling and Exit Polling Comparisons Exit Polling – Compare exit poll data with official election results. Significant discrepancies may indicate vote tampering or fraud. Pre-Election Poll Analysis – Analyze pre-election polls against final results to spot anomalies that could suggest manipulation. ASSESSMENT --> Discussion//participation Quizzes Elections Integrity Election analysis paper and presentation Topic Outline --> WEEK 1. Introduction and Orientation to the Topic WEEK 2. Interparty Effects I: Duverger’s Law WEEK 3. Interparty Effects II: Party System Fragmentation & Gov't Stability WEEK 4. Intraparty Effects I: Candidate Selection and Candidate Characteristics WEEK 5. Intraparty Effects II: Candidate and Legislator Behaviour WEEK 6. Single-Member District Systems WEEK 7. Proportional Representation I: Closed-List Systems WEEK 8. Proportional Representation II: Open and Flexible-List Systems WEEK 9. Ranked-Choice Ballots: Alternative Vote Systems and STV Systems WEEK 10. Electoral System Reform WEEK 11. Mixed-Member Systems WEEK 12. Japan: from Signal Non-Transferable Vote to a Mixed System WEEK 13. Electoral System Effects in New Democracies WEEK 14 – 15. Election Fraud Detection Prerequisites: Introduction to Computational Statistics for Political Studies, Upper Level Standing. Co-requisite: Comparative Politics Comparative Politics We study politics in a comparative context, not just to find out about other countries, but to broaden and deepen our understanding of important and general political processes. We do this by making systematic comparisons among political systems that are similar in many respects, but nonetheless differ in important ways. This allows us to analyse the effect of these differences in a careful and rigorous way, enriching our understanding of how politics works. Exams --> 3-4 typical exams to be administered Analysis Labs --> The Comparative Method Case Studies Qualitative Data Cross-National Quantitative Research There will labs procured for each method prior. A method will be assigned to a designated topics bundle. Following, groups are assigned countries sets for each method. Reports accompany labs. There may be labs where multiple methods can be done comparatively later on chosen topics. Major Topics Spectrum --> -Social contracts, constitutions & delivering expectations -How do prior existing environments (social, political, economic) shape the nature of a constitution and its separation of powers? -Democratization throughout history -Democracy Models -Government branches with checks and balances -Executive branch structure, appointee process, power and limitations -Comparative Study of Bicameralism Differences in how laws are proposed, debated, and passed in each system. Consider factors like the role of each chamber, checks and balances, and the speed of legislation. Data: Legislative records, constitutional provisions, ethics, transparency laws, bill tracker, etc. -Means of federal and/or provincial judicial appointments and confirmation -Federalism models -Federalism, unitary, confederations Disparities in constitutions; power distribution; judicial authority; regional economics; culture -Is a bipartisan government ultimately the long-run norm? Which places have the most resilience, and why? -Political Instability (social, economic, political) -Non-democratic systems -Authoritarian rule (creation & causes, structure, preferences, economic welfare) -Proper size of government -Globalisation & Protectionism Prerequisites: Introduction to Computational Statistics for Political Studies, Upper Level Standing. Co-requisite: Comparative Electoral Systems
Public Policy Course Provides and Overview of the field of public policy, exploring its theories, processes, and applications in contemporary society. Students to examine the role of gov’t, stakeholders, and institutions in shaping public policy; as well as the impact of policy decisions on various societal issues. through case studies and real-world examples, students will develop analytical skills to comprehend, evaluate, and critique public policies. We will place the ideas from the readings into the context of past and present-day current events in politics. A step forward to becoming more politically critical, informed, and engaged citizens. OBJECTIVES --> -Comprehend the concepts of public policy and its significance in government. -Analyse the role of gov’t, interest groups , and other stakeholders in the policy-making process. -Examine and apply different models and theories of policy analysis and implementation. -Explore the impact of public policies on social, economic, an environmental issues. Develop critical thinking and analytical skills to evaluate and propose solutions to policy challenges. Feature Analysis --> At different times in the course for past and current (events and policies) groups of around 5 constituents will develop feature analysis Underlying Concepts: Why Focus on Public Policy; Determining legitimate stakeholders; Stakeholder Analysis; Types of Policies; Agenda Setting; Policy Preferences; Path Dependence; Policy Feedback; Power and Preferences. Underlying Challenges: Polarization and Policy Making; Provisionality & Non-Legislative Policymaking; Rights & Policy; Inequality & Representation; Visibility; The Policy State in a Constitutional System NOTE: some elements out of “Underlying Concepts” will need to be addressed. Models and Theory of Policy Making --> Applying models and theories of policy-making to model and analyse past or present policies: Rational Comprehensive model Incrementalism Advocacy Coalition Framework Punctuated Equilibrium Theory At different times in the course for past and current (events and policies) groups of around 5 constituents will develop models for past or present policies. NOTE: inevitably such 4 priors will need to be combined to gain insights and policy shaping. Policy Tools and Instruments --> At different times in the course for past and current (events and policies) groups of around 5 constituents will develop for past or present policies. For different types of policies (social, economic and environmental) students will identify policy tools and instruments within a programme theory framework. Literature --> Dunn, w. N. (2017). Public Policy Analysis: An Introduction. Routledge Bardach, E., & Patashnik, E. M. (2015). A practical guide for policy analysis: The eightfold path to more effective problem-solving. CQ Press. Additional assigned texts and journal articles Resources --> Gov’t record archives: Executive record. Documentation/literature/data from various elements of the branch. Municipal, provincial, national. Public Administrations: record, documentation/literature/data from various elements of the public sector or public administration. Municipal, provincial, national. Legislative action: bills & amendments. Bill cost estimation. Fiscal policy. Judicial record. Municipal, provincial, national. ASSESSMENT --> Class participation and engagement Feature Analysis Models and Theories of Policy-Making Policy Tools and Instruments COURSE TOPICS --> Introduction to Public Policy The Policy Making Process Policy Analysis and Evaluation Policy Implementation and Public Administration Models and Theories of Policy-Making Policy Tools and Instruments Social Policy Economic Policy Environmental Policy International and Global Policy issues Policy Evaluation Tools and Methods (overview) Transparency, coherency and practicality Prerequisites: Enterprise Data Analysis I & II, Introduction to Computational Statistics for Political Studies, Constitutional Law, Elementary Writing for Political Science, Advanced Writing for Political Science (for PA will be Public Administration Writing I & II instead of latter two) Public Policy Analysis This course provides an introduction to the issues and methods of public policy analysis. This course provides students with a “tool kit” of practical methods for analysing public policy issues. It develops a policy research and modelling skillset in considering complex, real-world issues involving multiple actors with diverse interests, information uncertainty, institutional complexity, and ethical controversy. Required Texts --> Munger, M. (2000). Analysing Policy: Choices, Conflicts, & Practices. W. W. Norton & Co. Wheelan, C. (2011). Introduction to Public Policy. W. W. Norton & Co. R Exercises Text --> Monogan, J. E. (2015). Political Analysis Using R. Springer International Publishing Literature for Term Projects (both will be applied) --> Patton, Sawicki, & Clark (2012). Basic Methods of Policy Analysis and Planning. Routledge Gertler, P. et al (2016). Impact Evaluation in Practice: Second Practice, World Bank Publications Resources --> Almanac of policy issues/agendas provides background information, archived documents, and links to major national public policy issues, organized the public policy of the sovereignty into the nine categories. Congression data (bills, bill estimator/estimation, etc.) Executive record, literature, data, etc. Public Sector administrations (record, literature, data, databases) Judicial Review/Record (if relevant) Tools --> R + RStudio Excel NOTE: prerequisite development and skills can come back to haunt. NOTE: students often may be asked to provide the following synopsis as a precursor for policy analysis: Conflict or plot Motives Policy Elements (issues, agendas, stakeholders, agencies) Policy Tools and Instruments Programme Theory Intended outcomes and incentives R Environment --> -Political Analysis with R (Monogan) Activities -R Exercises (to augment Monogan activities) --> 1.Using microdata to estimate the size of a population impacted by a policy or program. 2.Estimating the per-unit impact of a policy change or programme implementation. 3.Understanding the demographics of impacted populations, including demonstrating which populations are disproportionately impacted. 4.Accounting for uncertainty with sensitivity analysis Method Labs --> Applied hands-on set of assignments to reinforce methods introduced in the readings and lecture. These assignments will include spreadsheet-based tools and R programming to develop skills of analysis for public policy. Students are encouraged to bring their laptops to class to follow along with the instructor when demonstrations are provided, and/or take detailed notes that will help them. NOTE: from prerequisite will have advance recital of labs to be precursors to methods labs of this course. For each lab in this course specific designated lab(s) from prerequisite will be chosen that connects well to the methods lab to be done. Prerequisite labs should only apply data that precedes the respective policy’s implemented date. Grading --> Methods Labs #1 – 8 40% R Environment 25% Political Analysis with R (Monogan) Activities R Exercises Term Projects 35% WEEK 1 Welcome & Syllabus (Weelan Chap 1) Introduction to Policy Analysis, Context & Overview (Munger Chap 1 pp. 3-29) WEEK 2 Policy Writing I (Dunn, W. (2012). Public Policy Analysis. Boston: Pearson. Chapter 8: Developing Policy Arguments. pp. 338-374) Policy Writing II & Methods Lab 1: Policy Writing Musso, J., Biller, R., & Myrtle, R. (2000). Tradecraft: Professional Writing as Problem Solving. Journal of Policy Analysis and Management, 19 (4) 635-646 WEEK 3 – 4 Market Failure I (Munger Chapter 3) Market Failure II (Munger Chapter 4, Wheelan Chapter 3 (3.1--3.4) Market Failure III. (Wheelan Chapter 4) Statistical Evidence for Policy Analysis (Wheelan Chapter 10, Wheelan Chapter 9 pp. 304-308) WEEK 5 Statistical Evidence for Policy Analysis (Wheelan Chapter 10, Wheelan Chapter 9 pp. 304-308) Methods Lab 2: Statistical Evidence for Policy Analysis WEEK 6 Practical Criteria: Politics (Wheelan Chapter 6, pp. 177-207) McConnell, A. (2010). Policy Success, Policy Failure and Grey Areas In-Between. Journal of Public Policy, 30(3), 345-362 WEEK 7 Practical Criteria: Designing Policy Alternatives [May, P. (1981). Hints for Crafting Alternative Policies. Policy Analysis, 7 (29): 27 – 44] Evaluative Criteria & Equity (Wheelan Chapter 5, pp. 139-170) WEEK 8 Methods Lab 3: Practical & Evaluative Criteria Forecasting for Policy Analysis Patton, Sawicki, & Clark (2012). Basic Methods of Policy Analysis and Planning. Chapter 7. Evaluating Alternative Policies: Forecasting Methods, pp. 244 - 257. Routledge WEEK 9 Midterm Review Midterm Exam WEEK 10 Methods Lab 4: Forecasting for Policy Analysis Discounting I: Risk (Munger Chapter 9, pp. 139-170) WEEK 11 Methods Lab 5: Risk Analysis (Munger Chapter 9, pp. 139-170) Discounting II: Time (Munger Chapter 10, pp. 322-347) WEEK 12 Discounting II: Time (Munger Chapter 10, pp. 322-347) Cost-Benefit Analysis I (Munger Chapter 11, pp. 352-378) WEEK 13 Cost-Benefit Analysis II (Munger Chapter 11, pp. 352-378) Augmented with: Monetised costs and benefits Non-monetised impacts analyses: amenity, aesthetics, environment, ecological, heritage, culture Non-Monetised Benefits Manual: Qualitative and Quantitative Measures, Waka Kotahi NZ Transport Agency 2020 Tools like RIMS-II, IMPLAN, Chmura, LM3 or REMI may factor in. Campbell, H. and Brown, R. (2003). Benefit-Cost Analysis: Financial and Economic Appraisal Using Spreadsheets, Cambridge University Press, pp (194-220). Social Return on Investment (SROI) WEEK 14 Methods Lab 6: Cost-Benefit Analysis and SROI WEEK 15 - 18 Applying/Developing policy implementation indicators Methods Lab 7: Policy Evaluation Tools Externalities Methods Lab 8: Externalities Adhikari, S.R. (2016). Methods of Measuring Externalities. In: Economics of Urban Externalities. SpringerBriefs in Economics. Springer Tying up loose ends Prerequisite: Public Policy Formulation & Implementation (check PA) Analysis Tools in Political Theory Concerning political theory which involves the study of ideas, concepts, and principles related to politics, governance, justice, rights, and the organization of societies...this course engages political theory by application of common analysis methods in political science to treat questions of interest. Note: course has the government appeasement option, social/society option and history appeasement option. Literature and Tools --> Word Processor Notable works in political thought, treatise, theses, journal articles, constitutions, judicial record (reviews and rulings), etc., etc., etc. Data sources R environment Quizzes --> Will have quizzes on common knowledge, history, authors and their works, government, etc. Analysis Labs --> Qualitative Data Cross-National Quantitative Research The Comparative Method There will labs procured for each method prior. A method will be assigned to designated mandatory intellect concerns. Following, groups are assigned countries/regions sets for each method. Written papers follow labs. RStudio with Rmarkdown is possible when applicable to topic. Note: topics mentioned in Comparative Politics not treated can be taken up if interested. Mandatory Intellect Concerns --> QUALITATIVE DATA STUDY EXAMPLES -Ideology and Political Beliefs Analyze how political ideologies shape individual and collective beliefs, identities, and actions. -Social Contract & State Legitimacy Theories States: sustainability & progression Identifying causes of failures (for cases) -Democracy Models Origins and Appeal of Democracy Analysis on preference or establishment of types among different countries. Analysis of the branches of gov’t w.r.t. democracy model Focusing on citizen participation, deliberation, and representation. -Identity Politics Investigate the role of identity (e.g., race, gender, ethnicity, religion) in shaping political beliefs, policies, and movements. CROSS-NATIONAL QUANTITATIVE RESEARCH EXAMPLES -Democratic Stability and Consolidation Examine the factors that contribute to the stability and consolidation of democracies across different countries. Democracy indices, economic indicators, social indicators. Develop research questions. -Political Participation and Voter Turnout Investigate the determinants of political participation and voter turnout in different countries. Voter turnout rates; political participation indices (e.g., surveys measuring civic engagement; socioeconomic indicators (e.g., education, income levels). Develop research questions -Impact of Electoral Systems on Representation Research Assess how different electoral systems (e.g., proportional representation, first-past-the-post) affect political representation and party systems across countries. Electoral system types; party system fragmentation indices (e.g., the effective number of parties); measures of representation (e.g., gender representation, minority representation). Develop research questions. -Economic Inequality and Political Polarization Investigate the relationship between economic inequality and political polarization across different countries. Income inequality indices (e.g., Gini coefficient); political polarization measures (e.g., ideological distance between parties); voter behavior data (e.g., survey data on political preferences). Develop research questions. -The Welfare State and Social Spending Compare how different political systems and ideologies shape the development and structure of welfare states across countries. Welfare state indices (e.g., Esping-Andersen’s welfare state regimes); social spending as a percentage of GDP; political ideology measures (e.g., left-right scale). Develop research questions. COMPARATIVE METHOD EXAMPLES -Democratic Transitions and Consolidation Explore the processes through which countries transition to democracy and the factors that influence the consolidation of democratic institutions. Develop key questions. Comparative Approach: Most Similar Systems (MSS) - Compare countries that share similar historical or cultural backgrounds but differ in their success at consolidating democracy. Most Different Systems (MDS) - Compare countries with varying historical and cultural contexts that have successfully transitioned to democracy. -Federalism and Decentralization Examine the effects of federalism and decentralization on governance, political stability, and policy outcomes. Develop key questions. Comparative Approach: MSS: Compare federal systems in countries with similar political and economic structures but different outcomes in terms of policy implementation and governance. Cross-National Comparisons (CNC): Compare federal and unitary states to assess the impact of decentralization on issues such as economic development, regional inequality, and political representation. -Choice of topic that applies a either of the prior three (MSS, MDS, CNC) and Case Studies. Prerequisites: Comparative Politics, upper level standing, department permission Quantitative Analysis in Political Studies I This course provides an introduction to statistical methods for the political sciences (and Public Administration), with applications likely to be used in your research. This is not a “chalkboard/sharpie-board, pen and paper course”. NOTE: FOR YOUR OWN WELL BEING MIND YOUR DAMN BUSINESS AND DON’T GO STICKING YOUR NOSE ELSEWHERE. ALSO, THIS IS NOT A MATHEMATICS DEPARTMENT COURSE. Upon successful completion of this course, participants will have acquired an understanding of: · Acquiring data from addresses, databases, file types, APIs. Introspection and queries (databases, APIs and file types) · how quantitative methods can contribute to study social and political phenomena, make inferences about relationships, and test theories · differences between experimental and observational data and implications for interpreting quantitative analyses · how to describe quantitative data · how to make inferences and test hypotheses using quantitative data · how to identify, assess, and interpret relationships among variables · the logic and assumptions of linear regression modelling · diagnostics of linear regression models · common problems in fitting linear regression models to empirical data · criteria for building and choosing models for empirical data · limitations of quantitative approaches to social science Participants will acquire practical skills in: · using software for data management, analysis, and creating presentable summaries of findings · documenting a workflow from beginning to end · building on a core set of skills to learn new tools and commands in other, subsequent courses NOTE: course will demand 18 weeks Materials --> Kabacoff, R. Quick-R. Available at statmethods.net. This website offers well-explained computer code to complete most, if not all, of the data analysis tasks we work on in this course. James E. Monogan III. 2015. Political Analysis Using R. Springer. Fox, J. and Weisberg, S. (2011). An R Companion to Applied Regression, Second Edition. Sage, Thousand Oaks. Field, A., Miles, J., and Field, Z. (2012). Discovering Statistics Using R, SAGE Publications, Thousand Oaks. Tests, notes, assignments, projects from prerequisite as review reference NOTE: students are welcomed to incorporate other R texts, such as those from Springer and CRC press. Articles --> Course may also make use of some PS/PA journal articles as a means for analysis and to build R computational environments IN THE INTEREST OF POLITICAL SCIENCE AND (PUBLIC ADMINISTRATION). Computing --> We will rely heavily on R and RStudio. Reproducible Computing --> All work you do as a social scientist, particularly any data analysis you use to reach conclusions, needs to be reproducible. To this end, our course puts special emphasis on techniques and tools that help you create reproducible research. Using scripts and data analysis notebooks are some of these tools. research, I recommend the following print books (not being course texts): Stodden, V., Leisch, F., and Peng, R. D. (2014). Implementing Reproducible Research. Chapman and Hall/CRC, Boca Raton, FL Gandrud, C. (2013). Reproducible Research with R and RStudio. Chapman and Hall/CRC, Boca Raton, FL Weekly assignments (25%) --> For assignments involving work in R, you have to submit these assignments as RMarkdown data analysis notebooks, along with analytical description using mathematical pallette in a word processor. Will be composed of: Prerequisite assignments in each set Data Wrangling and Exploratory Data Analysis in each set Current course assignments in each set Two Take Home Midterms (30%) --> Also expect use of the R with RMarkdown, then converted to PDF format. Will reflect course topics and weekly assignments. Replication Project (20%) --> Replicating (or more precisely, reproducing) other scholars’ work is a key element of the scientific process. To engage with quantitative social scientific studies, you will replicate (reproduce) a study of your choice or from a list of suggestions using the methods you are learning in our course and/or what you are experienced with. This assignment will also give you some insight on how to conduct your own data analysis. By week 4, you need to identify a scholarly article from a PS/PA journal that uses quantitative methods (including multiple linear regression) and for which replication data is publicly available. After you send me the article, you will complete the following steps and turn in your final replication project by the beginning of class on week 12: 1. Retrieve the (replication) data for the article 2. Write an outline of your replication plan (template provided) 3. Write a replication script 4. Conduct the replication analysis of the main model in the article 5. Complete a replication memo, summarizing your findings (template provided) Research plan (20%) --> To facilitate your use of the methods learned in this course, you will compose a research plan that will help you write a publishable paper. This research plan is also similar to the type of document you would submit to pre-register a study at a journal. Your document needs to contain a summary of your research question, preliminary answer(s), research design, and a data analysis plan. You will submit this document (no more than 7 single-spaced pages) to me on designated due date. I will then send the document to a randomly assigned colleague for review. Topic Outline: 1.DATA ACQUISITION --> Acquiring data from addresses, databases, file types, APIs. Making data frames: introspection and queries. Basic data modelling review Research design. Questions and models. Experimental vs observational data. Using your computer as a scientific workstation Software skills: · Install R and RStudio · Install and load packages in R · Open, edit, and save an R script file · Begin a project in RStudio · Acquiring data from addresses, databases, file types, APIs. Making data frames: introspection, structuring and wrangling · Basic data modelling · Open and compile a template for an RMarkdown data analysis notebook in R · Converting to PDF · In-class Assignments concerning intro to R 2.DESCRIPTIVE STATISTICS Software skills: · Accessing a dataset in Excel/Open Office/Google Docs/csv · Dataset from an external source (APIs, governenment agencies, IGOs, Kaggle, etc. etc.) · Making data frames: introspecting datasets (based on prior two), and queries on dataset into R. Data Wrangling. · Summarize variables and datasets · Statistical methods for fraud detection · Create a well-designed, editable document with descriptive statistics and graphs. Will also treat more general data sources and formats towards R. 3.PROBABLITY & DISTRIBUTIONS Review of Probability Axioms Simulating random variables with data Review of ideal distributions and their properties Evaluate ideal probabilities (various interval types) Software skills: · Plot a distribution with histograms, density plots for ideal distributions · Plot a distribution with histograms, density plots with real data · Plots with both histograms and densities in display · PP plots for real data · QQ Plots for real data . MLE and MoM for real data · Sample data from a distribution (general) · Plot cumulative distributions · Document and organize code 4.INFERENCE & HYPOTHESS TESTING Software Skills · Reinforcement of descriptive statistics generation upon data (both real raw data and simulated) · Skew and Kurtosis · Box Plot · Histograms · Determing Distributions Q-Q plots review Chi-Square Test Kolmogorov-Smirnov Test Anderson-Darling test Shapiro-Wilk Test · Methods of finding point estimates MLE, MoM, Method of Least Squares · Calculate and plot confidence around a mean. If not normal, then what? · Comprehending critical values for real raw data sets · Advance repetition of Goodness-of-Fit module from prerequisite · Hypothesis Testing in R (with no assumption about the distribution) When we get to hypothesis testing we are and not concerned with zombie problems. What’s important is how it’s meaningful to you with your endeavours in PS and PA. Majaski, C. (2021). Hypothesis Testing. Investopedia NOTE: all prior modules (1-3) will be reinforced before applying hypothesis testing. NOTE: topics with means, medians and variances are strictly for the following topics: comparative analysis, policy evaluation, quality assurance, and predictive modelling. Will apply real world data with such topics...NO EXCEPTIONS...NO EXCUSES....RAW LIKE SUSHI. Note: mean and variances are not appropriate for Impact Evaluation; calm your backsides down. 5. ASSOCIATION BETWEEN VARIABLES Software skills: · Correlation types types. Correlation matrices and heat maps. · Chi-Square for categorical variables and ordinal variables (association among variables, contingency tables development, homogeneity, variances) · Fisher Exact Test as alternative to prior concerning association. 6.BIVARIATE REGRESSION Software skills: · Refresher of data acquisition from wherever and management · Refresher of summary statistics development · Create a scatterplot of two variables with a line of best fit · Calculate the correlation coefficient of two variables · Estimate a linear regression model with one predictor · Create a residual plot · Summary statistics of regression modelling · Summarize and present regression results in a well-designed document 7. ADVANCE DATA MANAGEMENT Software skills: . Making data frames involving various data types · Import datasets from different sources into R (and probing data) · Clean a dataset for data analysis: making data frames from raw data sets or prior data frames. · Descriptive statistics again · Statistical methods for fraud detection · Merge datasets with a common identifier cbind(), rbind(), abind() · Collapse a dataset 8.MULTIPLE REGRESSION (OLS) Software skills: · Selecting Variables · Estimate a regression model with multiple predictors . Summary statistics interpretation · Heteroskedasticity · Present regression results graphically · Calculate standardized regression coefficients · Summary Statistics review · Forecasting & Error · Training & test sets · Marginals 9.DEALING WITH UNUSUAL & INFLUENTIAL DATA Software skills: · Diagnose outliers. What you call an outlier, why is it an outlier? · Assess outliers, leverage, and influence in one combined plot · Hat-values · Studentized residuals · Cook’s D statistic · Create added-variable plots · Missing Data (To implement) Kang H. (2013). The Prevention and Handling of the Missing Data. Korean J Anesthesiol. 64(5): 402-6 Dong, Y., Peng, CY.J. (2013). Principled Missing Data Methods for Researchers. SpringerPlus 2, 222 NOTE: if any regression technique is to be applied data probing must be involved to avoid the often-naive assumption of OLS/WLS/GLS. 10.DIAGNOSING & DEALING WITH VILATIONS OF OLS ASSUMPTIONS, INCLUDING ENDOGENEITY Software skills: · Conduct numerical and graphical checks for violations of the OLS assumptions · Create component-plus-residual plots · Transform variables · Calculate variance inflation factors · Calculate “robust” standard errors for a regression model · Quantile Regression (development similar to module 8) 11.MODERATNG RELATIONSHIPS: INTERACTION TERMS (module 10 will resonate) Terms to know (terms not necessarily expressed in desired learning order): Dummy variable, dichotomous, polytomous, interaction term, constitutive terms, principle of marginality, centring variables, marginal effects Software skills: · Estimate regressions with interaction terms · Present and interpret interaction terms numerically and graphically · Create marginal effects plots for interactions (margins package) 12.MODEL FIT, MODEL CHECKING, FUNCTIONAL FORMS, VARIABLE SELECTION (modules 10 & 11 will resonate) NOTE: relevance of module 8 is required. Software skills: · Adjusted R 2 · Variance Inflation Factor · Simulate predicted data from a developed regression model · Compare simulated and observed data · Assess model fit with numerical and graphical methods · Transform variables · Marginal effect (margins package) 13.GENERALISED LINEAR MODELS Response variables: Categorical and Dichotomous Linear probability model, Probability of the response (π), Linear predictor Transformations (logit or probit). Unobserved/latent variable formulation exp(Xβ)/1+exp(Xβ), Maximum likelihood estimation, Deviance, Log-likelihood Separation/separability. Ordered logit and probit, Multinomial logit. Software skills: · Note: applications concern political science, political economy and social datasets . Test for independence among categorical variables (Chi-Square test and Fisher Exact test upon your developed contingency tables) · Use of stats{glm function}, glmnet, GLMcat packages · Estimate generalized linear models using maximum likelihood . Summary statistics glm models · Present estimates using predicted outcomes (probabilities) · Diagnose problems with generalized linear models · Marginal effect (margins package) Prerequisite: Introduction to Computational Statistics for Political Studies Quantitative Analysis in Political Studies II This course extends what you did in previous courses by focusing more on nonlinear model forms: "generalized linear models," or "maximum likelihood models." In this course we’re highly concerned with how to adapt the standard linear model that you know so that a broader class of outcome variables can be accommodated. These include: counts, dichotomous outcomes, bounded variables, and more. There is a some theoretical basis for the models that we will use. Also, the bulk of the learning in the course will take place outside of the classroom by reading, practicing using statistical software, replicating the work of others, and doing problem sets. Keep in mind that the skills attained in this course are those that the discipline of political science expects of any self-declared data-oriented researcher. Use of the statistical environment R in conjunction with RStudio. Grading --> Problem sets (40%) Real world tasks (40%) Component A Use of political data [polls, elections, policy, legislative, executive, executive administration (offices, departments, agencies, bureaus), IGOs, etc., etc.] to characterise and for model development (ambiance, foreign and international), and forecasting. Use of economic data from gov’t (offices, departments, agencies, bureaus) and IGOs to characterise and for model development, and forecasting. Assigned journal articles for replication and inclusion of modern data Component B Replication Project + Research Plan similar to what was done in prerequisite, however, will intensively reflect (most) topics of this course. Articles to use available datasets (COW, national election studies, GSS, Kaggle, gov’t, IGOs, etc.). An exam on MLE theory and basic models (20%) Problems Sets --> A. Problem sets will include software skills, projects tasks and assignments done in prerequisite to stay fresh. B. Course problem sets will be a combination of analytical and software computational assignments based on lecturing. References --> Faraway. Extending the Linear Model with R: Generalized Linear, Mixed Effects and Nonparametric Regression Models. Chapman & Hall/CRC Faraway. Linear Models with R. Chapman & Hall/CRC Monogan, J. E. (2015). Political Analysis Using R. Springer Materials, texts assignments and projects from prerequisite Topic Outline --> WEEK 1. Uncertainty, Inference, and Hypothesis Testing Misconceptions of the loss function: rhetoric of significance tests Insignificance of null hypothesis significance testing Problem Set # 1 WEEK 2. The Likelihood Model of Inference Binomial PMF likelihood grid search Model syntax summary Problem set # 2 WEEK 3. Models for Dichotomous Outcomes Homework: Prereq refresher exercise set Faraway, Chapter 2, Exercises 1-7. For Exercise 2.2, download the wbca.txt data from Faraway, Chapter 2, Exercises 1-7. For Exercise 2.2, download the wbca.txt data from http://www.maths.bath.ac.uk/~jjf23/ELM/. Also for Exercise 2.2, do not use the step function in part (b), use your own intuition) Find a datasets with a dichotomous outcomes that you are interested in. Run an appropriate glm model in R and submit the output with a paragraph defending the variables and model fit. WEEK 4. Models for Count Outcomes Homework: Prereq refresher exercise set Faraway Chapter 3, Exercises 1-7 WEEK 5. Models for Contingency Tables Homework: Prereq refresher exercise set Faraway, Chapter 4, Exercises 1-7 WEEK 6. Models For Ordered and Unordered Categorical Data Homework: Prereq refresher exercise set 1. Faraway Chapter 5, Exercises 1-6. 2.Consider a proportional odds model using the logit link function with only one explanatory variable in addition to the constant. Express the odds ratio (i.e. not-logged) for a one-unit change in the explanatory variable. What does this simplify to? WEEK 7. EXAMINATION (analytical and computational mixture) WEEK 8. How to Handle Missing Data in Models. The EM Algorithm and Multiple Imputation Problem Set WEEK 9. The GLM Theory and the Exponential Family Form Homework: Prereq refresher exercise set Faraway Chapter 6, Exercises 1-5 WEEK 10. Other GLMs, Quasi-Likelihood Estimation Homework: Prereq refresher exercise set Faraway Chapter 7, Exercises 1-7 LAST INSTRUCTION WEEK. Random Effects. Homework: Prereq refresher exercise set Faraway Chapter 8, Exercises 1-9. WEEK 11. Finishing and turning in replications. WEEK 12. Discussion of replications. Prerequisite: Quantitative Analysis in Political Studies I Political Economy Politics posits a large role for economics in determining political outcomes, and economics suggests a central role for policy in the workings of markets. Political economy attempts to make these connections explicit, by treating economic and political outcomes as interdependent and endogenous. Insights and lacuna that arise in using economic methodology, including formal models and regression analysis, to analyse political phenomena and interactions between the economic and political systems. Course makes use of 16 - 18 weeks, 3 days per week, 2 hours per day. First two days are dedicated to the lecturing texts, for analysis and debates. Third day in each week is dedicated to given journal articles for analysis and development; students are responsible for R development, but instructor can give logistical advise. It’s also possible for multiple topics involving journal articles to be done on a respective third day. Lecturing Texts --> Stilwell, Frank, (2011). Political Economy: The Contest of Economic Ideas, Oxford University Press Banaian, K. & Roberts, B. (Eds.). The Design and Use of Political Economy Indicators: Challenges of Definition, Aggregation, and Application, Palgrave. Note: both texts will accommodate a respective theme or topic. Environment Expectations --> Inherent analytical and empirical challenges that arise in attempting to assign interconnectedness (association) or causality among economic and political variables. Moderate Debate. Software --> For the empirical exercises you’ll be working with data. You will use R to work with data. Packages of one’s choice to be used. Inquisitions on models expected. Succession: make data adjustments concerning ambiances of interest and augmented with modern data inclusion. Class Participation (10%) --> A big part of the course is talking about what you read. You’ll should read the stuff for that meeting carefully and think about them in depth before coming to class. In-Class Quizzes (25%) --> Quizzes concern development from the lecturing texts. The quizzes will be graded on a 0-1-2-3 scale, and I will drop your lowest two grades. Research Group Term Project (30%) --> Gertler, P. et al (2016). Impact Evaluation in Practice: Second Practice, World Bank Publications Groups will be assigned 1 or 2 policies or programmes to develop impact evaluation. A minimum of two methods to be applied. -When using a word processor use of mathematical pallette is also expected for mathematical expressions. Word processor document must also be converted to pdf document. -Use of word processor will be complimented by development in the R environment with proper headings, structure, formulas via latex, etc. R development must have sensible commentary with computational development. Models critique/inquisition expected in project. Also must be converted to pdf document via rmarkdown. Ambiances, data sources and database lists will be provided, where hints on structuring troublesome data to be encountered may be provided. Empirical Exercises (35%) --> Empirical exercises will be based on all given journal articles. Expected will be development in R where computational development is complimented by commentary and latex usage for mathematical descriptions. Via Rmarkdown to convert development into pdf files. It may be inevitable that data sets to include modern data as well, thus changing analysis and conclusions. Hence, to first develop with data range used by articles, then extending with more modern data. You will work in small groups (3 or 4) and hand in a single common development. Inquisitions on models expected. Namely, feature importance/selection and model validation to be included in developments. Your model may be different to those of the articles. 1.Economic Effects of Constitutions Mueller, D.C. (2007). Torsten Persson and Guido Tabellini, The Economic Effects of Constitutions. Constit Polit Econ 18, 63–68 Persson, Torsten & Tabellini, Guido. (2004). The Economic Effect of Constitutions. MIT Press, 306 pages 2.Human Development Baum, M., & Lake, D. (2003). The Political Economy of Growth: Democracy and Human Capital. American Journal of Political Science, 47(2), 333-347 Allan Drazen (2008). Is There a Different Political Economy for Developing Countries? Issues, Perspectives, and Methodology, Journal of African Economies, Volume 17, Issue suppl_1, Pages 18–71 Ullah, S. Azim, P. and Asghar, N. (2014). Political Economy of Human Development: An Empirical Investigation for Asian Countries. Pakistan Economic and Social Review, 52(1), 75-97 3.Measuring Social and Political Requirements for System Stability in Latin America Duff, E. & McCamant, J. (1968). Measuring Social and Political Requirements for System Stability in Latin America. The American Political Science Review, 62(4), 1125-1143. 4.Democratization Jay Ulfelder & Michael Lustik (2007) Modelling Transitions To and From Democracy, Democratization, 14:3, 351-387 Teorell, J. (2010). Determinants of Democratization: Explaining Regime Change in the World, 1972–2006. Cambridge: Cambridge University Press Thomas Mustillo (2017) Party Nationalization Following Democratization: Modelling Change in Turbulent Times, Democratization, 24:6, 929-950 5.Political Preferences -Formation of political preferences -Measurement of political preferences Epstein, L., & Mershon, C. (1996). Measuring Political Preferences. American Journal of Political Science, 40(1), 261-294. 6.Rent Seeking -Concepts -From public commodity to favouring the financially/economically dominant -Causes and resolutions for negative externalities mitigation -From lobbying to subsidies, grants and tariff protection -Limiting competition or creating barriers to entry -Economic rents sans added productivity or capital at risk -Occupational Licensing Journal Articles: Spindler, Z. A (1990). A Rent-Seeking Perspective on Privatization. North American Review of Economics and Finance, Volume 1, Issue 1, Pages 87-103 Pecorino, P. (1992). Rent Seeking and Growth: The Case of Growth through Human Capital Accumulation. The Canadian Journal of Economics, 25(4), pages 944-956 Pedersen, K.R. (1997). The Political Economy of Distribution in Developing Countries: A Rent-Seeking Approach. Public Choice 91, 351–373. Khwaja, Asim, and Atif Mian. 2011. “Rent Seeking and Corruption in Financial Markets”. Annual Review of Economics 3 (1): 579-600 Sections 3 and 4 serve well towards research and model building 7.Elections and Government Spending Comparative analysis to draw conclusions: Dewan, T. and Shepsle, k. A. (2011). Political Economy Models of Elections. Annual Review of Political Science 2011 14:1, 311-330 Adi Brender, Allan Drazen (2013). Elections, Leaders, and the Composition of Government Spending, Journal of Public Economics Volume 97, pp 18-31 Drazen, A. and Eslava, M., Electoral Manipulation via Voter-Friendly Spending: Theory and Evidence. Journal of Development Economics 92 (2010) 39–52 8.Size of Government and Economy -Determining the size of gov’t. Multiple Methods can be given by ChatGPT. -What are the significant qualities for identifying economic strength? Students will pursue hypotheses and try to acquire consistent data to model and test. -For the following articles, analyse, model critique, then replicate/confirm or compare with model preference with results and forecasting. Then for other ambiances where data with modern extension is accessible. I may also ask to aggregate data sets based on different gov’t size measure methods to apply to articles. Altunc, O. F. and Aydin, C. (2013). The Relationship Between Optimal Size of Government and Economic Growth: Empirical Evidence from Turkey, Romania and Bulgaria, Procedia - Social and Behavioral Sciences 92, 66 – 75 Cetin, M. (2017). Does Government Size Affect Economic Growth in Developing Countries? Evidence from Non-Stationary Panel Data, Euro. Journal of Economic Studies, 6(2) 9.Determinants of Institutional Quality Borner, S. et al. (2004), Institutional Efficiency and Its Determinants: The Role of Political Factors in Economic Growth. OECD José Antonio Alonso, Carlos Garcimartin & Virmantas Kvedaras (2020), Determinants of Institutional Quality: An Empirical Exploration, Journal of Economic Policy Reform, 23:2, 229-247 10.Regulatory Competition Regional choices and data can be adjusted Malone, T., Koumpias, A. M., & Bylund, P. L. (2019). Entrepreneurial Response to Interstate Regulatory Competition: Evidence from a Behavioural Discrete Choice Experiment. Journal of Regulatory Economics, 55(2), 172–192. Zheng, D., Shi, M., & Pang, R. (2021). Agglomeration Economies and Environmental Regulatory Competition: Evidence from China, Journal of Cleaner Production, Volume 280, Part 2, 124506 Mazol, A. (2021). Jurisdictional Competition for FDI in Developing and Developed Countries. Free Policy Network Brief Series 11.Regional Integration Applications Matthews, A. (2003). Regional Integration and Food Security in Developing Countries. Food and Agriculture Organization of the United Nations Articles to analyse, and then make use of ambiance data of interest with possible inclusion or more modern data (CC, EC, EU) Genna, G. M. & Hiroi, T. (2004). Power Preponderance & Domestic Politics: Explaining Regional Economic Integration in Latin America & the Caribbean, 1960-1997. International Interactions. 30(2):143-164 Feils, D.J., Rahman, M. The Impact of Regional Integration on Insider and Outsider FDI. Manag Int Rev 51, 41–63 (2011) 12.Despotism One may also have their competing models to validate and test alongside those given in the articles (modern data inclusion expected): Cheibub, J.A., Gandhi, J. & Vreeland, J.R. Democracy and Dictatorship Revisited. Public Choice 143, 67–101 (2010). Haggard, Stephan; Kaufman, Robert R. (August 2012). "Inequality and Regime Change: Democratic Transitions and the Stability of Democratic Rule". American Political Science Review. 106 (3): 495 – 516 Ristei, Mihaiela; Centellas, Miguel (2013). The Democracy Cluster Classification Index. Political Analysis. 21 (3): 334–349. Prerequisites: Quantitative Analysis in Political Science II Prerequisites (ECON): Econometrics Survey Research Course Literature (IN UNISON) --> Singleton, R. A. & Straits, B. C. (2017). Approaches to Social Research. New York: Oxford University Press Lumley, T. (2010). Complex Surveys: A Guide to Analysis Using R, Wiley Tools and Resources --> R + RStudio Microsoft 365 United States Office of Management and Budget (OMB) Standards & Guidelines for Statistical Surveys - https://www.samhsa.gov/data/sites/default/files/standards_stat_surveys.pdf Code of sound and ethical practice in the conduct of public opinion and survey research, and promoting the informed and appropriate use of research results. Assessment --> Quizzes Survey Strategies R Labs (to treat particular statistical/predictive course topics on multiple occasions) Survey Technologies Labs on multiple occasions Creating data entry forms compatible with spreadsheets Survey tools for distribution of surveys to large populations Creating companion guides within spreadsheets alongside data Survey Critique Questionnaire Design Writing a questionnaire for a benchmark survey Proposed experiment & semester-long project in which students are expected to develop, pilot test, analyze and evaluate their own survey instruments. COURSE OUTLINE: -Introduction to Survey Research -Research Design & Planning -Sampling Techniques -Questionnaire Design -Data Collection Methods -Survey Technologies -Data Management & Preparation -Developing Explanatory Manuals -Coding binary/categorical and ordinal variables. Keeping track of your coding. -Descriptive Statistics for Survey Data (binary, categorical, ordinal, continuous) Treatment for each type of variable -Will acquire some survey data sets concerning the social and behavioural sciences (endless supply in developed countries). Data sets will emphasize a mixture of binary, categorical, ordinal and continuous variables. Bivariate Analysis for all possible combination of variable types; like variable pairs as well. What types of statistical analysis are appropriate? What predictive models are appropriate? What predictive model statistics are appropriate? Multivariate Analysis for all possible combination of variable types. For a chosen response variable what types of predictor variable selection methods are appropriate? Assume dealing with all the variable types. What types of predictive models are appropriate? What predictive model statistics are appropriate? Say, what if your response variable is categorical or binary and the predictors are a mixture of all the mentioned variable types? Same question concerning an ordinal response variable. Same question concerning concerning a continuous response variable. -Survey Errors & Data Quality -Reporting Survey Results Prerequisites: Advance Writing for Political Science (or Public Administration Writing II); Quantitative Analysis in Political Studies I & II; Senior Standing Methods of Political Analysis Course will focus on three related issues: 1) how authors in political science and in related fields convince their readers of the validity of their theories; 2) how the reader can distinguish between convincing and unconvincing research; 3) how one can design their own research to be as convincing as possible. In this course, students should develop a taste for criticism: that is, not believing things written only because they have been published, but in evaluating the evidence presented; in being skeptical, yet fair. This last skill will be most appreciated when you begin to design your own research projects in this course and in later years. Applied Texts --> King, Gary, Robert O. Keohane, and Sidney Verba. 1994. Designing Social Inquiry: Scientific Inference in Qualitative Research. Princeton: Princeton University Press. Frankfort-Nachmias, Chava and David Nachmias. 1999. Research Methods in the Social Sciences, Sixth Edition. New York: St. Martin’s. NOTE: other literature will apply throughout. When relevant, all literature should be read with three questions in mind, questions to which we will return constantly in class, and which should be the topics of your papers: 1) What is the author’s argument or theory, and how does it compare to alternative theories that might be proposed or have been proposed by others? 2) What evidence does the author provide, and how convincing is it? and 3) How could the research be improved? Also of particular interest will be the question of alternative theories: has the author of a given theory not only convinced you that her theory makes good sense, but also that rival explanations have been eliminated? Short Papers --> There will be a series of short papers throughout the term, assigned in such a way that several students will have assignments each week on a rotating basis. Each week’s discussion, therefore, will benefit from a number of students who have been assigned to write papers on particular topics. These short papers should not be summaries of the readings. Rather, they should take issue with the author(s) on some particular question, discuss what potential problems arise from what the author(s) did, and propose an improvement. You should not spend time on generalities, but should go quickly into the particulars. After stating the general problem, spend some time discussing the particular mistake or unforeseen implication of what the author did, then discuss how to make improvements. Also discuss how this change might be related to any possible changes in the substantive conclusions of the article. In class discussion, you may be asked to summarize the reading and to begin the discussion on problems and improvements. Term Paper --> There is a term paper, due on the last day of class, with a preliminary draft due approximately one month before. This paper will be a large version of the short papers. In it, you need to: 1) choose a limited area of research that interests you; 2) identify some empirical studies that have been done on that topic, using contrasting methodological approaches; 3) evaluate these studies and their methodologies, discussing the strong and weak points of each approach, and linking these to the theory being tested; and 4) propose a theory, a research design, and a set of measurements that would be the best possible way to answer your question. You should go into detail on the proposed theory, the research design, measurements, availability of evidence, and any other important points. The topic may be anything from political science that interests you (you may want to choose a topic that interests you enough to follow up on, for example in your other statistics, methods, or substantive courses this or next semester). The literature review does not have to be all-inclusive; rather the important point is that it include examples of different approaches (case study, longitudinal design, cross-sectional comparison, experimental study, for example), so that you can discuss the strong and weak points of each approach. Your discussion of the literature should show what problems have plagued researchers in the past, and your proposal obviously should do away with those problems. You should be able to do this in about 25 pages or so. Assessment --> 40% Total combined for short papers 40% Term paper 20% Class participation Course Outline --> PART ONE: Introduction and Review 1. The Scientific Approach. The importance of being wrong; the nature of scientific explanation; the nature of evidence; what is convincing to a scientist; how evidence accumulates; what is “proof.” We will return to some of the philosophical questions of this approach during the last week of the term. For now, the focus will be on developing a shared vocabulary and an understanding of the process. Note how these ideas apply to quantitative and to qualitative research projects. Nachmias, Ch. 1-4. KKV Ch. 1-3. Stinchcombe, Arthur L. 1968. Constructing Social Theories. Chicago: University of Chicago Press, 1968. Ch. 2: The Logic Of Scientific Inference Pp. 15-56. 2. Review of statistical concepts and terminology Topics to review include: measures of central tendency and of dispersion; Z-scores; bivariate measures of association. We will go into some detail about Proportional Reduction in Error, a concept that comes up again and again during the term. We will return constantly to questions of covariance throughout the term, so you need a good understanding of both the underlying statistics and the conceptual ideas behind them. Finally, we will discuss some basics of sampling vocabulary including the concept of “statistical significance.” Obviously, all this material cannot be covered in a single discussion, so emphasis here will be on creating a list of things you should already know or pick up during the term. Nachmias, Ch. 15, 16, and skim ch. 17. King, Gary. 1989. Unifying Political Methodology. New York: Cambridge University Press. Chapter 1: Introduction. PART TWO: Research Design Questions 1. Experiments and Quasi-experimental designs. This week focuses on designing a research project so that covariance, time-order, and spuriousness can be controlled or demonstrated. Time-series, cross-sectional designs, experimental designs, and a wide variety of other techniques are described. Note especially the numerous generic threats to validity that Campbell and Stanley lay out. KKV explain how these relate to qualitative as well as to quantitative designs. Nachmias makes it easier to understand. Nachmias, Ch. 5, 6. KKV Ch. 4-6. Campbell, Donald T. and Julian C. Stanley. 1963. Experimental and Quasi-Experimental Designs for Research. Chicago: Rand McNally. 2. Quasi-experiments and other examples from the literature. Consider the strength of these designs, and discuss whether the authors could have reached similar conclusions if they had chosen different designs. Will incorporate various journal articles as applications 3. Game Theoretical Approaches. Gates and Humes provide an overview and some detailed examples of the uses of game theory in political science Gates, Scott and Brian D. Humes. 1997. Games, Information, and Politics: Applying Game Theoretic Models to Political Science. Ann Arbor: University of Michigan Press. PART THREE: Measurement Issues 1. Measurement terminology; tests for reliability and validity; basics of designing good measures that tap the concepts they are supposed to tap; how to recognize measures that do not measure what they say they measure; systematic versus random measurement error and their consequences; building indices combining multiple measures into a single scale. Nachmias, Ch. 7, 11, 12, 18, skim ch. 9 2. Sampling; Survey design. Many measurement issues are here, specific to surveys this week, but also apparent in other types of research. Also sampling procedures and the importance of sampling error as opposed to other types of error in most work that involves sampling, such as surveys. Note the differences and similarities between mass surveys, elite surveys, and mail questionnaires, and pay attention to how one creates a sampling frame and ensures a high response rate. Nachmias, Ch. 8, 10 Will also apply chosen journal articles 3. Cross-Level Inferences, Ecological Analysis; summary and review of material covered so far. Robinson, W. S. 1950. Ecological Correlations and the Behavior of Individuals. American Sociological Review 15: 351-7. Naroll, Raoul. 1973. Galton’s Problem. In: A Handbook of Methods in Cultural Anthropology. New York: Columbia University Press, pp. 974-89. Achen, Christopher H. and W. Phillips Shively. 1995. Cross-Level Inference. Chicago: University of Chicago Press. Chapter 1: Cross-Level Inference. King, Gary. 1997. A Solution to the Ecological Inference Problem. (Princeton: Princeton University Press), chapter 1, “Qualitative Overview.” PART FOUR: Evaluating Prominent Research Projects Applying the various critical skills you’ve acquired to evaluating a series of prominent and influential works in the literature. Your papers and class discussion will focus on exactly what the authors did, how they designed their project, how they measured relevant variables, how they considered rival hypotheses as well as their own, how they gathered their data, and all other elements of the research project. In addition to pointing out the consequences of the choices that scholars made, in each paper you should suggest alternative ways to design a research project on the same topic and discuss the relative merits of the various approaches. 1. Experiments in political science Will apply chosen articles and literature PART FIVE: Paradigms, Approaches, and Professional Controversies 1. Kuhn’s theory of the nature of scientific progress; some current disputes in the discipline. Kuhn, Thomas S. 1970. The Structure of Scientific Revolutions. Chicago: University of Chicago Press. Ch. 1,2,6,7,9. Almond Gabriel A. and Stephen J. Genco. 1977. Clouds, Clocks, and the Study of Politics. World Politics 29 (4): 489-522 Prerequisites: Advance Writing for Political Science; Analysis Tools in Political Theory; Quantitative Analysis in Political Studies I & II; Senior Standing FOR ACTIVITIES IN THE “SUMMER” AND WINTER” SESSIONS ALL PARTICIPATING STUDENTS, ASSISTING/ADVISING INSTRUCTORS AND PROFESSORS MUST BE OFFICIALLY RECOGNISED; REQUIRES BOTH CIVILIAN ID AND STUDENT/FACULTY ID FOR CONFIRMATION OF INDIVIDUAL. THERE WILL ALSO BE USE OF IDENTIFICATIONS FOR ACTIVITIES FOR RESPECTIVE SESSION. SECURITY AND NON-PARTICIPATING ADMINISTRATION WILL ONLY IDENTIFY RESPECTIVE ACTIVITY BY IDENTIFICATION CODE. SECURITY AND NON-PARTICIPATING ADMINISTRATION MUST NEVER KNOW WHAT ACTIVITIES IDENTIFICATION CODES IDENTIFY: < Alpha, Alpha, Alpha, Alpha > - < # # # # # > - < session > - < yyyy > Such activities will also warrant criminal background check (CBC) in order to participate. Severely threshold may vary depending on administration. Administrators will provide dated letters of confirmation of thorough CBC to student affairs and other appropriate administration. Such also may include screening that’s parallel to customs & immigration processing where certain levels of criminal history warrants rejection. Email and physical letters with data. Such CBC protocol will not explicitly identify any particular titles or descriptions of any activity, rather, will only convey code as above. Activities repeated can be added to transcripts upon successful completion. Repeated activities later on can be given a designation such as Advance “Name” I, Advance “Name” II. As well, particular repeated activities serve to towards developing true comprehension, competency and professionalism. Activities will be field classified. Secured Archives. It may be the case some activities can be grouped and given a major title together; however, detailed descriptions will be required. Policy Analysis Open to PS and PA students Advance treatment of the skills and tools from the following courses: Phase 1- Public Policy Formulation & Implementation (check PA) Phase 2- Public Policy Analysis (check PS) Observation and analysis of politics venues Activity serves both Political science and Public Administration students. Note: open to both PS and PA students Analysis of resonating political ideologies, conjectures, hypotheses and legality based on conflict, law and rulings with governance. To attend/observe negotiations, conferencing, public hearings, town hall meetings, political debates, executive branch public correspondences, congressional public correspondences, judicial committee hearings and so forth. Concerns local, national and international events. For certain venues above one must understand that they may neither be able to attend nor observe directly such venues. Rather, acquisition of intelligence: data, literature, media. Pre stages and post stages intelligence. Nevertheless, attending venues will still be pursued granted that scheduling and travel logistics are pleasant and economical. For public administration constituents such commerce allows for a direct observation and assessment of the projection of tones and policy of various political and public administrative elements. Note: activity is in no way partisan sponsored nor influenced. FIELD POSSIBILITIES: A. Political calendar, updates on contested seats, nominations (legislative, executive and judicial) B. Diplomatic polices or executive orders or policies in function with government constituents or representatives. Consider various levels in bureaucracy C. Political current events D. Security/emergency management and decision making E. Bills introduced or ratified F. Public Advocacy entities G. International diplomacy concerning protocols, agreements, etc. Key subjects will be identified with the relevant gov’t agencies, commissions, etc. ASSUMPTIONS Preparatory Prepare questioning and possible themes to encounter Atmosphere As well, arising themes from respective conflict and/or parley. Significant entities in dialogues/conveyances may need to be cited. Arising questions based on dialogue and tones. All questions should be preserved whether answered or not. Note taking or recording Developments must be preserved, archived. Such serves towards recollection, future investigations, cross referencing, etc. Legal grounds: analysis of credibility/validity of major forces concerning respective interests. Professional literature, government resources and data will naturally apply. ELEMENTS EXPECTED THROUGHOUT: 1. Fact checking 2. Use of data when required (includes data validation/accuracy) 3. Comprehension and legal justification of arguments/positions 4. Cost benefit analysis, impact evaluation and environmental impacts Case of competing ideas/proposals Case of implemented policies 5. Bureaucratic Record, Literature, Tools and Data (when relevant) Constitutional, legislative, executive (leadership, offices, branches), judicial, IGOs Municipal, Provincial, Autonomy, National, etc. 6. Citations and references --Phases of commerce engagement SUBJUGATED BY “ASSUMPTIONS” and "ELEMENTS EXPECTED THROUGHOUT” (1) First phase Conflicts and settings. Students must identify the conflict timeline, agents and LEGITIMATE stakeholders. Agencies and stakeholders relations Relevance and self-interests, respectively; possible instruments to deter moral hazard (2) Second phase I. Setting The policy or position(s) or stance(s) of a respective sovereignty or unique governance or entity/agent or among the different legitimate stakeholders must be analysed; followed by programme theory (if practical). Students must establish all the considerable historical factors and stimuli leading to the issues at hand. Students must identify the possible (or observed) social, economic and political ramifications (for policy, position, stance or choice); there may be counterfactuals for each ramification. II. Decision Theory Spector, B. I. Chapter 3. Decision Theory: Diagnosing Strategic Alternatives and Outcome Trade-Offs. pp 73 – 94. In: Zartman, I. W. (Editor). 1994. International Multilateral Negotiation – Approaches to the Management of Complexity. Jossey – Bass, Inc. III. Negotiation Models Druckman D. (2007) Negotiation Models and Applications. In: Avenhaus R. and Zartman I. W. (eds) Diplomacy Games. Springer, Berlin, Heidelberg IV. The prior two literature to be applied Note: data will be invaluable to apply structuring/models, and to make sense of options, positions and probabilities. Components for such tasks are: V. Unanswered questions (self-generated or acquired) (3) Third Phase Clean-up or further necessities or interests. There may be counter-policies or counter resolutions that exist; may follow the same total process from beginning to end. Political Environment PART A Quality in Public Opinion Research Will frame constructive and field applicable questions based on current welfare. Will have some field test activity that will not be compromised by pre-exposure of pursuits. Objectives of the research --> Design the survey instrument to the identified objectives Design your sample to reach the right audience to meet your objectives Train your interviewers to collect data in a manner that reduces error Monitor data as it is being collected to find any inconsistencies and to make ensure your data is representative of the area you are surveying. PART B (subjugated by part A) The goal is to extract the logistical and operational essentials out of Chapters 2 – 5 rather than heavy devotion to the text: Russell G. Brooker and Todd Schaefer (2005), Public Opinion in the 21st: Let the People Speak? Cengage Learning Determining strength of methods with respect to geographical scale or political boundary and cost PART C The following article can serve as a strong structure towards field research concerning ideological scaling. Recognising that the range in political ideologies often can be represented geo-spatially, it may be logical to segment survey field into provincial or district or city boundaries. It’s important that students know how to determine what is a good sample and how well geo-spatially distributed their surveys are Everett J. A. (2013). The 12 Item Social and Economic Conservatism Scale (SECS). PloS one, 8 (12), e82131 Note: the following literature can be applied to expand on activity implemented from above literature to analyse possible data fabrication by (outside) data collectors, or whether responses in environments are rigged to convey false narratives. Hernandez I, Ristow T, Hauenstein M. (2021). Curbing Curbstoning: Distributional Methods to Detect Survey Data Fabrication by Third-Parties. Psychol Methods. 2021 Aug 26. PART D Then for a respective province or district or city, students must identify the congressional and executive representations. Extensive voting record related/connected to the 12-14 items from part C. Are the conclusions from part C consistent with elected officials’ records AND rhetoric (commerce)? PART E Additionally, for each region or spatial field pursue measures such as average income, median income, upper income brackets and lower income brackets. Ethnicity, etc., etc. Other demography. Analysis PART F Do conclusions or findings among (A) to (E) “add up” with each other? PART G Analyse and replicate with other interest groups: Finger, Leslie. K. (2018). Interest Group Influence and the Two Faces of Power. American Politics Research, volume 47 (4), pages 852–886. PART H Analyse the following, then adjust to region or sovereignty of interest. Pursue the research development. What is the third overarching research question? Lorenzo De Sio & Romain Lachat (2020) Making Sense of Party Strategy Innovation: Challenge to Ideology and Conflict-Mobilisation as Dimensions of Party Competition, West European Politics, 43:3, 688-719 Criteria Budget Planning Note: open to PS and PA --Delphi Method --Simalto can be applied to predicting which of the alternative combinations of optional service benefits provided by a local authority, state or national government in their annual budget would meet with the ‘maximum’ approval of a target population. --PESTEL & SWOT (with templates) --Develop Analytical Hierarch Process (AHP) R packages exist for AHP Feasibility Studies Research Open to PS, PA, RM, ECON, FIN and OM/AOR students Behrens, W., & Hawranek, P. (1991). Manual for the Preparation of Industrial Feasibility Studies. United Nations Industrial Development Organization Brockhouse, J. W. and Wadsworth, J. J. (2016). Vital Steps: A Cooperative Feasibilty Study Guide. USDA, Rural Development Service Report 58 Quantitative Analysis for Elections Note: this activity can be of great service to Political Science and Public Administration students. Past and possibly current empirical data and observation of accuracy in prediction for past elections. Adjust to ambiance of interest (i). Identifying Likely Voters Murray, G. R., Riley, C. and Scime, A., Pre-Election Polling: Identifying Likely Voters Using Iterative Expert Data Mining, Public Opinion Quarterly, Vol. 73, No. 1, Spring 2009, pp. 159–171 (ii). Targeting Voters Rusch, T., Lee, I., Hornik, K., Jank, W., & Zeileis, A. (2013). Influencing Elections with Statistics: Targeting Voters with Logistic Regression Trees. The Annals of Applied Statistics, 7(3), 1612–1639. (iii). Election Forecasting Abramowitz, A. I. (2008). It's about time: Forecasting the 2008 Presidential Election with the Time-for-Change Model, International Journal of Forecasting 24, 209–217. Campbell, J. E., (1996). Polls and Votes: The Trial-Heat Presidential Election Forecasting Model, Certainty, and Political Campaigns." American Politics Quarterly 24, 4: 408-34 Berg, Nelson, and Rietz. (2008). Prediction Market Accuracy in the Long Run. International Journal of Forecasting 24, 2 (2008): 285-300. Web. Bayesian Rigdon, S. E. et al (2009). A Bayesian Prediction Model for the U.S. Presidential Election. American Politics Research Volume 37 Number 4, pages 700-724 Rigdon, S. E. et al (2010). An Analysis of Daily Predictions for the 2008 United States Presidential Election. CS-BIGS 4(1): 1-8 (iv). Election Irregularities and Vote Rigging Klimek, P., Yegorov, Y., Hanel, R., & Thurner, S. (2012). Statistical Detection of Systematic Election Irregularities. Proceedings of the National Academy of Sciences of the United States of America, 109(41), 16469–16473. Jiménez, R., & Hidalgo, M. (2014). Forensic Analysis of Venezuelan Elections During the Chávez presidency. PloS one, 9(6), e100884. Jimenez, R., Hidalgo, M., & Klimek, P. (2017). Testing for Voter Rigging in Small Polling Stations. Science Advances, 3(6), e1602363. doi:10.1126/sciadv.1602363 Klimek, P., Jiménez, R., Hidalgo, M., Hinteregger, A., & Thurner, S. (2018). Forensic Analysis of Turkish Elections in 2017-2018. PloS one, 13(10), e0204975. Newcomb-Benford Law and Zipf’s Law Political Redistricting Note: open to both PS and PA students Lines that determine congressional, state legislature, and local government districts are redrawn based on census data for every specified number of years. It's a highly influential process because it tremendously affects who can and will be elected to represent citizens on the local, state, and federal levels. Yearly, the geographic distribution of people changes. Hence, it’s often necessary to redraw districts to accommodate such changes. The redistricting process becomes more tedious because governments must balance competing considerations when redrawing boundary lines each decade. Congressional and provincial legislature districts must have equal population to comply with the judicial system “one man, one vote” rulings. Since the process is based on who lives where, it’s an intrinsically geographic one that requires the integration of many factors. Will pursue development of unprecedented access to the redistricting process. This capability can provide complete government transparency. The effects of boundary changes on associated populations can be tested interactively and worked on collaboratively. To develop reliable current-year estimates and five-year projected population figures, so entities don’t have to wait until the census authority delivers demographic data to provinces. Concerns data to better understand the trends and factors at work in a region, assess redistricting scenarios, and build consensus. Once district boundaries are finalized, the demographic data used for this process remains valuable and can be used to improve election management. 1. Identify the agendas, proper causes and interests involved in political redistricting. Exposure to mechanisms for political redistricting. 2. Skills of introspecting and querying data of interest, where such data concerns development in data analysis and geospatial analysis. 3. The following can be applied to multiple phases of activity: https://gerrymander.princeton.edu/redistricting-report-card-methodology Namely, for both development and analysis of past cases. 4. Methods, exhibitions and simulations (in R) Global Spatial Autocorrelation Local Spatial Autocorrelation Voronoi diagrams of equitable weighting and distribution K-means clustering The following journal article can be computationally developed towards measurement of compactness of political districting plans (and also compared with compactness measures in 3): Fryer, R., & Holden, R. (2011). Measuring the Compactness of Political Districting Plans. Journal of Law and Economics, 54(3), 493-535; likely there may be alternative/comparable journal articles. Then, one can apply the R package called “redist”. The package allows for the implementation of various constraints in the redistricting process such as geographic compactness and population parity requirements. The package implements methods that are described in the following article: Fifield, Higgins, Imai and Tarr (2016). “A New Automated Redistricting Simulator Using Markov Chain Monte Carlo”. Working paper available: https://imai.fas.harvard.edu/research/files/redist.pdf 5. Use of Geographical Information Systems (GIS) in political redistricting Crespin, M. H. (2005). Using Geographic Information Systems to Measure District Change, 2000–2002. Political Analysis, 13(3), 253–260 6. Chen, J., & Cottrell, D. (2016). Evaluating Partisan Gains from Congressional Gerrymandering: Using Computer Simulations to Estimate the Effect of Gerrymandering in the U.S. House. Electoral Studies, 44(C), 329-340. Political Campaigning O'Day, B. (2003). Political Campaign Planning Manual: A Step by Step Guide to Winning Elections. National Democratic Institute Goal is to situate upcoming or ongoing political competition on calendar. Taking an approach without identifying favouritism or preference to candidates. Namely, you as a political scientist. Will be heavily data oriented, also with some expected use of GIS; some “marketing” skills will be applied to develop “political campaigning products” or “sound marketing” for respective combatants based on “segmentation issues” that aren’t overwhelmingly toxic to strong mass support. Your development can be used to critique political campaigns and/or impartial augmentations/corrections can be applied with updates. Situate appropriately: major disparities and competing issues among candidates and support; resonating and developing. Fact checking, intelligence, emotional manoeuvrability and ideological mapping are concerns as well. Campaign Mobilisation Given journal articles can serve as separate research guides. However, the ambiance of interest and the associated data will be the substitute. Quite old data may not available, but overall, to make comparative assessments among the different campaign seasons. R + RStudio environment Holbrook, T. M. and McClurg, S. D. The Mobilization of Core Supporters: Campaigns, Turnout, and Electoral Composition in United States Presidential Elections. American Journal of Political Science, Vol. 49, No. 4, October 2005, Pp. 689-703 Middleton, J. A. and Green, D. P. (2008). Do Community-Based Voter Mobilization Campaigns Work Even in Battleground States? Evaluating the Effectiveness of MoveOn’s 2004 Outreach Campaign. Quarterly Journal of Political Science, 3: 63–82 Probit and Logit Models in Political Science Probit and logit models with fluidity and tangibility, and proper usage with data; data may need probing, structuring, cleaning, etc. Adjust to ambiances of interest. Will make use of the R + RStudio environment. --Francis, J., & Payne, C. (1977). The Use of the Logistic Model In Political Science: British Elections, 1964-1970. Political Methodology, 4(3), 233-270. --Alvarez, R. M. and Nagler, J. (1998). When Politics and Models Collide: Estimating Models of Multiparty Elections. American Journal of Political Science, Vol. 42, No. 1, pp. 55-96 --Miwa, Hirofumi. (2016). Partial Observability Probit Models and Its Extension in Political Science: Modelling Voters' Ideology. The Japanese Journal of Behaviourmetrics. Volume 43 Issue 2, 113-128. --Chen, J., & Cottrell, D. (2016). Evaluating Partisan Gains from Congressional Gerrymandering: Using Computer Simulations to Estimate the Effect of Gerrymandering in the U.S. House. Electoral Studies, 44(C), 329-340. --Bailey, Michael, and Chang, Kelly H. 2001. “Comparing Presidents, Senators, and Justices: Interinstitutional Preference Estimation.” Journal of Law, Economics, & Organization 17:477–506. Note: other articles of interest as well. Statistical Analysis of the Legislature & Bill Journey Open to PS and PA Note: will be done at the federal level, provincial level and city level. Note: preference is development in the R environment when computation and simulation are required. PART A 3-4 bills may be pursued 1. Review of the bill process 2. Tools or systems used to track legislation. Hands-on activities. 3. Reviewing Bill Analysis. 4. Programme Theory 5. Further analyses for bill(s) in question: -Any bill needs a major supporter in each house of Congress. Gaining the attention of the relevant committee (member(s) or chairperson) -Easing the concerns of outside groups. Possible bill(s) amendments -Allies in the federal bureaucracy -Cost estimation data. Means to pay for bill(s) -Non-monetised impacts on stakeholders from bill(s) -Gauging the proportion of the house(s) with adamant opposition PART B Note: will be done at the federal level, provincial level and city level. -NOMINATE (scaling method) Poole, Keith T.; Rosenthal, Howard (1985). A Spatial Analysis for Legislative Role Call. Analysis. American journal of Political Science, 29(2): 357–384. -Extend to W-NOMINATE and DW-NOMINATE as well. -For one’s ambiance will apply similar structures as the following: https://www.govtrack.us/about/analysis#overview -Moore tools: Jackman, S. (2001). Multidimensional Analysis of Roll Call Data via Bayesian Simulation: Identification, Estimation, Inference, and Model Checking. Political Analysis, 9(3), 227-241 Clinton, J., Jackman, S., & River, D. (2004). The Statistical Analysis of Roll Call Data. American Political Science Review, 98(2), 355-370. Shor, B., Berry, C., & McCarty, N. (2010). A Bridge to Somewhere: Mapping State and Congressional Ideology on a Cross-institutional Common Space. Legislative Studies Quarterly, 35(3), 417–448 -Bipartisan Index (pursue development) The Lugar Center-McCourt School Bipartisan Index: https://www.thelugarcenter.org/ourwork-Bipartisan-Index.html Political Instability Note: open to both PS and PA students Will make use of the given articles comparatively towards analysis and measures of political instability. Will also incorporate modern data. Duff, E. & McCamant, J. (1968). Measuring Social and Political Requirements for System Stability in Latin America. The American Political Science Review, 62(4), 1125-1143 Linehan, W. (1976). Models For the Measurement of Political Instability, Political Methodology, 3(4), 441-486. Ari Aisen and Francisco Jose Veiga (2011). How Does Political Instability Affect Economic Growth? IMF Working Paper WP/11/12 Advocacy Lab Open to PS and PA students Immersion into theory and practice of the concepts and tools of advocacy and will work with those in the field to apply our learning. We will team with different/multiple advocacy organisations, NGOs, NPOs, etc. to advocate for a range of supportive measures and actions to help address a number of issues. Advocacy campaign can vary for each year. Gain hands-on experience in taking on a social justice issue towards change. The following may be applicable for relatable elements Public Engagement Guide. Newfoundland & Labrador, Office of Public Engagement: https://www.gov.nl.ca/pep/files/Public-Engagement-Guide.pdf NOTE: much responsibilities and tasks with data and writing. Establishing as a credible sources of information and/or ethically linking to credible sources for information. Goals & Outcomes in a chosen sequential manner that’s constructive and sustainable; otherwise some things may reverberate on multiple occasions --> 1. Detailed analysis and structuring of issues recognised. Programme Theory for measures and actions for issues recognised. 2. Analysis of the structure and possible effects of measures and actions Identify key stakeholders and interest groups for measures and actions. Identify the range of possible outcomes for stakeholders and interest groups. Policy impact assessment. Monetised costs and benefits. Non-monetised impacts. 3. Apply analytical methods to understand the dimensions of power and decision-making at the community, state, and national levels; market makeup 4. Consider how changes in civic engagement and voluntary associations impact community organizing and grassroots mobilization. Determine how to identify and engage community members and organizations that will get involved in an advocacy campaign and how to support their participation in decision-making processes and coalition building. 5. Position one’s own public service interests within a larger public service landscape. Principal-Agency dilemma (personal, stakeholders and other elements). 6. Develop strategies to enhance social and economic justice within organizational and political systems especially as they affect specific demographics, as well as strategies to address social class 7. Identify professional values and ethical positions within, as well as between systems, which may appear to be incompatible with political roles and strategies and develop skills to bridge these incompatibilities to affect change 8. Generate policy alternatives and differentiate among them, including assessing their feasibility and consequences 9. Identify and utilize methods and skills, which develop and sustain interorganizational networks 10. Demonstrate advocacy skills, such as testifying, lobbying, and providing staff support for public interest, constituency and/or grassroots community groups; Identify institutional and community practices that disempower, and develop strategies to challenge them 11. Demonstrate how to share empowerment theory and practice with constituencies who are unfamiliar or inclined to oppose such 12. Issues with intellectual property: credits, development rights, literature development, operations management. Media. Public administration record archives. 13. Continue the development, credibility and sustainability of the professional use-of-self. Linkages between public sector and private sector Open to PS and PA. Will have field studies. Note: Cost-Benefit Analysis and SROI to also be incorporated. Model Articles: Grossman, S. A. (2012). The Management and Measurement of Public-Private Partnerships: Toward an Integral and Balanced Approach. Public Performance & Management Review, 35(4), 595–616. Koontz, Tom & Thomas, Craig. (2012). Measuring the Performance of Public-Private Partnerships: A Systematic Method for Distinguishing Outputs from Outcomes. Public Performance & Management Review. 35(4). 769-786. Judicial Educational Activities Ambiance counterparts to the following: 1.The Supreme Court for Educators -> https://www.thirteen.org/wnet/supremecourt/educators/lp4b.html Note: at least 3-5 cases should be considered to develop skills and competence. 2.United States Courts Education Activities -> https://www.uscourts.gov/about-federal-courts/educational-resources/educational-activities NOTE: trial court pursuits and civil litigation pursuits are also possible as well. Judicial ideology measures For ambiance of interest will pursue research and development for federal supreme and lower courts with the following: Segal-Cover Score Judicial Common Space Martin-Quinn Score Note: the R environment will be employed when times arise for advance computation and simulation. Segal–Cover score: Segal, Jeffrey A.; Cover, Albert D. (June 1989). "Ideological Values and the Votes of U.S. Supreme Court Justices". The American Political Science Review. 83 (2): 557–565 Segal, Jeffrey A.; Epstein, Lee; Cameron, Charles M.; Spaeth, Harold J. (August 1995). "Ideological Values and the Votes of U.S. Supreme Court Justices Revisited". The Journal of Politics. 57 (03): 812–82 Judicial Common Space (JCS): Lee Epstein, Andrew D. Martin, Jeffrey A. Segal, Chad Westerland, The Judicial Common Space, The Journal of Law, Economics, and Organization, Volume 23, Issue 2, June 2007, Pages 303–32 Martin-Quinn score: Martin, Andrew D.; Quinn, Kevin M. (2002). Dynamic Ideal Point Estimation via Markov Chain Monte Carlo for the U.S. Supreme Court, 1953-1999. Political Analysis. 10 (2): 134–153 Spruk, Rok; Kovac, Mitja (2019). Replicating and Extending Martin-Quinn Scores. International Review of Law and Economics. 60: 105861 Health Decision Sciences with R activity (check Actuarial post) Open to Economics AND Public Administration students Advance Impact Evaluation Practice Gertler, P. et al (2016). Impact Evaluation in Practice: Second Practice, World Bank Publications Note: much field studies. Open to PS and PA students.
# PUBLIC ADMINISTRATION The degree is called Public Administration, not Urban Planning. Note: a Public Administration degree is not, and will never, be a substitute for an Economics degree. Note: It’s recommended that students have advance placement and/or plan to take general education appeasement courses in the “winter” or “summer” sessions. Mandatory Curriculum makeup: 1. Integrating tools -- Enterprise Data Analysis I & II (check FIN); International Financial Statements Analysis I & II (check FIN); Calculus for Business & Economics I & II; Introduction to Computational Statistics for Political Studies (check PS) 2. Economics Accountability -- Introduction to Macroeconomics, Macroeconomic Accounting Statistics 3. Governance (all three listed in PS) -- Constitutional Law, Executive Process, Public Policy 4. PA Writing Mandatory -- Public Administration Writing I-II 5. PA Professional Development Mandatory (all listed courses) PA Management -- Comparative PA; Public Personnel Administration; Public Project Management; Public Policy Formulation & Implementation; Non-Profit & Public Organisations Management PA Finance -- Financial Management for Non-Profit Organisations; Fiscal Administration; Government Accounting Quantitative Analysis -- Quantitative Analysis in Political Studies I-II (check PS); Survey Research (check PS); Research Methods in Political Studies Research & Response -- Crisis Management; Research in Crisis & Crisis Mitigation; Programme Evaluation I-II Comparative PA This course provides a comparative analysis of public administration systems across different countries. It explores the structures, functions, and processes of public administration within various political, social, and economic contexts. The course aims to develop an understanding of how different governance systems impact the implementation and effectiveness of public policies. Course Objectives: Understand the foundational theories and concepts in comparative public administration. Analyse the similarities and differences in administrative systems across countries. Examine the impact of political, cultural, and economic factors on public administration. Critically assess public management reforms in different countries. Develop the ability to apply comparative methods to analyze public administration issues. RESOURCES: Websites for the respective ambiance Office of Management and Budget of the respective ambiance; Civil Service; Statistics Other gov’t departments and agencies IGOS (UN bodies and agencies), UNCTAD, OECD, EU Scholarly Journals COURSE ASSESSMENT --> Attendance/Participation Labs Attendance/Participation Midterm Final Exam Research Paper COURSE STRUCTURE --> Introduction to Comparative Public Administration Course Overview and Introduction to Comparative Public Administration Theories and Approaches to Comparative Public Administration Rational Choice Theory Institutionalism Cultural Theory System Theory Federal vs. Unitary Systems of Government Parliamentary vs. Presidential Systems Role of Bureaucracy in Different Political Systems Case Study 1: Public Administration in the USA vs. the U.K. (nor AUS or NZ or CAN) Public Management and Policy Implementation Comparative Public Policy Analysis Public Sector Reforms and New Public Management (NPM) E-Government and Digital Governance Across Countries Case Study 2: Public Sector Reforms in Nordic Countries vs. Developing Countries Contemporary Issues in Comparative Public Administration Globalization and Its Impact on Public Administration Public Administration in Crisis Situations (e.g., pandemics, financial crises) Public-Private Partnerships (PPPs) in Different Countries Environmental Governance and Sustainable Development Course Review and Final Exam Preparation LABS --> Time periods dedicated to comprehension, logistics and implementation of methodology for research paper; multiple types of evaluation design to be treated. RESEARCH PAPER Abstract Introduction (background, research questions, objects) Literature Review (theories of public administration, comparative public administration, impact evaluation methods) Methodology (evaluation design; data collection; comparative analysis of the approach of the chosen country or province with other countries or provinces that have implemented similar transitions, policies or programmes) Case Study: Ambiance and its transition/policy/programme; role of public administration (how federal, state, and local governments have coordinated to implement, including challenges faced); Public Participation and Governance (examination of the role of public engagement and governance structures in facilitating or hindering success). Impact Evaluation Economic Impact: Assessment of the economic costs and benefits of policy/programme/transition, including its effects (household level, prices, taxation, employment, social welfare, prices, economic industries or sectors, overall economic growth, etc., etc., etc.). Environmental Impact Social Impact: Analysis of how programme has affected German society, particularly in terms of public support, energy security, and equity. Comparative Analysis Comparison with Other Countries: Examination of similar energy transition policies in countries like Denmark and the UK, highlighting differences in public administration approaches and outcomes. Lessons Learned: Identification of best practices and lessons that can be applied to other contexts or future policies. Discussion Challenges in Implementation: Critical analysis of the challenges country/province faced in implementation, including administrative, financial, and social obstacles. Success Factors: Identification of the factors that contributed to the success of certain aspects of the reform. Implications for Public Administration: Discussion of what ambiance’s experience with programme reveals about the role of public administration in large-scale policy implementation. Conclusion Summary of Findings: Recap of the key findings from the impact evaluation and comparative analysis. Policy Recommendations: Suggestions for improving the implementation of similar policies in ambiance and other places. Future Research: Identification of areas for further research, particularly in the context of evolving policies and public administration for the particular subject. References (APA, Chicago, etc., etc) Appendices (Additional data, charts, or documents that support the analysis but are too detailed for the main body of the paper. Prereqs: Intro to Computational Statistics for Political Studies (check PS)
Public Personnel Administration Course provides an overview of the context in which public personnel management is administered, with exploration of core functions and activities. NOTE: satisfies social/society requirement Grading --> Quizzes (determined topics) Group Projects Payroll Simulation Framework, Logistics & Implementation Work Force Planning Term Project Payroll Simulation Framework, Logistics & Implementation --> Student groups will be assigned 2 ministries of public administration (system wide or branch) to simulate payrolls for the staff spectrum. Much research will be required. Emphasis on framework or model, logistics and implementation with a tool. Note: student groups are required to have active demonstrations of particular components with modelling and development during presentation; each member will have a turn. Work Force Planning Term Project --> PART A (Needs Assessment versus PESTEL/SWOT) To develop needs assessment, then PESTEL/SWOT; disparities versus compatibility. PART B Based on part A to apply the given guides to workforce planning; groups will be assigned an element of the public sector to apply the following guide to workforce planning: < https://hr.nih.gov/workforce/workforce-planning/getting-started > < https://hr.nih.gov/workforce/workforce-planning > Course Outline --> Note: order of modules given may change. --Introduction to Public Personnel Management --Core Values of the Civil/Public Service Civil/Public Service Merit Systems and their preservation; identifying comparable legislative amendments for different ambiances; civil/public service versus merit system Spoils system and its legal limit; identify court case(s) about political parties versus entities concerning the spoils system. --Law of Public Personnel Management Identification of constitution structure and crucial modern reforms Observation of any possible legal variances (or politics) sub-nationally --Fostering Inclusiveness and Confronting Discrimination Are there discrepancies between a merit system and equal opportunity? Despite neglecting disallowing declaration of race and sex, what parts of the recruiting process are likely to create discriminatory practices? Role of diversity among recruitment personnel, and at what level of government intervention does such diversification become considerably active. Desired credentials versus auditioning or trial runs; cost effectiveness versus assurance. --Labour Relations Labour enforcement protocols. Who makes higher enforcement a higher interest, employees or administration? Initiators or stimuli for negotiation of labour rights and entitlement. Rights and limitations of unions. Is it often more of a provincial or a national issue? What circumstances lead to a national issue? When is a strike illegal? Collective bargaining. Are there statistical or data observations that hint of possible future labour disputes? Group Project: Collective Bargaining Agreements & Pension Planning (provincial, national and foreign) A. Labor Unions Means to be legally recognised as labour union. Rules and regulations for administration, operations and promotion systems. Rules of engagement. Collective Bargaining Agreements. Agreement archives in securities exchange or department of labour. Observation of major CBAs to recognise typical model structure, major correlations and disparities. Analysing the presence or influence of unions in the public sector today.Identify major unions (assigned industries and sectors). Employee membership trend. Market share trend. B. Workforce Reduction Note: seek professional guidelines. Identifying the stimuli for such need. How to validate them? What alternatives do you have to downsizing? Credible validating/debunking. What headcount reduction strategies should you adopt? What criteria should be used in selecting employees for a workforce reduction? How to ensure you make fact-based decisions? C. Empirical Studies of Workforce Reduction To pursue matching workforce reduction strategies implemented in the public sector with the following articles. Will be highly data oriented: Cameron, K. S., Freeman, S. J., & Mishra, A. K. (1993). Downsizing and Redesigning Organisations. In G. P. Huber and W H. Glick (Editors), Organisational Change and Redesign. Oxford: Oxford University Press Freeman, S. J., & Cameron, K. S. (1993). Organizational Downsizing: A Convergence and Reorientation Framework. Organization Science, 4, 10-29 Freeman, S. J. (1999). The Gestalt of Organizational Downsizing: Downsizing Strategies as Packages of Change. Human Relations 52, 1505–1541 --Pension Planning For assigned occupations (and unions) to profile instruments’ in pension plans’ characteristics with premiums. What model(s) determine pension income? Income subjugated by earnings after taxes, benefits dues and pension premiums. How does preference in pension deposit size influence taxes? What is best for you based on lifestyle? --Public Pensions Role of retirement boards, means of establishment, structure and roles in the structure. Internal versus external management. Coggburn, J. D. & Reddick, C. G. (2007) Public Pension Management: Issues and Trends, International Journal of Public Administration, 30:10, 995-1020 Funding structure. Rule and models for employer contribution rate. Increasing contribution rates and the potential relief mechanism. Review of annuity benefit model in relation to rules and models for employer contribution rate. Investment management model Survey of public pension funds in the market and means of determining performance. Gov’ts outsourcing pensions to the private sector Objectives. Does the employer need consent from employee or union? Differentiating the risks between public pensions and privatized pensions. --Tax Benefits Structures and instruments. Validating formulas for various scenarios. --Vacation and Leave Days Models and Tables in various industries of public sector/service Comparative assessment among different countries --Other Benefits Healthcare Insurance Tuition Reimbursement Model Student Loan Forgiveness Model --University of Cambridge-Human Resources – Principles of Job Design: https://www.hr.admin.cam.ac.uk/pay-benefits/grading%20-%20faq/grading/principles-job-design Group Project: Job Design Investigation For a prior design in the public sector, apply prior source to investigate and draw conclusion(s) --Recruiting and Testing Research and Development. Guidelines for developing selection criteria. How is selection criteria validated? Selection interview How is testing validated? What foundations make such testing credible? Group Project: Recruiting and Testing: Employment demography. Identify the major tools applied in recruitment and testing for assigned public administration areas. What skills, backgrounds and education do such tools encourage concerning screening? What indicators are there to determine the skills, backgrounds and education required to improve efficiency and quality? Trends in sectors (will be technical measures to research and model). Equal employment opportunity regulations and limitations based on type labour(s). Initiatives for inclusiveness. Note: project will resonate around the above course topics. --Compensation. Rubrics and law (provincial and national) --Strategic Workforce Planning Accountability agencies (national and provincial). Highlighting the principles. Succession planning and management Influence of changing directors Human Capital Benchmark reports Reduction-in-force factors and conducting Technology integration as an animal Workforce planning model (subject to prior topics). May have case studies. What factors are related to bad impressions of the public sector? What sectors of public administration weigh heavily on classification on a country’s development standing? Group Project: Personnel Optimisation Modelling and Personnel Scheduling Technology A. Basic encounter of the mathematics of personnel optimisation/scheduling. Then, students will be assigned 2 public sector facilities/sites. They will research operations obligations, leading to profiling or segmentation w.r.t. to skills, budgets, demand, etc., etc. Such done without consideration of actual realised staff body/scheduling. Will develop optimisation/scheduling models and implement in R. Compare with observed actual realised staffing/scheduling. B. Will have some immersion into personnel scheduling software. May be compared to findings from part (A). Group Project: IT Modernization Plan (city, provincial or national ministries) Information technology is vital to the way an administration serves the public. Applying technology effectively and creatively over the years to better serve the changing needs of the people. Note: groups to be given sets of technologies products concerning a particular sector of non-profits or public administration, to gather intelligence and analyses towards choice selection. A. Empirical Findings: Major investments over a particular designated period, and means to prudently derive the greatest value possible from such technology investments. Identification of disruption to legacy systems, business processes and, ultimately, to the way of labour. Evidence of systems enhancing productivity and yielding numerous efficiencies to the way administration functions. Growing challenges of modernization. Were environmental initiatives a major concern for modernization? Does data verify environment effectives? B. Highlight the following: PESTLET/SWOT concerning technological standing, Modernization Plan, Business Domains, Technical Domains, Intellectual Property, Modernization Cost-Benefits-Avoidance, Executing Modernization Plan. C. Selection Process Steps based on (A) and (B) 1.Discern the various elements and questions related to workplace technology 2.Create a strategy for technology planning 3.Decide on technology plans and how to choose technology. 4. Technology Transition Planning (examples): < https://orta.research.noaa.gov/plans/ > < https://www.tswg.gov/TechnologyTransition.html > Note: must include the following - PESTEL and 5C Analysis implementation for companies and products. Financial analysis for all companies and products, plus applying Beneish, Dechow F, Modified Jones and Altman Z. Cybersecurity scheme subjugating/constraining priors (1)-(4) For the steps (1)-(4) the following literature provides guidance for different industries with technology integration -> Campise, J. A. (1972). Choosing a Computer System for Project Management. Project Management Quarterly, 3(4), 13–16. Quinn, S. D. et al (2018). National Checklist Program for IT Products – Guidelines for Checklist Users and Developers. NIST Special Publication 800-70 Revision 4 Information Technology Investment Management: A Framework for Assessing and Improving Process Maturity. GAO March 2004 Version 1.1 GAO-04-394G National Centre for Education Statistics – Forum Unified Education Technology Suite: https://nces.ed.gov/pubs2005/tech_suite/index.asp Health & Human Service ECLKC: https://eclkc.ohs.acf.hhs.gov/organizational-leadership/article/whats-involved-technology-planning Bhangoo, T. (2020). How To Select The Right Technology Solution: Five Strategies For Leaders, Forbes --Measuring the Performance of Human Resources Management Systems Tools and strategies Problems and prospects HR metrics Group Project: Implementation of HR metrics A. For different occupations or industries in the public sector will pursue implementation of the metrics with trend recognition. Choice of metrics will be AUGMENTED BY the following: Human Capital ROI Will be acquiring various financial statements from both the private sector and public set for determination. Gender Balance of Employment Gender Balance of Management Employee Turnover Rate, Employee Churn Rate Payrolls Retirement Rate Measures Note: for each prior historical performance is important to observe as well. B. To develop for ambiance of concern: Somani, Ravi. (2021). Public-Sector Productivity (Part 1): Why Is It Important and How Can We Measure It? Washington, D.C. World Bank Group From OECD: Lehtoranta, O. and Niemi, M. (1997). Measuring Public Sector Productivity in Finland, Economic Statistics, Statistics Finland, STD/NA(97)15 C. Some public sector elements can be in competition with private sector elements. Salary Competitiveness Ratio Employee Benefits Retention Retirement Rate --Employee Performance Appraisal Rounded guide to employee appraisal Boundaries on conversations with employees --Discipline Guidelines from merit systems Incidents and review of employees in workspace of concern (confidentially) Review of merit systems and legal actions. Prerequisite: Enterprise Data Analysis II, International Financial Statements Analysis II, Upper Level Standing, Department Permission Public Administration Writing I This course aims to enhance the writing skills of students in the field of public administration. It focuses on various types of writing relevant to public administration, including policy briefs, memos, reports, grant proposals, and academic papers. Emphasis will be placed on clarity, conciseness, and coherence, as well as on understanding the audience and purpose of each writing task. Course Objectives: Develop proficiency in different forms of public administration writing. Understand the importance of audience and purpose in writing. Learn to construct clear, concise, and coherent documents. Enhance research and citation skills. Improve editing and proofreading abilities. Not a liberal arts course. Will focus on operational and systematic issues occurring in actual Public Administration. To write about Public Policy one must have experience in it. It’s assumed that students are experienced with writing basic essays from high school, else they would not be here. Typical Texts: Writing Public Policy: A Practical Guide to Communicating in the Policy-Making Process by Catherine F. Smith Swain, J. W. & Swain, K. D. (2014). Effective Writing in the Public Sector, Routledge, 222 pages Resources --> Various literature, guidelines, manual, data, etc., etc. from various elements of the public sector, executive administrations and IGOs. Outside Assignments --> Assignments done outside of class. Such assignments to be done in groups. Assessment --> Discussions/Forums 5% In-class assignments 15% Analyses 40% Done with supporting sources, literature or data. To be mandatory precursor development before actual outside assignments. Issue or conflict, demography, true stakeholders, competing factions with respective policy or view, etc., etc., etc. Each constituent of a group must develop their own analyses to be submitted with consensus assignment; individuality will be checked and will have weight on determination of contribution to group and overall effort by group. NOTE: citations and references implied whenever warranted. Outside Assignments 40% Some outside assignments will have more weight than others. Will be subjugated by analyses done prior. Report Writing, Press Releases, Newsletters, Media Alerts Course Outline --> --Introduction to Public Administration Writing Reading/Assignments --Editing and Proofreading Techniques for effective editing and proofreading Common writing errors and how to avoid them --Fact checking and sources Reading/Assignment Outside Assignment: groups will be assigned documents, social media (provocative may be included naturally); websites (provocative may be included naturally); other literature concerning statements or assertions or claimed data w.r.t. (idea of) sources and references; credentials and backgrounds of individuals/firms, etc., etc. Students will be responsible for critiquing, and to generate counter responses or provide proper structure (framework, model, design, designation, function, etc.) with citations or references. --Writing Policy Briefs Structure and elements Audience and purpose Resources complimenting or supporting policy for the general public. Outside assignment: drafting a policy brief Outside assignment: description of structural function of drafted policy prior; concerns stakeholders’ needs assessment (if relevant), scale (geographical, political, economic), programme theory, intended outcomes, etc.. This special case may be subject to open questions following the possible presentation (by instructors or peers or visiting professors/professionals). --Memos and Emails Disparities between former and latter Effective communication Outside assignment: memo drafting --Reports and Executive Summaries Types of reports in public administration Structure and formatting Outside Assignment: analysis of report and executive summary. Outside Assignment: an example, consider from your institution research done by faculty of the physical sciences, environmental sciences, agriculture, environmental protection, etc. Say, such research to be government funded. To then draft a report. --Grant Proposals Components of a grant proposal Strategies for persuasive writing Outside Assignment: will choose a grant offered by an agency or fund of a public agency, to identify or analyse the incentives to produce honest and quality work or results. Outside Assignment: drafting a grant proposal --Research Papers Academic writing conventions Research methods and citation styles Note: technical papers or working papers may be more in abundance than actual research papers from gov’t agencies (including IGOs). Else you would have to rummage through academic journals for research articles supported by gov’t funds. Outside Assignment: drafting a working paper outline. Develop something in the field you're comfortable or familiar with. Prerequisite: Comparative PA Public Administration Writing II Expect harsher critique and grading. Topics of possible interest: Advanced policy analysis and briefs Advanced data integration, data arrays, charts, graphs, plots and data analysis in reports Policy Writing Regulatory Writing Public Communication and Advocacy Crisis Communication (plans) Grant Proposals and Funding Reports (research records and financial data of departments in your institution may be useful) Prerequisite: Public Administration Writing
Public Project Management Project management concepts and principles, and to engage students with the intricacies and challenge of managing public or private projects with tight schedules and limited resources. Students will also apply relevant tools and techniques and by making extensive use of case studies and simulation exercises to assimilate that knowledge. Students should be able to apply with a reasonable level of confidence the following tools and techniques of effective project management: Objective setting and project design Planning, scheduling, and budgeting Progress control and monitoring Risk assessment and management Project Management KPIs Class sessions will typically consist of lectures, class discussions, case study analysis, and in-class problem solving Course Literature --> Gray, Clifford F. and Erik W. Larson. 2018. Project Management: The Managerial Process.McGraw-Hill Irwin Publishers Assisting Literature --> Edwards, P., Vaz-Serra, P. & Edwards, M. (2019). Managing Project Risk, Wiley A Guide to the Project Management Body of Knowledge (PMBOK Guide) Mandatory Tools --> Microsoft 365 Microsoft Project (or SAP Enterprise Portfolio & Project Management) Resources --> Microsoft tutorials/lab manuals on Microsoft Project Microsoft learning (https://docs.microsoft.com/en-us/learn/browse/) YouTube videos Features --> 1. Case study assignments. Can be done in groups but should be submitted individually in the form of a memo. Guidelines for submitting memos will be provided. Will also incorporate PESTEL and SWOT tasks when appropriate. 2. Take-home assignments involve analysing a large case study and submitting recommendations using a memo format and solving several problems and exercises. May be done in groups. Will also incorporate PESTEL and SWOT tasks when appropriate. 3. Labs will take on development of concepts, structuring, logistics and implementation with project management software. -Structured on operations of the institution, or coordinated participation in the public sector, being low risk with data privacy. Note: choice of operations guaranteed to be completed within 15 - 18 weeks. Guidelines for the groups will be distributed in class. -Students should develop logistical notes -Likely labs will have both Microsoft Excel and Microsoft Project activities. Each lab session will make use of both software. EXCEL ACTIVITIES Creating Gantt Charts Work Breakdown Structure (WBS) Cost estimation templates Critical Path Method (CPM) Creating a risk register in Excel Tracking project progress in Excel Creating quality control charts Stakeholder analysis using Excel Creating a project closure checklist in Excel MS PROJECT ACTIVITIES Creating a project and entering tasks Creating Gantt Charts Allocating resources in Microsoft Project Creating a resource histogram in Microsoft Project Scheduling tasks and managing dependencies in Microsoft Project Identifying the critical path in Microsoft Project Incorporating risk management into Microsoft Project plans Earned Value Management (EVM) Implementing change requests in Microsoft Project Developing a communication plan in Microsoft Project Finalizing a project in Microsoft Project -For each Excel activity above will correspond one or two MS Project activities -Heavy use of documentation and manuals for tools is expected alongside. YouTube videos exist as well. Also, instruction in labs will be recorded for students’ convenience. -Labs will be at least 2-3 hours involving concepts, tasks development and practice; likely to extend with obligative development outside of lab time as well. 4. Practicum for Microsoft Project --> Development in labs will play a pivotal role towards major developments with substance and practicality. 5. Midterm Exam and Final Exam will have multiple components: -Comprehension and intelligence with lecturing and labs (concepts, development, management, etc., etc.). As well, practice problems may come back to haunt. -Developed logistical and lab notes will be vital for the midterm exam and final exam. -On both exams there will also be development tasks with Excel and Microsoft Project based on given data, parameters, etc., etc. Assessment --> Class Participation & Homework Practice Sets Case Studies + 2 Take Home Assignments Labs Practicum sessions for Microsoft Project Mid-term Exam Final Exam Group Presentations PART I -- WEEK 1. Understanding Project Management Chapters 1 and 10 Additional: Youker, R. (1989). Managing the Project Cycle for Time, Cost, and Quality: Lessons from World Bank Experience. Project Management. Vol. 7, no. 1. WEEK 2. Organisation Strategy and Project Selection Chapter 2 WEEK 3. Organisation Structure and Culture; International Projects Chapters 3 and 15 Additional: Project Management Institute. A Guide to the Project Management Body of Knowledge. Chapter 2 (Project Life Cycle and Organization). Youker, R. (1977). Organisational Alternatives for Project Managers. Project Management Quarterly Vol. VIII, no.1 PESTEL Development (external literature and sources for development) Case Studies for chosen entities WEEK 4. Managing Project Teams Chapter 11 Additional: Kerzner, H. Project Management: A Systems Approach to Planning, Scheduling and Controlling. 8th Edition. John Wiley & Sons. 2003, chapter 7 (Conflicts) Verma, V. K. (1996). Human Resource Skills for the Project Manager. The Human Aspects of Project Management. Vol. 2. Project Management Institute. Chapter 3 (Understanding Conflict) PART II -- WEEK 5. Defining the Project Chapter 4 Additional: Crosby, B. L. (1991). Stakeholder Analysis: A Vital Tool for Strategic Managers. Technical Notes. A publication of USAID’s Implementing Policy Change Project. Grimble, Robin. (1998). Stakeholder Methodologies in Natural Resource Management: Best Practice Guidelines. Natural Resource Institute. The University of Greenwich WEEK 6. Developing a Project Plan Chapter 6 WEEK 7. Developing a Project Plan (continued) Microsoft Project Practicum # 1 WEEK 8. Estimating Project Times and Costs Chapter 5 WEEK 9. Midterm WEEK 10. Managing Risk Chapter 7 Additional: ISO 31000 WEEK 11. Scheduling Resources and Costs Chapter 8 Microsoft Project Practicum # 2 WEEK 12. Scheduling Resources and Costs (continued) Chapter 8 WEEK 13. Progress and Performance Measurement and Evaluation Chapter 13 Microsoft Project Practicum #3 WEEK 14. Progress & Performance Measurement & Evaluation (continued) Chapter 13 SWOT in Project Management (external literature and sources for development) Project Management KPIs WEEK 15 -18. Integrity/Clean-Up to Presentation Prerequisites: Enterprise Data Analysis II, International Financial Statements Analysis II, Upper Level Standing, Department Permission Non-Profit & Public Organisations Management Overview of the management skills required by leaders of non-profit organizations and will discuss the purpose or mission of the organisation and its place in society. Management theory and practice tell us that to successfully fulfil its mission an organisation should engage in a process of planning and organising its resources to implement a plan. The course will also include a discussion of how to develop financial resources through fundraising and earned income ventures. We will also explore marketing and communication techniques, financial management, and the role of the governing board in the non-profit organization. Assisting Literature --> Wolf, T. (2012). Managing a Non-profit Organisation. New York: Free Press. Heyman, D.R. (2011). Non-profit Management 101: A Complete Practical Guide for Leaders and Professionals. San Francisco: Jossey-BassNOTE: many or most cases course will apply other literature and sources. Operations Data --> --Listings & Filings: Securities Exchange Commission, Gov’t Revenue Admin --Financial Statements: Balance Sheet (Statement of Financial Position), Income Statement (Statement of Activities), Statement of Functional Expenses, Non-Profit Financial Statement of Cash Flows, Internal Revenue Filings --Annual Reports International Data & Tools --> UN Data (UNODC & UNSD) Open-Source Resources --> Indices of Social Development:https://isd.iss.nl/data-access/ OCHA Tools: https://kmp.hpc.tools/hpc-tools/ https://www.unocha.org/ocha-digital-services Course Assessment --> Assisting Literature Exercises 20% Group Assignments 50% In-Class Obligations 30% --Week 1 What is non-profit management? Overview of the Non-Profit Sector --Week 2 Law and Governance Mandatory government registries and taxation status for NGOs/NPOs The role of the governing board. Review and analyse the legal aspects of board governance, by laws, conflicts of interest, and fiduciary responsibilities. Comparative Legal Framework for NPOs/NGOs concerning different countries or provinces: Starting an NPO/NGO Process Note: will be responsible for written development relevant to process Determination of tax-exempt status (provincial and federal) Forms of taxation exemption based on classification types Financial reporting procedure with exemptions filing Requirements/rules for foreign NPOs/NGOs Foreign Funding of domestic and foreign NPOs/NGOs Examination of Board Members of three NPOs and analyse the strengths and weaknesses of these members as to their role on the Board and what resources they bring to their Board. Due date(s) will be given. --Week 3 - 5 Environmental Scanning, Human Capital, and Strategic Planning A. Data and Demography Demography Gov’t census and labour statistics (national, provincial, municipal) UN Bodies and Agencies data (UNSD, UNODC) B. Indices of Social Development:https://isd.iss.nl/data-access/ C. How do you acquire data for cultural factors? Material Culture, Cultural Preferences, Languages, Education, Religion, Ethics & Values, Social Organisation D. Market Scanning and Decision making Note: some or most of all prior (A through D) may factor in Market Scanning And Decision Making Defining Objectives (Identify Goals, Scope & Focus) Environmental Scanning (PESTEL) Stakeholder Analysis (Map Stakeholders, Engagement Analysis) Donor & Funding Landscape (funding sources, donor trends) Needs Assessment (methods to accomplish such assessment) Data Collection Methods (Primary Research, Secondary Research) Trend Analysis (Monitor trends, predictive analysis) Technology and Digital Presence (digital tools, social media analysis) Reporting & Strategic Recommendations (compile findings, actionable recommendations) Programme Theory: < https://www.jmu.edu/assessment/sass/ac-step-two.shtml Monitoring Mechanisms to track effectiveness of implemented strategies/programme E. Human Capital Organisation Design for NPOs (may be subject to priors) 4 frames -- structures, symbols, people, & power (Bolman & Deal 2008) U.S. Department of Health and Human Services. (2005). Successful Strategies for Recruiting, Training, and Utilizing Volunteers. DHHS Publication No. (SMA) 05–4005 Flood, J. P. (2005). Managing Volunteers: Developing and Implementing an Effective Programme. Proceedings of the 2005 Northeastern Recreation Research Symposium GTR-NE-341 Nikolova, M. (2014) Principals and Agents: An Investigation of Executive Compensation in Human Service Nonprofits.Voluntas 25, 679–706 (2014) Groups will be assigned a project based on (A) through (E). Due date will be given. --Week 6 - 8 Risk Data and Risk Identification Tools for NGOs/NPOs The given methodologies, sources and tools concern development of a fluid, tangible and competent scheme for credible analysis in good timing. A. Profiling with IGOs Criminology Data UNODC and UNSD Measures and indicators for political stability and security Groups will have exploratory data analysis project and predictive modelling project(s). Due date(s) will be given. B. Risk Assessment Development Tools Relevance to various types of non-profits and their welfare 1.The Global Conflict Risk Index < https://drmkc.jrc.ec.europa.eu/initiatives-services/global-conflict-risk-index#documents/1059/list > Note: the methodology and other documentation must be analysed before use. 2.INFORM (analysis & in-class implementation) INFORM Index for Risk Management INFORM Severity Risk INFORM Warning Note: for each the methodology and other documentation must be analysed before use. 3.Environmental Emergencies Centre (analysis & in-class implementation) The Flash Environmental Assessment Tool (FEAT) Rapid Environmental Assessment Tool (REAT) Note: for each the methodology and other documentation must be analysed before use. Comparative assessment between (1), (2) and (3) (in-class implementation): Product SWOT analysis AND compliment (augment) to each other for various environments based on analysis and implementation. D. Financial Integrity PART A (general knowledge or ambiance counterpart): Office of the Comptroller of Currency - Bank Secrecy Act/Anti-Money Laundering: Joint Fact Sheet on Charities and Nonprofit Organizations PART B (in-class development) The following literature can be expanded to treat general non-profits. With respect to sector/service of the NPO considered, apply such literature as a model or inquiry for the various conditions, administrations and issues pertaining to the ambiance: Barker, A. G. (2013). The Risks to Non-Profit Organisations of Abuse for Money Laundering and Terrorists Financing in Serbia, Council of Europe E. Develop the following literature with environment data of interest (in-class development): Ferwerda, J., Kleemans, E.R. Estimating Money Laundering Risks: An Application to Business Sectors in the Netherlands. Eur J Crim Policy Res 25, 45–62 (2019). Can possibly be altered to NPOs following --Week 9 - 10 Marketing and Communications Part A Group Assignment: Choose 2-3 competing comparable NPOs. Visit their website, social media usage concerning “diversity” makeup: from boards, committees, executives to staff .Analysis such content from a “diversity” perspective. For such 2-3 competing comparable NPOs perform marketing analysis. Note: there are professional step-by-step guides to conduct such. PART B Group Assignment: For such 2-3 competing comparable NPOs operational analysis. Note: there are professional step-by-step guides to conduct such. Compute the following for respective non-profit: Total Available Market (TAM) The Serviceable Available Market (SAM) The Serviceable Obtainable Market (SOM) Identify geographical and cultural exposure. Due date(s) will be given Part C Group Assignment: Observation of the Brand IDEA Framework for 2-3 NPOS. Literature assist: Laidler-Kylander, Nathalie, and Julia Shepard Stenzel. (2013). PART 3 – Putting the Brand Idea into Action. In: The Brand IDEA – Managing Nonprofit Brands with Integrity, Democracy and Affinity. Wiley Due date(s) will be given Class Discussion - Intellectual Property development process and initiatives for sustainability and growth --Week 11 NPOs Supply Chains (In-class implementation) PART A Will try to empirically model NPOs w.r.t. sector. Elements to incorporate in supply chains: legitimacy, mission and directives, sources of income, markets, fund accounting, means of penetration, communication channels, distribution channels, transactions costs, value creation PART B Supply Chains are “naturally” prone to disruption for various reasons. Reasons reside in the political- economic-social-technological (PEST or PESTEL ) “manifold”. For each element in (A) to classify within PESTEL, and to identify conventional sources of disruption. Identify methods and tools that are robust and practical for risk indication. Knowledge and skills from week 6 - 10 may be invaluable. Note: world development indicators and world bank indicators may be too lagging and broad sighted, but still respected PART C Cost-Benefit Analysis (CBA) for charity projects (2-3 Cases for CBA) Framework and logistics Settings based on Part A and part B is a good start Monetised: Costs and Benefits Non-monetised impacts: Benefits Discounting Findings PART D Managing project risk overview. Will try to construct a fast logistical model for cases based on the following text due to time constraints: Edwards, P., Vaz-Serra, P. and Edwards, M. (2019). Managing Project Risk. Wiley --Week 12 Fiscal Management and Accounting Lecturing Assist: Towle, J. A. (1992). Fiscal Management for Non-Governmental Organisations: A Practical, “How To” Manual to Assist Environmental NGOs in the Eastern Caribbean. Island Resources Foundation Group Assignment: student groups will be assigned 2-3 NPOs/NGOs where they must acquire the essential financial statements for 5 – 8 years -- Financial Statements (with adjustments) towards: Fundraising Ratio Programme Expense Ratio Operating Reserve Ratio Quick Ratio or Current Ratio Viability Ratio Programme Efficiency Ratio Operations Reliance Ratio Trend in each prior ratio Financial Integrity (individual firms & against possible comparables): Cash Flow Analysis Beneish model Dechow F model Modified Jones Altman Z-score Trend in each prior Due date(s) will be given for financial ratios and financial integrity Geo-Spatial Valuation Methods for NPOs (GSVM) Quantitative Methods (demographic analysis, spatial analysis, Index and Indicator-Based Approaches like HDI or SVI, demand forecasting) Qualitative Methods (Participatory Rural Appraisal (PRA), Stakeholder Analysis) Needs Assessment in regard to “markets” (basic, capacity, community/region) Catastrophe Modelling The Flash Environmental Assessment Tool (FEAT) Rapid Environmental Assessment Tool (REAT) Due date(s) will be given for chosen GSVMs Operational Valuation Methods for NPOs (OPVM) Fundraising Efficiency Ratio Donor Retention Rate and Acquisition Cost Impact-Based Valuation (may be moderately arduous) SROI, Impact Valuation Reputation and Network-Based Valuation Reputational Capital Due date(s) for the OPVMs How to determine when humanitarian need has plateaued? How to gauge the potential of wasted resources post-plateau for respective “market”? --Week 13 - 14 Strategic Management Resource Advantage Theory treatment: Topaloglu, O., McDonald, R. E., & Hunt, S. D. (2018). The Theoretical Foundations of Nonprofit Competition: A Resource-Advantage Theory Approach. Journal of Nonprofit & Public Sector Marketing, 30(3), 229 – 250. Group Assignment: Following analysis of Topaloglu et al (2018) literature, groups will be assigned 2-3 competing NPOs/NGOs where they are to develop competitive strategy structured on resource-advantage theory, and based on data, resources and tools mentioned, given or applied in course; crucially as well, intelligence and skills from prior weeks also to be invaluable. Due date(s) will be given. PESTEL and SWOT (with templates) Group Assignment (Due date(s) will be given): PESTLE analysis and SWOT Analysis for the same 2-3 NPOs/NGOs How does the R-A theory study compare/contrast with PESTEL/SWOT? --Week 15 Financial Resources (Grants focus) Membership dues, private donations, sale of goods & services, gov’t funding, grants from other non-profits, loans Grants Learning Searching for Grants That Fit Your Nonprofit Organization. Where and how? Ambiance counterpart to: < https://www.grants.gov/learn-grants.html > Issue of historical preservation (operations legacy, contributors, intellectual property) --Week 16 - 17 Technology Integration Note: groups to be given sets of technologies products concerning a particular sector of non-profits, to gather intelligence and analyses towards choice selection. 1. Discern the various elements and questions related to workplace technology 2. Create a strategy for technology planning 3. Decide on technology plans and how to choose technology. Note: must include the following - PESTEL and 5C Analysis implementation for companies and products. Financial analysis for all companies and products, plus applying Beneish, Dechow F, Modified Jones and Altman Z. Cybersecurity scheme subjugating/constraining priors (1)-(3) For the steps (1)-(3) the following literature provides guidance for different industries with technology integration -> 4. Technology Transition Planning (examples): < https://orta.research.noaa.gov/plans/ > < https://www.tswg.gov/TechnologyTransition.html > Note: for steps 1 – 4 the following literature provides guidance for different industries with technology integration -> *Campise, J. A. (1972). Choosing a Computer System for Project Management. Project Management Quarterly, 3(4), 13–16. *Quinn, S. D. et al (2018). National Checklist Programme for IT Products – Guidelines for Checklist Users and Developers. NIST Special Publication 800-70 Revision 4 *Information Technology Investment Management: A Framework for Assessing and Improving Process Maturity. GAO March 2004 Version 1.1 GAO-04-394G *National Centre for Education Statistics – Forum Unified Education Technology Suite: < https://nces.ed.gov/pubs2005/tech_suite/index.asp > *Health & Human Service ECLKC: < https://eclkc.ohs.acf.hhs.gov/organizational-leadership/article/whats-involved-technology-planning *Bhangoo, T. (2020). How to Select the Right Technology Solution: Five Strategies for Leaders. Forbes --Week 18 Performance Measures (PM) and Stakeholder Engagement PM Resources: Chartered Professional Accountants of Canada – Performance Measurement for Non-Profit Organisations (NPOs) Features of a Stakeholder Engagement (toolkit) with robust methodologies Prerequisites: Enterprise Data Analysis I & II, International Financial Statement Analysis I & II. Corequisite: Introduction to Computational Statistics for Political Studies Financial Management for Non-Profit Organisations By the end of this course, students will be able to: Understand techniques for financial planning, decision-making, and working capital management in non-profit organizations Employ cost allocation techniques to non-profit organizations. Flanking Texts --> Weikart, Lynne, Greg Chen, and Ed Sermier. 2012. Budgeting and Financial Management for Nonprofit Organizations. Thousand Oaks, CA: CQ Press Zietlow, John, Jo Hankin, and Alan Seidner. 2007. Financial Management for Nonprofit Organizations: Policies and Practices. John Wiley & Sons, Inc. FASB Guidelines --> FASB Not-for-Profits Financial Reporting Standards Grant Management Guideline --> National Endowment for The Arts Office of Inspector General - Financial Management Guide for Non-Profit Organisations, September 2008 Note: grant awards lower than $500K individually may require audits in other NPO sectors. NOTE: COURSE LEVEL WILL REFLECT PREREQUISITES Tools --> Microsoft Office 365 Microsoft Dynamics R + RStudio SEC and Internal Revenue databases Balance Sheet (Statement of financial position); Income Statement (Statement of Activities); Statement of Functional Expenses; Non-Profit Financial Statement of Cash Flows; Internal Revenue Filings Many NPOs and Public Administrations will be applied as case examples with their data. Course Assessment (based on the given 9 elements) --> 1. Assignments based on lecturing texts and FASB guidelines 2. Questionnaires and Structuring Assignments Tax accounting and a right to gross expenditures Conditions for exemptions on profit tax Value added tax Local tax 3. NGO/NPO summaries 4. Labs 5. Assigned tasks from: Wang, H. (2014). Financial Management in the Public Sector: Tools, Applications, and Cases. Routledge Tasks to include real data from actual public sectors or campus programmes (since data is easily accessible) 6. Specified Team Assignments in modules 7. Develop financial statements for assigned local NPO or campus institution NPO programme term assignment 8. Forecasting and Operating Budget Group Term Assignment 9. Obligation of 2 Exams Essential Labs --> -Summarize the differences between financial accounting and managerial accounting. Tools and techniques that differentiate and what they reveal. -Acquisition of financial statements from SEC and other gov’t realms. Read and interpret/analyse non-profit financial statements. Horizontal analysis, Vertical Analysis, cash flow analysis, and adjusting financial statements and developing ratios. -Capital Budgeting 1.Cost Estimation/Analysis for an NPO (total) 2.The following can possibly be adjusted to treat programmes of interest. Your institution’s programmes or data accessible gov’t programme may suffice. Larson, B. A. & Wambua, N (20111). How to Calculate the Annual Costs of NGO-Implemented Programmes to Support Orphans and Vulnerable Children: A Six-Step Approach. J Int AIDS Soc.;14:59 3.Utilize financial planning & budget models 4.Cash Budgeting Organizing spreadsheets into modules for different parts of a company and linking results; using a one-variable input table for sensitivity analysis to evaluate alternate operating tactics. Multi-variable input extension. Understanding the role of a cash budget in a company’s marketing, production, and financial operations; examining the impacts of changing conditions on cash flows: forecasting the short-term borrowing a CFO must plan for. Spreadsheet skills: creating spreadsheets that evaluate the financial payments from various types of capital investments; using one- and multi-variable input tables to analyze the sensitivity of financial payoffs to changes in conditions. Evaluate financial payoffs from different types of capital investments, such as investing in new facilities, replacing equipment; determining whether to lease or buy equipment. -Analysis and development of the following: Baber, William & Roberts, Andrea & Visvanathan, Gnanakumar. (2001), Charitable Organizations' Strategies and Program-Spending Ratios. Accounting Horizons 15(4): 329-343. Possible implementation with chosen organisations. Identifying trend over various years with quarterly/semi-annual/annual benchmarks -Social Return on Investment (SROI) Cooney, K. and Lynch-Cerullo, K. (2014). Measuring the Social Returns of Nonprofits and Social Enterprises: The Promise and Perils of the SROI, Nonprofit Policy Forum, 5(2), pp. 367-393 Will make use of gov’t projects/investments/programmes because data will be highly accessible and transparent. 2-3 cases to be done. Exams --> Exams will assess development based on weekly readings, and (1) to (4) of course assessment. Expect use of Microsoft Office tools and R as well. Develop financial statements for assigned local NPO Term Assignment --> Work with assigned (local) NPO groups to develop financial statements Forecasting and Operating Budget Group Term Assignment --> Note: students will use of intelligence and skills from their obligations PART A -- For a campus institution or programme forecast revenues & expenses based on Y size period history. Then compare to an actual succeeding. PART B -- Financial modelling for nonprofits. Groups to develop a financial model for a nonprofit or programme of the campus. Key essentials for financial model: What elements involved in building a financial model for common corporate firms are relevant to nonprofits? What non-monetized concerns or sensitivities apply to nonprofits concerning a financial model development? PART C -- Prepare an operating budget for chosen campus institution or programme. You will retrieve relevant sets of X-years history of financial data and history of the Statement of Financial Position and Statement of Activities. Additionally, you will be given a set of budget assumptions to guide you in the preparation of the budget, as well as a budget workbook. You are to prepare a balanced operating budget as directed by the trustees. In addition to submitting the budget workbook with the balanced operating budget, you must prepare a written budget justification memo addressed to the board of trustees explaining the decisions you made in balancing the budget. The budget justification memo must address each line (revenue and expenses) on the operating budget. There will also be presentations. Note: lecturing, intelligence, skills from assignments and labs will be invaluable. PART D – For a campus institution or programme students to engage in walkthrough logistics and development of cost-benefit analysis for budget or project; means of identifying rational alternatives towards CBA. Course Outline --> INTRODUCTION TO FINANCIAL MANAGEMENT IN NON-PROFIT ORGANISATIONS 1. Articulate the context of financial management in non-profit organizations 2. Articulate the primary financial objective for a non-profit organization 3. Provide a rationale for liquidity management 4. Identify the basic financial statements for a non-profit organization, and associated laws with Securities Exchange commission and Internal Revenue 5. Differentiate between a commercial organization and a non-profit organization 6. Articulate non-profit accounting concepts and terminology related to non-profit organisations UNDERSTAND NON-PROFIT FINANCIAL STATEMENTS 1. Interpret non-profit financial statements 2. Articulate cash versus accrual accounting 3. Articulate how organizational effectiveness is reflected by financial data 4. Differentiate non-profit financial statements from commercial statements 5. Interpret the statements of financial position, activities and cash flow and toe role of notes to the statements. 6. Interpret financial statements by classification 7. Make funding decisions based on analysis of financial statements for non-profit organizations MANAGING STRUCTURE, ETHICS & ACCOUNTABILITY & ACCOUNTING FOR JOINT COSTS 1. Build a structure for a non-profit organization that incorporates all of the elements including board structure as well as the management structure 2. Create an accountable organizational structure 3. Articulate how the financial management function fits into the overall organization structure 4. Develop methods to monitor accountability 5. Allocate joint costs in a non-profit organization MANAGING LIABILITIES/SARBANES – OXLEY (or ambiance counterpart) FOR NON-PROFITS 1. Make decisions on how to finance a non-profit organization 2. Articulate an overview debt and how it can be utilized. 3. Develop a plan for debt management. 4. Develop a debt policy 5. Match financial sources to strategic objective 6. Develop a plan on how to manage banking relationships 7. Articulate how the titles of Sarbanes Oxley (or ambiance counterpart) can help non-profit organizational efficiency and transparency Teams to be formed to apply all such prior skills to 3 or 4 NPOs assigned FUNDING MODELS Foster, W. L., Kim, P. and Christiansen, B. (2009). Ten Nonprofit Funding Models, Stanford Social Innovation Review Forbes Non-Profit Council. (2021). 10 Ways Nonprofits Can Develop A Self-Funding Model. Forbes Teams to be formed to apply chosen methods from latter article based on given settings. Be sensitive to the costs and benefits. ASSETS 1. Time value of money 2. Investment of the nonprofit organization’s assets. 3. Fiduciary structure and policy 4. Complexities and the contributing factors to these include: risk and mitigation (market volatility, liquidity, credit, interest), investment styles, manager selection challenges, and alternative investments choices. 5. Survey investment objectives and policies for both short-term and long-term investments. 6. Means of appraisal or valuation of the specific assets at time T. 7. Risk identification, risk measurement and risk mitigation for specific assets. FINANCIAL PLANNING, OPERATING AND CASH BUDGETS 1. Articulate the overall budgeting function in a non-profit organization 2. Role of Financial Statements (FS), Operations Reports (OR) and data history from FS and OR 3. Develop a process for creating a budget 4. PESTLE AND SWOT analysis in a budget plan 5. Utilize variance analysis and create a management control tool 6. Respond to budgeting difficulties and utilize various budgeting tools to improve performance 7. Articulate the use of program budgeting, flexible budgeting and rolling budgets. Teams to be formed to apply all such prior skills to various programmes of the institution. CAPITAL STRUCTURE OF NPOs 1. Static Trade-Off Theory vs Pecking Order Theory 2. Non-Profit Capital Structure & Endowments 3. Contrasting Literature The methodologies and data sets applied are of great interest. Analyse the respective empirical research, then replicate. Then augment with more modern data. Note: hopefully data sets are easily accessible, else there’s usually alternative respected data sets to apply. Calabrese, T. D. (2011). Testing Competing Capital Structure Theories of Nonprofit Organizations. Public Financial Publications Garcia-Rodriguez, I., Romero-Merino, M. E., & Santamaria-Mariscal, M. (2022). Capital Structure and Debt Maturity in Nonprofit Organizations. Nonprofit and Voluntary Sector Quarterly FUND ACCOUNTING Unrestricted Funds, Restricted Funds. Recognition of self-balancing set of accounts with its own revenues and other additions, expenditures and other deductions, assets, liabilities, and fund balance. Reporting. Teams to be formed to apply all such prior skills to various programmes of the institution. AUDITING IN NON-PROFTS 1. A clean audit opinion merely states the financial statements accurately reflect the organisation’s true financial structure –good or bad. 2. Auditing Types Internal Audits Audits performed under the Generally Accepted Auditing Standard Agreed Upon Procedure (AUP) 3. Audit by law? 4. Why a nonprofit may conduct an audit even when law doesn’t require it. 5. Intelligence on External Audit Preparation: https://rmas.fad.harvard.edu/pages/preparing-external-audit 6. Internal Audit Checklist (Cash) and logistics 7.Integrity For common potential cash fraud schemes identify the risks and indicators, along with complimenting auditing procedures Vertical Analysis, Horizontal Analysis and Cas Flow Analysis with financial data and financial statements. Teams will audit departments or programmes in the institution and elsewhere based on all prior identified schemes, checklists, analyses, models, laws and scores prior. Done also for municipal and provincial statements/data. 8. Concerning 2-3 NPOs with gov’t grants record of at least $X identify the audits required by government regulation for grant expenditure 9. Case for NOT conducting an independent audit Audit expense for small non-profits Audit cost-grant differential Observation of charge rates subject to revenue More affordable alternatives Review Compilation Differentiation: Review vs Compilation vs Audit Will preparation be the same for Reviews and Compilations? 10. Additional ways to demonstrate financial transparency Teams will be assigned various programmes of the institution to determine how well financial transparency has been established sans use of external audits. Can the observations be validated? Compare to operations based on (5) to (7). 11. Board of directors Cost-Benefit Analysis for External Audits INTEGRITY IN INVENTORY 1. Integrity audit preparation and inventory audit logistics 2. Inventory Metrics 3. Linking inventory to financial statements 4. Wells, J. T. (2001). Journal of Accountancy. Teams to be formed to apply all such prior skills to institutions or 3 or 4 NPOs assigned. FINANCIAL HEALTH 1. Focus on managing the balance sheet. Every dollar of assets on the balance sheet must be financed with either a dollar of debt or a dollar of equity (net assets). Will discuss the positive and negative aspects of using debt in the nonprofit organization’s capital structure. 2. Through financial statements adjustments and other skills apply the following: Ratio Analysis: Fundraising ratio Programme Expense ratio Operating Reserve ratio Quick ratio Current ratio Viability ratio Programme Efficiency ratio Operations Reliance ratio Data Integrity and Health (DIH) for individual firms & against possible comparables Cash Flow Analysis Beneish model Dechow F Modified Jones Altman Z-score 3. Identify liquidity management methods/strategies. 4. Klotz, C. (2020). Nonprofit Liquidity: Better Financial Storytelling under ASU 2016-14. The CPA Journal 5. Prepare internal financial reports that are used for management and governance decision making. 6. Understand the finances of the nonprofit with particular emphasis on analysis of the fiscal information and congruence with the 990 report (or ambiance counterpart) and its actual work. Be able to comment on the long-term trends and financial stability of the organization. Teams to be formed to apply all such prior skills to 3 or 4 NPOs assigned FINANCIAL SUSTAINABILITY 1. Pursue a practical explanatory model of financial sustainability for non-profits 2. How does such model critique particular NPOs? Will pursue case examples. Prerequisites: Enterprise Data Analysis I & II, International Financial Statement Analysis I & II. Corequisite: Introduction to Computational Statistics for Political Studies.
Public Policy Formulation and Implementation An introduction to the key stages through which public problems are recognized, channeled into the political process, and policies to address them formulated and implemented. Critical reflection on the manner in which political practices, institutions, and stakeholders influence the framing of issues, the alternatives that enter debate, and the evolution of public policies over time, and their ultimate impacts on society. Guide text --> Jodi Sandfort and Stephanie Moulton. (2015). Effective Implementation in Practice: Integrating Public Policy and Management. Jossey-Bass. 416 pages Note: make use of appendices as well Tools --> PolicyMakersoftware < https://michaelrreich.com/policymaker-software/ > Resources --> Executive record/literature (offices, departments, agencies, bureaus, etc.) Almanac of Policy Issues/Agendas: Culture & Society Economic affairs Education Health & Social Welfare Criminal Justice Environment Foreign Affairs National Security Documentation/literature/data from various elements of the public sector or public administration Gov’t Bureaus or Agencies (data, statistics, literature) IGOs (data, statistics, literature) Congressional record (bills, bill estimator/estimation) Constitutional record Judicial review & record (when relevant) Course Assessment --> Resonating elements and skills in (all) assignments Policy Questions Labs Literature Synthesis Papers Constitutional and Policy Issues Policy Content Evaluation Team Research Project & Presentations Resonating elements and skills in all assignments --> Applies to all other course assessment when applicable: The background of the policy issue chosen for studies Stakeholders (Principals spectrum and Agents spectrum involved) Relevance and self-interests, for respective entity Policy tools and instruments Applying models and theories of public policy Programme Theory. Theory of change with policy < https://www.jmu.edu/assessment/sass/ac-step-two.shtml > The pre-implementation impact assessments Possible instruments to deter moral hazard Upon stakeholders (Principals spectrum and Agents spectrum involve) Cost-Benefit Analysis outline drafting (IF ABLE) Monetised: costs and benefits Non-monetised Impacts: amenity, aesthetics, environment, ecological, heritage, culture Non-Monetised Benefits Manual: Qualitative and Quantitative Measures, Waka Kotahi NZ Transport Agency 2020 (OFTEN) Proper citations and references Literature Synthesis Papers --> Each student is required to write three (3) short literature papers synthesizing the approaches and leading issues identified in the readings for the weeks designated. The papers are to include references (when relevant). There are several ways the formulation and implementation of public policy is approached in the field and illustrated in the class through various issues and themes, from an historical development of the ambiance political institutions, issues of values and ethics, organisation capacity, stakeholder engagement, causal theory, mandate design, etc. Must demonstrate your grasp of the assigned readings and how they relate to your understanding of the formulation and implementation process. Policy Questions Labs (1-2 policies per lab) --> Hinrichs-Krapels, S. et al (2020). Palgrave Communications 6:101 (H-K) Note: lab elements will be stretched out appropriately to course obligations 1.Issue Identification and Definition: https://www.gov.nl.ca/pep/issue-identification-and-definition/ 2.Issue Identification (H-K) Additional questions: Is there a need of new policy on respective topic/issue? What credible empirical evidence (social, economic, environmental) conveys such? What are the causes(s) and how to verify? Do any current policy contribute to the problem?3.Developing options based on the findings along with respective policy network identification and means of enforcement, respectively. Theory of change, respectively. 4.(Multinomial) Logistic Regression to estimate and predict perceptions (if able). 5.Policy Feasibility Analysis (implementing the steps) 6.Policy Formulation (H-K) What is the best available evidence to use in formulating respective policy? What are the options in implementing respective policy? 7.Policy Implementation (H-K) What are the barriers/facilitators of implementing this policy? What is the best way to implement respective policy to allow for evaluation? Evaluate the costs and benefits of implementing. 8.Policy Evaluation (H-K) How should respective policy be evaluated? Constitutional and Policy Issues --> Entities may challenge the efficacy of policies based on constitutional amendments/components to argue a series of unintended consequences that may undermine policy and polarize groups against one another. Case studies characterising policy and intent, institutions and stakeholders, discontented entities vs advocacy entities, analysing intent vs counterfactuals (logically and legality), empirical standing. Judicial review and ruling. Team Research Project & Presentations (3-5 teams) --> The deliverables: -Mid-term presentation focused on a statement of the ‘problem’ being addressed and approach to research The “problem” being addressed (evidence and interests) The policy adopted to address the problem The theory of change underlying the policy The researchable questions the team wants to answer The methodology that will be employed to answer research questions Identification of responsibilities of the individual team members -Toward the end of the term, a presentation on research findings, suggestions for improving the implementation process, and the team’s view of the ideal (best imaginable) way for society to address the problem Brief restatement of the problem (evidence and interests) and policy Scholarly research on the policy Research questions and findings Strengths and limitations of the teams research and findings Assessment of the effectiveness of the policy’s implementation Recommendations for improving implementation References and any appendices -Policy Memo to gov’t executive head (3-5 pages) Applies acquired intelligence and skills from course, including the key dimensions of your implementation strategy; cautions or qualifications to include. Prerequisites: Public Policy (check PS) Fiscal Administration Introduction to the basics of budgeting in government. Budgeting represents an essential part of any government because it is through budgeting that elected politicians and appointed officials set their goals for the government, as well as developing the resources to meet those goals. NOTE: most topics will emphasize much observation and analysis of public data. Optional Text --> Mikesell, Fiscal Administration, Tenth Edition (2018), Wadsworth Note: there are data sources to accompany text for real world settings and data. Supporting Literature (mandatory) --> Country analogy to -- Congressional Budget Office: Budget Concepts and Processes -- https://www.cbo.gov/topics/budget/budget-concepts-and-process Cornia, G., Nelson, R., & Wilko, A. (2004). Fiscal Planning, Budgeting, and Rebudgeting Using Revenue Semaphores. Public Administration Review, 64(2), 164-179. Potter, B. H. and Diamond, J. Guidelines for Public Expenditure Management.International Monetary Fund Fiscal Transparency Handbook. International Monetary Fund 2018 Resources --> Government/Public Administration financial repositories/archives/databases of various geopolitical scales.NOTE: most lecture topics will emphasize much observation and analysis of public data. Tools --> Microsoft Office 365 R + RStudio Quizzes --> Closed book and closed notes. Concerns vocabulary, concepts and knowledge. Exams --> Part of exams will resemble quizzes. Closed book and closed notes. Part of exams will concern active acquisition of public data where students will perform tasks and provide elaboration/analysis. Example of data sources (for various years): Executive Leadership’s OMB, CBO, Treasury, Budget Analysis, Fiscal Financial Statements, National Accounts. Open notes. Part of exams concern applying methods and tools introduced in course and from supporting literature; given when lectured prior. Open notes. Exams may have variations among students. Fiscal Health Analysis Reports --> Student groups will develop a fiscal health report for assigned 1.Public Service or (in boroughs or district) 2.City or municipality 3.Province Public service Example: for schools in a particular province providing a set of financial indicators for each school district that may be used by various levels of government and citizens to evaluate the financial health of the province’s school districts. Idea example: https://www.cde.state.co.us/cdefinance/fiscalhealthanalysisjuly2014 Note: students are expected to cite data sources, literature and proper guidance for models, computations and displays. Note: to accompany, methods and tools of determining quality programmes and productivity. Course Grade Constitution --> Quizzes Exams Projects Analysis of gov’t financial statements with ratios development Taxation – Evaluation Criteria module Forecasting module Fiscal Sustainability module Wang, H. (2014). Routledge Public-Private Partnership Case Studies Grossman, S. A. (2012) Koontz, Tom & Thomas, Craig. (2012). Fiscal Health Analysis (FHA) Assisting guides for pursuits for public goods, public services (provincial, municipal and borough levels): Suarez V., Lesneski C. and Denison, D. (2011). Making the Case for using Financial Indicators in Local Public Health Agencies. Am J Public Health 101(3), pages 419-25. McDonald, B. D. (2018). Local Governance and the Issue of Fiscal Health. State and Local Government Review, 50(1), 46–55. Augment FHA with Beneish, Dechow F, Modified Jones & Altman Z Groups will be assigned specific tasks for various public sectors, public agencies, etc. Course Outline --> 1.Principles of Public Finance 2.Income Taxes and Property Taxes What are the models? 3.User Fees and Taxes on Goods and Services What are the models? 4.Taxation – Evaluation Criteria Objective: to develop taxes and a tax system that serve the broad needs of society in an efficient, fair and impartial way. Ideal taxation criteria: economic efficiency, economic competitiveness, administrative simplicity, adequacy, and equity/fairness. Task: what tools or methods exist to evaluate for the earlier given 5 criteria? How are they implemented? Verifying/implementing such tools or methods for chosen provinces. Diverse public opinion: citizen or resident views taxes differently based on the taxes they pay and the benefits they receive. Consequently, selecting taxes and designing a tax system for state and “local” revenues is a process of trade-off and compromise. Task: demography development for income/taxing segmentation concerning assigned region of interest. Outstanding public goods, services and utility to be identified for trade-off development. Task: development of articles with modern data Plumley, A. H. (1996). The Determinants of Tax Income Compliance: Estimating the Impacts of Tax Policy, Enforcement, and IRS Responsiveness. Internal Revenue Service. Publication 1916 (Rev. 11-96) Catalog Number 22555A Gemmell, N., & Hasseldine, J. (2014). Taxpayers’ Behavioural Responses and Measures of Tax Compliance “Gaps”: A Critique and a New Measure. Fiscal Studies, 35(3), 275–296. 5.Tax Expenditures and Distribution among households 6.Automatic Stabilizers What explicit models or formulas create the offsets? Evidence of their function. 7.Forecasting Literature of interest: Simalto: on small political scales can be applied to predicting which of the alternative combinations of optional service benefits provided by a local authority, state or national government in their annual budget would meet with the ‘maximum’ approval of a target population. International Monetary Fund. (1985). " Chapter 9 WORKSHOP 7 Revenue Forecasting". In Financial Policy Workshops. USA: International Monetary Fund GFOA. Financial Forecasting in the Budget Preparation Process, Government Finance Officers Association Williams, D. and Calabrese, T. (2019). The Palgrave Handbook of Government Budget Forecasting. Palgrave Macmillan 8.State and Local Governments Forecasting GFOA. Best Practices: Financial Forecasting in the Budget Preparation Process Best Practice: A Framework for Improved State and Local Government Budgeting, NACSLB, 1998 9.Budget Concepts (constructing the flow of things) Budget Baseline and Budget Options Budget Authority, Obligations, and Outlays Authorization Acts and Appropriation Acts Discretionary Spending & Mandatory Spending Implicit Obligation examples (medicare costs, retirement benefits, social welfare). Is it unique to entitlement spending? Interest on the debt Rescissions and Re-appropriations Cash Accounting, Accrual Accounting, and Fair-Value Accounting Revenues, Offsetting Collections, and Offsetting Receipts Deficit and Debt On-Budget and Off-Budget Cost Estimates, Dynamic Analysis, and Scorekeeping Calendar Year and Federal Fiscal Year 10.The Budget Process NOTE: will be subjugated by the Budget Concepts module prior Federal agencies create budget requests and submit them to the Executive Leadership’s Office of Management & Budget (OMB). OMB and the Executive Budget Process Followed by analysis of literature: Government Leader’s Budget Request Congressional Budget Office (CBO) Maintaining the Baseline Estimating cost and revenue Scoring revenue and spending bills Economic Projections Long term financial status Legislative Budget Process Budget Approval Discretionary, Mandatory, Interest on Debt Budget Analysis Budget Execution Laws enacted for failure to meet deficit target. 11. Public Expenditure & Fiscal Consolidation The Deficit, Debt and Debt Ceiling Public Expenditure Complimentary Literature: Potter, B. H. and Diamond, J. (1999). Guidelines for Public Expenditure Management. International Monetary Fund A Manual on the Design and Conduct of Public Expenditure Reviews in Caribbean Countries. Cepal, United Nations 2017 Fiscal Consolidation 12.Fiscal Federalism 13. Public Financial Management Systems (PFMS) Key Components; Technologies and Innovations; Benefits International Auditing Standards - International Organization of Supreme Audit Institutions (INTOSAI) 14.Fiscal Sustainability Examining the size of long-term fiscal imbalances Burrnside, Craig. 2005. Fiscal Sustainability in Theory and Practice: A Handbook. Washington, DC: World Bank From prior text I may ask students to apply tools to countries or provinces in more modern times. 15.Will pursue some implementations from the following based on real data from elements of the public sector. Wang, H. (2014). Financial Management in the Public Sector: Tools, Applications, and Cases, Routledge 16.Public-Private Partnerships Implement cases studies based on: Grossman, S. A. (2012). The Management and Measurement of Public-Private Partnership: Toward an Integral and Balanced Approach.Public Performance & Management Review, 35(4), pages 595–616 Koontz, Tom & Thomas, Craig. (2012). Measuring the Performance of Public-Private Partnerships: A Systematic Method for Distinguishing Outputs from Outcomes. Public Performance & Management Review. 35(4). 769-786. Prerequisites for PA & PS: Enterprise Data Analysis I & II, International Financial Statements Analysis I & II, Quantitative Analysis in Political Studies I Prerequisites for ECON: Enterprise Data Analysis I & II, International Financial Statements Analysis I & II, Mathematical Statistics Government Accounting This course is designed to cover financial reporting, managerial, auditing and information systems issues in governmental entities. Students will apply dual-track accounting to help develop skills at analyzing transactions in a governmental entity and follow their effect on the financial statements. The course is presented in two parts. Part 1 covers state and local government. Part 2 focuses on accountability for public funds. Course Text --> Reck, J., Lowensohn, S. & Wilson, E. (2013). Accounting for Governmental and Nonprofit Entities. New York, NY: McGrawHill Irwin. Accounting Resources (or ambiance compart) --> Financial Accounting Standards Board (FASB) Governmental Accounting Standards Board (GASB) Federal Accounting Standards Advisory Board Resources --> Government/Public Administration financial repositories/archives/databases of various geopolitical scales. NOTE: most lecture topics will emphasize much observation and analysis of public data. Tools --> Microsoft Office 365 Microsoft Dynamics R + RStudio Assessment --> Assignments Weekly or Bi-Weekly Quizzes Financial Statement Analysis (4-5) Midterm Examination City Of Smithville Project Economic Development Project Analysis & Presentation Final Examination (based Assignments and quizzes) Financial Statement Analysis (on multiple occasions) --> Using a government’s comprehensive annual financial report, budget document, and other relevant reports, students will analyse the financial statements with traditional financial analysis. Assigned gov’ts to vary among students. City Of “Smithville” Project --> The well-known comprehensive project for students. However, I personally don’t like “sealed off proprietary environments” when education for public service is relevant. Plagiarizing other past students’ labour, or copying other students are concerns. Goal is to make project highly relevant with real data. Namely, becoming highly acclimated with government accounting practice by use of actual data from a municipality or province to administer such a project. Hence, groups will be assigned unique environments Economic Development Project Analysis & Presentation --> Small working groups will be assigned during class. Students will be asked to take on the role of a municipal CFO and evaluate a proposal for an economic development project. Using a detailed case study real project, groups will analyse the benefits and costs of the proposal and produce a recommendation. Course Obligations --> 1.Introduction to Accounting and Financial Reporting 2.Principles of Accounting and Financial Reporting 3.Governmental Operating Statement Accounts 4.Accounting for Governmental Operating Activities 5.Accounting for Capital Assets and Capital Projects 6.Accounting for General Long-term Liabilities and Debt Service 7.Accounting for Business-type Activities of State and Local Governments 8.Accounting for Fiduciary Activities – Agency and Trust Funds 9.Financial Reporting of State and Local Governments 10.Analysis of Governmental Financial Performance 11.GAO Financial Audit Manual (for local or provincial level): https://www.gao.gov/financial_audit_manual It’s quite important that students also comprehend what documents and data apply (where and how) when the logistics are treated; applying what’s what, where to find, and process/method for assimilation. 12.Budgeting and Performance Management Prerequisites for PA & PS: Enterprise Data Analysis I & II, International Financial Statements Analysis I & II, Quantitative Analysis in Political Studies I
Crisis Management Means to develop workable plans for natural and industrial type disasters and emergencies. Principles and techniques preparing for various types of disasters, loss prevention measures, and preservation of organisation resources are discussed. Case study approach is used to develop and refine the desired application and critical skills. Evolving process with decision making and crisis management; cooperation, consistency and transparency are other key factors to establish. Student learning outcomes: 1. Critically review emergency disasters, both major and minor, detailing the preparations, response, and recovery. 2. Apply selected plans to actual sites to evaluate their strength and weaknesses as mechanisms for strategy “real world” sites. 3. Develop a comprehensive emergency plan for a specific type of emergency. 4. Complete exercises and projects to enhance their knowledge of comprehensive emergency management. Course Text --> Phillips, B., Neal, D. & Webb, Gary (2012), Introduction to Emergency Management, CRC Press. Augmentative Literature and Tools --> 1.Risk Management Guide for information Technology Systems Stonebumer, G., Goguen, A. and Feringa, A. (2002). Risk Management Guide for information Technology Systems: Recommendations of the National Institute of Standards and technology. Special Publication 800 – 30 Note: this literature is archived for historical purposes, but it’s much more tangible with academic and field exercises than its successor(s). This specified version above to be used to assess multiple environments. 2.United States Environmental Protection Agency Human Health Risk Assessment Tools (and Databases) Ecological Risk Assessment Tools (and Databases) Note: choice of tools for lesson planning/activities/projects will require dedicated search, proper comprehension, and proper tool acclimation. 3.WHO: Manual for Investigating Suspected Outbreaks of Illnesses of Possible Chemical Etiology Guidance for Investigation and Control Logistics in your ambiance: for certain features will like to identify what types of administrations, procdures, data, tools, and skills will be required to make such features accessible or tangible or quantifiable or qualitatively credible. 4.FEMA Benefit-Cost Analysis: https://www.fema.gov/grants/tools/benefit-cost-analysis 5.Predicting and Assessing the Impact of Hurricanes with catastrophe modelling tool. 6.HEC-FIA Immersion 7.Human Casualties in Earthquakes Spence, R., So, E., & Scawthorn, C. (2011). Human Casualties in Earthquakes Progress in Modelling and Mitigation. Springer Netherlands Chosen chapters that are highly tangible and quantitative will be used as frameworks for projects. Will require environment data, infrastructure data, etc., etc. Apply to different events and confirm whether developments are consistent with official reports for specific beginning to “horizon”, respectively. 8.Modelling Excess Deaths Rivera R. & Rolke W. (2019). Modelling Excess Deaths After a Natural Disaster with Application to Hurricane Maria. Stat Med. 38(23):4545-4554. Replicate. Apply to other natural disasters and confirm whether developments are consistent with official reports for specific beginning to “horizon”. 9. FEMA Substantial Damage Estimator Tool: https://www.fema.gov/emergency-managers/risk-management/building-science/substantial-damage-estimator-tool Assessment --> I. Exercises, Case Studies and Projects 70% Based on course text AND given augmentative literature and tools II. Exams 30% There will be 2-3 exams based on lectures, course text, assigned readings and applied sources. Students are to develop intelligence notes based on their belief what is critical knowledge from the readings towards use on exams; students will be informed on subject areas that may be encountered. Personal intelligence as well is warranted. Course Topics --> Emergency Preparedness Principles Regulatory Influences Interior Ministry Occupational Safety and Health Administration National Response Plan, National Response Centre Critical Infrastructure Protection Emergency Management Planning Vulnerability Assessments Plan Development and Implementation Chemical Emergencies Biological Emergencies Public Transportation Terrorism Natural Disasters Recovery Efforts Economic Impact Mitigation Prerequisites: Introduction to Computational Statistics for Political Studies (or Mathematical Statistics), Upper Junior level Research in Crisis and Crisis Mitigation This course examines the methodologies and strategies used in research to understand, predict, and mitigate crises. Students will explore historical and contemporary crises, including economic downturns, natural disasters, pandemics, and political upheavals. The course emphasizes data-driven analysis, policy evaluation, and the role of technology in crisis management. COURSE OBJECTIVES: Understand the nature and types of crises. Analyse case studies of past crises to identify key patterns and mitigation strategies. Develop research skills to assess the impact of crises and evaluate the effectiveness of mitigation efforts. Explore the role of interdisciplinary approaches in crisis research and management. Learn to use data science tools and techniques in crisis research. COURSE ASSESSMENT: Lab Sessions 85% (conditionally) All or most course modules will have multiple lab sessions. Quizzes 15% (conditionally) Quiz Component A: based on notes and course text from prerequisite; will be open notes/book. Quiz Component B: based on current course notes. Attendance, Punctuality and Behaviour Criteria Will have a score of 0 – 2. A score of 0 means you fail the course indefinitely; score of 1 means you are capped to a B+ grade (which may fall depending on academic performance); score of 2 means your grade totally depends on your academic performance. COURSE RESOURCES: World Bank reports on crisis management. WHO guidelines on pandemic response IMF reports on economic crises IGO databases and data (UN family, agencies and affiliates; OECD) Capital Markets data sources Gov’t (offices, departments, agencies) databases and data MODULE 1. Introduction to Crisis Research Defining crisis: Types and characteristics. Historical overview of major global crises. Overview of research methodologies in crisis studies. MODULE 2: Economic Crises Note: for each indicator following the concept and relevance to multiple historical events to be highlighted. Then followed by means of data analysis with past data. As well, identifying thresholds for the various indicators. For predictive models also past data to be applied. Macro-Economic indicators and predictive models. Rapid expansion of credit, particularly when it exceeds the growth of the economy, is a key predictor of financial crises. Note: credit has different sectors. A financial bubble occurs when the price of an asset (such as housing, stocks, or commodities) inflates rapidly and exceeds its intrinsic value, driven by speculation. Leverage refers to the use of borrowed capital to increase potential returns on investment. High leverage ratios, particularly among financial institutions, can lead to instability. A current account deficit occurs when a country imports more goods, services, and capital than it exports. Persistent deficits can signal underlying economic vulnerabilities. Weaknesses in the banking sector, such as undercapitalization, poor asset quality, and excessive risk-taking, can lead to financial crises. Large fiscal deficits and unsustainable levels of public debt can lead to a sovereign debt crisis, where a country can no longer service its debt obligations. Commodities prices? If so, at what stage? Probit/Logit Models: these statistical models estimate the probability of a crisis occurring based on the behaviour of key indicators. Policy responses and economic recovery. Discussion for each event highlighted prior. MODULE 3. Natural Disasters and Climate-Related Crises Hurricanes, earthquakes, climate change, pestilence Simulation Catastrophe Modelling tools Use of HEC-FIA, ADCIRC Human Casualties in Earthquakes Spence, R., So, E., & Scawthorn, C. (2011). Human Casualties in Earthquakes Progress in Modelling and Mitigation. Springer Netherlands Chosen chapters that are highly tangible and quantitative will be used as frameworks for projects. Will require environment data, infrastructure data, etc., etc. Apply to different events and confirm whether developments are consistent with official reports for specific beginning to “horizon”, respectively. Modelling Excess Deaths Rivera R. & Rolke W. (2019). Modelling Excess Deaths After a Natural Disaster with Application to Hurricane Maria. Stat Med. 38(23):4545-4554. Replicate. Apply to other natural disasters and confirm whether developments are consistent with official reports for specific beginning to “horizon”. FEMA Substantial Damage Estimator Tool: https://www.fema.gov/emergency-managers/risk-management/building-science/substantial-damage-estimator-tool Risk assessment and disaster preparedness. Augmented with the following: FEMA Benefit-Cost Analysis: https://www.fema.gov/grants/tools/benefit-cost-analysis The role of international organizations in crisis management. MODULE 4. Public Health Crises (Epidemics and Pandemics) Notions Case studies Saker, L. et al. (2004). Globalization and Infectious Diseases: A Review of the Linkages. Special Topics in Social, Economic and Behavioural (SEB) Research, World Health Organization. TDR/STR/SEN/ST/04.2 Grima, S. et al (2020). A Country Pandemic Risk Exposure Measurement Model, Risk Management and Healthcare Policy. Risk Management and Healthcare Policy, 13, 2067–2077. Epidemiological models and crisis response strategies. Note: only for mention. Mathematical or computational frameworks used to understand the spread of infectious diseases within populations. These models help public health officials predict the course of an epidemic, evaluate control measures, and plan interventions. There are at least 7 grand categorizations for epidemiological models where generally one type isn’t “tried and true”. For seriousness compartmental models should be less desirable out of the at least such 7; there are just some annoying and time wasting mathematical druggies. Surveillance systems across the developed world. Will investigate the framework and operation channels. Public health policy and crisis communication. MODULE 5. Political and Social Crises Case studies: The Arab Spring (and what do they mean by Spring compared to certain statistics that come in play), refugee crises. South American Caravans, etc., etc. Haitian cases. Differentiation between refugees and migrants. Means of legal determination. Augmented with: Lee J. and Nerghes, A. Refugee or Migrant Crisis? Labels, Perceived Agency, and Sentiment Polarity in Online Discussions. Social Media + Society Jul – Sep 2018: 1 – 2 Suleimenova, D., Bell, D. & Groen, D. (2017). A Generalised Simulation Development Approach for Predicting Refugee Destinations. Sci Rep 7, 13377 Political instability and its global impact. Duff, E. & McCamant, J. (1968). Measuring Social and Political Requirements for System Stability in Latin America. The American Political Science Review, 62(4), 1125-1143. Linehan, W. (1976). Models For the Measurement of Political Instability, Political Methodology, 3 (4), 441-486. Global Conflict Risk Index (GCRI) Index structure and robustness Hands-on development with the following: INFORM Risk INFORM Security INFORM Warning Comparing INFORM tools to GCRI via PESTEL and SWOT. Do INFORM tools and GCRI complement each other well, or is it a case of good redundancy? Crisis communication and information management. The role of NGOs and international organizations in crisis mitigation. MODULE 6. Counter-Terrorism Related Management Case Studies Cybersecurity Stonebumer, G., Goguen, A. and Feringa, A. (2002). Risk Management Guide for information Technology Systems: Recommendations of the National Institute of Standards and technology. Special Publication 800 – 30 Note: literature is archived for historical purposes, but it’s much more tangible with academic and field exercises than its successors. Will be used to assess multiple environments. FATF-GAFI The following literature can be expanded to treat general non-profits. With respect to sector/service of the NPO considered, apply such literature as a model or inquiry for the various conditions, administrations and issues pertaining to the ambiance: Barker, A. G. (2013). The Risks to Non-Profit Organisations of Abuse for Money Laundering and Terrorists Financing in Serbia, Council of Europe MODULE 7. Environmental Disasters Survey of multiple past events Typical pollutants and contaminants of concern General recognition (of natural state, or purpose of existence, or use) PubChem. (n.d.). PubChem. https://pubchem.ncbi.nlm.nih.gov/ Treatment and/or contamination mitigation methods Air Pollution: AEROMOD Air Quality Dispersion Modeling – Alternative Models | US EPA. (2024, June 24). US EPA. https://www.epa.gov/scram/air-quality-dispersion-modeling-alternative-models Marine and Aquatic Pollution: US EPA: BASS Models for Predicting Beach Water Quality | US EPA. (2023, December 12), US.EPA. https://www.epa.gov/beaches/models-predicting-beach-water-quality Surface Warter Models to Access Exposures. | US EPA. (2024, March 28), US EPA. https://www.epa.gov/hydrowq/surface-water-models-assess-exposures Investigating the relationship between exposure to pollutants and health outcomes involves a multi-faceted approach: Concept & logistics (and possible implementation of the acquired data) Review Existing Regulations: analyse current policies and regulations related to pollutant management and crisis response. Different response strategies and policies in mitigating the respective crisis. MODULE 8. Real-Time Data for Crisis Data sources for real-time analysis News Media Channels & Processes for events to reach (”credible”) news media IGOs Channels & Processes for events to reach respective PR Remoting Sensing Technologies & IoT (overview) Financial Markets What indicators, indices and asset value trackers typically reflect crises in abrupt timing? Geospatial Analysis (overview) Data Processing in Real – Time (overview) Types of Crises Requiring Real-Time Data Processing Components: Data Collection Architecture; Data Integration (data fusion, APIs); Pipelines (stream processing, event-driven architectures, edge computing); Data Storage (In-Memory databases, NoSQL databases, Cloud Storage); Real-Time analytics and Decision-Making (Machine Learning & AI models; Visualization Tools; Simulation Models) Challenges in Real-Time Data Processing During Crises Tools and Technologies for Real-Time Data Processing MODULE 9. Crisis Research and Policy Making Evidence-based policy making. Evaluating the effectiveness of crisis mitigation policies. Policy recommendations and implementation challenges. Prerequisite: Crisis Management Research Methods in Political Studies An introduction to the application of social science research methods to problems in public management and policy. Topics include research design, measurement, data collection techniques, and research ethics. Operations in this course: 1) Identifying which research designs and data collection strategies are the most appropriate for planning and evaluating public policy, programme, and management interventions. 2) Problems Sets A. Problem sets will include software skills, projects tasks and assignments done in prerequisite (Quantitative Analysis in Political Science I & II) to stay fresh. B. Course problem sets will be a combination of analytical and computational assignments based on lecturing. 3) Gaining increased sophistication as a research "consumer" who understands the strengths and limitations of research studies 4) Given the technical nature of this course, attendance at every class meeting is especially important. Each class builds on material learned in previous class sessions and will often cover some important material not covered in the assigned readings. As an added incentive, the instructor reserves the right to give quizzes in the beginning of class (no late or make-up quizzes will be allowed). 5) Students (in groups of 2 or 3) will be asked to prepare a research design to answer a question posed to them. The format of these assignments will be very similar to the questions asked on the midterm exam. The research proposal assignment is an opportunity for students to integrate all essential components of research methods in an area of interest to them. The students will work in small groups (2-3 students) to identify a research question of interest to public administration and design a research study to answer this question. The assignment has two parts: 1) initial research proposal memo 2) 10 minute oral research proposal presentation Proposal Memo. Students will be required to submit a memo written to convince the reader that the research is both important and feasible. In the proposal memo, the following questions must be addressed:-What is your research question? -Why do you want to undertake it? Who will care and why? -What do you think may be happening and how would this study help you know? (identify the variables, relationships of interest and hypotheses) -What audience(s) do you hope to influence? -What type of research design might you use to test your hypothesis and why? Research Proposal Presentation. Each student group will be required to give a formal presentation of their research proposal. Prior to the final presentation, students must hand in a report and draft PowerPoint presentation for instructor review and feedback. The proposal presentation should discuss the following elements: 1. Statement of the problem Research objective/question Significance of the problem 2. Outline of the theoretical framework or model Justify and conceptualize the variables that you select Identify independent variables(s) and dependent variable(s) Introduce testable hypotheses 3. Research design Study design and how it helps rule out alternative explanations Identify study subjects (sample)/units of analysis Describe sampling procedure Data collection methods (measures/instruments; operationalization) 4. Management Plan The time table Budget 5. Anticipated strengths, weaknesses and benefits. 6. Ethical considerations Course Grade Constitution --> Attendance & Participation Problem Sets Experimental & Quasi Design Assignments Midterm Exam Research Proposal Memo Research Proposal Presentation Final Examination Course Textbooks IN UNISON --> O’Sullivan, E., Rassel, G. R. & Berner, M. (2008). Research Methods for Public Administrators. New York:Longman Publishers Gertler, P. J., Martinez, S. et al (2016). Impact Evaluation in Practice,World Bank Group, and Inter-American Development Bank Assisting Literature --> United States Office of Management and Budget (OMB) Standards & Guidelines for Statistical Surveys - https://www.samhsa.gov/data/sites/default/files/standards_stat_surveys.pdf NOTE: textbook chapters will be accompanied by chosen journal articles catering for specific topics. Tools for activities: R and Excel Course Outline -->--Introduction: Research Use & Process--Introduction to Research and the importance of Theory --Measurement & Data Management --Research Design: Experiments --Research Design: Quasi-Experiments --Research Design: Cross-Sectional --Research Design Continued --Surveys Sampling & Administration--Survey Measurement --Survey Design Exercise--Research Ethics--Research Ethics continued & Reporting Research Results Prerequisites: Enterprise Data Analysis II; Quantitative Analysis in Political Studies I & II, Upper Level Standing. The later the better (but not too late).
Programme Evaluation I Students gain practical experience through a series of heavy tasks involving the design of methods, development of indicators, computational tools, and development of an evaluation plan to measure impact. Course introduces students to the following 5 elements: 1.Needs Assessment 2.Programme Theory < https://www.jmu.edu/assessment/sass/ac-step-two.shtml > 3.Feasibility Study (FS) NOTE: for FS when it comes to the economic evaluation and financial analysis stages, must be able to competently develop the following -- Cost-Benefit Analysis (NPV and/or IRR based mandatory) Monetised impacts: costs and benefits Non-monetised impacts: costs and benefits Rate of return (CAPM, multi-factor models, NPV, IRR Modified IRR, Adjusted Present Value); social discount rate also is a possibility. Discounting, computation, etc. Cash Flow Projections Financial Sustainability 4.Social Return on Investment (SROI) 5.Impact Evaluation Gertler, P. J. et al (2016). Impact Evaluation in Practice. World Bank Group, and Inter-American Development Bank NOTE: for such 5 elements immersion will be extensive and comprehensive. Critical Learning and Skills Outcomes --> ASPECT A. Intelligence and development in programme evaluation for the 5 mentioned elements: Purpose Framework Modelling (w.r.t. project/programme in question) Levels of measurement: population-based vs. program-based pertaining to such, Develop objectives, measures and indicators. Inputs and Outputs (I& A being qualitative and/or quantitative) Sources of data. Competence with data assimilation for measures and indicators concerning inputs and outputs Benchmarks Other Essentials Logistics (w.r.t. project/programme in question) ASPECT B. Write an evaluation plan for each element Towards various public administrations/departments, NPOs, projects, programmes, etc. NOTE: have a good repository such as Github General Course Literature and Tools --> Wholey, Josheph S., Hatry, H. P., and K.E. Newcomer. 2004. Handbook of Practical Evaluation, 2nd, Edition. Jossey-Bass. Rossi, Lipsey, and Freeman. Evaluation: A Systematic Approach. 7th edition. Sage Publications, 2004. Langbein, L. (2012). Public Programme Evaluation: A Statistical Guide, Routledge, 264 pages FEASIBILITY STUDY LITERATURE --> Make use of gov’t, IGO and academic texts. There will be some highly quantitative/computational elements implemented. Behrens, W. and Hawranek, P. M. (1991). Manual for the Preparation of Industrial Feasibility Studies. UNIDO BStevens, R. E., Sherwood, P. K. (1982). How to Prepare a Feasibility Study: A Step-by-step Guide Including 3 Model Studies. United Kingdom: Prentice-Hall. BMajura, J. G. (2019). Feasibility Study: A Practical DIY Guide for S,E Projects with a Detailed Case Study. United Kingdom: Xlibris UK. COST-BENEFIT ANALYSIS (NPV and/or IRR based) --> -Use of credible CBA manuals/guides (mandatory) -Campbell, H., & Brown, R. (2003). Benefit-Cost Analysis: Financial and Economic Appraisal using Spreadsheets (pp. 194-220). Cambridge: Cambridge University Press SOCIAL RETURN ON INVESTMENT (SROI) Literature --> Folger, J. (2021) What Factors Go Into Calculating Social Return on Investment (SROI)? Investopedia UNDP literature (and others) IMPACT EVALUATION Literature --> Gertler, P. J., Martinez, S. et al (2016). Impact Evaluation in Practice, World Bank Group, and Inter-American Development Bank Groups Term Evaluation Plan --> Student groups in the class will prepare the evaluation plans to fulfill the requirements for this class. Each evaluation plan will contain five parts, where a particular part represents a separate assignment. The topics to cover in each section are as follows: -Defining the problem/issue/project, stakeholders, and describing the intervention -Development Process and Logistics -Levels of Measurement. Inputs and Outputs -Sources of data and credibility -Competence and efficiency with data assimilation for indicators -Modern assimilation and execution -Baselines, Benchmarks and Analysis Note: groups will have the option to select either a domestic programme, or a federal programme, or an international program for this paper. Note: there may or may not be considerable distance in time between course and prerequisites. Students are encouraged to review their Statistics, Econometrics and R skills. Prerequisites: Enterprise Data Analysis II; International Financial Statements Analysis I & II; Quantitative Analysis in Political Studies I, Upper Level Standing. The later the better (but not too late). Programme Evaluation II --Student groups will be orchestrating field projects with various public sectors/administrations. Prerequisite: Programme Evaluation I NOTE: FOR VARIOUS BUSINESS COURSES RESOURCES SUCH AS Kaggle AND UPENN WRDS databases WITH CRSP/Compustat Merged Database (CCM) can be invaluable. SERIOUSLY --Getting Started with Wharton Research Data Services – YouTube --http://business-school.exeter.ac.uk/documents/resources/databases/wrds/user_guide.pdf --https://www.wiso.uni-hamburg.de/en/bibliothek/recherche/datenbanken/unternehmensdaten/wrds-getting-started-uhh.pdf REVENUE MANAGEMENT Revenue Management resides under the Business institution. Revenue Management curriculum: --Mandatory Courses --> Calculus for Business & Economics I-III, Optimisation, Probability & Statistics B, Mathematical Statistics --Core Courses (constituted by the following 5 different components): 1.General Business Structure << Business Communication & Writing I & II, Enterprise Data Analysis I & II (check FIN), International Financial Statement Analysis I & II (check FIN), Corporate Finance (check FIN) >> 2.Economics Integrity << Microeconomics I & II >> 3.Marketing Basics << Marketing Management I & II; Marketing Research & Analytics; Pricing Strategies; Customer Relationship Management >> 4.Commerce Skills << International Commerce (check FIN), Strategic Business Analysis & Modelling (check FIN) >> 5.Professional Necessities << R Analysis (check ACTUAR post); Operations Management I (Check OM); Logistics & Inventory (Check OM); Service Operations Management; Revenue Management I-II >> FOR THE FOLLOWING COURSES CHECK IN ACTUARIAL POST: Optimisation, Probability & Statistics, Mathematical Statistics NOTE: example data sources that may serve well for various courses -- https://aws.amazon.com/data-exchange/ https://www.kaggle.com/datasets/jackdaoud/marketing-data https://www.kaggle.com/datasets/demodatauk/digital-marketing-eventlevel-sample https://catalog.data.gov/dataset?tags=marketing https://oru.libguides.com/datasets/business https://libguides.mit.edu/c.php?g=385111&p=3452342 Marketing Management I Marketing is much more than advertising alone; even the most skillful marketer cannot make customers buy things that they don't want. Rather, marketing involves: (1) identifying customer needs, (2) satisfying these needs with the right product and/or service, (3) assuring availability to customers through the best distribution channels, (4) using promotional activities in ways that motivate purchase as effectively as possible, and (5) choosing a suitable price to boost the firm’s profitability while also maintaining customer satisfaction. These decisions – product, distribution, promotion, and price – comprise the marketing mix. Together with a rigorous analysis of the customers, competitors, and the overall business environment, they are the key activities of marketing management. Goal is to find the right marketing mix to avoid the economic consequences. You will learn how to make sound decisions pertaining to: 1. Segmentation, Targeting, and Positioning. How to assess market potential, understand and analyze customer behavior, and focus resources on specific customer segments and against specific competitors. 2. Go to Market Strategy. How to understand the role of distributors, retailers, and other intermediaries in delivering products, services and information to customers. 3. Branding. How to develop, measure, and capitalize on brand equity. 4. Pricing. How to set prices that capitalize on value to customer and capture value for the firm. 5. Marketing Communications. How to develop an effective mix of communication efforts. NOTE: course will be 16-18 weeks in duration Course Text --> Strategic Marketing Management: The Framework – 10th edition by Alexander Optional Supplement --> The Shopping Revolution, Updated and Expanded: How Retailers Succeed in an Era of Endless Disruption Accelerated by COVID-19 by Barbara Kahn Applied Resources --> Statistics based on databases from US Census, US BEA, US BLS via API Statistical Abstract (of country), Country Census Business Builder Regional levels as well Economic Indicators (consumer confidence, PMIs, inflation, labour statistics, income statistics) Demographic data Pew Research Centre databases Living Facts Google Trends Tools --> Sawtooth Software or alternative UPENN Pivot or Perish Assessment --> Case Studies Assignments/Projects Simulation & Presentation 2 Exams COURSE OUTLINE --> 1.What is Marketing? (Textbook: Chapters 1 & 2) 2.Textbook Ch. 6, Ch 14-16 3. Hands-on investigating of the use of the Applied Resources for research with presentation. Will be a bit challenging 4.Segmentation, Targeting, Positioning (Textbook: Chapters 3-5) 5. STP Case Studies Guide to compliment text knowledge (supported by Applied Resources): Salesforce - Step UP Marketing Strategy with STP (Segmentation, Targeting, Positioning): A Comprehensive Guide -> www.salesforce.com/in/blog/2022/03/segmentation-targeting-positioning-model.html 6.Customer Decision Making / Journey 7.Indeed Editorial Team. (2021). The 5 Stages of the Consumer Decision Making Process. Indeed Students in groups will be given example cases on how consumers identify their needs and make purchasing decisions. Students will identify how respective consumer is to be categorized in terms of STP with market measures applied for respective consumer 8.Consumer Decision Mapping and Redesign Lab 9.Customer Lifetime Value 10.Sharapa, M. (2019). 5 Simple Ways to Calculate Customer Lifetime Value, Medium 11.Branding Strategy (Textbook: Chapter 9) 12.Branding Strategy Case Studies 13.Brand Measurement 14.Whitler, Kimberly A. (2021). 9 Brand Measurement Methods. Positioning for Advantage: Techniques and Strategies to Grow Brand Value, New York Chichester, West Sussex: Columbia University Press, pp. 179-202. Field Case Studies 15.Pricing Strategy (Textbook: Chapter 10) 16.Sawtooth/Conjoint Lab (via Sawtooth Software or alternative) 17.Product Life Cycle 18.Product Life Cycle Case Studies 19.Go-to-Market Strategy (Textbook: Chapter 13) Distribution Channnel modelling and analysis for chosen firms in various industries; include risk analyses 20.Pivot of Perish Simulation: Introduction & Preparation 21.Simulation Debrief 22.Marketing Communications (Textbook: Chapter 12) Prerequisites: Enterprise Data Analysis I & II; Must fulfill the Business writing sequence; Microeconomics I & II Marketing Management II Issues related to the marketing process, major trends and forces that are changing the marketing landscape, marketing information, building and managing brands, marketing strategy and roles of ethics in marketing. Course Texts --> Iacobucci, Dawn, “MM 4”, 4th edition, Cengage Markstrat Participant Handbook, Stratx Personal Refresher Text --> Strategic Marketing Management: The Framework – 10th edition by Alexander Applied Resources --> Statistics based on databases from US Census, US BEA, US BLS via API Statistical Abstract (of country), Country Census Business Builder Regional levels as well Economic Indicators (consumer confidence, PMIs, inflation, labour statistics, income statistics) Demographic data Pew Research Centre databases Living Facts Google Trends Tools --> Sawtooth Software or alternative UPENN Pivot or Perish StratX Simulations web.stratxsimulations.com/programs-in-the-classroom-the-workplace StratX Simulation --> Likely to be a full-term project. Team Marketing Term Project (integrated marketing programme) --> A. Identify an existing product/brand issue being faced by a company. Completely analyse the brand/product, focusing your analysis on marketing concepts and issues covered in this class which you feel are important in explaining the issues involved and the differences between the brand/product you have chosen and its competitors. Clearly outline your assumptions and thought processes. B. Suggest actions and strategies (on each issue), which you feel would enable the product/brand to improve its market position. Clearly outline your assumptions and thinking. At minimum, your report must include AT LEAST: A title page identifying the members of the marketing team, product/brand and/or company name. Executive Summary Overview of the company’s mission Value proposition PESTEL and SWOT Description of the issue being faced that your plan will address Marketing strategy (segmentation target mkts, positioning, marketing mix strategies, marketing communications) Competition Brand/product analysis Band Measurement Methods Distribution Recommendation (including but not limited to; marketing strategy, target markets and segments, 4p’s and 4c’s, integrated marketing communications). Assessment --> Advance recital of case studies, assignments and projects from prerequisite Basic Simulation (Pivot or Perish) StratX Simulation 2 Exams 2 progression development for team marketing project Team Marketing Project COURSE LAYOUT --> NOTE: from prerequisite the course topics, activities, assignments, projects and case studies to be recited in an advance manner to be well suited precursors to related modules of this course; firms and ambiances subject to change. -Consumer behavior & Marketing Management -Strategies for segmentation, targeting & positioning -Measuring & Managing successful marketing strategies for products and services -The strategic role of brands -Measuring and managing strong brands -New Product & product decisions- Measuring key success factors -Distribution strategies -Pricing strategies -Communication strategies -Social media & marketing strategies Prerequisite: Marketing Management I Pricing Strategies This course gives students the means to approach pricing problems and to develop a pricing strategy and corresponding tactics that can maximize shareholder value. While each industry is unique in some ways, there are enough commonalities in pricing problems across industries to develop a set of rich insights applicable to a broad audience. The learning objectives of this course are simple. At the end of this course you should be able to: 1. Help a company raise its effective price. 2. Leverage your organisation’s unique insights and qualitative knowledge to develop and implement a strategic pricing plan. Each class is designed to further build a student’s pricing toolbox and provide insights into the theory and practice of effective pricing. Course will use a mix of lectures AND case discussions. The purpose of this course is to equip students with a process to make informed, strategic pricing decisions. Typical Text --> Nagle, Thomas T., and Georg Müller. (2017). The Strategy and Tactics of Pricing: A guide to Growing More Profitably. Routledge Resources --> Statistics based on databases from US Census, US BEA, US BLS via API Statistical Abstract (of country), Country Census Business Builder Regional levels as well Economic Indicators (consumer confidence, PMIs, inflation, labour statistics, income statistics, money supply) Pew Research Centre databases Living Facts Google Trends Amazon Price Monitoring Tools R packages MAJOR COMPONENTS OF COURSE 80% Contribution to Discussion & Collaboration Estimation of Value to Customer Pricing Research with Monadic Pricing & Conjoint Analysis Price Elasticity Price Structure Necessary Footing Labs Making Pricing Decisions with Limited Information TESTING 20% 3 Quizzes 0.6 Final Exam 0.4 Estimation of Value to Customer --> When launching a new product, a manager cannot use historical sales data to guide the pricing decision. However, a manager can use knowledge of the customer’s value drivers and the knowledge of the product’s attributes to inform the pricing decision in an Economic Value Estimation. Will have Economic Value Estimation assignments on Individual B2B and/or B2C Company. Pricing Research with Monadic Pricing & Conjoint Analysis --> You will have an exciting opportunity to get real market feedback and see how well this feedback aligns with your pricing research findings. PART A. Student teams will design, implement, and analyse the results of monadic pricing studies PART B. Student teams will design, implement, and analyse the results of a conjoint survey. Price Elasticity --> PART A. Multiple regression or log-linear models to estimate the price elasticity while controlling for factors like income, competitor prices, or seasonal effects. PART B. Time series models like ARIMA to understand the relationship between price and demand across different time periods. PART C. Arch Elasticity PART D. Cross-Elasticity. How the price change of one good affects the demand for another related good. Use to identify complements or substitutes. Price Structure --> Determines the method by which total transaction prices are determined. Price structures are a strategic means to price-segment the market. http://faculty.fortlewis.edu/walker_d/econ_325_-_pricing_structures.htm Expect case studies and directed circumstances to be given. Necessary Footing Labs --> A1. Primitive Empirics The well-known equation for a product or service” Retail Price = Cost + Markup So, what influences the markup? Cost(s) can be direct, indirect and variable. How to incorporate them strongly in a quantitative manner? Willingness based on economy. A2. A general model representation of markup: Markup = f(price of substitutes, specials, season, input costs); will try to synthesize explicit models for various services or products based on market data and other crucial data. Influence of competition on markup. B. Primitive Pricing 1. Hedonic modelling and estimation 2. Twin, A. (2022). Geographical Pricing: Definition, How Strategy Works, and Example. Investopedia with consideration of quality of life elements, economy, and the distribution channels among competitors 3. Data Envelopment Analysis Flelder, S. (1995). The Use of Data Envelopment Analysis for the Detection of Price Above the Competitive Level. Empirica 22, 103–113. Wang, B., Anderson, T. R. & Zehr, W. (2016). Competitive Pricing Using Data Envelopment Analysis — Pricing for Oscilloscopes, IJITM vol. 13(01), 1650006. Hopefully applicable to other products and services as well Boccali, F. et al (2022). Innovative Value-Based Price Assessment in Data-Rich Environments: Leveraging Online Review Analytics through Data Envelopment Analysis to Empower Managers and Entrepreneurs. Technological Forecasting & Social Change 182, 121807 C. Further Pricing Practices Cost-plus, Competitive, Penetration, Skimming, Premium, High-low, Bundle, Psychological, Dynamic. For the given above practices the concerns are: (1) Gathering intelligence on firms and ambiance will also be important, including what phases are such firms in. (2) Key components (3) Pros and cons (4) Logistics (5) Implementation is expected. (6) Empirical validation of the practices Economic data and business statistics may be applied for possible stimuli identification (7) Use of (A2) and elements from (B) can serve as potential baselines. There will be multiple sessions with involving modelling and quantitative literature as guides. Strong candidate pricing practices applied comparatively for chosen markets or circumstances; such concerns pricing practices valuations not being way out of the ballpark with realised pricing. Multiple products and services to apply. Price monitoring tools may also be useful. D. Dynamic Pricing in Sports (to develop in ambiance of interest) Cain, B., Saporoschetz, N. & Ginting, T. (2020). A Dynamic Pricing Model for Professional Sports Teams. Journal of Purdue Undergraduate Research: Volume 10 Huang, Z. et al. (2021). Dynamic Pricing for Sports Tickets. In: Stahlbock, R. et al. (eds) Advances in Data Science and Information Engineering. Transactions on Computational Science and Computational Intelligence. Springer, Cham Topic Schedule --> WEEK 1 Introduction to Strategic Pricing WEEK 2 Strategic Pricing Exercises Economic Value Estimation (EVE) WEEK 3 Price Response Estimation: Conjoint Analysis B2B/B2C Discussion & Price Elasticity Pricing Practicum Idea Presentations Due B2B/B2C EVE Individual Assignment due in last class of the week WEEK 4 Pricing Panel Price Structure: Price Metrics WEEK 5 Price Structure: Price-Offer Configuration Price Structure: Behavioural Pricing WEEK 6 Review and Catchup WEEK 7 Price and Value Communication Pricing Policy WEEK 8 Pricing New Products Answer Dash Presentations WEEK 9 Managing Competitive Dynamics WEEK 10 Live Case Exercise Life-Cycle Pricing WEEK 11 When and How to Fight a Price War WEEK 12 Managing Price inflation. Given literature can be investigated based on observation of industries and price monitoring tools or historical data. May be arduous to identify strongly any “contradictions” to prior foundations or modules. Donovan, M. (2008). How Marketers Can Manage Price Inflation. Harvard Business Review Johnson, E. and Gaputis, D. (2020 – 2021). Effective Pricing Strategies During Inflation for Consumer Companies. Deloitte WEEK 13 - 15 Cleanup & Review FINAL EXAM Prerequisites: Enterprise Data Analysis II, Microeconomics II, Marketing Management II, Mathematical Statistics Customer Relationship Management This course examines customer relationship management (CRM) and its application in marketing, sales, and service. Effective CRM strategies help companies align business process with customer centric strategies using people, technology, and knowledge. Companies strive to use CRM to optimize the identification, acquisition, growth, and retention of desired customers to gain competitive advantage and maximize profit. Emphasis is given on both conceptual knowledge and hands-on learning using a leading CRM software. CRM discussions and assignments will address relationship marketing with both organizational customers (B2B) and consumers/households (B2C). Although organizations continue to invest heavily in CRM, CRM implementations experience a high failure rate. Why? The pitfalls as well as the benefits of CRM strategy and implementation are addressed in the course. After successfully completing this course, a student should: 1) Understand the fundamentals of CRM 2) Recognize the basic technological infrastructure and organizations involved in current and emerging CRM practices. COURSE TEXT & LAB HANDOUTS --> Principles of Customer Relationship Management by Baran, Galka, Strunk, Southwestern (CENGAGE Learning), 2008 Lab Handouts will be provided during or before lab sessions. ADDITIONAL RESOURCE TEXTS --> Kumar and Reinartz (2012). Customer Relationship Management: Concept, Strategy, & Tools, Springer Buttle, F. (2009). Customer Relationship Management, Elsevier Ltd. TOOLS --> Microsoft Office 365 R environment Amazon tools RESOURCES--> Statistics based on databases from US Census, US BEA, US BLS via API Statistical Abstract (of country), Country Census Business Builder Regional levels as well Economic Indicators (consumer confidence, PMIs, inflation, labour statistics, income statistics, money supply) Pew Research Centre databases Living Facts Kaggle Google Trends LABS --> 1.Segmentation Methods Note: hopefully the mentioned resources are data rich, well structured, applicable and easily integrable to develop practical and robust segmentation. PART A To recall 4-5 types of traditional segmentation to be identified and developed. Recalling STP Case Studies from Marketing Management I & II can help. For each type of segmentation, use of professionally recognised guidelines or manuals are expected. PART B (R Immersion) Chapman, C., Feit, E.M. (2019). Segmentation: Clustering and Classification. In: R For Marketing Research and Analytics. Use R!. Springer, Cham. Dolnicar, S., Grun, B. and Leisch, F. (2018). Market Segmentation Analysis: Understanding It, Doing It, and Making It Useful. Springer 2. Association Rules Association Rules: Chapman, C. & Feit, E. M. (2015). Association Rules for Market Basket Analysis. In: R for Marketing Research and Analytics. Use R!, Springer 3.RFM Analysis PART A Comprehension and logistics R packgage rfm Reference manual Vignettes (customer level data, transaction level data) Interested in applying data of choice PART B Segmentation with RFM Procedure and logistics Actual implementation in R, then if able comparative analysis with development from (1). 4A.Customer Lifetime Value PART A Types (historical, discounted cash flow, predictive, customer segmentation, cohort-based, survival analysis, RFM, multi-channel attribution, churn-based, stochastic) PART B Use of the R package CLVTools Package reference manual What CLV models from prior are applicable? Includes logistics toto apply particular functions Vignettes for R package Will work with data from retailers (or whosoever/whatsoever) 4B. Predicting CLV 1.Clustering models 2.Multi-Class Classification 3.Customer Segmentation (via Logistic Regression) 4.Churn Prediction (via Logistic Regression) 5.Cross-Selling and Upselling (methods TBA) 6.Demand Forecasting (OLS, Logistic Regression and other methods) PROJECTS --> --CRM PROJECT 1: Market Measures Robust and dexterous methods to compute the following (will be done for assigned ambiances). At least two methods for each to compare: Total Available Market Serviceable Available Market Serviceable Obtainable Market 5C Analysis implementation for chosen firms (active comprehensive development): CFI Team. (2022). 5C Analysis. Corporate Finance Institute --CRM PROJECT 2: Data Envelopment Analysis Application Brown, J. R., & Ragsdale, C. T. (2002). The Competitive Market Efficiency of Hotel Brands: An Application of Data Envelopment Analysis. Journal of Hospitality & Tourism Research, 26(4), 332–360. Note: to also implement for various industries with regions and time frames of interest. --CRM PROJECT 3: Developing a model of customer relationship management and business intelligence systems for catalogue and online retailers. --CRM PROJECT 4: Confirmatory Factor Analysis & Structural Equation Modeling Chapman, C., Feit, E.M. (2015). Confirmatory Factor Analysis and Structural Equation Modeling. In: R for Marketing Research and Analytics. Use R!, Springer, Cham. A. Confirmatory Factor Analysis Comprehension Logistics R Implementation runs B. Structural Equation Modelling Comprehension Logistics R implementation runs Other References: Baumgartner, H. and Homburg, C.(1996). Applications of Structural Equation Modelling in Marketing and Consumer Research: A Review, International Journal of Research in Marketing 13(2), pp 139-161 Chin, W. W., Peterson, R. A., & Brown, S. P. (2008). Structural Equation Modeling in Marketing: Some Practical Reminders. Journal of Marketing Theory and Practice, 16(4), 287–298. Some loose R guides: https://bookdown.org/bean_jerry/using_r_for_social_work_research/structural-equation-modeling.html https://quantdev.ssri.psu.edu/tutorials/structural-equation-modeling-r-using-lavaan https://stats.oarc.ucla.edu/r/seminars/rsem/ ASSESSMENT --> Presence + Behaviour + Assignments Quizzes (4-6) Labs CRM Projects 1-5 Midterm Final COURSE TOPICS AND CONTENTS --> --Module I – CRM Theory & Development This module is designed to provide introduction to Customer Relationship Management, History and Development of CRM, and Relationship Marketing. This module also explores the issues related to Organizational structure and CRM. --Module II – Data, Information & Technology This module introduces students to the CRM Technology and Data Platforms, Database and Data Management, and the role of Business Intelligence (BI) in CRM. Types of CRM software systems and associated logistics. --Module III – CRM: Impact on Sales & Marketing Strategy This module is dedicated for exploration of the impact of Customer Relationship management on Sales & Marketing Strategy. --Module IV – CRM Evaluation In the CRM Evaluation module, several categories of measurement of CRM effectiveness including CRM’s impact on company efficiency, effectiveness, and employee behaviour are discussed --Module V – Privacy, Ethics and Future of CRM CRM strategy relies heavily on the efficient and accurate capture and use of customer information. Therefore, organizations have a responsibility to meet or exceed their customer’s expectations to privacy. This module highlights consumer privacy concerns and what organizations can do in support of privacy and ethical compliance. Prerequisites: Enterprise Data Analysis II, Microeconomics II, Marketing Management II, Mathematical Statistics Service Operations Management Depending on your ambiance the service industry accounts can reach 75% of the employment and around 60% of all personal consumption. This course will explore the service industries (e.g., transportation, retailing, restaurants, education, etc.) with a view toward developing models that allow planners to reduce costs and enhance customer service. Topics to be covered include facility location planning for services (e.g., ambulances, fire stations, repair facilities, cell phone facilities), resource allocation problems, inventory management issues in the service sector, workforce planning and scheduling, yield and demand management, queueing analysis and design of service systems, call centre management, and vehicle routing in the service industries. Typical text --> Daskin, M. S. (2010), Service Science, Wiley Supporting Text --> Chang, C. M. (2010), Service Systems Management and Engineering: Creating Strategic Differentiation & Operational Excellence, Wiley The course also has a secondary objective of introducing students to the non-textbook literature. Some of the course will be based on case studies that were documented in Interfaces, a journal published by INFORMS, the Institute for Operations Research and the Management Sciences (or other). This journal is designed to be accessible to a broad range of readers. Students will be exposed to a number of papers in the literature spanning a variety of problems in the service sector and a number of different industries. Students will learn to read such papers critically. Subject areas will concern various industries, supply chain concerns, revenue management, workforce, auctions, districting, etc.: Technology Requirement --> 1.R Packages Optmisation R packages (for integer, mixed, etc.) Inventory (if relevant to level of topics) SCperf, Inventorymodel, inventorize, MRP Multi-objective Programming and Goal Programming, 90C29: caRamel, GPareto, mco, emoa, rmoo Queuing r packages queueing, queuecomputer Data Envelopment Analysis rDEA, deaR, Benchmarking Vehicle Routing optrees, igraph, netgen, TSP, vrp, osrm 2.Excel 3.Word Processor Course Grading --> Homework Assignments (approximately one per week) 30% Standard Exercises Assignments with modelling, computation/simulation activities For R usage there must be commentary throughout development Written summary of one paper and computational analysis 10% Will be asked to elaborate on settings and modelling Analysis of variables and parameters Making relevant to R and/or Excel environments Model a real business or service with such; try incorporating prior Exam 1 15% Exam 2 15% Final Exam 30% Course Outline --> GREETINGS Introduction, course overview, importance of services in economy LOCATION MODELS & COVERING MODELS Taxonomy of location models and continuous location model Set covering model Maximum covering model Median and fixed charge location models MULTI-OBJECTIVE MODELS Multi-objective optimisation Multi-objective location models INVENTORY ISSUES Deterministic inventory issues in services Stochastic inventory issues in services RESOURCE ALLOCATION Resource allocation issues in services WORKFORCE SCHEDULING Short term workforce scheduling QUEUEING THEORY Queueing theory – basic principles Kendall’s notation, Memoryless property of the exponential, CK equations Fundamentals of Markovian Steady State Equation, (M/M/1 and M/M/s) Finite population, finite queue, M/G/1 and time dependent queueing Linking performance to scheduling Priority queueing DATA ENVELOPMENT ANALYSIS (DEA) Overview and applications Practice development assignments with DEA Applications Sherman, H. D., and Joe Zu. (2006). Service Productivity Management: Improving Service Performance Using Data Envelopment Analysis. Springer Safdar, K. A., Emrouznejad, A. & Dey, P. K. (2016). Assessing the Queuing Process Using Data Envelopment Analysis: An Application in Health Centres. J Med Syst 40, 32 Al-Refaie, A. et al (2014). Applying Simulation and DEA to Improve Performance of Emergency Department in a Jordanian Hospital. Simulation Modellin & Practice Theory 41, 59–72 CALL CENTRE DESIGNS Course literature treatment Jagerman, David & Melamed, B. (2003). Models and Approximations for Call Center Design. Methodology and Computing In Applied Probability. 5. 159-181 Garnet, O., Mandelbaum, A. & Reiman, M. (2002). Designing a Call Center with Impatient Customers. Manufacturing & Service Operations Management, vol. 4(3), pages 208-227. -WORKFORCE SCHEDULING Long term work force scheduling Long term work force scheduling and the newsvendor problem -VEHICLE ROUTING Vehicle routing – arch routing Vehicle routing – node routing Prereqs: Enterprise Data Analysis II, Optimisation, Probability & Statistics B Marketing Research & Analytics Course Text --> Iacobucci, D. & Churchill, G. A. (2019). Marketing Research: Methodological Foundations. CreateSpace Independent Publishing Platform NOTE: prerequisites assume much competence and self worth. This is not a course of memorization talent. R Literature (mandatory) --> Chapman, C. and McDonnell Feit, E. (2019). R For Marketing Research and Analytics. Springer, Cham. Dolnicar, S., Grun, B. and Leisch, F. (2018). Market Segmentation Analysis: Understanding It, Doing It, and Making It Useful. Springer Paez, A. and Boisjoly, G. (2022). Discrete Choice Analysis with R. Springer ChoiceModelR package Marketing Analysis for Firms --> Professional step-by-step guides to conducting for such exist. R Ambiance Skills Throughout Term --> Note: appropriate order will be determined, and some topics done on multiple occasions and sometimes in bundles despite given order. Labs will be essential to develop major assignments: Data Wrangling and EDA Secondary Data vs. Primary Data. Data assimilation and the dplyr package Descriptive/Summary Statistics (include interpretation of skew & kurtosis) Will identify appropriate treatment for variable types (categorical, ordinal, continuous) Box plots, scatter plots matrix, histograms plot matrix, and Q-Q plots matrix Will identify appropriate treatment for variable types (categorical, ordinal, continuous) Correlation (association, not causality) Purpose and Types Tools for correlation heatmaps and other exploratory features R packages (ggplot GGally, DataExplorer, correlation) Sample Size determination & Sampling Techniques Test of Independence (Chi-Square Test and Fisher Test) Practical, logistical, and get it done Contingency Tables (practical, logistical, and get it done) ANOVA in Marketing (appropriateness, practical, logistical, and get it done) Summary statistics and statistical analysis ANOVA extensions in Marketing (appropriateness, practical, logistical, and get it done) Summary statistics and statistical analysis OLS Multiple Regression Appropriate variable types Variables selection, summary statistics, forecasting & error Marginal effects Applications in Marketing Analytics Web Scraping Extracting data from websites. Means for market research, price comparison, data analysis, and more. Causal Designs and Experiments Multiple Predictors Logistic Regression (MPLR) Structure and appropriate variable types Binomial response, multinomial response, nested, mixed Variables selection, summary statistics, forecasting & error Applications in Marketing Analytics Support Vector Machine (SVM) counterpart to MPLR Ordinal Regression (OR) Structure, variables selection, model estimation, model evaluation Applications in Marketing Analytics Marketing Mix Modelling (MMM) Regression (fast review, linear and non-linear effects) Time Series (salient characteristics, model determination, summary statistics, forecasting) Sales Components (base and incremental) Elements measured in MMM Cluster Analysis & Segmentation Market Basket Analysis: Association Rules (arules & arulesViz R packages) COURSE ASSESSMENT based on 7 components --> 1.Marketing Analysis for Firms 2.R Ambiance Skills Throughout Term 3.Google Trends to assess the volume of search interest in a product or service can give a rough idea of demand. 4.Primitive Research Assignments: A) Qualitative Research Assignment/Focus group Develop a focus group plan to test a concept highlighted in the designated business case that is related to advertising for a product. The plan should be developed so that a research manager could readily follow it during implementation and understand the limitations of the results from the focus group. Therefore, it should highlight all limitations, assumptions as well as constraints. B) Quantitative Research Assignment Develop Hypotheses For the first part of the assignment, each student will review related literature (from sources such as academic journal articles, business articles, and online articles) and develop a hypothesis for the effect of price and advertising on sales revenue. Test Hypotheses (Note: skills range from Data Wrangling & EDA up to Causal Designs and Experiments from “R Ambiance Skills Throughout Term”.) Topic, motivation, target and features types Data sources identification and assimilation via R to analyse the data and test your hypotheses Describe the data analyses you have conducted Highlight important results of the data analysis State whether your hypothesis was supported or not, and if the hypothesis was not supported, why? Highlight implications of the results Provide managerial recommendations 5.Advance Marketing Research Tools Assignments A) MPLR B) SVM C) OR D) MMM E) Cluster Analysis, Classification and Multidimensional Scaling F) Conjoint Analysis (in-class assignment) G) Market Basket Analysis H) Google Trends 6.Marketing Research Term Project Working in teams, students will conduct research to address a current business problem affecting a specific company. Note: priors 1 through 5 to be invaluable. A) Select a manufacturing, service, or governmental organization that they believe would benefit from new data-driven insights, and describe a specific marketing problem it is facing. B) Identify what information is needed to resolve the problem. C) Formulate related research questions. D) Review literature and develop hypotheses. E) Conduct research to answer research questions. F) Write a report. Must follow the format described in the “Chapter 19 Research Report” of the I&C book 7. Final Exam: Analytical Questions Prerequisites: Marketing Management II, Mathematical Statistics
Revenue Management I This course focuses on the demand without attempting to manage the supply. But it does take the amount, location, condition, or vintage of the supplies into account. Demand must be understood first to be managed. This understanding comes partly from statistical forecasting but more importantly from the identification of the demand drivers. These drivers are specific to industries, but some are common and easily obtainable such as general macroeconomic indicators, demographic data, housing inventories, and temperatures. Unlike these demand drivers, prices can be managed over time, customer classes, locations. A good portion of the course is dedicated to determining good prices depending on inventory, capacity, input costs, and previous prices. In this process, both analytical arguments and methods are presented and their appropriateness in various practical contexts are discussed. Most applications are recent and made possible by the advances in technology, information systems, and data mining. Prerequisites will be crucial to course development. Typical Text --> Pricing & Revenue Optimization. Robert L. Phillips Resource --> Various RM journals Technology Requirement --> Price repository/database w.r.t. quantity or unit, etc., etc. Price Monitoring Tool R environment may incorporate arules and arulesViz R optimisation and inventory packages will be relevant R package RM2 to be useful Other packages related to skills from prerequisites or maturation Excel Homework & Assignments --> You can discuss homework and assignments with others but must write up by yourself with the full understanding of what you write. Quizzes --> Vocabulary, T/F, logistics for tools in RM tools, models (characteristics, design, construction) based on data. Pricing Strategies --> Off-campus advance recital of labs form Pricing Strategies course. Implementation studies to complement or contrast modules 1-5 & 12. Assignments in R --> With use of R students are expected to have commentary during throughout the computation or simulation development accompanying typed in a word processor. Pricing Strategies Demand Function Estimation Price Response Estimation Overbooking Project Real data: critical fractile methods versus monte carlo methods. The RM2 R package to follow. Assessment --> Class attendance and contribution to discussion Homework and Assignments Pricing Strategies Assignments in R 4 Quizzes Course Modules: 1-6 Demand Management; 7-12 Revenue Management --> 1. Introduction to pricing and revenue optimization 2. Demand Demand Drivers Demand Function Estimation Regression: linear regression, multivariate regression, log-linear regression Discrete-Choice Models (logit/probit) Logit model Multinomial logit model Random Forests micEconAids R package 3. Price-Response Estimation Regression: linear regression, multivariate regression, log-linear regression Ensemble learning 4. Competition 5. Price Differentiation: Volume discounts; Arbitrage and Cannibalization; Consumer welfare 6. Constrained Supply: Opportunity Cost; Segmentation; Pricing 7. Revenue Management 8. Capacity Allocation 9. Network Management 10. Overbooking 11. Markdown Pricing 12. Customized Pricing: List Prices vs. Customized Prices; Responses to Competitor Bids Prerequisites: Enterprise Data Analysis II, Optimisation, Mathematical Statistics, R Analysis, Pricing Strategies Revenue Management II Advance treatment and reinforcement course for revenue management. Assessment --> Class Participation Assignments (done individually) Prerequisite Projects Recital All will be done. Being precursors appropriately in sync or situated with current course group projects Group Projects (data driven) Inventory Models Demand Forecasting (build on prior project) Competitive Factors Discrete Choice models (build on prior projects) Overbooking & Booking Limits Unconstraining Methods in RM Pricing Performance Measures Finance (via financial statements) for EBITDA, NOPLAT, EVA, Operating Cash Flow, FCF Final Exam In-class open book/notes, R use Course Text --> Pricing and Revenue Optimization by Robert L. Phillips Resources --> RM related journals Technology Requirement --> Price repository/database w.r.t. quantity or unit, etc., etc. Price Monitoring Tool R environment (what was said in prerequisite) Excel Course Topics --> 1.Demand Drivers 2.Inventory Models of RM Stochastic Inventory Management and the Newsvendor Model [or (r, Q)] R packages: SCperf, Inventorymodel, inventorize, tsutils Inventory Analysis (modelling, construction and R) ABC - XYZ Analysis Expected Marginal Revenue/Value Single Resource Revenue Management 3.Demand, Forecasting and Data Analysis (lecturing to structure project) Recital: demand function estimation (from prerequisite) Demand Forecasting Regression Price Elasticity of Demand (PED) estimation PED estimation versus Price Response estimation Time Series Unconstraining for unobservable no-purchases--concept and the EM technique with exponential smoothing Industry Methods (chain-ratio method, consumption level method, end use method, purchasing manager’s index, consumer confidence index) Demand Forecasting for Substitutes Substitutes Identification Data Collection (attributes, sales data, pricing, advertising, seasonality, consumer preferences) Industry Methods (from earlier) How changes in substitute prices or availability impact the focal product’s demand Scenario Analysis 4.Discrete Choice Models Paez, A. and Boisjoly, G. (2022). Discrete Choice Analysis with R. Springer. Ben-Akiva, M., et al. (1997). Modelling Methods for Discrete Choice Analysis, Marketing Letters, 8(3), 273–286. Ortelli, N. et al (2021). Assisted Specification of Discrete Choice Models, Journal of Choice Modelling 39, 100285l Kim, C., Cho, S. and Im, J. (20ZZ). RMM: An R Package for Customer Choice-Based Revenue Management Models for Sales Transaction Data. The R Journal Vol. XX/YY, AAAA Note: preference with data of interest may be a concern. ChoiceModelR package 5.Competitive Factors (lecturing to structure project) PESTEL, SWOT CFI Team. (2022). 5C Analysis. Corporate Finance Institute 6.RM Process management (organizational issues) 7.Overbooking Critical Fractile Methods Monte Carlo Methods Include prerequisite project recital 8.Booking Limits EMSR-b and Bid-Price Models (RM2 R package to follow) 9.Unconstraining Methods in RM Guo, P., Xiao, B. and Li, J. (2012). Unconstraining Methods in Revenue Management Systems: Research Overview and Prospects. Advances in Operations Research, Volume 2012, Article ID 270910, 23 pages 10.Pricing Microeconomic and marketing theories on consumer- behaviour & pricing Product/service design and demand segmentation Dynamic Pricing Policies Dynamic Pricing Algorithms Development (for different industries) Analytical structure Logistics Algorithm design and development (with data integration/interface) Pricing with Supply Constraints - Yield Management/ (scarcity pricing) 11.Price-Response Estimation Prerequisite project recital Survival Analysis (active development in R) 12.Network RM (focus on airlines and air cargo) Network revenue management, control mechanisms Linear Programming Approach to Revenue Management Augmenting literature (but not limited to such): An, J., Mikhaylov, A.Y., & Jung, S. (2021). A Linear Programming Approach for Robust Network Revenue Management in the Airline Industry, Journal of Air Transport Management, 91, 101979. Clough, M., Jacobs, T. & Gel, E. (2014). A Choice-Based Mixed Integer Programming Formulation for Network Revenue Management. J Revenue Pricing Management 13, 366–387 (2014) Kunnumkal, S., Talluri, K., & Topaloglu, H. (2012). A Randomized Linear Programming Method for Network Revenue Management with Product-Specific No-Shows. Transportation Science, 46(1), 90–108. Applying Network RM to different industries (hotels, hospitals, airlines, air cargo, etc.) Footing (developing competent logistics): from modelus 1 - 13 -- in regards to development for Network RM what will be practically applicable or meaningful or integrable? A goal is to have problems where the amount of variables and parameters are manageable concerning intimacy in analysis and modelling, and manageable with CPU/GPU limits concerning R use when called upon. 13.Revenue Management Models and Methods How to classify RM problems and appropriate means to solve them. The following article may or may not be encompassing: Talluri, K. T. et al (2009). Revenue Management: Models and Methods, Proceedings of the 2009 Winter Simulation Conference, WSC 2009 Solving Revenue Management Problems Goal is to have problems where the amount of variables and parameters are manageable concerning intimacy in analysis and modelling, and manageable with CPU/GPU limits concerning R use when called upon. 14.Performance Measurement (analyse & implement for ambiances of interest) Applications: to hotels and restaurants, vehicle rentals, public transportation, hospitals or other public services ADR, RevPAR, RevPOR, GOPPAR, TRevPAR, NRevPAR, ARPA, ProPASH and ProPASM González, A. B. R., Wilby, M. R., Díaz, J. J. V. et al (2021). Utilization Rate of the fleet: A Novel Performance Metric for a Novel Shared Mobility, Transportation 15.Finance: EBITDA, NOPLAT, Operating Cash Flow, EVA, FCF Prerequisite: Revenue Management I REVENUE MANAGEMENT ACTIVITY FOR “SUMMER” AND “WINTER” SESSIONS It may be the case some activities can be grouped and given a major title together; however, detailed descriptions will be required. Activities repeated can be added to transcripts upon successful completion. Repeated activities later on can be given a designation such as Advance “Name” I, Advance “Name” II. As well, particular repeated activities serve to towards developing true comprehension, competency and professionalism. Activities will be field classified. Particular projects of interest being stationary: PRICING STRATEGIES Will be advance recital of models, tools, techniques from course. DETERMINING CUSTOMERS’ PREFERENCES Basic Resonating R literature (but not the focus): Chapman, C. and McDonnell Feit, E. (2019). R For Marketing Research and Analytics. Springer, Cham. Dolnicar, S., Grun, B. and Leisch, F. (2018). Market Segmentation Analysis: Understanding It, Doing It, and Making It Useful. Springer Based on assumed limitations with resources we may be restricted to the following three methods with large samples (assuming that compensation towards participants is economically reasonable): 1.Surveys and Focus Groups 2.Conjoint Analysis R package conjoint may suffice 3.Discrete Choice Models Paez, A. and Boisjoly, G. (2022). Discrete Choice Analysis with R. Springer ChoiceModelR package Ben-Akiva, M., et al. (1997). Modelling Methods for Discrete Choice Analysis, Marketing Letters, 8(3), 273–286. Ortelli, N. et al (2021). Assisted Specification of Discrete Choice Models, Journal of Choice Modelling 39, 100285l Kim, C., Cho, S. and Im, J. (20ZZ). RMM: An R Package for Customer Choice-Based Revenue Management Models for Sales Transaction Data. The R Journal Vol. XX/YY, AAAA Wierenga, B. (Editor). (2008). Handbook of Marketing Decision Models (Vol. 121). Springer NOTE: for the 3 areas prior prior -- A. Intension B. Pros and cons C. Comprehensive, professional and robust frameworks, logistics and implementation. Seek out applicable R packages as well. D. Comparative analysis of results. CUSTOMER LIFETIME VALUE (CHECK ACTUARIAL POST) CUSTOMER VALUE TOOLS AND METRICS PART A 5C Analysis implementation for chosen firms (active development) CFI Tea. (2022). 5C Analysis. Corporate Finance Institute Note: much effort in identifying robust and dexterous methods to compute TAM, SAM, SOM that will be involved in the 5C analysis when they are encountered. PESTEL/SWOT will also be taken seriously. PART B Segmentation in R (standard and RFM based) Logistic Regression activities PART C Developing a model of customer relationship management and business intelligence systems for catalogue and online retailers (or whatever). PART D Association Rules Packages arules and arulesViz applications (may be influenced by part B & C) PART E Development based on the following text in the R environment Kumar, V. and Petersen, J. A. (2012). Statistical Methods in Customer Relationship Management, Wiley HOSPITALITY R language will be applied extensively. The following packages may be momentarily highly useful: arules arulesViz There will be other R packages to apply. PHASE 1 (Intelligence and development): <The essential components of Revenue Management --Motivation to travel --The main elements of the function of Revenue Management --Comprehend Revenue Management terms and definitions --Comprehending your customers’ pathways to booking or reservations --How customers shop for accommodation --Learn what drives customers search and selection process --Learn what influences their choices during their search (including travel agents) <Market Segmentation --Defining segmentation --Why hotels segment their markets --How to define each segment e.g. Corporate, Events, Wholesale, Retail etc. --Is a channel the same as a segment? --How to use this segmentation to gain insights and improve bottom line results --Understand different consumer behaviours in difference channel --Understand the different terms and strategies around using Segments vs Channels vs personalised offer. NOTE: one must clearly distinguish between market segmentation and customer segmentation. Will like to pursue market segmentation and customer segmentation activities with data to become tangibly familiar and competent at least. <The Hospitality Industry --What are the fundamental principles of economics and their role in Hotel Revenue Management? --How do Revenue Directors monitor and measure their competitor marketplace? --How do Hotel Managers identify true competitor properties? --How do you read competitor reports and use other data to derive strategic insights, and use the data to make better decisions? Distribution --Definition of Distribution within the Accommodation sector --Definition of accommodation Inventory and how it is managed --Types of distribution channels --Factors of the Cost of Sale --Steps to implementing a successful Distribution Strategy --Important role of technology in a Distribution Strategy --Definition of Rate Parity and its role in Distribution <Forecasting --What are the different types of forecasts? --What are the objectives for each of the types of forecasts? --What information do I need to put a forecast together? --How do I find this information? --What questions should I ask when putting together a forecast? --How often should I be adjusting the forecasts? --What are the steps that I need to follow to put the forecast together? --What is the difference between unconstrained and constrained demand? --What are the elements of an accurate forecast? <Revenue Strategy --To understand the components of a good revenue strategy --Different revenue strategies explained --Pricing Strategy --Different types of pricing explained – what and why: BAR, Rack, Group, Corporate, Tactical vs Strategic pricing, Mobile only pricing – why? Wholesalers, Static vs Dynamic rates, Corporate & Event, Opaque Pricing, Length of Stay Pricing, Loyalty clubs and Closed User Group rates. Additionally, what technologies and software can be applied for optimal modelling and analysis of pricing methodologies w.r.t. time invested? --Exercises in how to use the Revenue Strategy to manage day-to-day tactics --Inventory Control- how inventory can impact sales. If forecasting constraint, monitor to ensure controls do not have too big an impact and adjusting strategy where necessary and why revenue managers might withhold inventory. <Hotels Room Pricing --Packages/ promotions/ Discounting – Discounting –what additional volume required if I discount my price? Is a lower price generating new demand? --Understanding the impact on discounting -How to calculate Occupancy needed to offset discounts --Understanding the influences on pricing including decoy and anchor pricing --Lead time and its impact on pricing --Displacement Analysis --Contracts --Technology available to monitor and manage pricing --Integrating pricing knowledge into a broader organizational framework (ask ChatGPT or something). Means to implement. PHASE 2 (Revenue Management) Will have walkthrough and logistical sessions for Revenue Management. Followed by its implementation. R environment. AIRLINE INDUSTRY Note: open to Operations Management/Operational Research The following two literature concern operations planning or development for airlines in the real world --> -Traffic Forecasting and Economic Planning Workshop, International Civil Aviation Organization, FEPW (Cairo)-WP/5 2010: https://www.icao.int/MID/Documents/2010/fepw/docs/fepw_wp05.pdf -ICAO Forecasting Manual Concerns with development --> Comprehensive understanding of the development process, and the choosing the best models to be implemented. Models will range from deterministic to stochastic. Will like to develop validation through case studies of airlines to critique application of real airline/airport data. Data sources examples --> ICAO Economic Development (https://www.icao.int/sustainability/Pages/Statistics.aspx) UK Civil Aviation Authority (Airline Data) https://data.gov.uk/search?filters%5Bpublisher%5D=Civil+Aviation+Authority UBC Transportation Industry: Air (https://guides.library.ubc.ca/transportation_air/stats ) FAA Data & Research Bureau of Transportation Statistics OAG, MIT Global Airline Industry Programme (Airline Data Project) Kaggle R environment --> R with R studio and packages of interests will provide the idealistic environment for pursuits; use of the typical deterministic optimisation packages, and as well, having stochastic and statistical prowess R Packages specifically for Multi-objective programming, Goal programming, and 90C29 (if needed): caRamel, GPareto, mco, emoa, rmoo Note: activity may not explicitly treat segmentation with customers with routes and forecasts; likely leading to more technical sensitivities. SERVQUAL, weighted SERVQUAL, SERVPERF and weighted SERVPERF in the field NOTE: also open to Public Administration students concerning public services and private sector services to the public. 1. SERVQUAL Parasuraman, A, Ziethaml, V. & Berry, L.L. (1985), "SERVQUAL: A Multiple- Item Scale for Measuring Consumer Perceptions of Service Quality' Journal of Retailing, Vo. 62, no. 1, pp 12-40 Parasuraman, A., Berry, L.L. and Zeithaml, V.A., (1991) “Refinement and Reassessment of the SERVQUAL scale,” Journal of Retailing, Vol. 67, no. 4, pp 57-67 2. Find Weighted SERVQUAL literature 3. SERVPERF Cronin Jr, J. J., & Taylor, S. A. (1994). SERVPERF versus SERQUAL: Reconciling Performance-Based and Perceptions-Minus-Expectations Measurement of Service Quality. The Journal of Marketing, 125-131. Jain, S. K., & Gupta, G. (2004). Measuring Service Quality: SERVQUAL vs. SERVPERF Scales, Vikalpa, 29(2), 25-37. 4. Find Weighted SERVPERF literature for pursuits MERMI and possible alternatives PART A -Performance Measurement (analyse & implement for ambiances of interest) Operations (some applicable to hotels and restaurants, vehicle rentals) Intensions of the model; pros and cons; model analysis; logistics; implementation; comparative analysis. Note: some models may be extension of others so develop constructively. ADR, RevPAR, RevPOR, GOPPAR, TRevPAR, NRevPAR, ARPA ProPASH and ProPASM González, A.B.R., Wilby, M.R., Díaz, J.J.V. et al. Utilization Rate of the Fleet: a Novel Performance Metric for a Novel Shared Mobility. Transportation (2021). PART B Analyse the given journal articles, determine the logistics, sources to acquire data and means to incorporate such data to replicate such evaluations. Other (or prior) evaluation metrics to develop and compare with MERMI. Assisting literature for MERMI: Talón-Ballestero, P., González-Serrano, L. & Figueroa-Domecq, C. (2014). A Model for Evaluating Revenue Management Implementation (MERMI) in the Hotel Industry. Journal of Revenue and Pricing Management. Aug 2014, volume 13, issue 4, pp 309–321 Rodriguez- Algeciras, A. & Talón-Ballestero, P., (2017). An Empirical Analysis of the Effectiveness of Hotel Revenue Management in Five-Star Hotels in Barcelona, Spain. Journal of Hospitality and Tourism Management 32, 24-34 FINANCE Finance degree endeavors reside under Business. --Core Courses (constituted by the following 3 different components): 1. Communication << Business Communication & Writing I & II, Enterprise Data Analysis I & II, International Financial Statement Analysis I & II, Corporate Finance >> 2. Financial Commerce << Corporate Valuation, Venture Capital, Mergers & Acquisitions, International Commerce >> 3. Investment & Derivatives << Theory of Interest for Finance (check COMPUT FIN); Investment & Portfolios in Corporate Finance; Options & Futures for Business Management; Personal Finance (check Actuarial) >> --Mandatory Courses: Calculus for Business & Economics I-III, Introduction to Macroeconomics (check ECON), Money & Banking (check ECON), Probability & Statistics (check Actuarial post), Mathematical Statistics (check Actuarial post) --Special Required Electives Tracks: Option 1: Financial Accounting, R Analysis (Actuarial post), Commercial Bank Management, Bank Risk Management Option 2: Financial Accounting, Corporate Auditing, Investment Banking, Corporate Risk Management Option 3: Financial Accounting, Strategic Business Analysis & Modelling, Investment Banking, Corporate Risk Management Option 4: Financial Accounting, Corporate Auditing, Strategic Business Analysis & Modelling, Corporate Risk Management Option 5: Financial Accounting, Strategic Business Analysis & Modelling, Corporate Risk Management, R Analysis (Actuarial post).
NOTE: for Probability & Statistics, Mathematical Statistics check Actuarial post. NOTE: for some finance courses sources such as the following may prove useful: https://www.sec.gov/oiea/Article/edgarguide.html In general know how to use SEC Edgar (other foreign counterpart) when needed. Not necessarily all data to be found there Specific course descriptions below: Enterprise Data Analysis I Learning the key functions of Microsoft Excel. You will learn how to use it for general business activities such as problem solving, presentations, as well as general personal use. It's assumed each student possesses computer skills. Enterprise tools and techniques using modern data analysis tools. Introduction into basic and advanced functions in order to build a strong foundation for performing mathematical and analytical functions and analysis. Review of spreadsheet fundamentals, formulas, graphing, data slicing with pivot tables, and dashboard development. Managing and analysing enterprise data with spreadsheets. This course will involve individual spreadsheet work as well as multiple team projects demonstrating data organization, management, presentation, and analytical techniques. At the completion of this course students will be able to: Import, format, and validate data from multiple sources. Perform excel functionality to format and manipulate data. Evaluate personal and business problems and determine the best course of action. Understand how to format data and perform advanced formula functionality Evaluate problems and determine the best course of action Present data findings in a visual format for easy comprehension Course Grade Constitution --> Attendance & Participation Homework Assignments Labs (applications intensive) 3 Data Projects Data Analysis Project Data Analytics Project Project Management (Gantt charts and dashboards) Midterm Exam Final Exam Textbooks & Tutorials: TBA Tools to be used throughout course --> Excel YouTube Microsoft learning: https://docs.microsoft.com/en-us/learn/browse/ Course Outline --> Overview, navigation, Excel basics and cell referencing Importing and Validation of Data Formatting and Math Functions Lookup and Business Math Functions Charting and Pivot Tables Visualizing Data Advanced Formatting and Functions Pivot functionality, charting, graphing Problem Solving Functions Financial Functions Data Analytics Process Project Management Co-requisite (for BUS, ECN, PS, PA, ACTUAR and COMPFIN majors only): International Financial Statement Analysis I Enterprise Data Analysis II Course is roughly 2 hours per lecture. Course meets in a computer lab regularly, and/or students will make use of their personal computers in room. Objective --> Customarily progression in Excel rides on specifically what projects one is trying to accomplish; fiddling blindly in Excel isn’t really productive at all. MS Access is used for working with large datasets. Texts: TBA Tools to be used throughout course --> MS Excel MS Access YouTube Microsoft learning: https://docs.microsoft.com/en-us/learn/browse/ Course Grade Constitution --> Homework Prerequisite Refreshers: assignments encountered in prerequisite given at various times to stay fresh. Scheduled Evaluations: three in-class computer-based evaluations. Based on a combination of prerequisite skills and content covered in all course activities (readings from the text, outside reading materials, discussion questions, lab activities, and course case studies). NOTE: gov’t data with Excel and Access may be substitutes for other data that may be deemed sensitive. Treasury, Economics, Labour, Census, NIH, FDA, USDA, UNCTADstat, Provincial public administrations, Municipal public administrations, SEC, FTC, IGOs, etc., etc. 7 Projects: course will emphasize applications. Your skills and self-sufficiency will be put to the test. Some projects will have same due dats. Quantitative Grading formula --> Attendance Homework Prerequisite Refreshers 3 Scheduled Evaluations Projects Course Outcomes (Mandatory) --> · Construct, modify, and print a professionally designed and formatted spreadsheet. · Create and manipulate various types of charts and enhance charts with drawing tools. · Create and use basic formulas and functions. · Create and use complex and advanced formulas and functions from each category of functions provided by Excel. · Create macros, customize toolbars, and create command buttons · Utilize XML for data exchange · Using named ranges, create a database and perform the following: sort, filter, advance filter, and extract. · Analyze lists and databases using database functions · Create Pivot tables, use Solver, Scenario, and Goal Seek for data analysis. · Using Excel and OLE, share data with other applications. · Using various Excel tools, perform what if analysis and projections on business data. · Create 3D worksheets, 3D workbooks, and 3D formulas. · Validate and control data entry. · Perform trend analysis. · Perform Web Queries · Perform SQL Queries · Explore and utilize the various tools provided by Excel for use in a business environment. Projects (not necessarily done on given order) --> HR PERSONNEL, INVENTORY & SUPPLY Techniques Applied: Spreadsheet Constructions Basic tools/techniques/skills that are applicable and practical with HR pursuits, inventory and supply chain. APPLICATIONS IN CORPORATE FINANCE & INVESTMENTS Case 1: Investment Portfolio Analysis Techniques Applied: Advanced formulae Charting & Presentations Grouping data Scenarios/What-if Analysis Data Tables/Break Even Analysis Case 2: TVoM, Loan Analysis, Cash Flow Analysis Techniques Applied: Advanced Formulae Functions Goal Seek Case 3: Depreciation Schedule Analysis Techniques Applied: Functions What-if analysis Change tracking and collaboration Goal seek PROJECT MANAGEMENT Case 1: Gantt charts Project goal(s) Project structure & logistics Parameters and constraints Assigned personnel Macros Case 2: Dashboards with pivoting, lookups, etc. APPLICATIONS IN HUMAN RESOURCES Case 1: Employee and Payroll Decision Making Techniques Applied --> Working with large datasets Lookup Tables Filtering Multiple worksheets linking Advanced formulas and macros Charting and presentations LINKING MULTIPLE SPREADSHEETS. DATASETS WITH MS ACCESS Case 1: Import, Link and Integrate Spreadsheets into Tables. Extractions. Techniques Applied: The need for more powerful databases Relational database concept Excel vs. a relational database Table creation & table field properties Importing spreadsheets Table relationships Import, Link and Integrate Spreadsheets into Tables Spreadsheets Extractions DATABASES (ACCESS, XBRL, SQL, XML) Relevance of Excel with DBMS: introspection, queries and analysis Involves .csv. .xlsx, .accdb, SQL Government (departments, agencies, bureaus, administration), international government organisations, etc., etc. Making .accdb files and conversion to Excel Excel with SQL Understanding parameters with XBRL for financial data requests and organising data XML integrability/extraction EXPLORATORY DATA ANALYSIS (External Sources, Excel and Access) Techniques Applied: Introspection, Queries and Recognition of Data Sizes Developing Correlation Matrices (bivariate and higher) Extracting Variables Followed by conditions of interest Summary Statistics for variables Distribution of each variable Scatter Plots among variable pairs Regression (with summary statistics) Basic Time Series Analysis Prerequisite: Enterprise Data Analysis I Co-requisite (for BUS, ECN, PS, PA, ACTUAR and COMPFIN majors only): International Financial Statement Analysis II International Financial Statements Analysis I Course examines the accounting process, transaction analysis, asset and equity accounting, financial statement preparation and analysis, and related topics. A study of analysing, classifying, and recording business transactions in both manual and computerized environment. Complete the accounting cycle, prepare financial statements. Course Literature --> Textbook TBA Mandatory Resource Guides: GAAP or IFRS or ambiance preference Tools --> Microsoft Office 365 Microsoft Dynamics Management Reporter Microsoft learning: https://docs.microsoft.com/en-us/learn/browse/ Course will make use of financial statements of private companies, NGOs and public administration to be practical and to gain real exposure. NOTE: students will learn how to access proper official data. Assessment --> Assignments & Analysis Sets Quizzes General Labs XBRL Student Project 3 Exams Overview of Assessment --> Each module will be accompanied by Assignments & Analysis Sets. Lab(s) will take on multiple modules. Each lab will have analytical activities, computational exercises and development with Microsoft tools. Quizzes will reflect Assignments & Analysis Sets, and some elements of labs (analytical activities and computational exercises) XBRL Project concerns proper application of data for active commerce and regulations. TOPICS --> Accounting Process Financial Statements (Types, Structure, Formulas, Procedures & Logistics) Chosen, Assets and Liabilities (classifications, valuation, earnings and taxes) Time Value of Money Construction of Financial Statements (with assets and liabilities) Evaluation of Financial Statements (of the major types) Adjusting Entries Financial Statements Process for Developing (9 - 12) Measures Profitability Efficiency Liquidity Debt structure and risk Information, decision making, and financial markets Co-requisite (for BUS, ECN, PS, PA, ACTUAR and COMPFIN majors only): Enterprise Data Analysis I International Financial Statements Analysis II Advance treatment for topics from prerequisite and introduction to advance analysis. Course Literature --> Textbook TBA Mandatory Resource Guides: GAAP or IFRS or ambiance preference Tools --> Microsoft Office 365 Microsoft Dynamics Management Reporter Microsoft learning: https://docs.microsoft.com/en-us/learn/browse/ Course will make use of financial statements of private companies, NGOs and public administration to be practical and to gain real exposure. NOTE: students will learn how to access proper official data. Assessment --> Assignments & Analysis Sets Quizzes General Labs XBRL Student Project 3 Exams Overview of Assessment --> Each module will be accompanied by Assignments & Analysis Sets. Lab(s) will take on multiple modules. Each lab will have analytical activities, computational exercises and development with Microsoft tools. Quizzes will reflect Assignments & Analysis Sets, and some elements of labs (analytical activities and computational exercises) Exams (will reflect all priors) XBRL Project concerns proper application of data for active commerce and regulations ADVANCE IMPLIED TOPICS/TASKS -- Accounting Process Financial Statements (Types, Structure, Formulas, Procedures) Chosen, Assets and Liabilities (classifications, valuation, earnings, taxes) Time Value of Money, Loan Analysis, Cash Flow Analysis Construction of Financial Statements (with assets and liabilities) Adjusting Entries Evaluation (of the 3 major types) of Financial Statements Adjusting accounts or financial statements towards measures (profit, efficiency, liquidity, debt). About 9-12 measures in total. MANDATORY TOPICS/TASKS (comprehensive) -- Horizontal Analysis (HA) Vertical Analysis (VA) Trend Analysis Prerequisite: International Financial Statements Analysis I Co-requisite (for BUS, ECN, PS, PA, ACTUAR and COMPFIN majors only): Enterprise Data Analysis II Corporate Finance This course presents the foundations of finance with an emphasis on applications vital for corporate managers. NOTE: course will be immersive applications intensive and wide range for each module. NOTE: computing in this course is needed. I will not provide summarized data towards formulas and models for you. In this course it’s critical that students build integrity and self-reliance; be prepared to pursue data from various sources independently, because in the real world such is required to be deemed competent. Computational Skills --> Alongside manual computation, all modules will also have emphasis on much use of spreadsheets and/or R with computation. Realistic finance highly goes beyond the pen and paper. Alongside the analytical and manual tasks, R and Microsoft software use will arise often. Financial Statements Analyses --> Your accounting skills will be tested without restraint, based on Balance Sheets, Income Statements, Cash Flow Statements. Tasks often may not be direct, say, ingenuity skills. For various assigned firms students are responsible for applying horizontal analysis, vertical analysis, cash flow analysis. Adjusting accounts for financial statements for ratios analysis. Concerns profitability, liquidity, debt, efficiency. Applications --> The given applications in the syllabus will be hands-on, requiring students to gather data from appropriate sources. Instructor provides interpretation of concepts and the logistics, then students must follow through. Cases --> Cases will be available on technology platform used. Students can make groups of up to 4 constituents for cases. Cases will serve to challenge students with course topics. Note: all topics in course outline will be treated. Note: a single case can/will incorporate multiple topics to test your knowledge and understanding. Note: for each case prior applications can show up any time when required. Exams --> The 2-3 exams are open-book and you are free to bring a calculator to the exam (recommended). As well, exams will also make use of a computer lab or personal computers. You should know for a particular question whether computer usage makes sense or not. Exams will reflect computational skills, financial statements analyses, applications, and cases (all different to those encountered). Also expect to gather data, say, gathering financial statements and markets data on your own for tasks. Some tasks will require the mentioned tools. For questions on instruments, if R packages are used, such must be complemented with manual development. Tools --> Real financial statements (balance sheets, income statements & cash flow statements) from SEC or whatever Capital Markets data Microsoft 365 Microsoft Management Reporter Microsoft learning: https://docs.microsoft.com/en-us/learn/browse/ Packages: FinCal, jrvFinance, tvm, YieldCurve, BondValuation NOTE: course will be applications intensive and wide range for each module. Namely, applications for module topics will be treated in a manner where logistics and tools are meaningful and practical to be put to work involving the quantitative aspects. Textbook of consideration --> Corporate Finance, Berk & DeMarzo, Pearson - Prentice Hall Assessment --> Assignments: computational skills, financial statements analyses Applications Cases 2-3 Exams Outline --> 1.Salutations and expectations. Technology tools applied for materials 2.Time Value of Money Chapter sections 3.1, 4.1 – 4.3, 4.5 – 4.8, 4Appendix, 5.8 Applications: NPV, IRR, MIRR, Accrued Interest, Valuing zero-coupon bonds; Valuing coupons; Valuing and structuring annuities and perpetuities; Savings, Retirement planning 3.Interest Rates Chapter sections 5.1 – 5.3, 5.5 Applications: Bonds, Savings vehicles, Mortgage financing and refinancing decisions. Note: discrete and continuous compounding expected for zeros and bonds with coupon + principal relevant to valuation, accrued interest, effective interest, NPV, IRR, MIRR). 4.Discounting Cash flow (DCF) Analysis Chapter sections 2, 3.1, 3.3, 7.1, 8.1 – 8.4 Applications: Strategic Decision-Making, Capital Budgeting, Financial Statement Analysis, Strategic Decision Making with Resource Constraints Case 1 5. Return on Investment Chapter section 7.2, 7.4 Applications: Amortizing Loans, Personal Finance (auto loans, leases, mortgages), Financial Negotiating Strategies Case 2 6. IPO Model & Prospectus Initial Public Offering Model: structured process firms follow to become a publicly traded company. Kenton, W. (2022). SEC Form S-1: What It Is, How to File It or Amend It, Investopedia Murphy, C. B. (2022). What is a Prospectus? Example, Uses, and How to Read It. Investopedia. Applications: groups will be assigned 2-3 firms for s1 documentation and prospectus analysis 7. Fixed Income Securities Chapter sections 3.4, 3.5, 6.1 – 6.5, 6Appendix, 30.4 Include comprehending bond ratings NOTE: module 3 will come back to haunt. Will make it so. Applications: Valuing and investing in treasury securities, Managing a bond portfolio Case 3 8. Listings & Valuing Stocks Hayes, A. (2021). Listings Requirements. Investopedia Comparative view of requirements for NYSE, NASDAQ, LSE, TSX, BSE, and arguments for listing preferences Stock valuation methods: DDM, DCF, AEVM, Comparables Analysis Concepts, logistics and implementation Chapter sections 9.1 – 9.4 augmented by priors Fernando, J. (2022). Earnings per Share: What does it Mean and How to Calculate It. Investopedia Applications: stock valuation, EPS types, Mergers and Acquisitions, Corporate defenses Case 4 9. Non-Publicly Traded Appraisals Investopedia Articles Liberto, D. (2021). Appraisal Method of Depreciation Bloomenthal, A. (2021). Appraisal Approach: Definition, How Process Works, and Example Best Online Auction Websites Based on intelligence and skills acquired from priors will choose items under various categories among different auction websites, observing auctions and bids. Note: alternatives to website data is the Kaggle repository and others. Bids (and possibly timing of bids) will be needed. Then students will apply depreciation methods. Namely, APMoD versus AA; real estate methods from Bloomenthal. How do overall bids and winning bids compare to your valuations and initial average retail price? What can be speculated? Note: other useful “blogs” -> Liberto, D. (2022). Straight Line Basis. Investopedia Slater, S. (2017). How Do Appraisers Determine Depreciation? Linkedin Kimatu, E. (2021). Depreciation Methods: 4 Types with Formulas and Examples, Indeed Collectables Why do collectables grow in value? What models determine valuation and how to apply? Can one apply both depreciation appraisal and collector appraisal? If so, observe deviations. 10. Capital Gains and Capital Losses Chen, J. (2021). Capital Gains: Definition, Rules, Taxes, and Asset Types, Investopedia For Capital Assets and Financial Assets with real market data will determine CG or CL with tax rules of ambiance considered. Moskowitz, D. (2022). How Collectibles Are Taxed. Investopedia 11. Risk and the Cost of Capital Chapter sections 10.1 – 10.8 Applications: Portfolio management Case 5 12. CAPM Chapter sections 11.7 and 11.8, 12.1 – 12.6 Applications: CAPM stock valuation (versus comparables, DDM, DCF, AEVM), Portfolio management, Capital budgeting, CAPM for risk and premiums. Extending CAPM to multi-factor extensions to treat prior applications. Case 6 13. Corporate Capital Structure Chapter section 14.1 – 14.5, 15.1 – 15. 5, 16.1 – 16.4 Applications: Industry Capital Structure, Optimal Capital structure, Refinancing, Share Repurchase Programmes Case 7 14. Corporate Annual Report (CAR) & Quarterly Corporate Earnings (QCE) CAR - Sources for official data. How to efficiently read a CAR QCE - Tuovila, A. (2022). Guide to Company Earnings. Investopedia Applications: Implementation practice for CAR and QCE 15. Shareholders and Dividends Concepts. Why do firms pay dividends or repurchase shares? Dividend policy types (stable, constant, and residual) Where to find such information about firms’ dividend policy? Automatic Dividend Reinvestment Plan (DRIP) When is a company's dividend payout ratio optimal Can dividends be considered a sign of a company's financial health? 16. PESTLE Analysis and SWOT Analysis Framework and logistics for implementation Applications: implementation practice for multiple firms Case 8 5C Analysis among 2-3 firms Note: will be quite computational 17. Introduction to Advance Uses of Financial Statements (2 weeks minimum) Building a Three Statement Model Building pro forma statements: assumptions and development Note: module 16 to be relevant. Applications: implementation practice for both prior topics Case 9: application to the 2-3 competing comparables applied in case 8. 18. Predicting Financial Distress with Statistical Models Altman’s Z-Score and Ohlson O-Score Applications: scores in practice comparatively for various firms. Prerequisite: International Financial Statement Analysis II Financial Accounting Course Objectives --> (1) understand how a company’s operating and financing transactions create corporate wealth and risk. (2) develop an intuitive feel for when and how financial reports communicate the prospective and final outcomes of transactions. Reference Textbooks --> Hamlen, S. S. (2019). Advanced Accounting, Cambridge Business Publishers Reference Textbooks (for technology immersion) --> Hanlon, M., et al. (2019). Financial Accounting, Cambridge Business Publishers Stickney, Clyde P., and Roman L. Weil. (2003). Financial Accounting: An Introduction to Concepts, Methods, and Uses. Thomson South-Western Note: prerequisites are prerequisites. Required Resources --> 1. The U.S. SEC's HTTPS file system allows comprehensive access to the SEC's EDGAR filings by corporations, funds, and individuals; disseminated to the public through the EDGAR dissemination Service. Dissemination stream also populates the EDGAR public database on sec.gov, which can be researched through a variety of EDGAR public searches. One may be interested in possible APIs, introspection and queries. Other foreign ambiances likely will have all such abilities. 2. Official financial accounting standards of respective ambiance; IFRS and/or possible interest in comparative study to treat course topics. Required Tools --> Office 365 Microsoft Dynamics Microsoft learning: https://docs.microsoft.com/en-us/learn/browse/ Course Grade Constitution --> Assignments Labs Quizzes (based on prerequisites and current course) 3 Exams (will reflect quizzes and open notes) Groups Term Project: A + B GROUPS TERM PROJECT PART A --> Student groups will be given a (large) portfolio of assets, liabilities and transactions at one given date and time to develop the three major financial statements for a future date and time. Students will apply all their knowledge and skills from focus course topics and prerequisites. Then to implement the following upon the to be developed financial statements: Horizontal Analysis, Vertical Analysis, Cash Flow Analysis Adjusting accounts/statements towards at least 6-9 ratios Profit, efficiency, liquidity and debt Computing the following measures: EBITDA, NOPAT, NOPLAT, Operating Cash Flow, EVA GROUPS TERM PROJECT PART B --> Determine Net Worth. Following, identify any concerns or questionable things that may lead to scrutiny of net worth calculated. GROUPS TERM PROJECT PART C --> Pro forma financials development and reporting. Groups will be assigned 2 companies/firms to develop pro forma financials based on acquired financial data and given outline of features and expectations. FOCUS COURSE ELEMENTS (TOWARDS IFRS STANDARDS) --> Profile/characterisation of organisation Law and regulation for corporate/business accounting, financial reporting, securities exchange and trade. The Accounting Process & Balance Sheet Financial Accounting and Firm Value Rapid topics Cash and Cash Equivalents Payables Receivables Bond valuation Fixed and floating (interest on both purchase price and coupon) Discrete compounding and continuous compounding Accrued interest, Effective Interest Rate, APR, APY Issuing and Investing in Debt Securities Equity valuation models Equity returns Issuing and Investing in Equity Securities Valuing liabilities Long-term and short-term liabilities. Maturity matching AND alternatives Securitizations & VIE Stock-Based Compensation Earnings per Share Derivatives Forwards Price or premiums Options Premiums, are composed of the sum of its intrinsic and time value; expiration date or exercised time Foreign currency translation, foreign currency transactions Currency Swaps: structure, gains and losses Real Estate Valuation Prediction Models for Real Estate Determining variables for real estate price in respective region Hedonic Pricing for properties or rents Intangible Assets Calculating Intangible Value Methods Relief from Royalty Method (RRM) Multiperiod Excess Earnings Method (MPEEM) With and Without Method (WWM) Real Option Pricing Replacement Cost Method Less Obsolescence Collectively: Kenton, W. (2021). Calculated Intangible Value (CIV), Investopedia Accounting Changes & Error Corrections Earnings and Income Taxes Subject to most of the prior focus topics Off-Balance Sheet financing Reporting Requirements Constructing financial statements: balance sheet, income statement, cash flow statement Firm Valuation Liquidations Partnerships Corporations Building a Three Statement Model Building pro forma statements: assumptions and development Forecasting based on priors Mergers and Acquisitions Post Acquisition Consolidation Prerequisites: International Financial Statement Analysis II Corporate Auditing The objectives include principles and practices used by internal auditors (and public accountants) in examining financial statements and supporting data. Special emphasis is given to assets and liabilities. This course is a study of techniques available for gathering, summarizing, analysing and interpreting the data presented in financial statements and procedures used in verifying the fairness of the information. Also emphasizes ethical and legal aspects and considerations. Course Literature --> Louwers, T. et al (2021). Auditing & Assurance Services. McGraw Hill Supporting Texts --> Messier Jr, W., Steven Glover, S. and Douglas Prawitt, D. (2019). Auditing & Assurance Services: A Systematic Approach. McGraw Hill Arens, A. A. et al (2019). Auditing and Assurance Services, Pearson Assessment --> Assignments Quizzes Exams Labs Will apply the auditing process upon the institution’s financial data...likely being the only resource allowed to do such, because firms don’t want to be done-in by amateurs. Groups given unique college programmes or public services or assets Financial Statements Integrity Groups Assignment Based on module 6. Each group assigned 2-3 firms to apply ALL the measures and models from the three articles; assigned programmes of the university or college as well. Course Outline --> MODULE 1: Coverage Audit Process: Start to Finish Reports on audited financial statements Reading Auditing and Assurance Services / RISK Management Fraud and Audit Risk Professional Standards Appendix: Legal Liability Appendix: Professional Ethics MODULE 2: Engagement Planning Management Fraud and Audit Risk Risk Assessment: Internal Control Evaluation Audit Plan Cash Internal Controls Questionnaires MODULE 3: Acquisition and Expenditure Cycle Production Cycle Revenue and Collection Finance and Investment International Controls Questionnaire MODULE 4: Sampling Attributes Variables Review: Audit Evidence; Audit of Cash MODULE 5: Completing the Audit Reports on Audited F/S Other Public Accounting Services Internal, Governmental, and Fraud Audits Auditing in a Computerized Environment MODULE 6: Regulations for off-balance-sheets activities, and requirement of making notes, and providing detailed disclosures in quantitative and qualitative statements SPVs and Partnerships Financial Statements Integrity Bloomenthal, A. (2021). Detecting Financial Statement Fraud. Investopedia How to Detect and Prevent Financial Statement Fraud, Association for Fraud Examiners. VI. General Techniques for Financial statement Analysis. Association of Certified Fraud Examiners Padgaonkar, D. (2021). How to Detect Fraud in Your Company’s Financial Statements. Forbes Beneish Model, Dechow F, Modified Jones, Altman Z, Ohlson O-Score Case studies: (1) Logistics and implementation of the mentioned analyses (horizontal, vertical cash flow, etc., etc.), prior models, laws and scores upon financial statements from the prior three literature. (2) Will analyse various past legal cases via financial data from SEC, firm repository, affidavits, tax filings, court documents and rulings. Will apply various analyses, financial ratios, laws, scores and models from the prior three literature. Prerequisites: Financial Accounting Corporate Valuation Course will meet for AT LEAST 2 hours per session for 2 days per week. This course covers business valuation, and equity valuation. While the course is designed first and foremost to be very practical, the tools and methods covered in this course are presented in the framework of generally accepted financial theory. Overall, in course one doesn’t expect students to remember every technical detail by hand concerning mechanics and computation, hence, formulas will be naturally given on quizzes, exams and cases and projects; understanding what you’re doing, and competently completing real world tasks with real external data is what’s essential. Tools and resources that will apply in this course --> General financial statements Balance Sheets Income Statements Cash Flow Statements SEC Data UPENN WRDS databases + CRSP/Compustat Merged Database (CCM) Crunchbase Course Grade Constitution --> Homework will be advance reinforcement of assignments (computational skills, financial statements analyses) and applications done in the corporate finance course. Financial Statements Analysis Quizzes Valuation Cases (8-10) based on all modules Small Business Valuation Group Project Multiple valuation methods to implement BreakUp Value (2) Valuation vs Performance Ratios vs Industry Perception (2) Course Literature --> TBA Classroom Policies --> I encourage the class to self-regulate and determine its own standards regarding classroom policies, and contemplate the possible consequences for violating them. Variables of interest: Attending class and punctuality (self-explanatory) Use of laptops. There are abundant cases where learning is enhanced by the use of laptops. Else, figure out what will lead to catastrophe. Turning in your assignments on due dates Conduct (behaviour, plagiarism, sabotage) COURSE TOPICS: --Will have review of the 3 major financial statements and recognise the purposes they serve in valuation; will strongly resonate. Hence, students must exhibit ability to determine necessary data from fetched financial statements; I generally will not give them to you. --Following, a broad overview and discussion of valuation techniques. There are a number of different ways to try and determine the value of a company, and it's almost always good practice to use more than one valuation method. --Small Business Valuation Income Based Approach EBITDA Seller’s Discretionary Earnings: SDE Multiple -> SDE Comparative analysis of advantages and disadvantages of income based approaches EBITDA, Operating Cash Flow, NOPLAT, EVA Can any of the above latter 3 be a strong substitute for EBITDA or SDE? Asset Based Approach Book Value Adjusted Net Asset Method Excess Earnings Valuation Market-based approach—checking what comparable companies sold for Discounted Cash Flow Analysis (likely NOPLAT based also of interest) Implied Topics Our discount rate discussion involves determining the firm’s cost of capital – both debt and equity capital – and the effect of leverage (debt) on the firm’s cost of equity and the firm’s overall cost of capital. Will also treat the use of CAPM and multi-factor models as alternatives. Case of cost of equity solely as the discount rate. Following our discount rate discussion, we cover valuation effects of a firm’s capital structure. Adjusted Present Value (APV) APV versus DCF Note: Small Business Valuation Group Project. Groups assigned two small business to develop analysis based on various prior topics. --Real Estate Valuation Note: emphasis on identifying which method(s) account for volatility best. Sales Comparison Approach, Cost Approach, Income Capitalization Approach, Cap Rate, Value per Gross Rent Method, DCF application. Prediction Models for Real Estate Value Determining variables for real estate price in respective region Hedonic Pricing for properties or rents --Calculating Intangible Value Methods Relief from Royalty Method (RRM) Multiperiod Excess Earnings Method (MPEEM) With and Without Method (WWM) Replacement Cost Method Less Obsolescence Collectively: Kenton, W. (2021). Calculated Intangible Value (CIV), Investopedia --Corporate Valuation What valuation methods treated earlier will be relevant/applicable to high value corporate firms? Additional Essentials (also contrast with earlier relevant methods): P/E FCF to Equity Earnings Multiplier Abnormal Earnings Valuation Model (AEVM) --Control premiums and liquidity discounts --IPOs & Prospectus Initial Public Offering Model Structured process firms follow to become a publicly traded company. Prospectus (tasks oriented) Murphy, C. B. (2022). What is a Prospectus? Example, Uses, and How to Read It. Investopedia IPO Valuation Model --Stock Valuation Methods (SVMs) Review: DDM, DCF, Comparables Analysis How does one gauge or analyse IPOs issued? AEVM --Reinforcement. Going from financial statements to various prior valuation methods Methodology or logistics. Eliminating your jitters/incompetence. --LBO and M&A contexts; earnings accretion and dilution in M&A transactions. --Valuing Financial Institutions --Shares Buy Back Claire Boyte-White (Investopedia) – When Does it Benefit a Company to Buy Back Outstanding Shares? Gopalan, N.(2024). Samsung Stock Surges on $7.2B Buyback Plan, Investopedia Reasoning behind the stock surge. Do all buyback plans (operations) lead to increase in stock value? What is the influence on DCF, AEVM, EBITDA, NOPLAT, Operating Cash Flow and EVA, respectively? --Breakup Value Chen, J. (2021). Breakup Value: What it Means, How it Works. Investopedia Relative Valuation Intrinsic Valuation - DCF model Market Capitalization Times Revenue Method Case studies for breakups with use of non-condensed financial data towards the valuation methods mentioned. Hargrave, M. (2020)Sum-of-the Parts valuation (SOTP) Meaning, Formula, Example. Investopedia DCF Valuation Asset-Based Valuation & Multiples Valuation using revenue Operating Profit or Profit Margins Case studies for breakups with use of non-condensed financial data towards the valuation methods mentioned. --Financial Ratios/Measures and Industry Perception as tangible attractions. Financial Ratios & Measures (single firm) Means of adjusting financial statements Basic Financial Metrics Young, J. (2022). Metrics. Investopedia Recall: EBITDA, NOPLAT, Operating Cash Flow, EVA and P/E Trend Analysis upon various priors (ratios and recall prior) Financial Ratios & Measures (comparables analysis) Extension of the single firm case (for all priors) Data Envelopment Analysis to measure current corporate performance PESTLE and SWOT Review of structure Logistics Trustworthy and robust templates to apply Is PESTEL and SWOT long term or short term? Prerequisites: Enterprise Data Analysis I & II, International Financial Statements I & II, Corporate Finance Co-requisite for finance students: Venture Capital Venture Capital This course focuses on the venture capital cycle and typical venture-backed start-up companies. Covers the typical venture fund structure and related VC objectives and investment strategies, intellectual property, and common organizational issues encountered in the formation of start-ups. It covers matters relating to initial capitalization and early-stage equity incentive and compensation arrangements, valuation methodologies, challenges of fundraising, due diligence, financing strategies, and harvesting. Students critically examine investment terms found in term sheets and the dynamics of negotiations between the owners and the venture capitalist. The course provides the intellectual framework used in the VC process, valuation in venture capital settings, creating term sheets, the process of due diligence and deal structuring. Other learning objectives include building an understanding of harvesting through IPO, divestitures or M&A and strategic sales. The final objective of this course covers the important contractual issues and documents in venture capital deals. Basic transactions documents (BUT not limited to): term sheets; letters of intent; confidentiality agreements; investment contracts/rights agreements; stock purchase agreements; Amended and Restated Certificates of Incorporation; merger agreements and other documents required for M&A transactions; asset purchase agreements; convertible Notes; crowdfunding filings with SEC. AS WELL, will also engage the significance of public notary and the generally accepted entities towards VC. Note: course satisfies the social/society appeasement. Course Assessment --> Class Participation Homework & Quizzes VC Valuation Methods Case Analyses via SEC, VC databases, etc., etc., etc. Mid-term Exam (in-class) Financial Model for VC Post Assessment VC Metrics on market VCs Final Exam Main Texts (expensive) --> Wong, L. H. (2005). Venture Capital Fund Management: A Comprehensive Approach to Investment Practices & the Entire Operations of a VC Firm, Aspatore Book/West DeWolf, D. I., Glaser, J. D. and Roth, E. M. (2021). Venture Capital: Forms & Analysis. Law Journal Press Additional Literature --> Ross, S. (2020). How is Venture Capital Regulated by Government? Investopedia Doherty, V. P. and Smith, M. E. (1981). Ponzi Schemes and Laundering – How Illicit Funds are Acquired & Concealed. FBI Law Enforcement Bulletin Volume: 50 Issue: 11, Pages: 5-11 Stancill, J. M. (1986). How Much Money Does Your New Venture Need? Harvard Business Review Fried, V. & Hisrich, R. (1994). Toward a Model of Venture Capital Investment Decision Making. Financial Management, 23(3), 28-37 Applied Sources/Tools --> Securities Exchange Commission VC databases UPENN WRDS+CRSP+CCM; Pitchbook; Capital IQ; Crunchbase Quizzes & Exams --> VC is one of the most social areas in finance hence on quizzes and exams expect to encounter main topics, the theatre (acts and scenes development), venture debt, valuation and convertible loans. Case Analysis --> Note: concerning case analyses with data, for some firms depending on point in course a respective case will concern particular topics and means of development for such. Example Case study to be segmented: Distributed Denial of Service (DDoS) PART A -- Industry Product and associated technologies, tools, etc. etc. Desired outcomes of services General characterisation of strategies Extent of capabilities/resources Market Landscape (empirical and measurables) Trend, sustainability, and long-term prospects (likely extending prior) Who can and will pay? The Companies For respective company identify unique specifics of product(s) that will provide qualitative value PART B -- Due Diligence preliminaries Firm’s legal standing (licenses, permits, etc. etc.) Raised capital & verification Beta trials and possible referrals. Intellectual property? Availability of first-generation product? Have roughly similar per-box pricing model and ROI argument PART C -- Due diligence second phase Organisational structure Business model/sales strategy Reviews from industry experts, surveys, etc. Patents of products possibility? Development of financial model for revenue projections & scenarios VC valuation methods compared to given value Compare with existing alternative services/solutions: Marketing Winners & Losers, mergers Service and industry effectiveness of alternative solutions Finance & Sustainability Testimonies with previous round VCs: DD and commitment PART D -- In the end, a decision between: More conservative technology with a slight lead in BD and R&D versus More ambitious technology with less visibility, but a better deal Contemplating both investments Financial Model for VC --> Assigned groups for proposed startups or assigned VCs. Understanding the business will greatly help in development (expected). Concern here mainly is strong development for competency, transparency and accuracy: 1. Economy/Industry/market/ 2. Business Model and Business Case 3. PESTEL, SWOT 4. 5C Analysis - CFI Team. (2022). 5C Analysis. Corporate Finance Institute 5. Pro Forma financials development 6. Pre-money valuation: based on 1-4 + lecturing --> VC valuation methods 7. Review and possible amendments for (1)-(5) 8. Build a financial model Some elements of (1) through (7) prior may be relevant Post Assessment VC Metrics on market VCs --> Groups assigned 2-3 VCs from data A to date B via financial statements How to Read Venture Capital Fund Metrics. The 9 Key Venture Capital Metrics: Explained [2023]. (n.d.). https://dialllog.co/venture-capital-vc-metrics Note: exclude last three in article. Horizontal analysis, vertical analysis, cash flow analysis Determination of debt, liquidity, and efficiency ratios. Beneish, Dechow F, Modified Jones, Altman Z Social Return on Investment (SROI) Main Topics --> 1) Defining investment strategy 2) Fund raising process 3) Fund size and portfolio construction 4) Limited Partners Agreement/terms of investment 5) Sourcing investment opportunities 6) Conducting due diligence 7) Venture debt 8) Collateral by convertible loans and other investment types 9) Valuation methods 7) Structuring investment transactions 11) Value creation and evaluation 12) Exit strategies 13) Board culture, composition and orientation 14) Documentation. AUGMENTATIONS (MUST incorporate into course progression when appropriate) --> Investopedia – Private Equity vs. Venture Capital: What’s the Difference? Ben McClure (Investopedia) – How Investment Capitalist Make Choices? How are VC valuation methods different to general corporate valuation methods? Ben McClure (Investopedia) – Valuing Startup Ventures Hudson, M. (2015). The Art of Valuing a Startup. Forbes VC Valuation Methods Scorecard Valuation Methodology First Chicago Method Venture Capital Valuation Method Dave Berkus Method Risk Factor Summation Method The 14 Main Topics along with the Main Texts, Additional Literature, Applied Sources/Tools, and Augmentations will govern the following mandatory “VC Theatre Process” (of various acts and scenes) throughout the course --> TYPES OF VCs: – Angel investors Often with a tech industry background, in position to judge high-risk investments Usually a small investment (< $1M) in a very early-stage company (demo, 2-3 employees) MOTIVATION: – Interest in technology and industry – Dramatic return on investment via exit or liquidity event Initial Public Offering (IPO) of company Subsequent financing rounds – Financial VCs Most common type of VC An investment firm, capital raised from institutions and individuals Often organized as formal VC funds, with limits on size, lifetime and exits Sometimes organised as a holding company Fund compensation: carried interest Holding company compensation: IPO Fund sizes: ~$25M to 10’s of billions MOTIVATION: – Purely financial: maximize return on investment – IPOs, Mergers and Acquisitions (M&A) – Strategic VCs Typically, a (small) division of a large technology company Examples: Intel, Cisco, Siemens, AT&T Corporate funding for strategic investment Help companies whose success may spur revenue growth of VC corporation Not exclusively or primarily concerned with return on investment May provide investees with valuable connections and partnerships Typically take a “back seat” role in funding Funding Process: Single Process – Company and interested VCs find each other – Company makes its pitch to multiple VCs: – Business plan, executive summary, financial projections with assumptions, competitive analysis – Interested VCs engage in due diligence – Technology, market, competitive, business development – Legal and Accounting (structure, permits, licenses, and finance) – A lead investor is identified, rest are follow-on – The following are negotiated – Venture Debt (circumstances) – Company valuation – Size of round – Lead investor share of round – Terms of investment – Process repeats several times, builds on previous rounds DUE DILIGENCE (DD): – Tools – Tech or industry background (in-house rare among financials) – Review Legal and Accounting (updates) – Industry and analyst reports (e.g., Gartner) – Reference calls (e.g., beta’s) and clients – Patents: outline based on Park, H., Yoon, J. & Kim, K. (2012). Identifying Patent Infringement Using SAO Based Semantic Technological Similarities, Scientometrics, Springer, vol. 90(2), pages 515-52 – Visits to company – Gut instinct – Hurdles – Lack of company history – Lack of market history – Lack of market? – Company hyperbole – Inflated projections – Changing economy – Use of PESTEL/SWOT Analysis? 5C Analysis? – Legally Binding and Legally Admissible documentation/tools/resources throughout the VC process TERMS OF INVESTMENT: – Initially laid out in a term sheet (not binding!) – Typically comes after a fair amount of DD – Venture debt (circumstances) – Valuation + investment --> VC equity (share) – Collateral by convertible loans (circumstances) – Other important elements – Board seats and reserved matters – Drag-along and tag-along rights – Liquidation and dividend preferences – Non-competition – Full and weighted ratchet – Moral: these days, VCs extract a huge amount of control over their portfolio companies. BASICS OF VALUATION: – Pre-money valuation V: agreed value of company prior to this round’s investment (I) – Public Notary for VCs To highlight role at different stages with essential documentation throughout VC process – Post-money valuation V’ = V + I – VC equity in company: I/V’ = I/(V+I), not I/V – Example: $5M invested on $10M pre-money gives VC 1/3 of the shares, not being ½ – Partners in a venture vs. outright purchase – I and V are items of negotiation – Generally company wants large V, VC small V, but there are many subtleties… – This round’s V will have an impact on future rounds – Possible elements of valuation: – Multiple of revenue or earnings – Projected percentage of market share BOARDS SEATS & RESERVED MATTERS: –Corporate Boards – Not involved in day-to-day operations – Hold extreme control in major corporate events (sale, mergers, acquisitions, IPOs, bankruptcy) –Lead VC in each round takes seat(s) –Reserved matters (veto or approval) – Any sale, acquisition, merger, liquidation – Budget approval – Executive removal/appointment – Strategic or business plan changes –During difficult times, companies are often controlled by their VCs OTHER TYPICAL VCs RIGHTS: –Right of first refusal on sale of shares –Tag-along rights: follow founder sale on pro rata basis –Drag-along rights: force sale of company –Liquidation preference: multiple of investment –No-compete conditions on founders –Anti-dilution protection – Recompute VC shares based on subsequent “down round” – Weighted ratchet: use average (weighted) share price so far – Full ratchet: use down round share price – Example Founders 10 shares, VC 10 shares at $1 per share Founder issues 1 additional share at $0.10 per share Weighted ratchet: avg. price 10.10/11, VC now owns ~10.89 shares (21.89 total) Full ratchet: VC now owns 10/0.10 = 100 shares (out of 111) –Matters in bridge rounds and other dire circumstances –Right to participate in subsequent rounds (usually follow-on) –Later VC rights often supersede earlier WHY MULTIPLE ROUNDS & VCs: –Multiple rounds –Many points of valuation – Company: money gets cheaper if successful – VCs: allows specialization in stage/risk – Single round wasteful of capital –Multiple VCs –Company: Amortization of control! –VCs Share risk Share DD –Both: different VC strengths (financial vs. strategic) SO WHAT DO VCS LOOK FOR?: –Committed, experienced management –Defensible technology –Growth market (not consultancy) –Venture Capital Metrics –Significant revenues –Realistic sales and marketing plan (VARs and OEMs vs. direct sales force) Corequisite or Prerequisite: Corporate Valuation Mergers & Acquisitions This course covers the broad field of mergers, acquisitions, and divestitures. Students will apply learnt content to real mergers and acquisitions and have the opportunity to present to the class their findings and conclusions. Specific course objectives include: To provide the student a framework for analyzing transactions including understanding strategic rationale, valuation methodologies, deal structures, bidding strategies, and the need for a value proposition. Course Texts --> M&A: A Practical Guide to Doing the Deal, Jeff Hooke, John Wiley & Sons Applied Mergers & Acquisitions, Robert F. Bruner, John Wiley & Sons Ideas in Layman terms: Adam Hayes (Investopedia) – Mergers and Acquisitions – M&A Elvis Picardo (Investopedia) – How M&A Can Affect a Company Legal Framework Literature --> Pantazi T. (2012) The Legal Framework for Mergers and Acquisitions in the European Union and the United States. In: Bitzenis A., Vlachos V.A., Papadimitriou P. (eds) Mergers and Acquisitions as the Pillar of Foreign Direct Investment. Palgrave Macmillan Tools --> Microsoft 365 R + RStudio Required resources --> SEC EDGAR and Databases Financial Statements from SEC domain Balance sheets Income statements Cash flow statements UPENN WRDS databases + CRSP + CCM Capital IQ, Pitchbook, Crunchbase (or alternatives) Tear Sheet sources Yahoo Finance or Google Finance World Wide Web provides a wealth of resources useful for evaluating M&A’s. Procedural Matters --> Student assignments include: A. Being prepared to discuss questions and/or problems that will be posted to “Blackboard” throughout the semester. They do not have to be turned in and will be posted at least 1 week before discussion date. Solutions will not be posted. Discussion questions may also show up in exams. B. Completing assigned cases analyses Completing a midterm and final exam. NOTE: expect to apply all knowledge, skills and tools from prerequisites and this course. C. A team project which will be turned in, and graded, and in addition, will be presented to the class on the dates designated. These team projects are: Analysis of a large M&A transaction. Study of causes and effects of a recent large merger or acquisition. The requirements for each of these team projects are set forth in a later part of this syllabus. Teams of six (6) are to be formed during the first week of class. The group is to email me the members of their team before date dd/mm/yyyy. Any students needing help to get into a team should email me before then. Grading --> Class Participation Quizzes Group Case Assignments Midterm Exam Team Project Report Submissions Final Exam Final Draft of Team Project Report & Presentation Exams --> Notes: students will be permitted to use limited amount of notes for midterm exam and final exam. One component of the final exam will be using the web and data sources for case analyses; all other components of the final exam must be submitted in before proceeding with final exam case analyses. Team Project: – Merger & Acquisition Study; Causes and Effects of a Recent Merger or Acquisition --> The objective of this study is to analyse a recent merger/acquisition announcement to identify the causes and effects of the particular merger/acquisition move. Your group is to choose a merger or acquisition announcement from a given list. Note: in the future team projects, some of these deals may be still pending, or busted-up by third parties, or canceled; expectations for some components to require projections development or “post-mortem” skills incorporated. As well, in some cases, the buyer is a publicly traded company, while in others the buyer is a private firm or a private equity fund. Your group will prepare a paper on the merger or acquisition selected and present your findings to the class. The instructor will inform you of your assigned acquisition or merger by designated date. ESSENTIALS FOR TEAM PROJECT: Project Report Submissions --> Required to submit 3-4 project progression material throughout the term. Includes the following: For each party before the M&A or LBO Financial statements analysis Horizontal analysis and vertical analysis Financial ratios (liquidity, profit, efficiency, debt) and trends 3-statements development, NOPAT, NOPLAT. DCF and APV versus alternative valuations (besides comparables) PESTEL/SWOT development, CFI Team. (2022). 5C Analysis. Corporate Finance Institute Proforma financials Revenue forecasting and Expenditure forecasting Merger structure Intangible value (IV) identification. Is it relevant to a M&A or LBO? Dumont, M. (2021). How Accretion/Dilution Analysis Affects Mergers and Acquisitions, Investopedia M&A model or LBO model development involving synergies Synergies M&A/LBO post valuation M&A/LBO PESTEL/SWOT development CFI Team. (2022). 5C Analysis. Corporate Finance Institute EPS (types and quality) after M&A/LBO Proforma financials after M&A or LBO Revenue and expenditure forecasting for the synergies-M&A/LBO model Realised SROI with the M&A or LBO (if relevant) ADDITIONAL EXPECTED INPUTS: -Your term paper should also have the following A-L “theatre”: A. ECONOMIC SETTING OF BUYER’S INDUSTRY 1.Important characteristics of the industry 2.Challenges faced by the industry over the 5 years prior to the transaction. 3.Industry trends, if applicable, prior to the transaction. 4.Outlook for the industry over next 5-10 years as of time of transaction. B. BUSINESS ECONOMICS REASONS FOR THE TRANSACTION 1.Reasons stated in SEC filings, annual report, and the deal announcement. 2.Reasons stated in financial press. C. STRATEGY D. TERMS OF THE TRANSACTION E. INITIAL REACTION TO DEAL (stock market reaction, security analysts, financial press) F. VALUE CREATION G. DEAL HISTORY/BIDDERS/COUNTER-OFFERS/LEGAL BATTLE H. COMPARISON TO OTHER ACQUISITIONS OF BUYER I. IMPACT OF ACQUISITION ON CONSTITUENTS 1.Initial impact of deal on constituents’ financial statements (e.g., changes in debt/capital ratio; EPS accretion or dilution, and other things). 2.Initial changes after the transaction due to acquisition (e.g., layoffs, divestitures, changes in constituents’ management). J. IMPACT OF ACQUISITION ON INDUSTRY STRUCTURE 1.Was the buyer’s or merger’s announcement preceded by other large acquisitions in the same industry? 2.If your answer to 1 above is yes, what influence do you think the prior acquisitions had on the decision for the buyer to announce this deal? 3.Was the constituents’ announcement followed by other large (over $1 billion) mergers or acquisitions in the same industry? List these mergers or acquisitions and whether you believe they were motivated or a result of the M/A under study. 4.Do you believe the merger or acquisition under study will cause more mergers or acquisitions in the buyer’s or merger’s industry? Why? 5.What impact do you believe the merger or acquisition under study will have on market share? On competitive advantage? On growth? On profitability? K. POST-MERGER PERFORMANCE (FROM CLOSING TO NOW) 1.Measure the performance of the buyer or merger and the selected 2-3 key competitors by: (1) Total return to shareholders over past 5 years. (2) Return on equity over this time frame. (3) Compare (1) and (2) above to benchmarks for the industry Total return Return on equity 2.How did the economy and industry perform subsequent to the subject merger or acquisition? Reasons 3.How did the buyer or merger perform subsequent to the acquisition? Include impact on firm’s financial health, organization structure, market position and reputation. Reasons. 4.With the benefit of hindsight, did the Buyer make mistakes with its major strategies and investment trusts (both internal and external)? L. CONCLUSIONS 1.Which of the companies studied (Buyer and 2-3 key competitors) seemed to have followed the best strategy and execution? 2.Does one company appear to be consistently better than the others? 3.What is the source of its superiority? 4.If you were the CEO (of the buyer or merger), would you have done anything differently? Explain. 5.Do you think the Buyer will create value on this acquisition? Why or why not? CLASS PARTICIPATION --> Students will be asked to elaborate on processes, concerns, and yield solutions to the questions and problems assigned. COURSE TOPICS & ASSIGNMENTS --> 1.M&A activity and M&A as a component of corporate strategy 2.The M&A Process: How companies execute M&A? Find a target? 3.Merger Proxy Statement & Acquisition Search 4.PESTEL + SWOT, 5C Analysis (constituents before M&A or LBO) 5.Risks in M&A Integration risk Overpayment Culture Clash 6.Building 3-statement models concerning M&A/LBOs 7.Historical financial analysis of target. Projections for target. M&A valuation: role of NOPLAT. DCF and APV versus alternative valuation methods (besides comparables). Case Assignment 1: Projections for “Target” firms NOPLAT, DCF (versus alternative methods not being comparables) Critique of firm “X” valuation 8.Valuation: Comparables Active pursuit of comparables with valuation 9.Valuing High Levered Deals 10.Valuing Liquidity & Control 11.M&A and LBO Financial Structures 12.Designing a deal to achieve buyer (i) EPS and (ii) balance sheet objectives. EPS calculations for combined firm Segal, T. (2022). The 5 Types of Earnings per Share. Investopedia Wayman, R. (2019). How to Evaluate the Quality of EPS. Investopedia Value (money losing firm) Specified case examples Case Assignment 2: Valuing liquidity Financial structure logistics for assigned M&As and LBOs 13.M&A Transaction Process: Seller viewpoint. How an M&A transaction proceeds, the players, the government regulations, the documents, etc. 14.Legal Structures, Tax Issues, Post-Merger Integration Case Assignment 3: Quality of EPS EPS types calculations 15.PESTEL + SWOT, 5C Analysis after M&A or LBO 16.Hostile Takeovers Takeover & Defences Case Assignment 4 Hostile takeovers Post M&A or Post LBO: PESTEL + SWOT, 5C Analysis Defences (unsuccessful takeovers) Prerequisite: Corporate Valuation
Investments & Portfolios in Corporate Finance This course is highly quantitative and relies heavily on data. The R language (with packages) will be highly emphasized due to its vast computational power and outstanding treatment of high-volume compacted data. R Packages may vary among students or groups. This not a matrix algebra course. In profession no one sits down and manually computes matrices because they have better things to do; they are in a business and profession. Not about what a mathematician thinks is “elegant”. Quantitative Finance is a business, not a luxury. Homework --> Expect use of R and Excel to accompany your write-ups providing enough details so that it's possible to understand how you arrived at solutions or resolutions. Commentary expected throughout R development. If you just state the (re)solution, you will lose most points. Exams --> Some tasks will be similar homework, while other tasks will demand exploratory and analysis skills, and “engineering”. R Projects --> Instructor will provide goals and logistics. However, students will make use of R skills and R packages of their choice to complete projects. First: based on module 1 Second: Modules 2 - 5 Third: based on modules 6 - 7 Fourth: Based on modules 1 - 8 Fifth: based on modules 9 - 11 (subject to modules 1 - 8) For each project, accompanying the R development, expected will be analytical writeups in a word processor with high emphasis of mathematical palette use. Excel to serve with financial statements. Writeups concern objectives, motivations, development process with explanations, and results with reasoning. R Packages of interest --> BondValuation, credule, CreditMetrics, cvar, fAssets, fImport, FinCal, FinCovRegularization, fPortfolio, GCPM, jrvFinance, pdfetch, pa, PerformanceAnalytics, PortfolioAnalytics, Quandl, quantmod, RQuantLib, SWIM, tvm Note: such packages serve to accompany analytical development for strong consistency and relevance; not a substitute. Course Evaluation --> Homework 10% 5 R projects 40% Midterm I 20% Midterm II 20% Final Exam 20% Literature Guides --> Ang, C. S. (2015). Analysing Financial Data and Implementing Financial Models Using R. Springer International Publishing. Pfaff, B. (2013). Financial Risk Modelling & Portfolio Optimization with R, Wiley Scherer, B. and Douglas Martin, R. (2005). Introduction to Modern Portfolio Optimization With NUOPT and S-PLUS. Springer NOTE: reading is fundamental. You can’t develop if you don’t read; lectures aren’t enough. Comfort in R is key. NOTE: modern data is essential for many/most things in this course, including projects. COURSE TOPICS --> 1. Analysis Tools Real assets versus financial assets Relation between gov’t bond yields and stocks Historical rates of returns for stocks, currencies and bonds (computational modelling) Leading Economic Indicators -- Unemployment Yield Curve (various multinational risk free instruments) YieldCurve R package Enrico Schumann. Fitting the Nelson–Siegel–Svensson model with Differential Evolution. CRAN R Janpu Hou. (2017). The Yield Curve – Example of Correlation. RPubs PMI analysis TED spread (and counterparts for other developed countries) Stationary Economic Indicators & Environmental Scanning -- Observation of Gov’t Budget Analysis Influence on Sectors and Industries Gov’t Treasury Budget Monthly Statement Fiscal Policy & Fiscal Indicators Fed funds rate anticipation based on assumed monetary policy rule via data What data is relevant? OECD System of Composite Leading Indicators Global PMI Industries/markets PESTEL, SWOT and 5C analysis 2. Intricate Finance Assessment Tools for Instruments (stocks and bonds) Listed credit ratings and default probability (gov’t and corporate) S&P, Moody’s, Fitch, CariCris Health by financial ratios (corporate) Profitability ratios, liquidity ratios, coverage ratios, efficiency ratios, leverage ratios. Historical performance with priors (if applicable) Financial Statements Integrity (individual firms and against possible comparables) Beneish, Dechow, Modified Jones, Altman Z Score, Ohlson O-Score Default probability determination via equity (corporate) from Merton and KMV Review elements from module 1 and their influence on bonds (gov’t and corporate) and stocks compared to development in this module (2); developing the “dashboard”. 2. Fixed Income (portfolio determinants) Bond markets and interest rates A. Simple face value with interest (discrete and continuous compounding) B. Interest on both face value and coupon (discrete and continuous compounding) Valuation for both (A) and (B) Accrued interest for both (A) and (B) Feature Selection and Multi-factor models for interest assessment Default Correlation Lioudis, N. (2022). Top 4 Strategies for Managing a Bond Portfolio. Investopedia Review “dashboard” development based on (1) and (2). 3. Stocks (portfolio determinants) Valuation (DDM, DCF, AEDM, CAPM and extension) Compare methods (relevance or practicality) Implementation Markets and volatility Standard deviation VaR and CVaR for stocks Based on realised volatility and implied volatility, respectively Treynor ratio and Sortino ratio for stocks Review “dashboard” development based on (1) and (2). 4. Currencies What drives currency markets? Variables of influence (chosen elements from module 1) May need more open economy assessment tools Measuring currency exposure Predicting currency crisis Berg, A. and Pattillo, C. (1999). Predicting currency crises: The Indicators Approach and an Alternative, Journal of International Money and Finance, Volume 18, Issue 4, Pages 561-586 Probit model Vlaar, P. J. G. Early Warning Systems for Currency Crises. Bank of International Settlements 5. Inflation Market research Is inflation more a concern for stocks or gov’t bonds or corporate bonds or commodities? Historical survey of high surges or high receding in inflation. Means to forecast. 6. Weak Asset Allocation (stocks and bonds) Note: assumption is that intelligence and skills from all prior modules and topics have been developed/established. Beta, portfolio beta, benchmarking beta Mean-Variance analysis 7. CAPM versus Multi-factor Models (stocks and bonds) Capital Asset Pricing Model Uses and structure Computational logistics and implementation (direct development versus packages) Residuals versus fitted values (RvF) Heteroscedasticity in bivariate models? RvF: case with CAPM How do multi-factor models differ from CAPM? Zivot. E. (2015). Financial Risk Models in R: Factor Models for Asset Returns and Interest Rate Models. Scottish Financial Risk Academy https://faculty.washington.edu/ezivot/research/factorModelTutorial_handout.pdf Enkhjin. (2019). Port0502. RPubs by Rstudio Regenstein, J. (2018). Many Factor Models. R Views by RStudio Direct development versus R packages Observing disparities: CAPM versus multi-factor models 8. Practical Asset Allocation Note: importantly we’re assuming modules 1 through 7 were competently applied prior Modern portfolio theory & post-modern portfolio theory Benchmarking your portfolio Building a portfolio with multi-factor models Measuring diversification within each asset class How much diversification is too much? Magic weights? Principal Component Analysis Applications PCA to calculate VaR? Portfolio Construction Using Principle Component Analysis (general model and hands-on construction) Lei, D. (2019). Black–Litterman Asset Allocation Model Based on Principal Component Analysis (PCA) Under Uncertainty. Cluster Comput 22, 4299–4306 Preference being S&P500, Russell 200, STOXX Europe 600, TXS Composite, or chosen set of stocks Will try for stocks and bonds, respectively, then mixture of both, then with currencies and commodities integrated with stocks and bonds Is PCA better than mean-variance analysis (MPT) and multi-factor models for selection and optimisation? Note: for the allocation methods it’s important to comprehend how past intelligence and skills from modules 1 through 7 are embedded (PCA, muliti-factor and mean-variance) Strategic Asset Allocation (SAA) Chen, J. (2020). Strategic Asset Allocation. Investopedia Policy objectives and policy constraints Weights development/consensus findings. How was consensus model developed? Empirical evidence to support weights for SAA Insured Asset Allocation (INSAA) Comparative development to SAA prior Will the use of index funds, sectors funds and ETFs within portfolio lead to more active management in insured asset allocation? Integrated Asset Allocation (INTAA) Comparative development to SAA and INSAA Transaction costs concerns: SAA versus INSAA versus INTAA 9. Allocation Dynamic Part A: students will be given numerous baskets of assets (stocks, bonds, currencies, commodities). They will determine the type of asset allocation in play. Which portfolio selection and optimisation method are relatable? To apply risk assessment in regard to economic standing. Note: importantly we’re assuming that all prior modules are competently applied. Part B: students will choose assets based on modules (1) - (5). Note: importantly we’re assuming that all prior modules to be competently applied. They will be asked to apply SAA based on an imaginary supplied fixed capital; valuation of assets is crucial towards weights. Will apply all prior portfolio selection and optimsation methods. PART C: students will be given a highly volatile portfolio of assets stocks, bonds, currencies, commodities) to emphasize actual IAA practice. 10. Portfolio Rebalancing Pinkasovitch, A. (2021). Types of Rebalancing Strategies. Investopedia Smart beta rebalancing Methods will be intimately applied to portfolios of various assets; identification of risks to mitigate included with verification, and valuation of assets is crucial towards rebalancing. Note: will be subject to modules 7-9 11. Performance Preliminary measures Alpha, K-ratio, Standard Deviation, Sortino, ROMAD, Treynor Up-Market Capture Ratio, Down-Market Capture Ratio Performance Attribution Brinson model Regression approach Brinson as Regression 12. Behavioural Finance (optional) Market efficiency and anomalies Individual investors and behavioural biases Principal-agent dilemma and incentives Prerequisite: Enterprise Data Analysis II, Financial Statement Analysis I & II, Corporate Finance, Probability & Statistics B, Mathematical Statistics. Options & Futures for Business Management (R environment): This derivatives course is specifically tailored only to students of business degree pursuits. Course Literature: TBA Labs --> Note: computation/simulation development will follow manual analytical development for all labs. Note: some labs will have multiple sessions that may not be sequential. A. R Labs outcomes: --Data acquisition and making data frames; summary statistics; skew and kurtosis; histograms; Q-Q plots (with various baseline distributions); correlation heat maps or ggpairs() function --Time series (analysis): salient characteristics; standardizing time series, auto-correlation; cointegration. --Economic Indicators and forecasting --Technical Analysis Financial Visualization (investigation of functions and their parameters) --Students will acquaint themselves with computational assignments for forwards/options and options strategies involving the “pmax” function in R involving both puts and calls, longs and shorts, and more complex options strategies towards plotting/simulation of geometries. All prior will treat both piecewise models and continuously compounded models. B. Comprehending options products from vendors (CBOE, etc., etc.). Learn to access and interpret market data, and the relevance of such data to our models. Comprehending costs based on shares applied relevant to your strategies. C. Picking Strike Prices D. Computational development of hedge ratio types in R. Hedging vs speculation. E. Options strategies in R subject to shares. F. Primitive builds of binomial tree and Black Scholes Merton in R versus R packages and other monte carlo. European options American options G. Becoming acquainted with particular packages in R for valuation/pricing of derivatives compared to theory. Concerns assets and derivatives (forwards, European Options, American Options). Packages of interest: derivmkts, fAssets, fExoticOptions, fImport, fOptions, jrvFinance, LSMRealOptions, Quandl, ragtop, RQuantLib H. Historical Volatility and Implied Volatility (IV) Models and data applied. Comparing both. Pricing options with IV Major Projects (MPs) --> Based on modules: 1, 2, 3, 8 Exams --> 4 exams with limited notes for use; concerns understanding what you’re doing. Grading Weights--> HW 15% Labs 25% MJs 20% 4 Exams 40% Course Outline --> 1.Asset types and Markets. What drives financial markets? Commodities Balasubramaniam, K. (2020). Who sets the Price of Commodities? – Investopedia Why are there different markers for oil? Which benchmark/marker concerns you, say delivery/procurement versus taking advantage of market dynamics without possessing the asset? Currencies Floating Rate vs. Fixed Rate: What’s the Difference? – Investopedia The Foreign Exchange Spot Market Banton, C. and Scott, G. (2019). Investopedia How are International Exchange Rates Set? Segal, T. (2021). Using Currency Relations to your Advantage. Investopedia Stocks Definition and structure Means of creation and recognition with commissions Market with exchanges, platforms & transaction process It’s imperative that students are exposed to the logistics and computational development for mentioned methods from the following given links, comparing with each other and recognised market value. Some methods may concern “present” valuation while others concern “future” valuation. Chen, J. (2020). Dividend Discount Model (DDM) – Investopedia Kenton, W. (2020). Abnornal Earnings Valuation Model – Investopedia Capital Asset Pricing Model (CAPM) for stock valuation Extend to multi-factor models Joseph Nguyen (Investopedia) – How to Choose the Best Stock- Valuation Method Stock metrics and means of determination For various stocks compare market value to the given prior valuation methods, and to stock metrics. Are such compare/contrasts adequate enough to determine overvalued or undervalued stock? Acquiring and re-adjusting financial statements towards: liquidity ratios, coverage ratios, profitability ratios and efficiency ratios; historical behaviour. Beneish, Dechow F, Mdified Jones, Altman Z; historical behaviour. 2. Future outlook on currencies and stocks (quantitative AND judgmental methods) Leading economic indicators: Unemployment PMIs, yield curve Leading and Lagging Inflation Monetary Policy Rules, Tools Economic data to predict implementation of such Economic data to predict retraction of such Gov’t Budget Analysis Industries to be affected Fiscal Policy and Fiscal Indicators Geopolitics PESTEL, SWOT analysis: serves as planning beyond the luxury of day trading. How will incoming information/perturbators (future outlook module) prior influence your PESTEL and SWOT? Will be tangible with template usage for PESTEL and SWOT. Results generally “complement critique” stock valuation (present and future), metrics and financial ratios. 3. Systematic Measures & Behaviour Beta coefficient and standard deviation VaR and CVaR for systematic risk Ahmed, S., Bu, Z., & Tsvetanov, D. (2019). Best of the Best: A Comparison of Factor Models. Journal of Financial and Quantitative Analysis, 54(4), 1713-1758 What advantages do factor models have over CAPM Portfolio construction with factor models Market relationship between risk free bonds yields rates and stock indices Data Analysis for S&P/TSX Composite Index (with Canada gov’t bonds), S&P 500 (with treasuries), Russell 2000 (with U.K. gov’t bonds), STOXX Europe 600 (risk free European bonds). Role of VIX 4. Arbitrage Lioudis, N. K. (2019). What is Arbitrage? - Investopedia Will treat practical problems concerning arbitrage. Is arbitrage a driving force in markets? Folger, J. (2019). Arbitrage versus Speculation: What’s the Difference? - Investopedia 5. Forwards for currencies (introduction, purpose and vendors) FX Spot–Forward Arbitrage (what are you looking for?) FX Forward Price Quotes and Forward Points (how are they useful?) Timing (establish relevance) Payoff models for currency forwards (developed from the prior subjects) Call (long and short) Put (long and short) Range forward contracts with payoff models 5. Introduction to Forwards for Stocks Definition, vendors, practical uses or goals Piecewise linear models and generating plots of put and calls (also with long and short, respectively). Continuously compounded models of put and calls, and generating plots (also with longs and shorts). Put-Call Parity 6. Introduction to Options Differentiation from forwards Option terminology; margins; CBOE products (or whatever ambiance). European and American Options Differentiation Call and put options; long and short; Continuously compounded models of put and calls, and generating plots (also with longs and shorts). Picardo, E. (2020). Options Basics: How to Pick the Right Strike Price – Investopedia Kenton, W. (2018). What is Moneyness? Investopedia Simon, H. (2020). What is Option Moneyness? Investopedia How is Picardo’s article relevant to the prior two articles? Put-Call Parity with European Options and not with American Options Foreign exchange Options (subject to all priors) 7. Profit Potential of Options and Performance Evaluation Farley, A. (2020). Measure Profit Potential with Options Risk Graphs. Investopedia For the above literature included with applied shares and how they influence derivatives portfolios. For performance evaluation, intention will concern both arbitrary sets of options chosen with applied shares, AND index options. Bookstaber, R., & Clarke, R. (1984). Option Portfolio Strategies: Measurement and Evaluation. The Journal of Business, 57(4), 469-492. Sets of options with applied shares, and index options Can one draw the same conclusions when comparing Farley to Bookstaber & Clarke? 8. Options Strategies Hedging with Options. Is hedging for making money? Mirzayev, E. (2019). Options Strategies: A Guide for Beginners. Investopedia Based on modules (1), (2) and Picardo, for asset types and specific stocks will ask students to create options strategies for a six months window; may also require students to re-evaluate or revise their strategies based on new information. Includes range forward contracts. Seth, S. (2021). Using Options Data to Predict Stock Market Direction, Investopedia 9. The Binomial-Tree and Risk Neutral Pricing Replicating-portfolio; risk neutral/adjusted probabilities 10. Derivative Pricing in the Binomial-Tree Model Dynamic replication; delta-hedging; self-financing portfolios; calibrating the binomial model; pricing calls and puts. 11. The Black-Scholes-Merton Model Understanding, deriving and using Binomial model. Case of BSM-model for non-dividend paying stocks Review binomial tree to BSM, then (geometric) Brownian motion as a generalisation of the binomial tree. BSM and its relation to lognormal. The Black-Scholes-Merton Model and its Greeks. What do they measure? How do they apply? Greeks constructing the Black-Scholes PDE. 12. Delta-Hedging and Option Returns Delta-hedging; convexity vs time decay; hedging error vs transaction costs; value-at-risk; leverage; portfolio insurance. 13. Limitations and Extensions of The Black-Scholes-Merton Model Options on dividend paying stocks, equity indices, currencies, commodities, forwards and futures; negative skewness; fat tails; smile; smirk. 14. Implied Volatility Models Notion. Models. Comparing historical volatility to implied volatility. Why? Pricing options Prerequisites: Corporate Finance, Mathematical Statistics Investment Banking Course learning outcomes: (i) financial statement spreading and analysis; (ii) valuation (using comparables, precedent transactions, and discounted cash flow analysis) of public and private companies in both minority interest and controlling interest situations; (iii) construction and sensitivity of integrated cash flow models (financial statement projections); (iv) construction and analysis of leveraged buyout models; (v) construction and analysis of M&A (accretion/dilution) models. Classroom discussions will be a blend of lecture and case studies, with case studies involving a hands-on modeling approach by all students. Homework and projects will provide additional real-world context and practice for in-class discussions and case studies. A. PREREQUISITES ARE PREREQUISITES (needed) B. STUDENT LEARNING OUTCOMES: Identify different ways to value a company, and describe the key differences between them. Calculate the value of a company, forecast its success or failure, and determine its stock price or sale price. Gain a working knowledge of and ability to construct integrated cash flow models (projections), including revolver modeling. Describe the various ways an individual or a company raises money from investors. Identify the advantages and disadvantages of leveraged buy-outs. Gain a working knowledge of and ability to construct leveraged buyout models, including sources/uses of cash, proforma balance sheet, returns modeling, and PIK debt with warrants. Analyse how a company can go from $0 to $1 Billion in value without ever making a profit. Gain a working knowledge of and ability to construct accretion/dilution (M&A) models, both in shortcut and long form, and including synergies and CHOOSE functionality. C. TYPICAL TEXTBOOKS --> Text for advanced review of financial statement analysis Prerequisites texts and literature Investment Banking: Valuation, Leveraged Buyouts, and Mergers & Acquisitions, by Joshua Rosenbaum and Joshua Pearl D. COURSE TOOLS --> Financial statements (balance sheets, income statements, cash flow) Templates (only for consistency) Data via UPENN WRDS + CRSP+ CCM, etc., concerning observation of real data profiles, designated assignments, study cases and projects. Securities and Exchange commissions filings and structure Crunchbase, Pitchbook, Capital IQ SEC Data Microsoft Office Microsoft Dynamics Microsoft learning: https://docs.microsoft.com/en-us/learn/browse/ E. COURSE GRADE CONSTITUTION --> Class Participation Homework Assignments Quizzes Group Projects F. GROUP PROJECTS (all required) --> Ratio Analysis (profit, efficiency, liquidity, debt) Cash Flow Analysis Integrity (individual firms and against possible comparables) Beneish, Dechow F, Modified Jones, Altman Z model, Ohlson O-Score Corporate Valuation (DCF, APV, FCFE and comparables) Development of the 3-statement model and analysis PESTEL and SWOT Analysis (for each before M&A/LBO) 5C Analysis development (for each before M&A/LBO) CFI Team. (2022). 5C Analysis. Corporate Finance Institute LBO model development and M&A development PESTEL + SWOT (after M&A/LBO) 5C Analysis development (after M&A/LBO) Pro Forma Financials development (after M&A/LBO) Forecasting (after M&A/LBO) Annual Revenues Financial Statements Seasonal Revenues Dumont, M. (2021). How Accretion/Dilution Analysis Affects Mergers and Acquisitions, Investopedia G. MANDATORY MAIN TOPICS --> Investment Banking Activities Financial Statement Analysis Application of Valuation Mechanics and Techniques NOPAT, NOPLAT Financial Modelling & Comprehensive Valuation Analysis M&A LBOs Deal Mechanics Corporate Restructuring Corporate Defence Credit & Finance Legal, Ethical & Governance Issues in Investment Banking Settings H. ESSENTIAL DEVELOPMENT FOR MANDATORY TOPICS --> INTRODUCTION, INDUSTRY OVERVIEW, FINANCIAL STATEMENTS OVERVIEW AND ANALYSIS (Topic 1) a. Brief Industry Overview – Bulge Bracket vs. Boutique Investment Banks, PE Firms, Hedge Funds b. Review of Financial Statements – Balance Sheet, Income Statement, Statement of Cash Flows c. SEC Filings Overview or other ambiance Process Analysis of S1 documents d. Review of sample 10-K– Business Overview, MD&A section, Financial Statements, and Notes e. Overview of Non-Recurring Adjustments f. Examples of Non-Recurring Adjustments g. Deriving Historic Ratios and Trends h. Example of “Spreading” Financials i. Homework (Individual) - Spread the financial statements for Heinz (or whatever) VALUATION (Topic 2) a. Overview of the three Generally Accepted Valuation Methodologies Discounted Cash Flow Analysis (DCF) Trading Multiples Precedent Transactions b. Overview of Valuation Template c. Spreading Comps – Example d. Precedent Transactions Analysis - Example e. Discounted Cash Flow Analysis - Example f. Homework (Group, due in parts): 1. Comps Spreading Exercise 2. Trading Multiples Exercise 3. Precedent Transactions Exercise 4. DCF and APV (and comparables) Exercise INTEGRATED CASH FLOW MODEL- PROJECTIONS (Topic 3) a. Uses for a Financial Model b. Tips for Setting up a Financial Model c. Creating Five Year Projections for Income Statement, Balance Sheet and Cash Flow d. Debt and Interest Schedule e. Integration of Projected Income Statement, Balance Sheet and Cash Flow f. Revolver Modeling g. Running Sensitivities h. Homework (Individual) – Construct integrated cash flow model (projections) BREAKUPS (Topic 4) Chen J. (2021). Breakup Value: What It Means, How It Works. Investopedia Note: all valuation methods observed in prior will be developed and compared for various firms. Hargrave, M. (2020). Sum-of-the-Parts Valuation (SOTP) Meaning, Formula, Example. Investopedia Note: all valuation methods observed in prior will be developed and compared for various firms. What are the key factors to consider when negotiating break-up fees in an IB deal? LEVERAGED BUYOUT (LBO) MODELING (Topic 5) a. Private Equity Industry Overview – Fund Structure, Returns, Waterfall Models b. Uses for An LBO Model on Sell-side and Buy-side c. The LBO Model Structure and logistics d. Review of Deal Structure and LBO Model Example Introduction to LBOs Creation of a Sources and Uses Worksheet Discussion of Typical Financing Sources for LBO Purchase Price Calculations and Considerations Capital Structure Options / Reviews Proforma Financials development Goodwill Calculation Integration of Income Statement, Balance Sheet, Cash Flow Debt and Interest Schedule Revolver and Mandatory / Option Debt Prepayment and Impact on Returns Returns Analysis – IRR on Debt, Hybrid Instruments and Equity Investments d. Returns Analyses e. Homework (Group) – Construct LBO Model MERGERS & ACQUISITIONS MODELING, M&A SALE PROCESS (Topic 6) a. Uses for a Merger Model b. PESTEL + SWOT (for each before M&A and after M&A) c. 5C Analysis development (for each before M&A) d. How to construct a Merger Model e. Calculation of Equity Value and Purchase Price f. Explanation of Consideration Used in Purchase (Stock, Cash, Assumed Debt) g. Discussion of Multiples Paid h. 5C Analysis development (after M&A) i. Post-Merger Control Issues j. Synergies and Pretax Synergies Required to Breakeven k. Revenue and EBITDA Contribution; tasks (NIAT, ATOI, NOPAT, NOPLAT, Operating Cash Flow, EVA) l. Proforma Financial development m. EPS Dilution/Accretion for Acquirer n. Sensitivities o. Homework (Individual) – Construct Shortcut M&A Accretion/Dilution Model Prerequisites: Corporate Valuation, Mergers & Acquisitions, Senior Standing.
International Commerce This is a course where “structuring levels of certainty” and finance are drivers of commerce. Prerequisites will be pivotal with keeping pace, being competent and constructive. Course will involve high amounts data, and quantitative/’computational development. Market entry group presentations are pursued after modules involving market entry, corruption in markets, and barriers to market entry are treated. Written reports must accompany presentations. The presentation aspect will also carry over to participation weight. Remembering everything for a test in this subject is ultimately superficial. Data and circumstances in environments are always changing. The greatest importance is to have independent skills in data gathering, and good navigation. What you know and do comes from what you’ve gathered and reasoned. Exams will be done in groups with open literature and open notes, with use of technology/data tools. Parts of exams will include profiling, research and analysis for ambiance(s) of interest. References and citations are required. Other components will concern various types of risks, pricing, valuation, measures, etc. Such exams will also serve as structure towards the required final project. Groups should review the evaluations of their exams and make the necessary amendments. Groups will be assigned foreign markets and develop the proposal/project with updated data (when needed) and so forth. Grade constitution: Participation Quizzes will also reflect common knowledge (academic maturity), accounting and corporate finance, and analysis development. Quizzes in total will reflect some modules. Market Entry Group Presentations Exams (3-4) Final Project Applicable Resources --> Securities Exchange Commission Federal Trade Commission (or sovereign counterpart) FDIC data (or sovereign counterpart) IGOs (UNSD, IMF data, OECD Observer, OECD data, OECD Main Indicators, World Bank Indicators, IABS, WTO, UNCTAD profiles, UNCTAD FDI and UN Comtrade Databases WIPO, UN’s FAO) NIST Cybersecurity Framework (or other) Compustat +WRDS, Crunchbase Trade Online: https://ised-isde.canada.ca/site/trade-data-online/en Barron’s Online, Reuters, Bloomberg, Yahoo Finance Kaggle Necessary Computation tool: R + RStudio, MS Office, Google Sheets, where instructor will assume without reservation that prerequisites are AT LEAST met. Socioeconomic “noise” to accompany course outline (in appropriate manner) --> 1. Explain why understanding cultural differences are crucial for global business. 2. Identify factors that should be considered when firms participate in foreign direct investment (FDI) and what are the benefits and costs to host and home countries. 3. Identify ways a firm can acquire and neutralize location advantages. 4. Identify strategic responses firms can take to deal with foreign exchange movements or foreign inflation. 5.Describe different international strategies for entering foreign markets. 6.Describe the relationship between multinational strategy and structure. FINAL GROUP PROJECT (for a currently functioning firm wherever). COURSE OUTLINE --> --Globalisation & Business Today --Global Culture. Differences in culture. Ethics and Social responsibility --The Economic, Legal and Political Environment. Political economy. Security. --Foreign Direct Investment 1. Horizontal, vertical, and conglomerate are the types of FDIs A. Advantages (with types seeking) B. Risks C. Which is the most defensive against economic downturn (regional and global)? D. Forms of FDI incentives 2. Company’s growth strategy and governing laws A. Characteristic regulations that are influential on productivity and profit. B. Comparing countries. What industries in FDI dominate? As well, analysis of evolution (35-40 years) Developing Countries (25-30) Developed Countries (all) Equity types and levels, retail, services, logistics, manufacturing 3. Intelligence Resources: Harrison, A and A Rodriguez-Clare (2010), “Trade, Foreign Investment, and Industrial Policy for Developing Countries”, Handbook of Development Economics, Vol. 5: 4039-4214. Antalóczy, K., Sass, M. and Szanyi, M. (2011). Policies for Attracting Foreign Direct Investment and Enhancing its Spillovers to Indigenous Firms: The Case of Hungary. In: Multinational Corporations and Local Firms in Emerging Economies. Amsterdam University Press Moran, T H (2014), “Foreign Investment and Supply Chains in Emerging Markets: Recurring Problems and Demonstrated Solutions”, Washington, DC: Peterson Institute for International Economics. Working Paper 14 - 1. 4. Will also be interactive with OECD FDI data (there’s 15-16 indicators) Understanding the indicators. Identify the data sources/channels and logistics towards computational model or statistic (possibly can verify data). Unsupervised learning - PCA development with such. --Environmental Scanning 1. Capital Account in international macroeconomics (analysis of data) Importing or exporting capital? Identifying historical trend Attractiveness to investors. Identifying historical trend Financial account versus capital account 2. Current Account Analysis and Benchmarks 3. Debt to GDP Hennerich, H. Debt-to-GDP Ratio: How High Is Too High? It Depends, Federal Reserve Bank of St. Louis Methodologies for prediction of balance of payment crisis (to be implemented) 4. Fiscal Behaviour (provincial, municipal) Gov’t Budget Analysis Fiscal Policy & Fiscal indicators 5. IGO Indicators OECD Observer, OECD data, OECD Main Indicators World Bank Indicators Trade Online: https://ised-isde.canada.ca/site/trade-data-online/en UNCTAD profiles, UNCTAD FDI and UN Comtrade Databases 6. Corruption monitoring in market Identification and analysis of corruption indicators A. For the measures of corruption measure to comparatively investigate the model, components, means of data acquisition (structuring and regularity), logistics Index of Public Integrity WEF Global Competitive index World Bank Governance Indicators 7. Regional Economics Will also be “borrowing” some evaluation and computational tools from regional economics to directly implement for quantitative results with regional, provincial and/or municipal levels for compare-contrast Location Quotient (LQ); Economic Base; Export Employment; Input-Output; Multiplier Effects; Leakage Effects; Shift-Share What industries are driving growth/stability in the market based on priors? Is observation of the trend in such measures annually a good indicator of industries’ direction? Efficiency in Industries (current period, successive periods towards trend analysis). Stochastic Frontier Analysis. Data Envelopment Analysis. Fiscal Behaviour (national, provincial, municipal) Gov’t Budget Analysis Fiscal Policy & Fiscal indicators 8. Socio-Cultural Scanning (national, provincial, municipal) Demography Gov’t census and labour statistics UN Agencies Indices of Social Development: https://isd.iss.nl/data-access/ How do you acquire data for cultural factors? Material Culture, Cultural Preferences, Languages, Education, Religion, Ethics & Values, Social Organisation 9. Market measures Barnett, W. (1988). Four Steps to Forecast Total Market Demand. Harvard Business Review Pursue active implementation of such four steps for assigned ambiances; pursue alternative methods to contrast with. Methods to compute the following (will be done for assigned ambiances) : Serviceable Available Market (SAM) Serviceable Obtainable Market (SOM) 10. Tax Transfer Policy (national, provincial, municipal) 11. PESTEL and SWOT Analysis Note: will be comprehensively and thoroughly applied with data and the necessarily templates What or who is the benchmark in the market? What differentiates “them” from the rest? Ranking method? --Foreign Market Competition Measurement & Barriers to Foreign Market Entry Types of barriers and how to identify empirically: Primary Antitrust Ancillary Will choose various markets from different regions of the globe to measure market competition and monopoly power. The following literature (all of them) will be applied to current data: OECD (2021), Methodologies to Measure Market Competition, OECD Competition Committee Issues Paper OECD (2022), Data Screening Tools in Competition Investigations, OECD Competition Policy Roundtable Background Note Pindyck, R. S. (1985). The Measurement of Monopoly Power in Dynamic Markets. The Journal of Law & Economics, 28(1), 193–222 --Regulation and contracts in international commerce: UNCITRAL, WTO, ITC model contracts (types), International Chamber of Commerce (ICC) --Operations, Banking, Financial Regulations: A. Corporate governance issues in international management. Stakeholders. Responsibilities of directors, managers. Protectionism. B. Federal Deposit Insurance structure: FDIC policies - comparative analysis among chosen different sovereignty. The given source serves as a strong resource for research << https://www.fdic.gov/bank/ >> How do other sovereignty compare with such data development? Try finding the data (and pursue analysis of interest such as financial health, etc.). C. Legal currency exchange intermediaries: Means of proper identification Statutory requirements for operations disparities among chosen ambiances D. Financial Reporting: IFRS vs chosen ambiance standards E. Integrity, Laundering Risk Indicator, Sanctions: FATF-GAFI To develop: Ferwerda, J., Kleemans, E.R. Estimating Money Laundering Risks: An Application to Business Sectors in the Netherlands. Eur J Crim Policy Res 25, 45–62 (2019). Databases (active run through) - OFAC, HM Treasury, EU, UN, WBG Not always identical with sanctions among each other. --Financial risks on assets and instruments 1. Interest rate risk (investor perspective) Means of identification Duration types to measure interest rate risk Bond Immunization methods Must have the ability to comprehend a situation and model/apply three out of the following: cash flow matching, duration matching, convexity matching, FRAs and swaps. 2. Credit Risk (investor and firm perspective) Means of identification (credit ratings) Adjusting financial statements for ratios Coverage ratios, solvency ratios, and efficiency ratios Historical trend in priors Beneish, Dechow, Modified Jones, Altman Z Using equity to estimate default probabilities (Merton’s model or KMV model) For a higher level of perceived credit risk, investors and lenders usually demand a higher rate of interest for their capital. Is CAPM good enough, or use of multi-factor models, or other method? 3. Foreign Exchange Risk (firm perspective) Determining currency exposure (highly quantitative/computational) Value-at-Risk Estimation of foreign exchange risk Predicting currency crisis Currency swaps 4. Inflation Risk (firm perspective) PCE, CPI, WPI, PPI Rate of inflation formula (ROIF) based on all priors Change in dollar value based on ROIF Forecasting must be developed: Meyer, B. H. and Pasaogullari, M. (2010). Simple Ways to Forecast Inflation: What Works Best? Federal Reserve Bank of Cleveland Economic Commentary, Number 2010-17 Resolution: build an inflation premium into the interest rate or required rate of return demanded for an investment based on expected inflation. Can CAPM or multi-factor models or other account for inflation alongside market risk and return? --Organisational Architecture How to design an organisation? Personnel optimisation/scheduling via linear programming concerning scale of intended operations and efficiency. Workforce Planning --The Distribution Channel One particular business may have options in distribution channels, depending on operations scale, segmentation, innovative technology, environmental sustainability, etc., etc. --Experience Curve Effects Concept, model validation with data (in different ambiances) and related causes for effect; compare to Porter’s model and (PESTEL to SWOT) --Tax Regulations and Corporate Dues (if relevant) How are financial statements submitted related to tax reporting documentation? Can charged taxation on companies be verified via their financial statements? Seth, S. (2022). Transfer Pricing. Investopedia --Cooking the Books The given are some basic additional guides to assist with financial analysis --> Wayman, R. (2019). 8 Ways Companies Cook the Books – Investopedia Adkins, T. (2019). Financial Statement Manipulation – Investopedia Kuepper, J. (2020). Spotting Creative Accounting on the Balance Sheet – Investopedia Bloomenthal, A. (2021). Detecting Financial Statement Fraud. Investopedia Will analyse various past cases via financial data from SEC/Comptroller, firm repository, tax filings, affidavits and court rulings. From above literature will try to identify/apply the various types of method or /models. Examples (but not limited to): Hin Leong: Cheong, S., Cang, A. and Koh, J. (2020). Hin Leong Failed to Declare 800 Million Losses. Bloomberg Olympus: Layne, N. and Reynolds, I. (2011). Olympus Admits Hid Losses for Decades, Reuters Soble, J. (2011). Olympus Used Takeover Fees to Hide Losses, Financial Times --Off-balance sheet concerns Regulations for off-balance-sheets activities, and requirement of making note, and providing detailed disclosures in quantitative and qualitative statements. How attractive is the market of consideration? SPVs and Partnerships --Financial Statements Integrity Horizontal Analysis, Vertical Analysis, Cash Flow Analysis Beneish Model, Dechow F, Mofified Jones, Altman Z, Ohlson O-Score --Insurance 1. Insurance for (international) business 2. Rate Making Methods (will try to apply) Internal Rate of Return Method (IRRM) Feldblum, S. (1992). CASACT Vaughn, T. R. Misapplication of Internal Rate of Return Models in Property/Liability Insurance Ratemaking. CASACT Generalised Linear Models Concerned with logistics and implementation. Then computational contrast to IRRM. 3. Claims Valuation and Calculation --Export Finance & Export Credit Insurance Comprehension Instruments and operations --Cybersecurity/Intel planning & strategy formalities Standards for Cybersecurity (consider a renowned framework) Corporate espionage What is valuable? What elements and operations contribute highly to revenue in your business? --Capital Budgeting (CB) Subject may not be highly transparent and tangible until financial structure and accounting for respective business is analysed. 1. Grasping capital requirements. Analysis of other firm(s) of desired scale viewed as your benchmark is one possibility, or based on branches elsewhere subject to market/inflation correction. A. Expected costs accounting (hopefully no overlaps) Hedonic pricing for lease properties or rents Organisational finance Development & production costs Distribution channels (complicated by segmentation?) Cybersecurity/Intel planning Insurance Export Finance & Export Credit Insurance Taxes Pricing and Dues pricing B. Credibility Assessment: horizontal analysis, vertical analysis, cash flow analysis with trend for each) among comparables; and measures (Beneish, Dechow F, Modified Jones, Altman Z-score, Ohlson O-Score) among comparables. C. Proforma and forecasting 2. Framework, model and essential features of Capital Budgeting. Then conjure your CB based on (1), followed by possible Risk Analysis with Scenarios & Monte Carlo (Excel and R). 3. Investor accessibility Note: investors can be broad depending on maturity of company Equity investments Debt investments Finding the Optimal Capital Structure Hayes, A. and Kindness, D. (2020). Optimal Capital Structure. Investopedia Aswath Damodaran. Finding the Right Financing Mix: The Capital Structure Decision. Stern school of Business: http://people.stern.nyu.edu/adamodar/pdfiles/cf2E/capstru.pdf 4. Methods for choosing the discount rate Chen, J (2019). Target return. Investopedia Majaski, C. (2020). Cost of Capital vs. Discount Rate: What’s the Difference? Investopedia Gorton, D. (2020). A Quick guide to the Risk Adjusted Discount Rate, Investopedia. WACC, Adjusted Present Value, CAPM, multi-factor models (for risk premium), modified IRR, NPV 5. Forecasting methods to predict future outlook Recall 1C Multilinear regression, moving average and general time series Gov’t budget analysis and fiscal policy Relevance to your industry/sector Fed policy speculation based on economic data PMIs TED Spread (or other developed ambiance counterpart) OECD System of Composite Leading Indicators SWOT + PESTEL Note: 1 through 5 will have influence on optimal mix. 6. Account for the additional subtleties from (1) through (6): Clark, V., Reed, M. and Stephan, J. (2010). Using Monte Carlo Simulation for a Capital Budgeting Project. Management Accounting Quarterly 20, 12(1) --Business Assessment for lately (with possible comparables or not) Adjusting financial statements leading to computation of the following: Profit Ration EBITDA, ATOI, NOPLAT, Operating Cash Flow, EVA Liquidity Ratios Efficiency Efficiency Ratio, ICR, DCL Coverage Ratios Integrity metrics Beneish Model, Dechow F Score, Modified Jones, Altman Z, Ohlson O-Score Default Probability of Default (via equity by Merton’s model or KMV) Adjusted Present Value (APV) for investment worthiness CAPM vs multi-factor models vs APV for expected return Data Envelopment Analysis method to measure corporate performance Sound payment record to the vendors, banks and suppliers Attributes of reputation: innovation; people management; use of corporate assets; social responsibility; quality of management; long-term investment value; quality of products/services; green initiatives PESTEL and SWOT What about the long term? --Inventory Measures Note: some of the following measures will apply depending on type of business. Yet, for all will try to have active implementation. Historical performance is also important to observe. Treat by determined best order and relevance: Linking inventory to financial statements Inventory classified as a current asset on the Balance Sheet. Valuation methods: First-In, First-out (FIFO) Last-In, First-out (LIFO) Weighted Average Cost Specific Identification Inventory and the Income Statement Cost of Goods Sold calculation Gross Profit Inventory Turnover Ratio Inventory and the Cash Flow Statement Operating Activities Cash Conversion Cycle Inventory Adjustments & Financial Reporting Periodic System & Perpetual System Inventory Shrinkage Lower of Cost or Market Quick Ratio LOB Efficiency Measure Tax Implications (taxable income and deferred taxes) Identify all influential measures from priors, and why Wells, J. T. (2001). Journal of Accountancy --Economic Indicators (of environment) Macro Indicators Analysis Gov’t Budget Analysis, Fiscal Policy, Fiscal Indicators Treasury Budget. Rate of buying or selling gov’t debt SNA Current Account evaluation and benchmark Ambiance PMI Global PMI OECD System of Composite Leading Indicators TED Spread (or other developed ambiance counterpart) Monetary policy rules with data for possible future central bank action and consequences Chow, J. T. S., 2015. “Stress Testing Corporate Balance Sheets in Emerging Market Economies”, IMF Working Paper, WP/15/216. Reassessment based on Environmental Scanning module Prerequisites --> Writing Sequence; Enterprise Data Analysis II; International Financial Statement Analysis II; Corporate Finance; Mathematical Statistics
Strategic Business Analysis and Modelling Course Objectives -Comprehend the fundamentals of strategic analysis and modelling. -Applying 5C Analysis to assess internal and external business factors. -Explore different business models and their applications. -Examine value creation, delivery, and capture within organisations. Apply strategic modelling techniques to real-world business scenarios. The major subjects of this course are: --5C Analysis --Business Model --Value Model --Feasibility Study Course Assessment: Small Assignments and Quizzes (before the midterm, and will extend beyond the midterm) Financial Analysis (given on various occasions all term) Adjusting financial statements and developing (9-12) ratios: Profit, liquidity, debt, efficiency. Develop trend as well for each with comparables in market. NOPLAT, EVA. Also, trend for both with comparables in market Beneish, Modified Jones, Dechow F Score, Altman Z, Ohlson O-Score Develop trend as well for each with comparables in market 3- statement model, proforma and forecasting Midterm Evaluation Will reflect all small assignments and quizzes given before the midterm Will reflect Financial Analysis Team Assignments (1 for each module) Independent of the midterm Group Term Project (encompasses most or all modules) Course Tools: Microsoft 365 (or Google Counterparts) R + RStudio Scientific Calculator Financial Statements of firms Financial, Industry and Market data tools/resources Course Outline: Introduction to Strategic Business Analysis Overview of strategic management Importance of strategic analysis and modelling Key concepts and frameworks 5C Analysis Company Analysis: internal assessment of strengths and weaknesses. Sustainable competitive advantage. VRIO (Variable Rare Imitable Organised) model. Collaborators Analysis: company’s supply change. Agendas and incentives. Customer Analysis: The Total Available Market (TAM). The Serviceable Available Market (SAM). The Serviceable Obtainable Market (SOM). Note: such prior three involves much quantitative modelling, and computation. Competitor Analysis: Industry Classification Systems. Examining market share within an industry (CR 4 and alternatives). Issue with classifications systems – a firm may operate across multiple industries, or it may serve a niche market that differs from the traditional industry definition. Context Analysis: use of PESTEL. Business Models Definition and importance of business models Types of business models Value Proposition Comprehending the concept and its components Hedonic modelling, conjoint analysis, and discrete choice modelling Developing a compelling value proposition Value proposition canvas exercise Value Creation and Delivery Value chain analysis Processes and activities for value creation Distribution channels and logistics for value delivery. Value Capture Revenue models and pricing strategies Monetization methods Maximizing value capture Strategic Modelling Techniques SWOT Analysis Scenario Planning Decision Trees Monte Carlo Simulation Feasibility Study (extensive and comprehensive) Project Description Prior modules will reemerge Market Analysis Prior modules will reemerge. Augmented by industry trends, customer needs, and potential target markets. Technical Feasibility Economic Feasibility (highly computational) Costs (technical guides involved), cash flow projections Benefits (technical guides involved) NPV or IRR based development Elements that mat affect the discount rate or rate of return. Robust models to capture such. Legal and Regulatory Feasibility Operational Feasibility Scheduling and Timeline Resource Requirements Risk Analysis Social Return on Investment (SROI) Prerequisites: Enterprise Data Analysis I & II, International Financial Statements Analysis II, Corporate Finance, Mathematical Statistics. Commercial Bank Management Literature Material --> Van Greuning, Hennie; Brajovic Bratanovic, Sonja. (2020). Analyzing Banking Risk (4th Edition): A Framework for Assessing Corporate Governance and Risk Management. © Washington, DC: World Bank. Berlinger, E. (2015). Mastering R for Quantitative Finance. Packt Publishing. Supporting Resources --> Tripp, J., & Calvert, M. (2007). A Practical Approach to Teaching Commercial Bank Management: Experiential Learning and More. Journal of Financial Education, 33, 63-73 Hester, D. (1991). Instructional Simulation of a Commercial Banking System, The Journal of Economic Education, 22(2), 111-143 Mandatory Tools --> Scientific Calculator Excel R and RStudio RStudio + R packages --> fimport, Quandl, quantmod BondValuation, FinCal, jrvFinance fPortfolio, fAssets, fOptions, LSMRealOptions CreditMetrics, GCPM, pa, Performance Analytics, PortfolioAnalytics cvar, LDPD Essential Resources --> Securities Exchange Commissions Statutory Data & EDGAR Banks’ financial statements Banks’ reports Sovereign ambiance analogy to the following https://www.fdic.gov/bank/ BIS Capital markets databases (include UPENN WRDS) Kaggle NOTICE FOR COURSE: Financial statements will be applied extensively, else, there’s really nothing. Computational activity for measurements and analysis can go beyond lecture text, making use of skills from prerequisites listed. To be highly practical and real world competent one must become well versed in actual “portfolio” make-ups. Course will make use of the listed “Tools” and “Essential "Resources” for analysis, assignments and projects. Presence will be in lectures, assignments, quizzes, exams, labs and projects. Grade Constitution --> Homework Labs 2-3 Exams (based on lectures + homework + labs + open notes + R + Excel + scientific calculator) Projects HOMEWORK --> --Metrics For numerous assigned banks at designated periods to manually develop the following via financial data: A. Vertical Analysis, Horizontal Analysis, Cash Flow Analysis B. Profitability (Net Interest Margin), EVA, Operating Cash Flow C. Liquidity Ratios for banks D. Volatility of Funding and Concentration of Deposits E. Capital Adequacy (Total Capital Ratio, Tier 1 Ratio), CET1 Ratio F. Asset Quality (Asset Quality Ratio, Loans Quality Ratio) G. Efficiency (Efficiency Ratio, Interest Coverage Ratio, Operating Leverage, Degree of Combined Leverage, Maturity Mismatch) H. Loan-to-Value Ratio. Loan Loss Reserve Ratio. PCL Ratio. I. Beneish Model, Dechow F, Modified Jones, Altman Z --Concerning the text of Van Greuning & Bratanovic there will be assignments for banks with their data based on measures, displayed diagrams, charts, tables and simulations in the text. Note: such assignments to be based on assigned reading. Concerns chapters 3-10. LABS --> --Individual Debt Instruments Modified Duration Exponential Duration Livingston, M. and Zhou, L. (2005) Exponential Duration: A More Accurate Estimation of Interest Rate Risk, Journal of Financial Research, 28, 343–61 Discrete Duration Bajo, E., Barbi, M. and Hillier, D. (2013). Interest Rate Risk Estimation: A New Duration-Based Approach. Applied Economics, 45 (19) 2697 - 2704 Convexity Analysis based on prior durations (compare amongst each other) --Interest Rate Risk Measurement (holistic) Gap Analysis Economic Value of Equity Net Interest Income --Credit Risk (based on lectures) --Currencies Exercise problems review: Weithers, T. (2013). Foreign Exchange: A Practical Guide to the FX Markets. Wiley (chapters 4 & 5) Measuring Exposure (based on lectures) Value-at-Risk estimation of foreign exchange risk (based on lectures) --FX Instruments (based on lectures) --Valuation of European Currency Option (put and call) PROJECTS --> --Collective analysis of asset allocation strategies of banks for different periods A. For assigned sample set of banks, based on financial statements for assets of respective bank to determine allocation strategy. Then, applying multiple economic forecast methods. Models or tools to be based on inflation, interest, unemployment, and productions, as well as prices for goods and services. B. Compare prior to observed indicators with practical time periods (OECD Composite Leading Indicators, TED Spread (apply to other developed countries as well), Global PMI, Gov’t Budget Analysis, Gov’t Fiscal Policy, Yield Curve, Mutual Funds Liquidity, fed rate policy speculation based on economic data, Buffet indicator (apply to other developed countries as well). C. Based on findings from (A) and (B) to determine appropriate adjustments for each portfolio. --Berlinger, E. (2015). Mastering R for Quantitative Finance. Packt Publishing, pages 290 - 316 Chapters 2, 4, 11-13. Note: for assets with distributions applied, based on new real data to also applying alternatives alongside normal distribution, such as Lognormal, Variance Gamma, and Meixner. --Banker Credit Analysis (based on lecture module) --Pursuit based on establishment from lecturing (for ambiances of choice): Ferwerda, J. and Kleemans, E. R. (2019). Estimating Money Laundering Risks: An Application to Business Sectors in the Netherlands. Eur J Crim Policy Res 25, 45–62 COURSE OUTLINE --> --Overview of the financial services sector 1.Introduction to banking and financial services management. 2.Legalities --Administration(s) for licensing, registry, supervision of banks Starting a bank Establishing a domestic branch Establishing a foreign branch --Quantitative legal requirements for a financial institution --Governing Bodies and Supervisory Bodies for banks --Key Aspects of a Bank Transactions System --Bank Transactions System (engineering overview) Framework for Technology Stack; Security Frameworks; Transactions Framework --> Model (Data Model, Transaction Model, User Model) -> Design (User Interface, Backend Design, Scalability, Security Design, Security Design, Transaction Workflow) --Reserve Requirements (literature and data TBA) 1. Reserve requirements. Calculation of reserve balance requirements. Finding the required reserves, excess reserves, and the maximum amount by which demand deposits could expand, based on a required reserve ratio, with a system having $X in deposits and $Y in reserves. Reserve Maintenance Manuals, and questions. 2. Deposit Insurance: origins and structure. How is the maximum federal deposit insurance determined? Is it the same for all banks? Why or why not? How is FDI related to banks’ reserve requirements, assets and liabilities? --Influence of the fed funds rate on banks --Balance Sheet Structure (chapter 4 of Van Greuning ) Constituents. What is a healthy composition? --Income Statement structure (chapter 5 of Van Greuning ) Drawing conclusions for specified periods --Risk Identification (overview) Analysing financial institutions in terms of risk identification --Liquidity (literature and data TBA) Structure of funding Cash Flow Analysis --Capital Adequacy (chapter 6 of Van Greuning) Must develop lecturing to highlight major points. Some sections can be exploited towards data analysis, simulation and computational activities. Risk-weighted capital requirements. Leverage requirements. Reserve requirements versus capital requirements Relationship between deposit insurance, reserve requirements and capital requirements? --FDIC (or ambiance counterpart): obtaining data about banks, their competitors and industry statistics in order to perform comparisons/contrasts. Is there sound relationship between capital adequacy --Basic Securities (literature and data TBA). 1. Review of Equity IPO & shares development Stock valuation (DDM, DCF, AEVM, CAPM, multi-factor models) Stock metrics Health by ratios and trend (profitability, coverage, liquidity, efficiency) PESTEL and SWOT 2. Review of Fixed Instruments Discrete & continuous compounding (cash flow, NPV & FV) Zeros (discrete and continuous compounding) Valuation, IRR, effective interest rate, APR, APY Bonds with coupon interest and the principal at maturity (BCPMs) Valuation, IRR, effective interest rate, APR, APY Duration & Convexity (for interest rate risk) Zeros and BCPMs Firm Health by ratios and trend (profitability, coverage, liquidity, efficiency) Credit Rating data Relation between perceived risk(s) and interest setting (multi-factor models implementation). Market relation between “treasuries” yields, treasury price & stocks PESTEL and SWOT also applicable 3. Advance practice of multi-factor models and PCA for portfolio selection & optimisation (stocks, bonds and currencies included) 4. Apply methods used to measure (systematic) risk and sentiment for bonds and stocks: Beta, portfolio beta and benchmarking. What are you measuring? VaR, CVaR, Stressed VaR. What are you measuring? VIX. What are you measuring? 5. Performance Measures (active implementation) Standard deviation R-squared Alpha Sharpe ratio, Sortino ratio, Treynor ratio K-ratio Up-Market Capture Ratio, Down-Market Capture Ratio Performance Attribution 6. Rebalancing Portfolios (Assets of banks) based on economic outlook --Index Options (will focus on equity) Structure. Basic strategies with models. Picking strike prices for strategies. What amount of capital or shares must be determined? Reminder: everything doesn’t require hedging unless significant risk is possible in the near future; you hedge wrong, you loose more. Banks apply options strategies for gains as well. --Credit Risk (literature and data TBA) A. Credit ratings data B. Probability of default. concept models and public data C. Ratios (coverage ratios, liquidity ratios, and solvency ratios); observation of trend for each chosen ratio. D. Altman Z and Ohlson O-Score (practical exercises) E. Using Equity Prices to Estimate Default Probabilities - Merton Note: will have practical exercises, & treatment for general bonds (besides zero bonds) as well Merton. R. C. (1974). On the Pricing of Corporate Debt: The Risk Structure of Interest Rates. Journal of Finance, 29: 449 – 70 Hull, J. C. and Basu, S. Using Equity Prices to Estimate Default Probabilities. In: Options, Futures and Other Derivatives. Pearson. 2016, pages 582 – 584 Will be directly immersed with determining a company’s assets and liabilities as inputs. Compare Merton’s method development to default probability listings. Note: extend Merton model to KMV model and compute; compare also to default probability listings. F. Expected Loss (class body computational pursuit) Factors for computation: Probability of Default (PD) Exposure at Default calculation (EAD) Loss Given Default calculation (LGD) Expected Loss being time dependent Cash flows from repayment over time Loans are typically backed up by pledged collateral whose value changes differently over time vs. the outstanding loan value Sometimes both the probability of default and the loss given default can rise. Flores, J. A. E., Basualdo, T. L. and Sordo, A. R. Q. (2010). Regulatory Use of System-Wide Estimations of PD, LGD and EAD. Financial Stability Institute 2010. Bank for International Settlements Further tool for LGD (if needed): Tong, E., Mues, C. and Thomas, L. (2013) A Zero-Adjusted Gamma Model for Mortgage Loan Loss Given Default. International Journal of Forecasting, 29, 548-562. G. What if: expected loss of credit asset if PD and LGD are correlated. --Currencies (literature and data TBA) Why do banks participate in the foreign exchange market? Regulations for banks as a currency exchange service. Weithers, T. (2013). Foreign Exchange: A Practical Guide to the FX Markets. Wiley (chapters 4 & 5) For the following journal article there should be means to implement such practically to really understand how it functions. Is it practical or highly compatible with modern day banking? Bell, P., & Hamidi-Noori, A. (1984). Foreign Currency Inventory Management in a Branch Bank. The Journal of the Operational Research Society, 35(6), pages 513-525. Practical methods of currency exchange rates forecasting Measuring currency exposure: Hekman, C. R. (1983). Measuring Foreign Exchange Exposure: A Practical Theory and Its Application. Financial Analysts Journal, 39(5), 59–65. Value-at-Risk Estimation of foreign exchange risk: Papaioannou, M. (2006). Exchange Rate Risk Measurement and Management: Issues and Approaches for Firms. International Monetary Fund WP/06/255 Bredin, Don & Hyde, Stuart. (2002). Forex Risk: Measurement and Evaluation using Value-at-Risk. Research Technical Papers 6/RT/02, Central Bank Ireland Swami, O. S., Pandey, S. K. and Pancholy, P. (2106). Value-at-Risk Estimation of Foreign Exchange Rate Risk in India. Asia-Pacific Journal of Management Research and Innovation. 12(1): 1 – 10 FX Instruments: Concerns ONLY recognition and resolution procedures with the stereotypical problems thrown Foreign Exchange Forwards Types of Currency Swaps Cross-Currency Swaps Currency Options Structure(s) Valuation of European Currency Option Range Forward Contracts (long and short) Note: everything doesn’t require hedging unless significant risk is possible in the near future. Banks apply options strategies for gains as well. Currency transaction reporting --Banks and Borrowed Funds Commercial banks borrowing from the federal reserve. Why? What risk is the federal reserve taking on? Interbank lending. How do banks analyse each other with interbank lending risk? Is “too big to fail” a driving rationale? --Asset Liability Management (literature and data TBA) The following sources are solid guides towards anything hands-on and practical: Banton, C. & Boyle, M. J. (2020). Asset/Liability Management. Investopedia Gup, B. (2011). Asset/Liability Management. In: Banking and Financial Institutions (pp. 75-93). John Wiley & Sons Greuning, Hennie & Bratanovic, Sofija-Sonja. (2020). Asset-Liability Management. In: Analysing Banking Risk (Fourth Edition): A Framework for Assessing Corporate Governance and Risk Management (pp.281-295). World Bank eLibrary --Interest Rate Risk Premium (IRRP) for Credit Assets (literature and data TBA) Will like intimate treatment with acquirable data for tangible determination for IRRP. Determination of risk-premium Component A: background screening (enterprise legality and legal/penal track record, business model, revenue model, PESTEL/SWOT) Component B: data elements for analysis (proof of income, financial statements, off-balance sheet activities notes, credit risk via logistic model vs credit bureaus data) Component C: macro elements (economic outlook, gov’t budget analysis, gov’t fiscal policy, fed funds rate anticipation based on economic data, TED spread, PMI, OECD composite leading indicators). Component D: Multi-factor models or PCA or kernel PCA for IRRP? Component E: consideration of loan competitors --Loan loss provision: Albert, G. (2021). Loan Loss Provision. Investopedia How is it developed? --Banker Credit Analysis Student groups will be given different ideal loan/lending policies, along with strong data for proper processing. Based on known procedures students will be asked to make decisions on loan approvals. Process, data and tools applied for decision making: 1.Information Collection (will be more extensive than expected) 2.Information Analysis 3.Business models and revenue models development 4.Financial Statements Integrity Horizontal Analysis, Vertical Analysis, Cash Flow Analysis, Beneish Model, Modified Jones Model, Dechow F Score, Altman Z Model, Ohlson O-Score 5.Methods of proving or determining income: Specific item, net worth, expenditures, bank deposits, cash and percentage markup methods Can be done for multiple periods if relevant Free Cash Flow Can be done for multiple periods if relevant 6.Financial Ratios & Trends in the financial ratios (if relevant) Liquidity, coverage, profitability, efficiency 7.Credit Risk (data subject to change) Credit Data (credit firms and rating firms) Probability of default via equity (Merton model and KMV model) Credit Risk Modelling using Logistic Regression 8.Creditworthiness, and Default Risk Premium or IRRP (from earlier) 9.Review: Business model and Revenue Model. PESTEL + SWOT 10.Credit Security (collateral) 11.Loan-to-Value Ratio 12.Decision Making --Management of sources of funds including deposits, borrowed funds, fee income, and other means of capital (literature TBA) --Understand why a balance must be achieved among liquidity, risk assumption, and profitability --Anti-Money Laundering Bank Secrecy Act (BSA): https://www.occ.treas.gov/topics/supervision-and-examination/bsa/index-bsa.html Note: identify ambiance counterpart --Transaction activity monitoring (literature and data TBA) Currency Transaction Report (CFT) & Suspicious Activity Report (SAT): Use and formats Tools to detect suspicious activity Structure for compliance Sanctions framework and exploration Regional (CAN, U .K., JAP, USA, country of residence) IGOs (UN and EU) Analysis, logistics and implementation towards places of interest augmented with modern data: Ferwerda, J. and Kleemans, E.R. Estimating Money Laundering Risks: An Application to Business Sectors in the Netherlands. Eur J Crim Policy Res 25, 45–62 (2019). Prerequisites: Corporate Finance, Theory of Interest for Finance (check COMPUT FIN), Money & Banking, Mathematical Statistics, Investments & Portfolios in Corporate Finance, A course in financial derivatives.
Bank Risk Management Risk management is the rational development and execution of a plan or strategy to deal with potential losses. Structure and regulation are important phases in risk management; however, data intelligence/skills and computational skills are essential to apply any tangible and practical risk management. Data from different sources/ambiances will often be required. NOTE: course has a logistics and computation approach, rather than a landslide of finesse faux and the mainstream hoodwink expertise. Tools --> All mandatory tools and essential resources (software, data sources, resources) from prerequisite WILL APPLY. NOTE: course will make emphasis on high data usage to build practicality, demonstrate constructiveness and competence. NOTE: for R packages people tend to heavily underestimate what’s in front of them: BondValuation, credule, cvar, CreditMetrics, ESG, fAssets, fImport, FinCal, fOptions, fPortfolio, GCPM, jrvFinance, LSMRealOptions, LDPD, NMOF, optiRum, pa, PerformanceAnalytics, PortfolioAnalytics, psymonitor, Quandl, quantmod, Standardized Approach for Counterparty Credit Risk - (SACCR), SWIM DiffusionRimp, DiffusionRgqd, DiffusionRjgqd, Langevin, sde, Sim.DiffProc, stochvol, yuima Other packages from derivatives courses Plan well, so logistics and implementations are tangible, fluid and cost/time effective. NOTE: financial statements, gov’t data, financial data of capital markets (debt securities, equity, currencies, commodities, derivatives) and repositories will be applied extensively, else, there’s really nothing. Course hours and duration --> Requires 6 hours per week for 18 weeks Course evaluation constituents --> Problem sets (based on prerequisites) 20% Problems, Tasks and Labs from both prerequisites Chapter 22 & 24 Hull text Course Labs 40% Projects Case Studies 40% VaR and Credit Risk references --> Hull, J. C. (2017). Options, Futures and Other Derivatives. Pearson. The chapters of interest in Hull’s text: ONLY chapter 22, 24.6 and 24.9. Concerns only computational field tasks for VaR, credit risk and the relatable practice “Kool-Aid” problems for such chapters/sections. Guiding Literature for Projects --> A. Economic Scenario Generator: Wilkie, A.D. (1986) A Stochastic Investment Model for Actuarial Use, Transactions of the Faculty of Actuaries, 39, 341–403. Wilkie, A.D. (1995) More on a Stochastic Asset Model for Actuarial Use. British Actuarial Journal, 1(5), 777–964 Huber, P. (1997) A Review of Wilkie’s Stochastic Asset Model. British Actuarial Journal, 3(1), 181–210. Bégin, J.-F. (2019) Economic Scenario Generator and Parameter uncertainty: A Bayesian approach. ASTIN Bulletin, 49(2), 335–372. Pedersen. H. et al (2016). Economic Scenario Generators: A Practical Guide. Society of Actuaries Conning (2020), “A User’s Guide to Economic Scenario Generation in Property/Casualty Insurance.” Casualty Actuarial Society, CAS Research Papers. Applying developed skills from R Analysis course and the ESG R package. B. Stress Testing Literature: Montesi, G. & Papiro, G. (2018). Bank Stress Testing: A Stochastic Simulation Framework to Assess Banks’ Financial Fragility. Risk, 6, 82, 54 pages Bellini, T. (2016). Stress Testing and Risk Integration in Banks: A Statistical Framework and Practical Software Guide (in Matlab and R). Elsevier Ltd. Academic Press (Note: any Matlab code can be replicated in R) C. Climate Stress Testing UNEP FI’s Comprehensive Good Practice Guide to Climate Stress Testing. A detailed user guide for financial institutions looking to understand climate stress testing and develop plans for effectively executing them. It has been created to assist the financial sector in its climate stress testing journey and should be adapted to meet the needs of a given firm. Jung, H., Engle, R. and Berner, R. (2021). Climate Stress Testing. Federal Reserve Bank of New York, Staff Reports No. 977 PROJECTS --> Projects case studies for students. Involves strong development in a word processor, R and Excel. Sessions will be vital, so know your priorities. PROJECT 1: Economic Assessment Report (with 3 session guidance) Elements for project development -- Unemployment Inflation (leading) Yield Curve YieldCurve R package Enrico Schumann. Fitting the Nelson–Siegel–Svensson model with Differential Evolution. CRAN R Janpu Hou. (2017). The Yield Curve – Example of Correlation. RPubs Purchasing Manager’s Index (PMI) For development: Vermeulen, P. (2012). Quantifying the Qualitative Responses of the Output Purchasing Managers Index in the US and the Euro Area. European Central Bank. Working Paper Series No 1417. “ The survey based monthly US ISM production index and Eurozone manufacturing PMI output index provide early information on industrial output growth before the release of the official industrial production index” (Vermeulen 2012). Observation of Gov’t Budget Analysis for expenditure and cuts Sectors and Industries relevance Fiscal Policy Monetary policy rules with economic data for possible future central bank action. OECD System of Composite Leading Indicators analysis Global PMI analysis TED Spread analysis (other sovereign risk free assets as well) PROJECT 2: Economic Scenario Generator (ESG) Overview Sessions (3 sessions) Project Components: A. Portfolio selection and optimisation development (having stocks, currencies, gov’t bonds, corporate bonds, loans, mortgages) based on mean-variance, multifactor models, and Principal Component Analysis. B. US Federal Reserve - Monetary Policy Principles and Practice: https://www.federalreserve.gov/monetarypolicy/policy-rules-and-how-policymakers-use-them.htm Identifying economic conditions for their implementation. Anticipating Central Bank policy based on economic data. C. Choice of economic policy/scenarios (monetary, fiscal, systematic) being highly influential on assets and liabilities D. Structuring analysis for ESG based on guiding literature Intimate analysis of computational structure (IA) Logistics for ESG ESG R package logistics (pack) E. Comparative analysis upon portfolios: IA vs pack Note: some mentioned SDEs R packages may also be invaluable. F. Reacquaintance with portfolio rebalancing types versus hedging on (massive assets) PROJECT 3: Stress Testing (ST) Overview Sessions (3 sessions) Project Components: A. Assigned banks’ balance sheets; elements being toxic or junk is irrelevant. Ratio analysis (with trend), Beneish, Dechow, Modified Jones, Altman Z, and use of probability of default (Merton’s model) B. Structuring analysis for ST from chosen stress testing literature Analysis and logistics of chosen approaches C. Implementation and analysis for (B) PROJECT 4: Climate Stress Testing (CST) Overview Sessions (3 sessions) Project Components: A. May apply the same assets and liabilities from prior project B. Structuring analysis for CST from chosen stress testing literature Logistics of chosen approaches Implementation and analysis COURSE LABS --> Note: labs will take up the majority of time of the course. Labs target specific risks in the role of fund managers who also operate in financial institutions. Some labs may be bundled to maintain fluidity and tangibility. List of labs: --Review of balance sheets & other financial statements. It’s essential to capture the role of financial statements in bank risk management. Concerns are purpose and interpretation of data; skills likely will show up in other labs and some projects. --Financial Statements Integrity Basic Horizontal Analysis and Vertical Analysis Restructuring financial statements for ratio analysis (liquidity, profitability, debt) where around 9 to apply. Observation of trend with each ratio. Beneish Model, Dechow F Score, Modified Jones Model, Altman Z Model Off-Balance Sheet notes Special Purpose Vehicle/Entity (SPV/SPE) --Review of Systematic Risk Measurements Note: one needs to definitively comprehend the risk measures, what they represent, and how not to misuse them. Value at Risk (historical, model-building) For chapter 22 of Hull students must have the ability to implement all methods or approaches in such chapter in R (whether manual builds or use of packages). Problem sets in the chapter are generally “lip service” requirements. For the following, must have the ability to implement in R (whether manual builds or use of packages) Beta and portfolio beta CVaR (individual and portfolio) Stressed VaR (individual and portfolio) Systematic risk for stocks with implied volatility Measuring the market’s expectations for an extreme event, often called a “tail event” or a “black swan,” being a drop of at least three standard deviations. Modelling (distributions, fat-tailed, etc.) in a setting with implied volatility. Means to calculate cost of protecting against a drop: (i) Using instantaneous implied volatility to calculate standard deviation of returns (will be actually done). (ii) Responding to current market conditions instead on historical data. (iii) Extending to a portfolio of stocks. Pursue w.r.t. implied volatility Reminder: hedging with options serves to neutralize risk when risk is logically identified; banks apply options strategies for gains as well. --Bonds Standing Financial Statements Integrity (review from earlier module) concerning firms’ financial health. Public Ratings versus Default probabilities by equity (Merton’s model and KMV model): review and development from prerequisite course. Default Correlation Development: A. Merton Model Approach Erlenmaier, U. and Gersbach, H. (2014). Default Correlations in the Merton Model, Review of Finance, 18(5), Pages 1775–1809 B. First-Passage-Time Models Approach Zhou, C. An Analysis of Default Correlations & Multiple Defaults. Rev. Financ. Stud. 2001, 14, 555–576. Valužis, M. On the Probabilities of Correlated Defaults: A First Passage Time Approach. Nonlinear Anal. Model. Control 2008, 13, 117–133. Metzler, A. On the First Passage Problem for Correlated Brownian Motion, Stat. Probab. Lett. 2010, 80, 277–284 Li, W. Probability of Default & Default Correlations. J. Risk Financial Manag. 2016, 9, 7 C. Multi-Factor Models Approach PESTEL + SWOT for firms (with robust templates) Beta Type Measures Aslanidis, N., Christiansen, C. and Cipollini, A. (2019), Predicting Bond Betas using Macro-Finance Variables, Finance Research Letters, Volume 29, Pages 193-19 Pilotte, E., & Sterbenz, F. (2006). Sharpe and Treynor Ratios on Treasury Bonds. The Journal of Business, 79(1), 149-180. --Liquidity Risk Measurement: Gabbi, Giampaolo. (2004). Measuring Liquidity Risk in a Banking Management Framework. Managerial Finance. 30. 44-58. Banks E. (2014). Measuring Liquidity Risk. In: Liquidity Risk. Global Financial Markets Series. Palgrave Macmillan, London Jobst, A. A. (2014). Measuring Systemic Risk-Adjusted Liquidity (SRL) - A Model Approach. Journal of Banking & Finance, 45, 270. Note: there’s the IMF Working Paper version for the above Pathi, R. (2017). Measuring Liquidity Risk in a Banking Management Framework. EAPJFRM Volume 8 Issue 2 Stress Testing: Liquidity Coverage Ratio Jan Willem van den End. (2008). Liquidity Stress – Tester: A Model for Stress Testing Banks’ Liquidity Risks. DNB Working Papers 175, Netherlands Central Bank, Research Department Arora, R. et al. (2019). Bond Funds and Fixed-Income Market Liquidity: A Stress-Testing Approach. Technical Report No. 115, Bank of Canada Cont, R., Kotlicki, A. & Valderrama, L. (2020). Liquidity at Risk: Joint-Stress Testing of Solvency and Liquidity. Journal of Banking & Finance 118, 105871 --Interest Rate Risk Quantifying Interest Rate Risk Gap Analysis Economic Value of Equity Net Interest Income Abdymomunov, A. and Gerlach, J. Stress Testing Interest Rate Risk Exposure, Journal of Banking & Finance 49 (2014) 287–301; interested in Svensson extension as well. Multifactor models applied to interest rate Feature Selection applied to interest rate Managing Interest Rate Risk Interest Rate Risk Management using Duration Gap Methodology Principal Component-Based Fixed Income Immunization Hedging: interest rate swaps, forward rate agreements (FRAs). Reminder: hedging serves to neutralize risk when risk is logically identified; not make money. --Credit Risk Review crediting ratings Interest in 24.6 and 24.9 of Hull; consider only related problem sets. Note: for all computation or monte carlo tools in such two chapter sections students should have the ability to implement them in R. Coverage Ratios, Liquidity Ratios, Solvency Ratios Trend observation as well Altman Z Score review and implementation Advance review and implementation of determining probability of default by equity via Merton’s model and KMV model from prerequisite course. Note: compare to credit agencies ratings. Recital of Expected Loss from prerequisite course Modelling and stress testing for credit risk: Drehmann, M., Sorensen, S. and Stringa, M. The Integrated Impact of Credit and Interest Rate Risk on Banks: A Dynamic Framework and Stress Testing Application. Journal of Banking & Finance, 34 (2010) 713 – 729 Chan-Lau, J. (2003). Anticipating Credit Events Using Credit Default Swaps, with An application to Sovereign Debt Crises. IMF Working Paper, WP/03/106 --Inflation Risk Forecasting must be developed: Meyer, B. H. and Pasaogullari, M. (2010), Simple Ways to Forecast Inflation: What Works Best? Federal Reserve Bank of Cleveland Economic Commentary, Number 2010-17 Interest premiums required to offset forecasted inflation for future investment assets and liabilities to incur. What models or tools can be implemented? Fed Policy Rule (overview) Monetary Policy Principles and Practice - Policy Rules and How Policymakers Use Them: https://www.federalreserve.gov/monetarypolicy/policy-rules-and-how-policymakers-use-them.htm What economic data is relevant and the criteria required to apply a respective policy rule (from prior)? Means to analyse how such policy (or rules) drives markets. Can such be quantified with predictive models or ESGs? --Currency Exposure & Risk Measuring Currency Exposure (review prerequisite and implement) Value-at-Risk estimation of currency exchange risk (review prerequisite and implement) NOTE: may need (or be asked) to adjust to an implied volatility setting similar to what was done with stocks earlier. Range forward contracts development (upturn and downturn) --Application of the TED Spread to Systematic Risk Note: develop counterparts for other developed countries for a global perspective. --Capital Adequacy Measures Total Capital Ratio, Tier 1 Ratio Capital adequacy ratio, also known as capital-to-risk weighted assets ratio (CRAR). Leverage Requirements --Standardized Approach for Counterparty Credit Risk (SACCR) Basel Committee on Banking Supervision. (2014). The Standardized Approach for Measuring Counterparty Credit Risk Exposures. Bank for International Settlements: https://www.bis.org/publ/bcbs279.pdf Use of SACCR R package Prerequisite: Commercial Bank Management, R Analysis
Corporate Risk Management Course will make use of computation and simulation tools. Outcomes: -Identify and explain various interpretations of risk -For each interpretation of risk, understand and be able to calculate various measures of risk -Calculate and interpret characteristics of probability distributions -Conduct and interpret Monte Carlo simulations -Understand the condition under which diversifiable risk does and does not affect firm value -Evaluate circumstances under which risk reduction will increase firm value -Interpreting types of Value-At-Risk (VaR), calculation in simple settings, & know the faults -Understand the factors that determine the price of insurance in a competitive market -Construct simulation models to price insurance contracts -Understand contractual provisions in commercial insurance contracts -Understand the types of derivative contracts and how they can be used to reduce risk -ISO IEC 31010:2019 Risk Management — Risk Assessment Techniques Assessment --> Lab Assignments Will incorporate R and Excel 9 Assignments Groups Projects Required tools --> R with RStudio and packages Excel and @RISK software ISO 31010 - Risk Management Techniques Course to make use of various data and financial sources. Course will also make use of balance sheets, income statements, cash flows statements, etc. Journal articles of interest to be introduced at designated times with topics. Course Computational Outline --> A. INTRODUCTION TO CORPORATE RISK MANGEMENT 1.What is risk? 2.The risk management process 3.Objectives of corporate risk management 4.Potential behaviour biases that can impact risk management decisions 5. Decision making with less-than-perfect information B. PROBABILITY DISTRIBUTIONS AND USE OF R FOR EDA 1.Characteristics of Probability Distributions 2.Covariance and Correlation Includes forms of correlation and appropriate usage Mukaka M. M. (2012). Statistics Corner: A Guide to Appropriate Use of Correlation Coefficient in Medical Research. Malawi Medical Journal: The Journal of Medical Association of Malawi, 24(3), 69–71. 3.The Normal Distribution (ND) Assumptions for ND. Appropriate use of normal distribution. 4 EDA & Goodness of Fit Summary Statistics. Skew and Kurtosis Q-Q plots Applying the ggpairs() function Correlation heat maps Advanced Tests: Chi-Square test, Kolmogorov–Smirnov test, Anderson-Darling, Shapiro-Wilk test MLE and MoM Confidence intervals (not confined to normal) GROUP PROJECT: first assigned groups projects will be based on (A) - (B) C. REACQUAINTANCE MODELLING, SIMULATION WITH R Note: applications to be hands-on computational for all. For the methods that aren’t monte carlo, concerns and practical resolutions for when data isn’t normal. 1.Historical Simulation 2.Monte Carlo Simulation (towards uncertainty in formulas/models) Basic Modelling Concepts Inputs: constants versus random variables Assigning probability density generators to random variables Simulations in RStudio and Excel 3.Value at Risk Historical simulation Historical Based Outlier Score (HBOS) Historical Simulation (HSVaR) For real historical data how is HBOS applicable to HSVaR? Variance-Covariance Monte Carlo 4.Conditional Value at Risk and Stressed Value at Risk With assumption of non-normality. 5.Stressed Value at Risk with assumption of non-normality. 6.Niclas, A., Jankensgård, H. and Oxelheim, L. (2005). Exposure-Based Cash-Flow-at-Risk: An Alternative to VaR for Industrial Companies. Journal of Applied Corporate Finance 17, no. 3 (2005): 76-86. Note: compare to VaR methods (3) to (5). D. WHEN DOES RISK INCREASE VALUE? Effect of expected losses on expected cash flows Effect of variability of cash flows on the cost of capital Effect of variability of cash flows on expected cash flows How Taxes can influence risk management decision GROUP PROJECT: second assigned groups projects will be based on (C) and (D). E. INVESTMENT DECISIONS 1.Gov’t registries and legal standing 2. Gov’t Commissions Securities Exchange, Commerce, Trade Commission: operational standing. Acquiring authentic financial statements. Provincial and municipal level: operational standing. Acquiring authentic financial statements. 3.The three-statement model 4.Horizontal Analysis & Vertical Analysis for financial statements 5.Financial Ratios (data driven tasks via adjusting financial statements) Coverage Ratios, Liquidity Ratios, Profitability Ratios, and Efficiency Ratios. Finding trend in the ratios (if applicable). 6.Tools and techniques to identify possible financial statements fraud: Beneish Model, Modified Jones Model, Dechow F Score, Altman Z, Ohlson O-Score 7.Off-Balance Sheet notes 8.Special Purpose Vehicle/Entity (SPV/SPE) Purpose, tactics/deception 9.Capital Budgeting framework and essential features Typical projects or investments 10.Discount Rate Cost of equity WACC Adjusted Present Value (APV) Risk Adjusted Value (multi-factor models). 11.Clark, V., Reed, M. and Stephan, J. (2010). Using Monte Carlo Simulation for a Capital Budgeting Project. Management Accounting Quarterly, Volume 12, Number 1 12.Platon, V. and Constantinescu, A. Monte Carlo Method in Risk Analysis for Investment Projects. Procedia Economics and Finance 15 (2014) 393 – 400 13.Penalized Present Value. How does such compare with (11) and (12) 14.Confidence Capital required to be at least 95% sure of having enough for a project (possibly with other ongoing projects). Amount in reserves needed to be at least 95% sure of covering the risks in business? GROUP PROJECT: third assigned groups projects will be based on (E). F. COST-BENEFIT ANALYSIS (NPV and/or IRR based) 1.Framework analysis and logistics for monetised aspects There are professional guides for planning and development 2.Project-based development (logistics and will be highly quantitative) Means to competently account for costs and benefits Critical values like discount rate or rate of return Cost of equity, WACC, APV, multi-factor models Tools such as RIMS -II, IMPLAN, Chmura, LM3 or REMI may factor in 3. Campbell, H., & Brown, R. (2003). Benefit-Cost Analysis: Financial and Economic Appraisal using Spreadsheets (pp. 194-220). Cambridge: Cambridge University Press 4.Inflationary Environment Velez-Pareja, Ignacio, (1999). Project Evaluation in an Inflationary Environment, Cuadernos de Administracion, Vol. 14, No. 23, pp. 107-130 Velez-Pareja, Ignacio and Tham, Joseph, (2002). Valuation in an Inflationary Environment 5.Sener Salci & Glenn P. Jenkins, 2016. “Incorporating Risk and Uncertainty in Cost-Benefit Analysis”, Development Discussion Papers 2016-09, JDI Executive Programmes. GROUP PROJECT: fourth assigned groups projects will be based on (F). G. REDUCING RISK WITH INSURANCE 1.Purpose of insurance 2.Insurance Rate Making (to be implemented) The following journal article to be analysed, then will investigate the feasibility and practicality. Namely, making the formulas, measures and parameters meaningful from data or computation. We want competent and fluid applicability Williams, C. A. (1954). An Analysis of Current Experience and Retrospective Rating Plans. The Journal of Finance Vol. 9, No. 4, pp. 377-411 (35 pages) Internal Rate of Return Method Feldblum, S. (1992). CASACT Vaughn, T. R. Misapplication of Internal Rate of Return Models in Property/Liability Insurance Ratemaking. CASACT Generalised Linear Models Tober, S. (2020). Basics of Insurance Pricing: With a Quick Intro to GLM Models. Towards Data Science Ohlsson, E. and Johansson, B. (2010). Non-Life Insurance Pricing with Generalised Linear Models. Springer 3.Contractual provisions (deductibles, limits, exclusions) 4.Claims Valuation/Calculation 5.Estimating Claims Settlement with Generalised Linear Models GROUP PROJECT: fifth assigned groups projects will be based on (G). H. CURRENCY RISK 1.For the following journal articles will like to incorporate more modern data and treat other industries as well: Hekman, C. R. (1983). Measuring Foreign Exchange Exposure: A Practical Theory and Its Application. Financial Analysts Journal, 39 Khoo, A. Estimation of Foreign Currency Exposure: An Application to Mining Companies in Australia. Journal of International Money and Finance. Vol 13, Issue, June 1994, Pages 342 – 363 2.For the following literature will focus on development of VaR for multiple currencies in portfolio: Papaioannou, M. (2006). Exchange Rate Risk Measurement and Management: Issues & Approaches for Firms. IMF Working Paper WP/06/255 3.Currency Swaps (definitions and scenarios) Cross-currency coupon swap Cross-currency basis swap GROUP PROJECT: sixth assigned groups projects will be based on (H). I. WEATHER RISK INSTRUMENTS Note: will emphasize realistic and practical applications, modelling and operations. Literature for realistic and tangible engagement. Weather Index Insurance. For such articles there will be labs to develop and compare with data for chosen environments: Taib, C. M. I. C. T. and Benth, F. E. (2012). Pricing of Temperature Index Insurance. Review of Development Finance. Volume 2, Issue 1, pages 22 – 31 Shirsath, P. et al. (2019). Designing Weather Index Insurance of Crops for the Increased Satisfaction of Farmers, Industry and the Government. Climate Risk Management, Volume 25, 100189 Andrea Martínez Salgueiro, (2019). Weather Index-Based Insurance as a Meteorological Risk Management Alternative in Viticulture. Wine Economics and Policy, Volume 8, Issue 2, Pages 114-126 Boyd, M. et al. (2020). The Design of Weather Index Insurance Using Principal Component Regression and Partial Least Squares Regression: The Case of Forage Crops, North American Actuarial Journal, 24:3, 355-369 GROUP PROJECT: seventh assigned groups projects will be based on (I). J. ISO IEC 31010:2019 RISK MANAGEMENT— Risk Assessment Techniques GROUP PROJECT: assigned groups RAT topic(s). Prerequisites: Enterprise Data Analysis I & II, International Financial Statements Analysis I & II, Corporate Finance, Probability & Statistics B, Mathematical Statistics OPERATIONS MANAGEMENT/APPLIED OPERATIONAL RESEARCH Operation Management endeavors reside under the Business institution. OM/OR curriculum: --Mandatory Courses Calculus for Business & Economics I-III; Optimisation (check Actuarial post); Probability & Statistics B (check Actuarial post); Mathematical Statistics (check Actuarial post) --Core Courses (constituted by the following 5 components): 1. Tools << Business Communication & Writing I & II; Enterprise Data Analysis I & II (check FIN); International Financial Statement Analysis I & II (check FIN); Corporate Finance (check FIN) >> 2. Economic Integrity << Microeconomics I & II >> 3. Necessities << Network Optimisation; R Analysis (check Actuarial post); Operations Management I & II; Applied Decision Analysis >> 4. Professional Skills Requirements << International Commerce (check FIN); Logistics & Inventory; Service Operations Management (check RM); Supply Chain Modelling & Analysis; Operations Planning & Scheduling >> 5. There are electives to choose from (MUST CHOOSE 3 or 4): Investments & Portfolios in Corporate Finance (check FIN) Corporate Risk Management (check FIN) Agriculture and Economic Sustainability (check ECON) Public Project Management (check PA) Transportation Modelling (check CIVE) Programme Evaluation I & II (check PA) Note: the Quantitative Analysis in Political Studies I prerequisite to be replaced by either Mathematical Statistics or R Analysis. Engineering Cost & Production Economics course (check ENGR under IE section) FOR THE FOLLOWING COURSES CHECK IN ACTUARIAL POST: Optimisation, Probability & Statistics, Mathematical Statistics Course Descriptions --> Network Optimisation Network flow problems are a subclass of linear programming problems, with applications in a wide range of areas. In this course, we will survey algorithms and applications of network flow problems. Focus topics will be: MAXIMUM FLOWS SHORTEST PATHS MINIMUM COST FLOWS MINIMUM SPANNING TREES Course Intensions --> 1. Knowledge of the key network optimization problems, and state-of-the-art algorithms for solving them. 2. Algorithmic thinking skills: – obtaining intuition for the development of algorithms. – finding an algorithm’s “weaknesses” or proving they do not exist: ∗ proving correctness ∗ running time analysis 3. Recognise applications of network flows and to demonstrate equivalence of problems. Typical Text --> Ravindra K. Ahuja, Thomas L. Magnanti and James B. Orlin, Network Flows: Theory, Algorithms, and Applications, Prentice Hall Topic Outline --> We will cover (parts of) Chapters 1-10, 12, 13, and 19. Modelling and construction of algorithms before computational environment is vital in order to comprehend what you’re really doing with packages and functions. It may also be possible to employ different packages for different pursuits with different topics --> Primitive Resources: -- http://rpubs.com/alexgeor/CPLEX1 >> -- Concerning optimal trees in weighted graphs one can make use of the R package “optrees” The R package “igraph” also has value: https://henrywang.nl/maximum-flow-problem-with-r/#more-21 -- netgen R package -- Other R packages (TSP, vrp, osrm) Homework --> Homework assignments in the beginning in a limited fashion to reacquaint one with standard linear optimisation modelling complemented by use of R to solve them. Towards network optimisation there will be standard problem sets, for modelling, and along with optimisation with R in order to best serve your interests. Exams will concern the following abilities: (1) to apply knowledge of mathematical modelling skills and recognition of models and algorithms (2) Algorithm design/structuring. Correctness and running time analysis. (3) Ability to actually implement R operations and use of packages for solution finding. Will be encountered often for consistency. (4) In some cases one doesn’t expect a student to memorize every algorithm, rather the ability to determine what it does, how to classify it, how data should be structured, etc. There may be trick questions: Information told about algorithm isn’t perfectly accurate Algorithm may be rubbish First Exam --> Will be in-class, open notes and R applicable. Questions will reflect homework. Second Exam --> Will be take home to make use of notes and R. In addition, questions observed to be consistently wrong or error prone in resolutions by students (homework and exam 1) will show up. Will also incorporate the latter topics in both depth and magnitude. Final Exam --> Will be similar to second exam, but will be comprehensive and in-class to encompass all of the term. Students will be randomly given different exam sheets. So, you have a networking problem to take up your time. Assessment --> Homework 25% Exam 1 20% Exam 2 20% Final Exam 35% Prerequisite: Optimisation Operations Management I 1.Process Analysis: to evaluate the performance of business processes, and how to identify opportunities for improvement. 2.Inventory Management: to recognise the different types of inventory in a supply chain and the reasons for its accumulation, and tools for deciding how much inventory a business should hold under different circumstances. 3.Quality Control: to measure and control the quality of the output of a business process. 4.Exposure to the more advanced topics of Queueing (measure and reduce waiting times), Revenue Management (manage prices and product availability), and Supply Chain Coordination (establish mutually beneficial relationships among partners in a supply chain). A few notes on grading components --> Student groups: projects and presentations are group assignments. Students should form groups of five members each by the end of the first week of class, and each group should email its composition as soon as it is formed. NOTE: projects will be based on Process Analysis and Quality Management NOTE: homework will emphatically encourage the use of R, Excel and other software alongside analytical development based on Queuing, Inventory Management, Supply Chain. Exams --> Exams will concern the only the following three areas: Queuing, Inventory Management, Supply Chain. Will allowed limited notes during exams. Course will not be much without a quantitative/computational environment. With much effort to consistently apply Excel and R usage; will apply to homework as well. For the R environment in assignments throughout there must be commentary along with development. Typical text: VARIOUS LITERATURE Tools --> R packages + RStudio Excel Microsoft Project Grade Assessment --> Homework 20% Projects + Presentations 20% Exam I 20% Exam II 20% Exam III (Final) 20% WEEK 1 – 5 Tools of concern: Excel/Microsoft Project Introduction Processes Analysis: Processes Flow Diagrams, Capacity, Flow Rate Processes Analysis: Gantt Charts, Cycle Time Processes Analysis: Utilization, Line Balancing Processes Analysis: Pipeline Inventory, Little’s law Processes Analysis: Setup Times, Batching WEEK 6 – 9 Note: R Packages of interest (applied when appropriate) --> queueing queuecomputer Student Presentations I Review: Review of exponential and Poisson Queuing: Waiting & Arrival Models Queuing: Staffing, Pooling, Lost Demand Ebert, A., Wu, P., Mengersen, K., & Ruggeri, F. (2017). Computationally Efficient Simulation of Queues: The R Package queuecomputer. arXiv Note: observe packages manuals for full possibilities WEEK 10 – 12 Note: R Packages of interest (applied when appropriate) --> SCperf Inventorymodel inventorize MRP tsutils Topics in such weeks: Inventory Management: Economic Order Quantity Inventory Management: Economic Production Quantity Inventory Management: Newsvendor Salazar, R. Newsvendor Inventory Problem with R. Medium Analytics Vidhya Multi-period Base Stock Policy (R,Q) Policy Salazar, R. ABC Inventory Analysis with R: Effective Inventory Planning and Managing. Medium ABC Analysis, XYZ Analysis, ABC-XYZ Analysis WEEK 13 – 15 Note: R Packages of interest (applied when appropriate) --> Packages from week 10 12; cplexAPI, CVXR, lpSolve, lpSolveAPI, NlcOptim, nloptr, ROI, gurobi TSP, vrp, osrm, qrmtools, qcc, taktplanr Supply Chain Management I Supply Chain Management II WEEK 16 – 17 Quality Management: I Quality Management: II Quality Management: Lean Operations WEEK 18 Student Presentations II Prerequisites: Enterprise Data Analysis I & II, Optimisation, Probability & Statistics B Operations Management II Note: packages and tools from prerequisite will reverberate throughout course. Grading --> Prerequisite refresher tasks R projects 3 Exams Prerequisite refresher tasks --> Students will be given problem sets, projects, and assignments with R usage & other software. R projects --> Concerns process analysis, data envelopment analysis, and stochastic frontier analysis Exams --> Exams will be based on personnel scheduling, queuing, and perishable inventory, DEA and SFA. Students are allowed access to R and Excel. COURSE OUTLINE --> 1. Personnel Scheduling Note: R Packages of interest for this module (applied when appropriate after modelling development): cplexAPI, CVXR, lpSolve, lpSolveAPI, NlcOptim, nloptr, Rglpk, ROI Brucker, P., Qu, R., and Burke, E., Personnel Scheduling: Models and Complexity, European Journal of Operational Research 210 (2011) 467–473 The above article to serve as a categorization guide: (i) permanence centred planning (ii) fluctuation centred planning (iii) mobility centred planning (iv) project centred planning Emphasis on determining what type of scheduling should apply to cases considered. Other particular examples: Kassa, B., A., and Tizazu, A., E., Personnel Scheduling Using Integer Programming Model-A application at Avanti Blue-Nine Hotels, SpringerPlus, 2013; 2: 333 Becker, T., Steenweg, P., M., and Mareike, P., and Werners, B., Cyclic Shift Scheduling with On-Call Duties for Emergency Medical Services, Health Care Management Science, Springer Nature 2018 Semra Ağralı, S., Taskin, Z., C., and Tamer Ünal, A., T., Employee Scheduling in Service Industries with Flexible Employee Availability and Demand, Omega 66 (2017) 159–169 2. Advance Recital of Queuing & Activities R Packages of interest queueing queuecomputer --Waiting Models, Staffing, Pooling, Lost Demand --Additional structure where simulations will also be pursued in R: Ingolfsson, A. Haque, M. A. and Umnikov, A. (2002). Accounting for Time Varying Queuing Effects in Workforce Scheduling. European Journal of Operational Research, volume 139 , issue 3, pages 585 – 597 Defraeye M., Van Nieuwenhuyse I. (2015). Personnel Scheduling in Queues with Time-Varying Arrival Rates: Applications of Simulation-Optimization. In: Dellino G., Meloni C. (eds) Uncertainty Management in Simulation-Optimization of Complex Systems. Operations Research/Computer Science Interfaces Series, vol 59. Springer, Boston, MA 3. Advance Recital of Processes Analysis and Activities Will make make us of Excel and Microsoft Project 4. Advance Recital of Inventory Management R Packages of interest (if still applicable to topics): SCperf, Inventorymodel, inventorize, tsutils, MRP 5. Perishable Inventory Note: don’t want topic to turn into Sir Arthur Conan Doyle’s “Lost World”. Text Examples: Nahmias, S. (2011). Perishable Inventory Systems. Springer Gor, R. (2011). Management of Perishable Inventory: A Mathematical Modelling Approach: Study of Optimal Ordering Policies for Time Varying Decay Rate of Inventory Under Different Payment Conditions. LAP LAMBERT Academic Publishing 6. Data Envelop Analysis (DEA) Note: many parts will be applications focused, data oriented and will be projects based. Concerns efficiency in firms, industries, markets, sectors, agriculture R Packages of Interest for DEA: rDEA, deaR, Benchmarking --Concepts, structure, applications --Lotfi, F.H. et al (2020). Data Envelopment Analysis with R. Springer --Ranking --Narasimhan, R., Talluri, S. and Mendez, D. (2001). Supplier Evaluation and Rationalization via Data Envelopment Analysis: An Empirical Examination. Journal of Supply Chain Management, Volume 37 Issue 2. Pages 28 – 37 --Evaluate performance of chosen industries --Chance-Constrained Data Envelopment Analysis Land, K. C., C. A. Knox Lovell, & Thore, S. (1993). Chance-Constrained Data Envelopment Analysis. Managerial and Decision Economics, 14(6), pages 541–554. Note: to extend to other applications 7. Applied Multivariate Regression --Applied review from Mathematical Statistics course 8. Stochastic Frontier Analysis (SFA) Note: will be applications focused, data oriented and will be projects based. Concerns efficiency in industries, markets, sectors, agriculture R Packages of Interest for SFA: frontier, npsf, sfa, ssfa, semsfa, Benchmarking --To be competent or formidable in the R computational environment one must understand what they’re computing. --Further analytic structuring (if required): Aigner, D.J.; Lovell, C.A.K.; Schmidt, P. (1977) Formulation and Estimation of Stochastic Frontier Production Functions. Journal of Econometrics, 6: 21 – 37. Literature R guides assist: Guo, X. et al (2018). Specification Testing of Production in a Stochastic Frontier Model. Sustainability, 2018, 10 (9), 3082 Ferrara, Giancarlo. (2020). Chapter 9, Stochastic Frontier Models Using R, pages 299 – 326. In: Vino, H. D. and Rao, C. R. Handbook of Statistics (vol 42). Financial, Macro and Micro Econometrics Using R. North Holland Elisa Fusco & Francesco Vidoli (2015). Spatial Stochastic Frontier Models: Instructions For Use. CRAN R Robin C. Sickles & Wonho Song & Valentin Zelenyuk, 2020. Econometric Analysis of Productivity: Theory and Implementation in R. Pages 267 – 297. In: Vino, H. D. and Rao, C. R. Handbook of Statistics (volume 42). Financial, Macro and Micro Econometrics Using R. North Holland R structure: https://sites.google.com/site/productivityinr/ 9. SFA versus DEA Advantages and disadvantages Prerequisites: Operations Management I, Mathematical Statistics Logistics & Inventory Role of L&I management: warehousing, transportation, facility location, forecasting, inventory management and assortment planning. -Concepts, techniques, methods and applications of logistics and inventory management strategic planning. -Quantitative/computational environment. With much effort to consistently apply Excel and R usage; will apply to homework, quizzes and exams; must always accompany analytical development. For the R environment in assignments throughout there must be commentary along development. Homework --> Concerns learning and skills reinforcement. Quizzes --> There are 3 in-class quizzes during the class period. These are closed-book, but students are permitted to bring sheet of notes. Exams --> There are 3 exams throughout course. They are closed-book, but students are permitted to bring 2 – 3 sheets of notes. Field Studies Projects (FSPs) --> Groups will be responsible for analysis and modelling with logistics and supply chain systems assigned to them. There will be numerous visits. There will be much data gathering towards modelling, computation and simulation pursuits, based on knowledge and skills from course. Each group will be responsible for 5 phases. Note: for sites to have sign off log sheets with description of encounters. Project guides to be provided. Students are expected to competently apply a GIS, R with packages, and possibly Excel. FSPs: Based on Week 2-6 Based on Week 7-8 Based on Week 9-10 Based on Week 11-13 Based on Week 14 Technology requirement --> R environment Excel GIS Word Processor R packages of interest: SCperf, Inventorymodel, inventorize, tsutils, MRP cplexAPI, CVXR, lpSolve, lpSolveAPI, NlcOptim, nloptr, Rglpk optrees, igraph ROI, gurobi TSP, vrp, osrm, qrmtools, qcc, taktplanr Course Texts --> Ronald H. Ballou. Business Logistics/Supply Chain Management, 5th Edition. Pearson Prentice Hall 2004 Chopra, Sunil and Peter Meindl. 2016. Supply Chain Management: Strategy, Planning, and Operation, 6th Edition. Pearson Prentice Hall. Course Grading --> Homework 3 Quizzes 3 Exams Field Studies Projects Course outline --> WEEK 1 Introduction and course overview WEEK 2 – 3 Warehousing and Storage Management WEEK 4 Cross-docking and Transit Point WEEK 5 – 6 Transportation and Routing WEEK 7 – 8 Third-party Logistics Facility Location and Network Design WEEK 9 – 10 Capacity Location and Logistical Design Demand Forecasting WEEK 11 – 13 (ultimate goal is to extend to applications of interest) Inventory Advance Recital (from Operations Management I) ABC - XYZ Analysis Thieuleux, E. (2022, August 17). ABC XYZ Analysis in Inventory Management: Example in Excel. AbcSupplyChain Sap. (2016, June 17). ABC/XYZ Analysis. SAP Help Portal WEEK 14 Aggregate Inventory Control and Risk Pooling WEEK 15 Assortment Management Prerequisite: Operations Management I Applied Decision Analysis: This course concerns the use of analytical and computational skills in practical decision making. Course will be highly project oriented. For most or many succeeding modules expect to build on prior modules. Homework --> For each module there will be assigned homework concerning standard problems. Also, be prepared to use Excel and R extensively. Projects --> There will be 5 – 9 projects (individual and/or group) for each module to pursue. Projects will often incorporate high usage of the R environment and Excel. Exams --> For each exam you are permitted to bring 5-6 loose leafs of notes; exams go beyond memorization, and you can’t remember everything off hand.. You are making big decisions, rather than being the brat or scum or scourge of the year. All exams will require use of R and Excel. You will also still be required to state analysis, developments and modelling as preliminaries to R and Excel use. Concerning probability/statistics I don’t like to give ideal or counterfeit data from textbooks; you will have to personally fetch and investigate raw data. Tools --> R with packages Assume use of your conventional probability and statistics R skills Assume use of R packages for optimisation (linear, integer, mixed, quadratic, etc., etc.) Analytic Hierarchy Process: ahp, Prize, ahpsurvey Multi-objective programming and Goal programming, 90C29: caRamel, GPareto, mco, emoa, rmoo Quantitative Multicriteria Decision Aiding Process MCDA R package PROMETHEE PROMETHEE R package Marginal Effects: margins Options LSMRealOptions Qualitative Multicriteria Decision < http://www-ai.ijs.si/MarkoBohanec/dexi.html > Microsoft Office 365 Excel usage when constructive Word Processor Sources --> Aside from given texts and articles there are many texts and journal articles to build on, to acquire a strong foundation with substance and applicability. For a student recognition from analysis will be crucial for success. Grading --> HW 10% Projects 45% 3 Open Notes Exams 45% NOTE: on exams you will encounter applications questions focused on comprehension, proper usage, logistics and implementation. Course Modules/Topics --> 1. Multiperiod Planning Models Applications of interest: Production/inventory planning Human resource staffing Capacity expansion/plant location problems Investment problems (bonds and Income) Possible guides: Schrage, L. (2018). A Guide to Optimization-Based Multiperiod Planning, INFORMS TutORials in Operations Research () 50-63 Hansmann, F. and Hess, S. W. (1960). A Linear Programming Approach to Production and Employment Scheduling. Management Science 1(1) 46-51 Tadeusz Sawik (2019). Two-Period vs. Multi-Period Model for Supply Chain Disruption Management, International Journal of Production Research, 57:14 2. Analytic Hierarchy Process Some resources if needed: Saaty, T.L. (1980). The Analytic Hierarchy Process: Planning, Priority Setting, Resource Allocation. McGraw-Hill Lawrence Bodin, L. and Gass, S. I. (2014). Exercises for Teaching the Analytic Hierarchy Process. INFORMS Transactions on Education 4(2), pp 1–13 Vargas, R. V. (2010). Using the Analytic Hierarchy Process (AHP) to Select and Prioritize Projects in a Portfolio. Paper presented at PMI® Global Congress 2010—North America, Washington, DC. Newtown Square, PA: Project Management Institute 3. Preference Ranking Organization Method for Enrichment of Evaluations (PROMETHEE) Brans, J. P., & Vincke, P. (1985). Management Science, 31(6), 647-656. Brans, J. P., & Mareschal, B. (2005). PROMETHEE methods. In Multiple Criteria Decision Analysis: State of the Art Surveys (pp. 163-186). Springer Applications for PROMETHEE: TBD AHP versus PROMETHEE 4. Stochastic and Statistics Tools Review axioms of probability distributions Simulating random variables (or frequency distributions) and interpretation Structuring & analysis of basic real world events Computational development/representation of real world events events The Normal Distribution Arguments for its emergence and practicality Limpert, E. & Stahel, W. A. (2011). Problems with Using the Normal Distribution and Ways to Improve Quality and Efficiency of Data Analysis. PloS one, 6(7), e21403. Dealing with missing data Simulating data when real data is elusive Sample size determination EDA & Goodness of fit (advanced development) Summary Statistics (include skew and kurtosis) Q-Q plots Correlation (development and large data sets) Assumptions for Pearson Correlation & computational means of verification Extend following beyond the field of medicine: Mukaka M. M. (2012). Statistics Corner: A Guide to Appropriate Use of Correlation Coefficient in Medical Research. Malawi Medical Journal: The Journal of Medical Association of Malawi, 24(3), 69–71. Correlation heat maps. Applying the ggpairs() function Comprehending critical values for ideal distributions (not only normal) Why care about such? Real data and theirs distributions Chi-Square test, Shapiro-Wilk test, Kolmogorov–Smirnov test, Anderson-Darling test. Note: Q-Q plots for narrowing choice before using tests. Maximum Likelihood Estimators and Method of Moments Outlier Detection with No Assumption about the Distribution Histogram Based Outlier Score Local Outlier Factor Practical Inference We are not concerned with zombie textbook problems. What’s important is how it’s meaningful to you with your future endeavours in OM/AOR. NOTE: all topics in the EDA and Goodness of-fit module will be crucial; no normality means no T-test and F-test NOTE: will be restricted to the following -- Sample size determination Test for independence McHugh ML. (2013). The Chi-square Test of Independence, Biochem Med (Zagreb). 23(2): 143-9. Using Fisher’s Exact Test as an alternative Difference between populations/groups/time periods (mean and median) Note: will only apply tests that don’t assume normal distribution Univariate case and multivariate attributes Will also identify the larger (for mean and median) Test of variance Note: will apply tests that don’t assume normal distribution Significance of the correlation coefficient. What if not Pearson? Interpreting summary statistics for multivariate regression models 5. Feature Selection (will be hands-on and comparative) Note: a feature is the same as a predictor variable; a target is equivalent to a response variable. First, for datasets chosen will develop correlation matrices heatmaps. Second, will explore a method for feature selection. Will identify the concept, followed by (practical, tangible and fluid) analytical structure. Then implementation logistics. Then implementation in the R environment. Will make use of datasets with multiple features. Univariate Feature Selection Recursive Feature Selection Boruta FSelectorRccp Note: compare results among all. As well, examination of correlation heat map (via either Pearson or spearman or Kendall) to observe any possible multicollinearity. 6. Multivariate Regression Advance review of OLS models from Mathematical Statistics Review of knowledge and R skills for multivariate from Mathematical Statistics Variables selection Summary statistics for model Forecasting & Error Marginal Effect Augmented by the following: Scatter plot matrix and influence on choice of regression model Quantile Regression (to develop logistics, and applications development in R) Motives; model structure and computational structure; summary statistics; contrast to OLS counterpart via summary statistics. Contrast to OLS forecasting and error. Marginal effect compared to OLS. LOESS/LOWESS versus Spline Observing scatter plot matrix review. Are the trends (positive or negative) in scatter plots absolute? Implications for multivariate models and forecasting. OLS versus Quantile versus LOESS/LOWESS versus Spline versus Quantile regression Observing trend and summary statistics Forecasting & Error 7. Multivariate Logit Regression (to develop logistics, and applications development in R) Motives; model structure and computational structure; evidence for variables; variables selection; summary statistics analysis; calculating probabilities/predicted probabilities; marginal effects Feature importance logistic regression method 8. Agricultural Planning Optimisation (real data relevant) Target MOTAD. Articles following as guides for development. However, will be working with real agriculture data from farmers/producers in environments of interest for development. Structural guides: Tauer, L. W. (1983). Target MOTAD. American Journal of Agricultural Economics, 65(3), 606–610. Watts, M. J., Held, L. J. and Helmers, G. A. (1984). A Comparison of Target MOTAD to MOTAD. Canadian Journal of Agricultural Economics, 32(1), pages 175 -186. Curtis, C. E. et al. (1987). A Target MOTAD Approach to Marketing Strategy Selection for Soybeans. North Central Journal of Agricultural Economics, 9(2), 195–206. Berbel, J. (1990). A Comparison of Target MOTAD Efficient Sets and the Choice of Target. Canadian Journal of Agricultural Economics, 38(1), pp 149. 9. Monte Carlo Applications Note: must compose analysis and modelling prior to R and Excel usage. Monte Carlo for uncertainty in models/formulas Applying to models in finance, portfolios, operations management, revenue management, etc. Concerns actual computation with R and Excel, yet you will still be required to compose analysis and modelling prior. 10. Cost-Benefit Analysis (monetised and non-monetised aspects) Framework analysis and logistics (NPV and/or IRR based) CBA manuals exist for various fields Project-based development There are guides/manuals to build your CBA rather than accepting “phantom numbers”. Note: sensitive values like determining rate of return (cost of equity, WACC, APV, CAPM, multi-factor models). Tools such as RIMS -II, IMPLAN, Chmura, LM3 or REMI may also apply Excel Implementation: Campbell, H., & Brown, R. (2003). Benefit-Cost Analysis: Financial and Economic Appraisal using Spreadsheets (pp. 194-220). Cambridge: Cambridge University Press Augmentation: Sener Salci & Glenn P. Jenkins, 2016. “Incorporating Risk and Uncertainty in Cost-Benefit Analysis”, Development Discussion Papers 2016-09, JDI Executive Programmes. Prereqs: Enterprise Data analysis II, Optimisation, Probability & Statistics B, Mathematical Statistics, Senior Standing Supply Chain Modelling & Analysis An introduction to supply chain logistics systems, including: The components of logistics systems, such as supplies, storage, materials handling, production, inventory, orders, and transportation systems The interactions between these components Models and techniques for the analysis of logistics systems and the development of information and decision support systems. Objectives --> Develop familiarity with supply chain logistics concepts Understand the issues in logistics system design and operation Develop the ability to formulate quantitative decision models for logistics system design and management. Typical Text --> Goetschalckx, Marc, Supply Chain Engineering, 2011 Supporting Text --> Ghiani, G., Laporte, G., & Musmanno, R. (2004). Introduction to Logistics Systems Planning and Control, Wiley Field Literature (optional) --> Determination of the applied techniques and tools throughout, along with accessibility of one’s data resources for their ambiance to emulate: Silva, S. et al (2018). Optimisation of Supply Chain of Targeted Public Distribution System in Dhenkanal, Odisha. World Food Programme Georgiadis GP, Georgiadis MC. (2021). Optimal Planning of the COVID-19 Vaccine Supply Chain. Vaccine, 9(37): 5302-5312. Shabani, K., Outwater, M. and Murray, D. (2018). Behavioral/Agent-Based Supply Chain Modelling Research Synthesis and Guide. U.S. Department of Transportation Required Tools --> R + RStudio environment (various packages used in prerequisites) lpSolve, ompr, ROI, gurobi, optress igraph, qcc, qmtools, TSP, vrp, osrm simmer Microsoft 365 Microsoft Dynamics 365 Supply Chain Management GIS Kaggle data, gov’t data and others Grades will be assigned as follows --> Homework: 10% Quizzes: 10% 5-6 Projects 30% Exam 1: 15% Exam 2: 15% Final exam: 20% Homework --> Once a week. Start working on each homework early, to have time to ask (and understand) questions before the homework is due. Projects Expectations--> --Generally all modules will be relevant throughout --It may be challenging to acquire real and practical data, but such will be acquired for use. Generating synthetic data may or may not be applied. --Expect to apply all knowledge and skills from prerequisites without restrictions. A succeeding project may or may not depend on prior project(s). --Will have relevance to applications from both texts concerning modelling, and case examples, with software use (both R and Microsoft) towards data analysis, system development, computation, extrapolation, forecasting, etc., etc. --In some cases also incorporating GIS/mapping software for routing & networks, distance & time for travel. Supply chain networks intelligence from course applied in both R and Microsoft, accompanied by written analysis; establishing such with relevancy to course topics. Course Topics Covered --> 1. Supply chain management The coordination of supply chain activities involving multiple participants in the supply chain. – Supply chain game – Bullwhip effect – Vendor managed inventory 2. Data and Forecasting Introduction to methods for data collection, data management, and forecasting future uncertain data. – Data collection technology – Database design for supply chain management – Extrapolation forecasting – Multivariate forecasting via regression – Time Series extrapolation and forecasting Methods – R package (forecast, prophet, tsibble, smooth 3. Vendor/Supplier Selection --Data Envelopment Analysis (DEA) Chosen literature to apply with R packages --Principal Component Analysis (PCA) Overview the objective and uses of PCA PCA with R activities The following articles are to be analysed, followed by pursuit of environments and industries of interest based in R (where GIS displays can be incorporated as well): Petroni, A. and Braglia, M. (2000). Vendor Selection Using Principal Component Analysis. Journal of Supply Chain Management, Vol36 Issue 1, Pages 63 – 69 Wang, J., Swartz, C. L. E., Corbett, B. & Huang, K. (2020). Supply Chain Monitoring Using Principal Component Analysis. Ind. Eng. Chem. Res, 59, 27, 12487 - 12503 Case of nonlinearity in data. --DEA versus PCA (strengths and weaknesses) hands-on 4. Freight transportation modes Overview of motor freight, sea cargo, railroad, air cargo, and package express transport providers. 5. Transportation mode and route selection The transportation market: transportation costs, freight rates, contracts, spot market. How do shippers decide which modes/carriers to use for moving freight? How do shippers and carriers both decide on paths? – Transportation costs and rates – Models for mode/carrier selection – Minimum-cost path models 6. Fleet Management Cerny, J. (1997). Fleet Management – Selected Optimisation Problems. IFAC Proceeding Volumes 30(8), pages 593 – 596 7. Truckload Trucking Models for managing a freight transport fleet serving origin-destination direct shipments. – Time-space networks – Assignment problems for scheduling 8. LTL Trucking and Vehicle Routing Introduction to routing and scheduling problems for a local consolidation terminal. – Traveling salesman problem – Robert, R. and Toth, P. (2012). Models and Algorithms for the Asymmetric Traveling Salesman Problem: An Experimental Comparison. EURO J Transp Logist, 1:113–133. Note: instances and benchmarks may need updating. – Bin packing problem – Vehicle routing problem 9. Consolidation Transportation How does a shipper or a consolidation carrier decide how to structure a terminal network, and then move freight through the terminal network? – Role of consolidation – Network design – Minimum-cost network flow models – Facility location models 10. Pricing and Revenue Management Introduction to pricing of transportation services for profit maximization. 11. Supply Chain Risk Management – Risk Sharing Contracts – Risk Pooling: Centralization, Postponement, Omni Channel – Risk Hedging – qmtools R package 12. Supply Chain Modelling for Perishables (Time Permitting) Orjuela-Castro, J.A., Orejuela-Cabrera, J.P. & Adarme-Jaimes, (2022). W. Multi-Objective Model for Perishable Food Logistics Networks Design Considering Availability and Access. OPSEARCH 59, 1244–1270 Prerequisites: Enterprise Data Analysis II, Optimisation, Network Optimisation, Mathematical Statistics Operations Planning & Scheduling Analytical methods and tools for inventory control and production planning and control. We will study forecasting methods, inventory models, deterministic and probabilistic production planning and scheduling methods, and shop floor control techniques. You will be assigned problem sets, that will include both analytical and computational problems. There will be a full term project where you will work in groups. Groups will be working with firms and/or public sector elements towards implementation of the analytical models and the Technology Requirements given. For the full term project an outline will be provided involving proper sequence of course topics and tools. There will be 2 midterm exams and a final exam, all open book, open notes. Typical texts --> Factory Physics by W.J. Hopp and M.L. Spearman Production and Operations Analysis by S. Nahmias Operations Engineering and Management; Concepts, Analytics and principles for Improvement, by Seyed M.R. Iravani Technology Requirements --> R environment All packages from prerequisite forecast, fpp3, prophet, smooth qcc, taktplanr, spc simmer Excel Microsoft Project Microsoft Dynamics 365 Supply Chain Management Grading --> Problem Sets 15% Full Term Project 30% Exam 1 15% Exam 2 15% Final Exam 25% Course Outline --> Introduction to production planning and scheduling Capacity management and control Forecasting Detecting stationarity and trend Moving Average Exponential smoothing and Holt-Winters Method Tracking signals, Trigg-Leach method Chain-Ration method, Consumption Level method, End Use method Consumer Confidence Index, Purchasing Manager’s Index Aggregate Production Planning Common strategies Linear Programming (LP) approach Scheduling Production and Workforce in Manufacturing Systems Deterministic Scheduling Stochastic Scheduling Production Scheduling Resource Constrained Scheduling Variability in Production and Inventory Systems Deterministic Inventory Models EOQ Discount models EPQ Models with constraints on budget and space Stochastic Inventory Models Newsboy problem Continuous review models (R,Q) policy, Periodic Review Systems (s,S) policy ABC, XYZ, ABC-XYZ Inventory Models Lean Operations (JIT, CONWIP, Kanban, TQM, TPM, etc.) Risk pooling strategies Prerequisites: Operations Management II List of engineering “summer” and “winter” activities open to Operational Research (Operations Management) students --> Industrial Engineering (check engineering post): A, B, D, E, F, H, I, J, K, M, N, P NOTE: other activities can be developed to cater for interests “SUMMER” & “WINTER” ACTIVITIES Activities repeated can be added to transcripts upon successful completion. Repeated activities later on can be given a designation such as Advance “Name” I, Advance “Name” II, etc. Financial Modelling Basics Ratio Analysis via financial statements skills Cash Flow Analysis Beneish, Dechow F, Modified Jones, Altman Z, Probability of Default (via equity) and the KMV extension of prior; all such for individual firms and against possible comparables. Corporate Valuation methods Development of the 3-statement model Pro Forma Financials development Forecasting Annual Revenue Regression models, error patterns, downside risk, forecast accuracy. Financial Statements Based on forecasts of revenues, using Excel’s Scenario Manager to do sensitivity analysis. Seasonal Revenues Creating seasonally-adjusted forecasting models by joining seasonal adjustments to an annual trend line or a moving average trend line; using error feedback to correct a model so that the average error is zero; using period values to update annual forecasts and revise the model. PESTEL + SWOT 5C Analysis development WACC Analysis vs Adjusted Present Value method vs Cash Flow to Equity Active market research and trade modelling A. Basic Data Gathering Acquiring financial statements (balance sheet, income, cash flow). In the RStudio environment acquiring financial data for market assets: intraday, closing price, comprehension of dynamics. B. Fundamental Analysis Will be assigned at least 15-20 stocks. Creating “dashboard fill-ins for firms in columns” based on the following features is good preparation: Speed reading SEC filings Financial statements (GAAP or non-GAAP) Coverage ratios, liquidity ratios, profitability ratios, efficiency ratios Include historical performance Beneish, Dechow, Modified Jones, Altman z Individual firms and against possible comparables Economic forecasts Current Account Benchmarks Fed Policy, Budget Analysis, Fiscal Policy, Fiscal Indicators PESTEL and SWOT Stock Valuation (present and future) Stock Metrics P/E, PEG, P/B, D/E, Price-to-Sales FCF, Payout, ROE, Beta Beta coefficients and market risk-reward measures C. Use of quantmod and QuandlR package, and/or other packages. D. Technical Analysis Basics of Technical Analysis – Investopedia (subsections 1 through 12). As well, Investopedia provides information on various TA indicators. Some clear ideas of trading strategies-- Introduction to Technical Analysis Price Patterns - Investopedia How to Build a Trading Indicator - Investopedia 7 Technical Indicators to Build a Trading Toolkit - Investopedia Based on such Investopedia sources to immerse into R activities, namely, Technical analysis in R. Example ideas: Technical Analysis Using R – YouTube Using R in real time financial market trading – YouTube Packages often of use for TA: quantmod, fTrading, TTR. Commercial trading simulation tools at disposal: Investopedia Stock Simulator, CME Group simulators, Ninja Trader, London Stock Exchange Virtual Portfolio, London Stock Exchange Trading Simulator, TMX Capital Markets Learning Centre < https://www.tmx-edu.com >, FACTSim, Virtual Stock Exchange The fundamental analysis versus Technical Analysis development. E. Transactions Records Interested in transactions logs for analysis of activities Blotters Haynes, A. (2022). Blotter. Investopedia F. Transaction thresholds (appropriate order) Marginal Call, Margin Debt, Liquidation Level, Liquidation Margin, Federal Call Quantitative Analysis Note: open to all. Probability & Statistics background Note: interested in a portfolio having stocks, bonds and currencies. The given guides may not necessarily be in appropriate order, hence a robust and versatile framework to implement will be developed based on such guides. There must be analytical development in progression to make sense of the R development. -Introduction to Finance with R – Ronald Hochreiter – YouTube -Codebliss --> Quantitative Finance with R Part 1: Intro and Data - YouTube Quantitative Finance with R Part 2: Portfolio Analysis - YouTube Quantitative Finance with R Part 3: Portfolio Optimization - YouTube -Principal Component Analysis --> Hefin Rhys: Principal Component Analysis in R – YouTube Martin Geissmann: Principal Component Analysis in R for Portfolio- Diversification – YouTube Other YouTube videos exist -QuantCourse --> Portfolio & Single Stock VAR and CVAR in R – YouTube -Autochartist --> Using R in real time financial trading – YouTube Value, Growth & Sustainability with Tech (CHECK ACTUARIAL POST) Open to all students Life Cycle Costing (CHECK CIVIL ENGINEERING POST) Open to all students Economic Scenario Generator Note: for Finance and Economics majors Activity concerns identifying the purpose of an economic scenario generator and developing fluid and tangible logistics towards accomplishing goals. Literature guides --> Wilkie, A.D. (1986) A Stochastic Investment Model for Actuarial use. Transactions of the Faculty of Actuaries, 39, 341–403. Wilkie, A.D. (1995) More on a Stochastic Asset Model for Actuarial Use. British Actuarial Journal, 1(5), 777–964 Huber, P. (1997) A Review of Wilkie’s Stochastic Asset Model. British Actuarial Journal, 3(1), 181–210. Bégin, J.-F. (2019) Economic Scenario Generator and Parameter uncertainty: A Bayesian approach. ASTIN Bulletin, 49(2), 335–372. Pedersen. H. et al (2016). Economic Scenario Generators: A Practical Guide. Society of Actuaries: Conning (2020). A User’s Guide to Economic Scenario Generation in Property/Casualty Insurance. Casualty Actuarial Society, CAS Research Papers PART A Development of multiple portfolios, each constituted by stocks, corporate bonds, gov’t (domestic and foreign), currencies and commodities based on mean-variance, factor models and PCA, respectively, in the R environment. Each portfolio to have 20-25 elements to be realistic. PART B --From the given literature, analysis followed by logistics for R implementation. Identifying what types of R programming and R packages will be needed throughout development. Pursue development --Followed by immersion into R package ESG Public Project Management Advance repetition of methodologies, tools, logistics and software from course in PA. Much emphasis on Microsoft Project use. Will collaborate with elements of the public sector. Work Force Planning Geared mainly towards PA students. Groups will be assigned to various elements of the public sector. PART A (Needs Assessment versus PESTEL/SWOT) To develop needs assessment, then PESTEL/SWOT; disparities versus compatibility. PART B Based on part A to apply the following guide to workforce planning (intimately and comprehensively): < https://hr.nih.gov/workforce/workforce-planning/getting-started > < https://hr.nih.gov/workforce/workforce-planning > Data gathering will be crucial for development ISO 31010 – Risk Assessment Techniques (RAT) For various elements in the private sector and/or elements of the public sector will pursue chosen RAT topics comprehensively. For any quantitative or computational tools/techniques applications, they will not be restrained. Note: open to all.
1 note
·
View note
Text
Ultraman Taiga Toy Catalog Part 6/7: Episodes 1-11 Timeline

6th July; Ep 1: Taiga vs Hellberos
13th July; Ep 2: TBA
20th July; Ep 3: Titus debut
27th July Ep 4: Fuma debut
3rd August; Ep 5: Segmegel
10th August; Ep 6: TBA
17th August; Ep 7: TBA
24th August; Ep 8: Photon Earth vs Night Fang
31st August; Ep 9: TBA
7th Sept; Ep 10: TBA
14th Sept; Ep 11: Ghimaira
Further detailed analysis and predictions below:
Based on the latest timeline, we cant seem to establish a possible mid boss/ final boss pattern here nor a possible overall seasonal plot direction purely based on this.
But I think its safe to say that ep 6-7 will be focusing more on Taiga’s growth before he ‘awakens’ PE in ep 8
Tho its interesting to see that Titus and Fuma would just join the roster in a back-to-back episode which is definitely out of the norm since X whereby alternate forms will be introduced in the beginning once every 3rd episode.
Coupled with the fact that PE, a super form is being introduced in contrast to ep 12 or later from past series leads me to think that TsuPro is rushing through Taiga which leads me to think that:
1. Titus and Fuma are gonna have evolved forms on their own which requires entire episodes to establish
2. This series places a greater focus on plot rather than the action which is why we cant establish much of an obvious pattern in contrast to the past series
(As less focus is obviously been placed on the Kaiju’s design as well, opting for the typical ‘saurian’ design rather than anything innovative or something that we can establish a pattern with like the appearance of Grigiobone in several eps in R/B)
(Tho its rather notable that we aren't getting any new kaiju reappearances in other episodes)
3. Its gonna be another R/B disaster (I highly doubt so but some people are gonna skin me alive if I don't at least consider this possibility)
Other than that, as for ‘mini-patterns’:
Ep 1-2 would let us get used to seeing Taiga in action
Ep 3-5 are gonna integrate new ultras intro along with letting us get used to them
Ep 8-10 may be one of three things:
1. Allowing us to get used to PE
2. An arc for either Titus or Fuma unlocking their own respective super forms
3. An integration of the above two (Highly possible if we follow the patterns established in earlier episodes where they seem to be rushing through by integrating several conventional plot and action elements at once)
Ep 11 is either gonna be:
1. Just simply a Ghimaira cameo for all u 80 fans
2. An actual major plot-driving episode which uses Ghimaira as a cover which serves to shift the focus into the second overall arc of the season
So although the current timeline for Taiga makes it harder for us to establish an overall seasonal plot like the past few series, based on whatever little information and patterns we can establish, we will realize that with this plan, it actually gives the director quite abit of substantial leeway in the direction of this series, so itll be interesting to see how Overall Arc 1 goes
3 notes
·
View notes
Text
Propylene Oxide Market SuppliersOverview, Size, Share ,Segmentation and Forecast to 2028
Reports and Data has recently published a new report titled Global Propylene Oxide Market that offers vital statistical data about market size, market share, revenue growth, and evaluation of key segments such as types, applications, regions, technology, end-user, and prominent players of the industry. The report is further furnished with the latest market scenario pertaining to the global COVID-19 crisis and disruption in supply chain, changes in demands and trends, and economic scenario. The report also provides strategic recommendations to the new entrants pertaining to entry level barriers and to established players to help them gain a robust footing in the market and capitalize on lucrative opportunities in the market.
The Global Propylene Oxide Market is forecast to reach USD 27.24 Billion by 2028, according to a new report by Reports and Data. Propylene oxide is an organic flammable, volatile, and colorless liquid compound that is soluble in both alcohol and ether. The compound is used as an intermediate for the manufacture of various commercial products.
Prominent players analyzed in the report are :
Raytheon Company, Lockheed Martin Corporation, Boeing, Israel Aerospace Industries, BAE Systems Plc., MBDA, Kongsberg Group, Rafael Advanced Defense Systems Ltd., L-3 Technologies Inc., and FN Herstal S.A among others.
For More Information | Request a Sample Copy @ https://www.reportsanddata.com/sample-enquiry-form/1545
Market Overview:
Chemical and manufacturing industry largely caters to a broad range of commodity-related manufacturing and include a wide variety of materials such as sand, gravel, stone, and chemicals. Increasing focus on development of sustainable chemicals and materials, advancements in the development of smart materials such as nanocomposites and other advanced composites, and growing popularity of 3D printing have significantly contributed to revenue growth of the market. In addition, rising emphasis on green building and construction have increased use of renewable resources and this is also a key factor driving market growth.
Key companies are engaged in developing advanced materials having robust characteristics and forming strategic alliances such as mergers and acquisitions, joint ventures, collaborations, and product launches among others to gain a robust footing in the market. The competitive landscape section offers a comprehensive analysis of the competitive landscape along with profiles of the companies, their product portfolios, and lucrative business strategies undertaken by them.
The report further segments the Propylene Oxide market based on product types, applications, technology, end-use, and region, among others. The report also offers insights into key factors influencing the revenue growth of each segment and sub-segment along with market revenue share and CAGR.
On the basis of types, the segmentation covers:
Chlorohydrin Process
Styrene Monomer Process
Hydrogen Peroxide Process
TBA Co-Product Process
Cumene-based Process
Others
On the basis of application spectrum, the market is segmented into :
Polyether Polyols
Propylene Glycol
Glycol Ethers
Others
The report also offers a detailed regional analysis along with information about which region is expected to account for largest revenue share or register the fastest revenue growth and the key factors contributing to their growth. The regions are analyzed with regards to supply and demand, import/export, production and consumption pattern, market share, revenue contribution, market size, along with a stringent analysis of the key players present in the key regions.
To know more about the report @ https://www.reportsanddata.com/report-detail/propylene-oxide-market
Regional analysis covers the following key regions:
North America (U.S.A., Canada, Mexico)
Europe (U.K., Italy, Germany, France, Rest of Europe)
Asia Pacific (India, Japan, China, South Korea, Australia, Rest of APAC)
Latin America (Chile, Brazil, Argentina, Rest of Latin America)
Middle East & Africa (Saudi Arabia, U.A.E., South Africa, Rest of MEA)
Request a customization on the report @ https://www.reportsanddata.com/request-customization-form/1545
Thank you for reading our report. For further inquiry or query about customization, kindly get in touch with us to know more. Our team will clear your doubts and ensure the report is customized to meet your requirements.
Read More Related Reports:
Milled FerroSilicon Market Trends
Poly Aluminium Chloride (PAC) Market Statistics
About Us: We are a boutique market intelligence and strategic consulting firm dedicated to make an meaningful impact on businesses across the globe. Our stellar estimation and forecasting models have earned recognition across majority of the business forum across the globe. Our services are arrayed over diverse sectors and industries looking to expand in alternative regions and products.
Contact Us:
John W
Head of Business Development
Reports And Data | Web: www.reportsanddata.com
Direct Line: +1-212-710-1370
E-mail: [email protected]
Blog: https://www.reportsanddata.com/blogs
Report: https://www.reportsanddata.com/upcoming-reports
0 notes
Text
Outlander Season 3 Episode Master Post (Update #2)
Bumping because a few people have asked. Post now includes runtimes for episodes airing in November, per Starz’s November schedule.
This post has been updated with all of the episode titles, descriptions, writers, and directors we know so far for Season 3—which is pretty much all of them. If you don’t want to be spoiled, STOP READING. I will update and repost this as information becomes available.
The previous versions of this post are here and here. For my predictions on the breakdown of the episodes leading up to the Reunion, click here. For analysis of the 305 episode title, click here.
Episode 301 (September 10, 2017)—"The Battle Joined"
written by Ronald D. Moore
directed by Brendan Maher
(57 minutes) After living through the Battle of Culloden, Jamie finds himself at the mercy of unforgiving British victors, until a connection from his past provides his only hope of survival. Meanwhile, a pregnant Claire attempts to adjust to life in the modem world of 1940s Boston—and life with Frank.
Additional Cast:
Ryan Ralph Gerrard as Giles McMartin
Joseph Rye as Realtor
Garry Summers as Anaesthesiologist
Episode 302 (September 17, 2017)—“Surrender"
written by Anne Kenney
directed by Jennifer Getzinger
Hiding in an isolated cave, Jamie leads a lonely Life until Lallybroch is threatened by redcoats pursuing the elusive Jacobite traitor known as "Red Jamie: Back in Boston, Claire and Frank struggle to coexist in a marriage haunted by the ghost of Jamie's love.
Episode 303 (September 24, 2017)—"All Debts Paid"
written by Matthew B. Roberts
directed by Brendan Maher
In prison, Jamie discovers that an old foe has become the warden - and now has the power to make his life a living hell. Over the years, Claire and Frank both put their best foot forward to share a harmonious marriage, but an uninvited guest shatters this illusion, bringing their differences to light.
Episode 304 (October 1, 2017)—”Of Lost Things”
written by Toni Graphia
directed by Brendan Maher
While serving as groomsman at the aristocratic estate of Helwater, Jamie is reluctantly pulled into the intrigue of a noble British family. In 1968 Scotland, Claire, Brianna and Roger struggle to trace Jamie's whereabouts in history, leaving Claire to wonder if they will ever find him again.
Additional Cast:
Hannah James as Geneva Dunsany
Tanya Reynolds as Isobel Dunsany
Episode 305 (October 8, 2017)—”Freedom & Whisky”
written by Toni Graphia*
directed by Brendan Maher
As Brianna grapples with the life-changing revelations of the past summer, Claire must help her come to terms with the fact that she is truly her father's daughter - her 18th century Highlander father. To complicate matters further, Roger brings news that forces Claire and Brianna to face an impossible choice.
Additional Cast:
Mitchell Mullen as Dean Tramble
Episode 306 (October 22, 2017)—”A. Malcolm”
Runtime: 75 minutes
written by Matthew B. Roberts
directed by Norma Bailey
After decades apart, Jamie and Claire finally reunite and rekindle their emotional and physical bonds. But Jamie's new business dealings jeopardize the couples' hopes for a simple life together.
Additional Cast:
Ian Conningham as Barton
Kirsty Strain as Peggy
Episode 307 (October 29, 2017)—”Creme De Menthe"
written by Karen Campbell
directed by Norma Bailey
In the aftermath of a violent confrontation, Claire follows her conscience as a surgeon, even though it could put her and Jamie's lives at risk. At the same time, Jamie attempts to evade the reach of the Crown as its representative closes in on his illegal dealings.
Additional Cast:
Ian Conningham as Barton
Episode 308 (November 5, 2017)—“First Wife"
Runtime: 60 minutes
written by Joy Blake
directed by Jennifer Getzinger
Claire returns to Lallybroch with Jamie, where she does not receive quite the reception she was expecting. Unbeknownst to her, Jamie's made some choices in their time apart which come back to haunt them with a vengeance.
Additional Cast:
Steven Cree as Ian Murray
Laura Donnelly as Jenny Murray
Episode 309 (November 12, 2017)—"The Doldrums"
Runtime: 58 minutes
written by Shannon Goss
directed by David Moore
Claire and Jamie leave Scotland, sailing to the West Indies on an urgent quest. But when the superstitious crew looks for someone to blame after a string of bad luck, rescue comes from an unlikely source.
Episode 310 (November 19, 2017)—"Heaven & Earth”
Runtime: 58 minutes
written by Luke Schelhaas
directed by David Moore
Claire races to discover the source of an epidemic aboard a disease-stricken ship before hundreds of sailors die. And as Jamie locks horns with Captain Raines, Fergus finds himself torn between loyalty and love.
Episode 311 (November 26, 2017)—"Turtle Soup"
Runtime: 58 minutes
written by Karen Campbell and Shannon Goss
directed by Charlotte Brandstorm
After making a leap of faith, Claire washes up on a seemingly deserted island where survival is her only option. Navigating treacherous waters has crippled the Artemis, so Jamie devises a joyful moment for his crew in the midst of devastating setbacks.
Episode 312 (December 3, 2017)—"The Bakra"
Runtime: 58 minutes
written by Luke Schelhaas
directed by Charlotte Brandstorm
The Artemis finally reaches Jamaica bringing Jamie and Claire that much closer to their goal During a lavish ball on the island, the Fraser encounter old allies, as well as former adversaries who threaten to derail their mission.
Additional Cast:
Matthew Dylan Roberts as Auctioneer
Episode 313 (December 10, 2017)—"A New World”
written by Matthew B. Roberts and Toni Graphia
directed by TBA
Claire is forced to play a game of cat and mouse with an old adversary as she searches for Young Ian. The Frasers race through the jungles of Jamaica to prevent the unthinkable.
Additional Cast:
Calum Cormack as Fire Brigade Captain
Brett Williams as Mr. Oliver
ANALYSIS/COMMENTARY:
Directors
All of the directors this season are new:
Brendan Maher: Spartacus, Upstairs/Downstairs.
Jennifer Getzinger: Mad Men, How to Get Away With Murder, Agent Carter
Norma Bailey: Reign, Heartland
David Moore: Jamestown, Jericho, Shetland
Charlotte Brandstrom: Madam Secretary, Arrow, Grey’s Anatomy
I’m particularly jazzed because one of Getzinger’s 10 Mad Men episodes, “The Suitcase,” is widely considered to be one of the best episodes of the series. I think she’ll do well here.
Like Metin last season, Maher directed the majority of the episodes and they’re all at the beginning of the season. Hopefully this bodes well for a consistent tone/focus/vision at the beginning as we build up to the reunion.
Writers
There are four new writers this season:
Shannon Goss: ER, Harry’s Law, Revenge
Joy Blake: Ghost Whisperer, Heroes, Criminal Minds: Suspect Behavior
Karen Campbell: Dexter, Covert Affairs, Unforgettable
Luke Schelhaas: The Good Wife, Law & Order, Smallville
I can’t wait to see what these new writers bring to the table. I’m sad my girl Anne is getting pushed out and/or leaving. But this show really needed to be injected with some new energy.
All in all, I’m kind of excited to see what all of the new blood means for Season 3—and Season 4, because remember, they started padding their writing staff so they could get rolling on not only Season 3 but Season 4 as well.
178 notes
·
View notes
Text
Propylene Oxide Market Strategy And Industry Demand Analysis 2020 To 2027
This analysis of the Global Propylene Oxide Market aims to offer relevant and well-researched insights into the contemporary market scenario and the emergent growth dynamics. The report on Propylene Oxide Market also gives the market players and fresh contenders a holistic view of the global market landscape. The comprehensive study will help both established and emerging players formulate lucrative business strategies and realize their short-term and long-term goals. The Propylene Oxide industry has witnessed a stable growth rate in the past decade and is expected to continue on the same path in the forthcoming decades. Therefore, it is crucial to recognize all investment opportunities, potential market threats, restraining factors, challenges, market dynamics, and technological development to intensify footholds in the Propylene Oxide sector. This report has evaluated all the above mentioned aspects to present a detailed assessment to the reader to assist them in achieving the desired growth in their businesses.
This report covers the recent COVID-19 incidence and its impact on Propylene Oxide Market. The pandemic has widely affected the economic scenario. This study assesses the current landscape of the ever-evolving business sector and the present and future effects of COVID-19 on the market.
Request for FREE Sample Copy of This Research Report at: https://www.reportsanddata.com/sample-enquiry-form/1545
Key participants include Raytheon Company, Lockheed Martin Corporation, Boeing, Israel Aerospace Industries, BAE Systems Plc., MBDA, Kongsberg Group, Rafael Advanced Defense Systems Ltd., L-3 Technologies Inc., and FN Herstal S.A among others.
To help gain the business owner further gain business intelligence the study on the Propylene Oxide market for the forecast period 2020 - 2027 brings to light data on production capability, consumption capacity, spending power, investment feasibility, and technology innovation. A thorough assessment of market performance across different regions is presented through self-explanatory graphic images, charts, and tables that add weight to corporate presentations and marketing materials. The study offers regional profiles of major vendors and extensive country-level break down to empower companies to make a wise investment decision when exploring new regions.
Process Outlook (Volume, Kilo Tons; Revenue, USD Billion; 2016-2026)
Chlorohydrin Process
Styrene Monomer Process
Hydrogen Peroxide Process
TBA Co-Product Process
Cumene-based Process
Others
Application Outlook (Volume, Kilo Tons; Revenue, USD Billion; 2016-2026)
Polyether Polyols
Propylene Glycol
Glycol Ethers
Others
Read Full Report Description at: https://www.reportsanddata.com/report-detail/propylene-oxide-market
End User Outlook (Volume, Kilo Tons; Revenue, USD Billion; 2016-2026)
Automotive
Building and Construction
Textile and Furnishing
Chemical and Pharmaceutical
Packaging
Electronics
Others
Regional analysis: Based on geography, the market has been categorized into North America, Europe, Asia Pacific, Latin America, and the Middle East & Africa.
Table of Contents:
Study Coverage: It includes key manufacturers covered, key market segments, the scope of products offered in the global Propylene Oxide market, duration considered, and objectives of the research. Additionally, it segments the market on the basis of product type and application.
Executive Summary: It offers a summary of other key studies, annual growth rate, competitive landscape, driving factors, market trends and issues, and macroscopic indicators.
Production by Region: Here, the report delivers information related to import and export, production, revenue, and key players of all regional markets inspected in the report.
Profile of Manufacturers: Each firm profiled in this segment is investigated by means of SWOT analysis, available products, global production, value, capacity, and other crucial factors.
Browse More Reports:-
IoT MCU Market To Reach USD 4.61 Billion By 2026 | Reports And Data
Automotive Repair & Maintenance Service Market Is Estimated To Reach USD 810.30 Billion By 2026 | Reports And Data
Highlights the following key factors:
1) Business description-Detailed description of a firm’s operations and business segments.
2) Corporate strategy – Analyst’s summarization of the company’s business strategy.
3) SWOT Analysis – A detailed analysis of the company’s strengths, weaknesses, opportunities, and challenges.
4) Company history – A company’s evolution, highlighting its key events through the years.
5) Major products and services – A list of flagship products, services, and brands of the company.
6) Key competitors – A list of key competitors of the company.
7) Important locations and subsidiaries – A list and contact details of key locations and subsidiaries of the company.
8) Detailed financial ratios for the past five years – The latest financial ratios derived from annual financial statements released by the company in the last five years.
The growth of this market across the globe is dependent on multiple factors; including consumer base of several Propylene Oxide products, inorganic growth models adopted by companies, price volatility of feedstocks, and product innovation, along with their economic prospects in both producer and consumer nations.
Overall, this report provides a clear view of every vital factor of the market without the need to refer to any other research reports or data sources. Our report will equip you with all the strategically vital facts about the past, present, and future of the market.
Contact Us:
John Watson Head of Business Development Direct Line: +1-212-710-1370 E-mail: [email protected] Reports And Data | Web: www.reportsanddata.com
#Propylene Oxide Market#Propylene Oxide Market size#Propylene Oxide Market share#Propylene Oxide Market trends
0 notes
Text
Tanzin v. Tanvir (Argument October 6, 2020)

Argument: October 6, 2020
Decision: TBA
Petitioner Brief: FNU Tanzin, et al.
Respondent Brief: Muhammad Tanvir, et al.
Opinion Below: Second Circuit Court of Appeals

What’s the Recourse Against Federal Officers Who Violate Your Religious Freedom?
The plaintiffs in this case are American Muslim men who were approached by the FBI to act as informants. When asked, some of the men were threatened with deportation and arrest, and in other cases they were promised financial benefits.
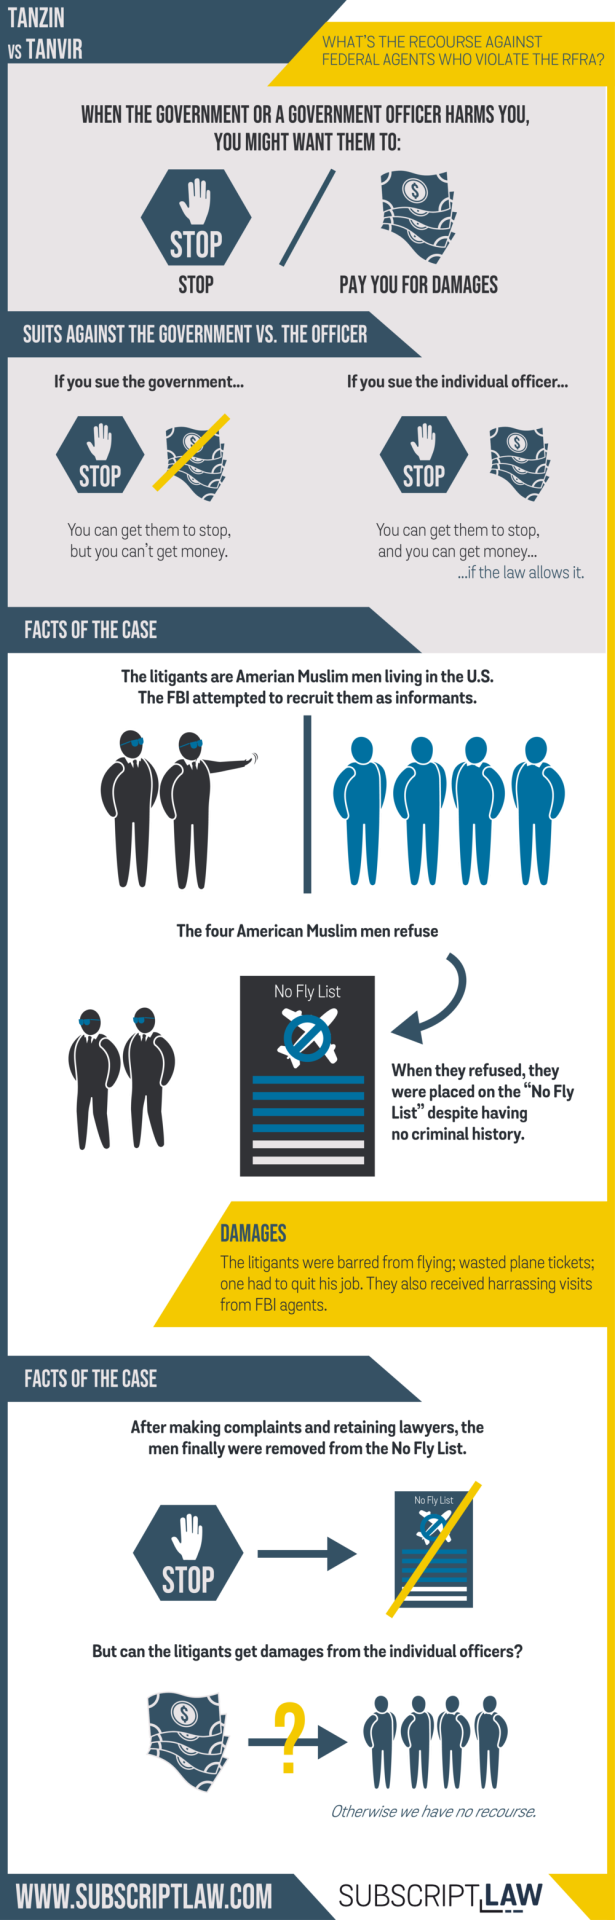
Each of the men rejected the offers, telling the federal agents they didn’t have any information and preferred not to spy on their communities. Spying, in fact, is against the Islamic moral code.
After saying no, the men were harassed and placed on the federal “No Fly List”, despite that none of them had a criminal record.
The “No Fly List” is a terrorist watchlist administered by the FBI. A person on the list cannot board a plane that starts in, ends in, or flies over the United States. You don’t know that you’re on the list until you show up at the airport and can’t board.
The men could not fly for years because they were on the “No Fly List.” They wasted plane tickets, one quit his job that required him to fly; and they also suffered emotional distress and reputational harm from the harassment by federal officers and inability to fly. Read Tanvir’s account in the Second Circuit opinion (starting on page 10) to get an idea of the harassment.
Federal Complaints
The plaintiffs sought recourse by filing complaints with the DHS Traveler Redress Inquiry Program, the administrative mechanism for filing complaints about the “No Fly List.” Their complaints failed without explanation. Years passed before each was finally removed from the list and able to board a plane.
The men sued for damages under the Religious Freedom Restoration Act. They alleged the government and its officers violated their religious freedom by retaliating against them for refusing to become spies, or for upholding their religious beliefs.
Suits Against the Government Versus Individual Officers
Since the early days of the nation, individuals could not sue the government without the government’s consent. Suits against the government violated an English legal principle of sovereignty and people believed it threatened the dignity of the government.
We adopted the same rule in American jurisprudence. Over the years Congress has passed various laws where the government waives its immunity to suit. In some areas of law (like tort), individuals can get money damages from the government.
When you sue the government with a civil rights complaint, you can get an injunction, but you can’t get money. In other words, you can get the government to stop harming you, but you can’t get money. If you want money in such a suit, you have to sue the government officers. It’s a work-around for government immunity. The money will come from the pockets of the individual officers.
Issue in the Case
In this case, Tanvir and co., sued under the Religious Freedom Restoration Act. They seek money damages because an injunction won’t do. They were already taken off the “No Fly List.” But what about the damage they suffered in the meantime? They want monetary relief from the individual officers.
A court must evaluate the RFRA to determine whether the government has waived immunity and what type of relief is available. The statute explicitly allows suits against the government, but the question in this case is whether the plaintiffs can get money damages.
The Religious Freedom Restoration Act
Congress passed the RFRA to provide stronger protection for religious freedom than the First Amendment guarantees. It was passed in response to a Supreme Court case, Employment Division v. Smith (1990), which held that the First Amendment does not provide strict scrutiny review when a neutral law (one that applies generally, i.e. does not intentionally pick on a religious practice) restricts someone’s religious liberty. After Smith, Congress stepped in to mandate strict scrutiny review even for laws of general applicability. The RFRA provides:
Government shall not substantially burden a person’s exercise of religion even if the burden results from a rule of general applicability, except [when the Government can show] that application of the burden to the person—(1) is in furtherance of a compelling governmental interest; and (2) is the least restrictive means of furthering that compelling governmental interest.
The RFRA also determines who gets to sue; who can be sued; and what the plaintiff can get for relief. The relief question is important in this case.
The RFRA says that any “person whose religious exercise has been burdened in violation of [the statute]” can sue “in a judicial proceeding and obtain appropriate relief against a government.” And the term “government” includes “a branch, department, agency, instrumentality, and official (or other person acting under color of law) of the United States.”
The statute does not define the term “appropriate relief,” a term which is critical in resolving whether the plaintiffs in this case can get damages against the federal officers.
Rules of Statutory Construction
To determine the intention of a statute, a court will first look at the text of the statute. If the text is clear, the court will go with the textual reading. If the text is not clear, then the court will evaluate the context surrounding the text, both the surrounding language and the broader statutory context.
The Lower Court Analysis
The lower court determined that “appropriate relief” in the RFRA includes money damages. The Second Circuit reviewed the context of the language as it was used in the statute because the statute did not define the term specifically.
First, the Second Circuit acknowledged that the term “appropriate relief” is entirely context dependent. It could include money damages or it could limit the damages to equitable remedies (like an injunction), depending on the context.
To interpret the context, the court decided that Congress legislates in accordance with the existing legal rules, including judicial decisions of the time. Around a year before Congress enacted the RFRA, the Supreme Court decided a case that addressed which remedies are available in statutes that didn’t explicitly state the remedies.
In Franklin v. Gwinnett Cty. Pub. Schs. (1992), the Supreme Court said a court should “presume the availability of all appropriate remedies unless Congress has expressly indicated otherwise.” Because the RFRA doesn’t explicitly preclude money damages as a remedy and Congress chose to use the same “appropriate relief” language that the Supreme Court evaluated in Franklin, the Second Circuit determined that courts may award money damages.
Tanzin appealed, asking the Supreme Court to address the remedy question on appeal.
Tanzin’s Arguments
The government argues that the RFRA does not allow monetary relief against federal officers in their official capacities. The government makes four arguments.
First, it argues, the RFRA only allows suits against the government itself—not individual officers. So the plaintiffs cannot even sue federal officers individually, much less get money damages against them.
Second, when a court evaluates the phrase “appropriate relief,” it must consider the term as it relates to relief against government employees. Generally, money damages are not appropriate relief against government officials. There is one statute that does allow monetary damage against government officials, and there is no indication the RFRA intended to create a similar remedy.
Third, a court should refrain from implying a monetary damages remedy against federal officers when Congress did not explicitly state one. Such a remedy causes a big social impact, so Congress would state its intention specifically. The government rejects application of the Franklin presumption to imply that monetary damages are appropriate.
Fourth, the same term “appropriate relief” was used in the RFRA’s sister statute, the RLUIPA, and the Supreme Court determined the RLUIPA does not include monetary damages based on the term.
Tanvir’s Arguments
Tanvir and co. argue that the RFRA allows suits against federal officers in their individual capacities and allows money as an “appropriate remedy.”
The RFRA’s definition of government provides a list of who can be sued. The definition includes “a branch, department, agency, instrumentality, and official (or other person acting under color of law) of the United States.” According to Tanvir, the phrase “or other person acting under color of law” obviously refers to federal officers. That’s the exact phrase used to refer to federal officers in the other statute which allows suits against federal officers, and it makes sense that Congress would copy it. Also, if the phrase refers to one of the other government entities, it would be redundant because those are listed in the statute already.
Tanvir supports the Second Circuit’s use of the Franklin presumption, which presumes the availability of monetary relief unless expressly stated otherwise.
Tanvir rebuts the government’s argument using the RLUIPA as a parallel by distinguishing the RLUIPA. Tanvir points out that in the case where the Supreme Court evaluated “appropriate relief” in the RLUIPA, Sossamon v. Texas (2010), the Court was deciding whether the phrase was enough to waive state immunity to suit, not what type of damages were available. Thus, the parallel doesn’t work, Tanvir argues, and the Court should stick with the Franklin presumption.
Lastly, Tanvir notes that allowing monetary damages accords with the broad intention of the RFRA. The statute meant to provide relief to people whose religious exercise is substantially burdened by the government, which the Supreme Court has acknowledged is a broad protection of religious liberty (Burwell v. Hobby Lobby (2014)). Without monetary damages against federal officials, the statute wouldn’t provide it.
The Supreme Court will hear arguments on October 6, 2020.
Recent Reports:
fromSubscript Law Blog | Subscript Lawhttps://https://ift.tt/2FFPGM8 Subscript Law 4 Curtis Terrace Montclair NJ 07042 (201) 840-8182 https://ift.tt/2oX7jPi
0 notes
Photo

Congratulations DEAN! You’ve been accepted as ARIEL.
The themes of illusion and manipulation and perception are certainly not lost in your app, Dean, and how central they are to Lenox is just so, so well written it feels like I could easily fall under the spell of one of his illusions. You’ve shown that this world and these powers don’t always harden those affected, and that spark of whimsy in Lenox really brings him to a new life. Even a simple headcanon as selling placebo drugs and using his powers to create the high gives me such a confidence in who Lenox is as a person, and I can’t wait to see his shenanigans.
Welcome to Mutants Rising! Please read the checklist and submit your account within 24 hours.
NAME/ALIAS: Dean
PRONOUNS: She/her
AGE: 22
TIMEZONE & ACTIVITY LEVEL: GMT, i’m fairly active bean and am always here to plot
In Character Information:
DESIRED ROLE: Lenox Syed GENDER/PRONOUNS: Cismale, he/him
DETAILS & ANALYSIS: This is where you show us who the character is to you! The format of this doesn’t matter, whether it’s in bullet points or in para form, and can be as long as you’d like it to be. Feel free to get creative!
Lenox as a boy’s name is of Scottish and Gaelic origin, and the meaning of Lenox is “with many elm trees”.
Syed or Sayyid or Sayed (Arabic and Urdu: سيدعلی) is a family of Syeds in South Asia, notably India and Pakistan. Syeds are the direct descendants of the Islamic Prophet Muhammad.
Lenox is lost in his own fantasy world. Creating so many illusions for people each day that he has became lost in one of his own. With a lack of attention through his childhood, he craves the limelight and approval of everyone around him and will do pretty much anything to get it, even if it’s false or trickery.
He’s so painstakingly constructed, he’s his own work of art. Each detail of his personality and appearance delicately manipulated into something strikingly beautiful. Someone you can look at with awe just by the way they talk or move. It’s almost hard to realise there’s another man beneath the mask, someone raw and damaged. Like a bird with a broken wing.
BIO:
Tw: Drug mention
His mother is just fifteen when she gives birth to him, swaddled in a blue blanket and passed immediately to the arms of a doctor; she never held him, never looked at his freshly reddened face as his cries wailed down the corridors. It’s not because of his mutation, not because his birth family couldn’t bare to raise a being burdened with powers. She was a child herself, naivety leaving adoption as the only logical decision.
A foster home decides to take him in, raising him from infancy without any awareness of any abnormality. It’s where he stays for the first nine years of his life, a cosy house in Oregon that housed five other children. But the dormancy of his powers didn’t stay concealed forever. It started with his foster siblings sleepwalking, Lenox’s dreams imprinting on them accidentally as they’d trample through the house enthralled by the vivid illusions of his fantasy worlds. Then it began intertwining into everyday life, emotional outbursts of temper alluding unsafe situations like fire or monsters that hid under the bed. Games became near impossible to differentiate between make believe and reality from the second he joined in.
“You’re unsafe,” it’s a comment he’d gladly wear as a badge of honour once he’d matured. But to the little boy being dragged away from his foster family, betrayed by his caregivers and turned in for research, the words grazed his skin like stinging nettles.
The four plain walls of the room only further ignite an overly active imagination, a tool that was dangerous to have with a power like his own. The eleven years he spends there does the opposite of what society would have hoped, boredom allows for focus and practice, it sharpens his talents and he’s able to put them to good use. By the end of his stay the doctors had favoured him among the rest, because he wills it so. They go easy on him, carefully placed illusions write false notes on his reports. Detailed and intricate enough so that he doesn’t get caught out, handwriting remarkably identical to each nurse or scientist that take their turn testing on him. He starts to admire the way it feels, too chaotic to be part of society and embedded with more potential than anyone could have known.
It’s when that potential reaches a point where imagination can no longer be imprisoned by those four walls that he decided enough was enough. The process of discharging himself was a meticulous operation. Theatrically staged and miraculously timed with an annual cell collecting test. Before he can be sedated he’s enticed the nurses into an imaginary induced coma, deep enough into his intoxication that he can use the poisoned needle on them. The theater only has the two women on the floor when the doctor enters, sly projections manipulating each person he’d bumped into on his way to the exit into that same sleep, a psychedelic world of kaleidoscope landscapes and stained glass colours, once awakening they would never see this boy again.
“You’re unsafe,” the same words, just a different context. An ally ushers him to leave Oregon and head to Chicago. A place where policies were loosened and his own kind somewhat tolerated.
The new city put Lenox’s own fresh start in full swing.
Fragile reality was a vehicle for his reinvention, so easily malleable that to change it was simpler and more natural to him than breathing. He’s masterful in the way it’s applied, diminishing a past life of shame and grit in place of high strung worth and superiority. He’d created himself with utter royalty, his own nobility evident by the way in which he moved, regally eloquent and unmistakably celestial to anyone who crossed his path.
He builds his career on the sins he knows other’s desire. Selling crushed up aspirin as a party drug in the underbelly of the city’s night clubbing scene, using his power to make it seem as if it were the legitimate stuff and not something that cost him a couple bucks from the convenience store across the street. Lenox could make them see whatever he wanted, turn their evenings into a production of his own design and leave with none of the being any wiser. It’s how Benjamin Granger catches word of him, a supposed mutant that was living life as if he were a king. He’s the first person to ever acknowledge his capability, strikes him up an offer he couldn’t refuse. Drawn like a moth to a flame after the minor suggestion of power and the infatuation that he was finally wanted by someone and to belong to something.
EXPANDED CONNECTIONS:
Chance Matthews: He’s the face he can’t erase from his mind, the curve of his lips engraved in deep fixations when he couldn’t fall asleep on a Sunday night. Perhaps it’s the fact that he shouldn’t do it that makes it more enticing, a lust to ignite underlying passion to unearth exactly what they had both been burying.
Jordan Rojas: Jordan is somewhat of a curiosity for Lenox to unpick. A closed book that is intriguing because of their close association together. Always keen to show his worth, to prove himself to those around him, perhaps it’s a dangerous combination should Jordan utilise the other’s naivety in combination of his powers in the way that Benjamin does.
Jack Mizuno: He likes that he can get so deep into their head, that he can have full control of a world that wasn’t Jack’s domain. It’s all to do with power and annoyance, a deep craving to see exactly how far he can push people before they hit their breaking point. Even then, it’s fun to flip that breaking point into a place of pure bliss and drop it again just when his subject is at ease. He’s like a lab rat, someone he tries his tricks on before taking them to the main show.
EXTRA:
https://stereotypicalcancerwrites.tumblr.com/tagged/ch:%20lenox%20syed
(tba, watch this space I legit SPAM my character tags hard)
Lenox spends a lot of his spare time writing and doodling. It’s all extremely sketchy, there’s never any sort of final draft. It helps his imagination, which is a much exercised tool in his life.
He is probably more invested in mental health than most. Meditation and yoga being a crucial part of his daily routine after a bowl full of sugar packed cereal.
He’s naive and eager to please anyone that might create a bond with him, he craves companionship after never really understanding it due to the absence of it in his life.
Lenox works as a part-time playwright, using his illusions to improve the production of his stories and only ever receiving the best reviews from critics.
He also works as a drug dealer, never selling legitimate stuff but using over the counter medicines with the combination of his powers to masquerade as the real stuff.
He has an unruly sweet tooth. He keeps lollipops in his back pocket and will order dessert off a menu at a restaurant instead of a main meal. His favourite thing on the planet is warm cookie dough and ice cream.
He listens exclusively to Grunge music. Celebrity Skin by Hole is his absolute jam and he only ever sings Are You Gonna Be My Girl by Jet is his go to karaoke song.
Lenox is openly proud of his sexuality as a homosexual, though he’ll flirt with anyone and anything for the fun of it.
He prefers tea over coffee.
He’s a bit of a poetry dork, he collects first edition poetry books and his most prized possession is a first edition of Howl and Other Poems by Allen Ginsberg.
He’s very judgemental of how others present themselves and will tell you if your new shirt is ugly.
Lenox lives in a small apartment, anyone that enters he’s carefully to make them see it as 3 times bigger than it actually is with far more light.
He has a fear of heights.
ANYTHING ELSE: Did you have any questions or any changes you wanted to discuss with us beforehand?
Nope all good!!!
0 notes