Playpower Labs work with educational institutions tp help them use data and artificial intelligence to improve students results over time. The data science team at playpower labs has extensive expertise working with numerous forms of educational data, including evaluation and handwriting scans. Not only that, but the products are also skilled at developing data products that provide actionable insights and support evidenc-based activities.
Don't wanna be here? Send us removal request.
Photo

Case study presents the design of "an intelligence-building app for kids" as a worked example. Designers in artificial intelligence assume that "intelligence" is a property that can only be improved. We wish to share our rationale for a digital-social system designed to build human intelligence.
To know More Visit:- https://www.playpowerlabs.com/
0 notes
Photo

How well a reader understands text or discourse depends on many factors, including individual differences such as reading skill and prior knowledge of the domain or world. Comprehension also depends on the nature of the text – difficulties imposed by the words in the text, complexity of the syntax, and cohesion. The paper "Towards an Automated Model of Comprehension (AMoC)" was published at the (ongoing) 2021 Artificial Intelligence in Education conference. The AMoC model takes a text passage as input and builds a hypothetical model of what the text comprehension may involve.
To know more Visit:- https://www.playpowerlabs.com/
0 notes
Link
Educational Process Analysis aims to discover latent learning and teaching processes hidden within educational data. Processes hidden in the data can be represented by various types of constructs and models. Techniques such as Association Rule Mining and Graph-Based Analysis can help us discover different representations of educational processes. Process data can come in many different shapes and sizes, and we have to use different methods for different types of data. Process Models and Graph-Based Analysis can give an end-to-end view of the student interaction data as process models or graphs. Curriculum Pacing produces a clear visualization of how students follow the curriculum over time.
0 notes
Photo
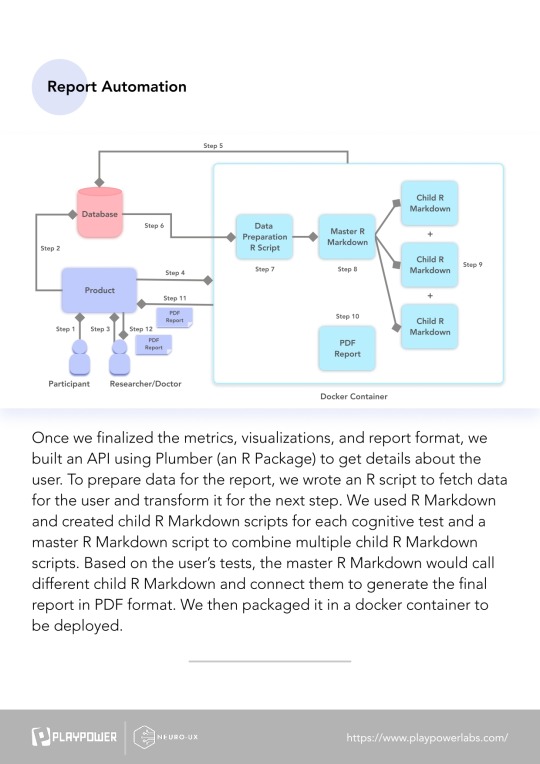
To collect information about the user, we created an API using Plumber (an R package). After that, we put it in a Docker container and deployed it. We ran a test with a doctor, received feedback, and then rolled it out to other customers.
To Know More Visit:- https://www.playpowerlabs.com/
0 notes
Photo
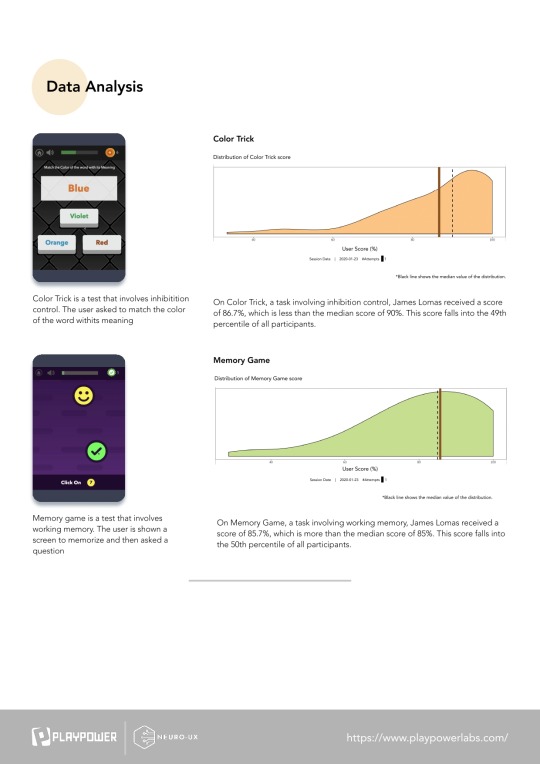
After checking the results, we utilized Exploratory Results Analysis for each cognitive exam. We discovered patterns and put our theory to the test using summary statistics and visualizations. Metrics and graphics for the report were then generated in collaboration with the product designers.
To Know More Visit:- https://www.playpowerlabs.com/
0 notes
Photo

For each cognitive exam, we used Exploratory Results Analysis after confirming the data. Using summary statistics and visualisations, we uncovered patterns and tested our hypothesis. The report's metrics and graphics were subsequently created in collaboration with the product designers.
To Know More Visit:- https://www.playpowerlabs.com/
0 notes
Photo

After validating the data, we performed Exploratory Data Analysis for each cognitive test. We discovered patterns and tested our hypotheses by using summary statistics and visualizations. We then collaborated with the product designers to create metrics and visualizations for the report.
To Know More Visit:- https://www.playpowerlabs.com/
0 notes
Photo
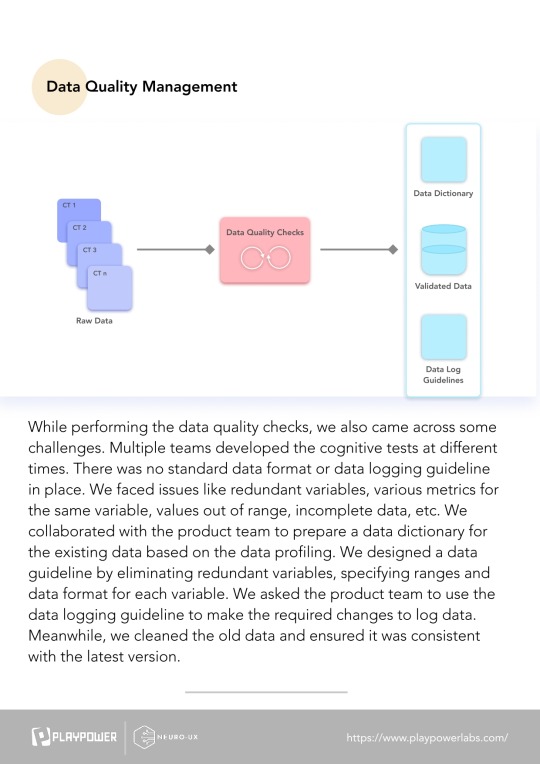
Any data-related investigation requires high-quality data as a requirement. To guarantee data validation for the needed data analysis, we performed several data quality tests. There were no data logging guidelines or a common data format in place. Duplicate variables, measurements for the same variable, values out of range, missing data, and so on were among the data challenges.
To Know More Visit:- https://www.playpowerlabs.com/
0 notes
Link
Adaptive learning in the classroom will work better when users understand what the algorithms are doing. This article describes curriculum-based adaptive learning algorithms specifically designed to be easy to understand by teachers and students. Adaptive learning algorithms are designed to improve student outcomes. But, the algorithms aren't necessarily designed to measure whether the actions it takes are effective.
The quality of assessments, interventions, and overall product model can be much more influential on student outcomes than the algorithm itself. After each teaching cycle, the Mastery Learning Algorithm assesses whether a student learned. This algorithm supports embedded A/B tests (controlled experiments) that can reveal those learning resources that work best for each student. The core design of the algorithm isn't a machine learning model but a pedagogical model. Adaptive learning isn't a magic show, but understanding how it works can help you make it better.
When a student begins using the adaptive system, the algorithm gives them a short assessment of the topic assigned by the teacher. The algorithm evaluates precursor skills, which are easier skills that may support understanding in the current lesson.
0 notes
Photo

High-quality data is an essential prerequisite to performing any data-related analysis. We performed different data quality checks to ensure the data validation for the required data analysis. There was no standard data format or data logging guideline in place. Data challenges included redundant variables, metrics for the same variable, values out of range, incomplete data, etc.
To Know More Visit:- https://www.playpowerlabs.com/
0 notes
Photo
Mental health researchers and practitioners administer cognitive tests to understand the mental capabilities of people. Cognitive tests assess different cognitive domains such as Attention, Executive Function, Psychomotor Speed, Memory, and Emotional & Social Cognition. Data collection of cognitive tests through mobile apps provides an efficient way to generate such reports.
For More Info Visit:- https://www.playpowerlabs.com
0 notes
Photo

Cognitive tests are used by mental health academics and practitioners to better understand people's mental capacities. Different cognitive domains, such as Attention, Executive Function, Psychomotor Speed, Memory, and Emotional & Social Cognition, are assessed using cognitive tests. Using mobile applications to collect data from cognitive tests is an effective approach to create such reports.
For More Info Visit:- https://www.playpowerlabs.com/
0 notes
Photo

We developed a binary classification model that predicted whether or not non-line learning activities will be continued in a given classroom. To group the classroom usage patterns, we employed K-Means clustering. Our model was packaged as a R package, requiring just raw data to be retrieved by downstream applications.
To know more visit:- https://www.playpowerlabs.com/
0 notes
Photo

We created a binary classification model that predicted whether a given classroom will continue their non-line learning activities or not. We used K-Means clustering to group usage patterns of the classrooms. Our model was packaged as an R package so that downstream applications only needed to fetch raw data.
0 notes
Link
EdOptimize is an open-source K-12 Learning Analytics Platform. The tools provided in this platform will enable education stakeholders to improve digital learning systems, programs, and their implementation. EdTech leaders are realizing that learning analytics data can be used to take decisive actions that make online learning more effective. Playpower Labs has created a series of dashboards to help school districts and EdTech companies make the most out of their online learning programs. They can use the user behavior data from their platform to identify actions that can increase user retention and engagement, among other things.
0 notes
Photo
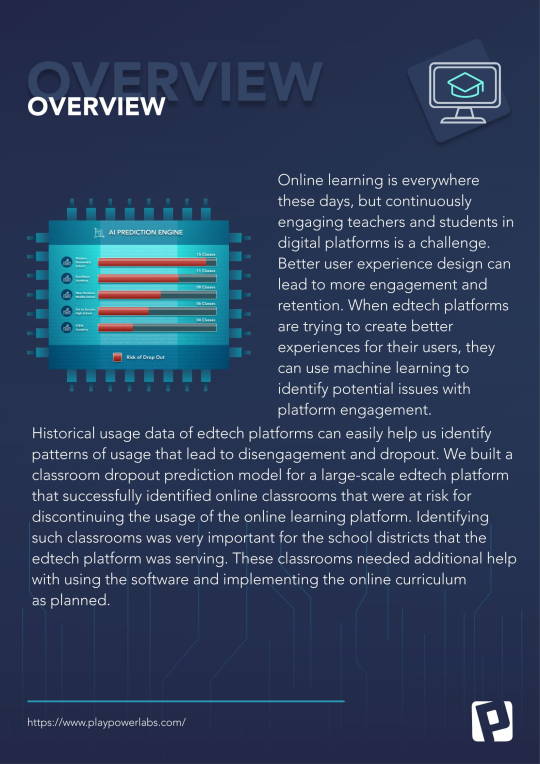
Edtech platforms can use machine learning to identify potential issues with platform engagement. We built a classroom dropout prediction model for a large-scale edtech platform that identified online classrooms at risk. These classrooms needed additional help with using the software and implementing the online curriculum. To know more visit Playpower Labs.
0 notes
Photo
Edtech platforms can use machine learning to identify potential issues with platform engagement. We built a classroom dropout prediction model for a large-scale edtech platform. It successfully identified online classrooms that were at risk for discontinuing the usage of the online learning platform. Some schools/districts are more likely to drop out of digital learning because of their collective attitudes towards certain platforms/ technologies. Our machine learning model was piloted through an email campaign where district leaders received the information about potential classroom dropout in an email.
0 notes