
lupine-publishers-lojiid
Open Access Immunology Journal-LupinePublishers
Lupine Publishers focus on immune responses to infectious diseases such as HIV, hepatitis, tuberculosis, influenza, and malaria. In addition to recent research papers and reviews, we feature current releases in clinical research, vaccine trials and funding opportunities
98 posts
Don't wanna be here? Send us removal request.
Last Seen Blogs

karmatized2014-blog
Karmatized

bullockflowers10
The Journey of Mcmillan 207

crabpersongirl
Crabbyyyy 🦀🦀

t-onificando
Tonificando

Text
Lupine Publishers | Use of PROMIS and Functional Movement System (FMS) Testing to Evaluate the Effects of Athletic Performance and Injury Prevention Training in Female High School Athletes

Lupine Publishers | Orthopedics and Sports Medicine Open Access Journal
Abstract
Two major health concerns with female high school athletes are: 1) psychosocial wellness, and 2) sports-related injuries. It is also known that these health concerns are much greater for minority students who attend high school in economically depressed cities. While it has been well-established that exercise is an effective intervention for these health concerns, there are no established outcome measures to quantitatively assess athletic performance and injury prevention training interventions in this population. Previously, we have demonstrated the utility of Patient- Reported Outcomes Measurement Information System (PROMIS) as a robust outcome measure following ACL reconstruction. Functional movement screening (FMS) has been used as a tool to determine injury risk in female collegiate athletes. Since these tools are broadly available, we completed a pilot study of urban underrepresented minority and suburban female high school athletes, to assess the feasibility and utility of these tools to measure changes in this population during 10-weeks of athletic training. No adverse events of the training or study were reported.
A Kaplan-Meier assessment of the pilot revealed that there was high student retention throughout the 10 weeks. In addition, we found no difference in weekly attendance between the students that completed the pilot vs. the dropouts (while they were in the program), indicating that the students were highly motivated to attend when possible. While no significant differences were found for fatigue and physical function, the pilot significantly improved anxiety, peer relationships, pain interference, and trended towards significance for depression (p<0.05).In terms of physical performance, bench press, combined Pro Agility, and total FMS were all significantly improved (p<0.05). Surprisingly, there were 10 students (67%) in peril of sports- related injury (FM˂14) at the start of the program, and all but 1 (90%) eliminated this serious risk factor. Collectively, these pilot results demonstrate the feasibility of PROMIS and FMS outcomes to assess the efficacy of physical training interventions, in underrepresented minority female high school students, which warrants investigation in a formal prospective study.
Keywords: Underrepresented High School Students; Patient-Reported Outcomes Measurement Information System (PROMIS); Functional Movement Screening (FMS)
Introduction
Two major health concerns with female high school athletes are: 1) psychosocial wellness, and 2) sports-related injuries [1] It is also known that these health concerns are much greater for minority students who attend high school in economically depressed cities [2]. While it has been well-established that exercise is an effective intervention for these health concerns [3] there are no established outcome measures to quantitatively assess athletic performance and injury prevention training interventions in this population. Patient-Reported Outcomes Measurement Information System (PROMIS) instruments are a collection of short forms containing a fixed number of items from six PROMIS domains (Depressive Symptoms, Anxiety, Mobility, Pain Interference, Fatigue, and Peer Relationships) along with a single item on Pain Intensity. There are three PROMIS profile lengths, PROMIS-25 was used for this research study and it includes 4 items per domain. The profiles are universal rather than disease specific and assess all domains over the past seven days except for Physical Function which has no timeframe specified. Previously, we have demonstrated the utility of PROMIS as a high-throughput outcome measure following ACL reconstruction [4]. Functional movement screening (FMS) is a comprehensive exam that assesses quality of fundamental movement patterns to identify a person’s muscular imbalances and asymmetries. A fundamental movement pattern is a basic movement utilized to test range of motion, balance, and stability, concurrently [5]. To successfully complete seven fundamental movement patterns each individual must demonstrate muscular strength, flexibility, range of joint motion, coordination, balance, and proprioception. Each person is scored on a scale ranging from zero to 3 on each of the seven movement patterns and 3 is considered normal. Scores from the seven movements are compiled to obtain comprehensive score [5]. FMS has previously been used as a tool to determine injury risk in high school students [6] and female collegiate athletes [7]. We developed and conducted a pilot study of urban underrepresented minority and suburban female high school athletes, to assess the feasibility and utility of these tools to measure changes in this population during 10-weeks of athletic training.
Methods
All human subject research with children was performed following informed consent from a legal guardian and assent from the study subjects, on an IRB approved protocol. Female studentathletes from an urban minority high school (Rochester, NY, n=15) and suburban high schools (Webster, NY, n=15) were recruited into a 10-week athletic training study at the YMCA in Penfield, NY. Selfreported PROMIS data from the subjects were collected via iPad to a secure server at each session, and FMS baseline and final data were collected at the beginning and end of the 10-week study period, respectively. To obtain scores for FMS the female student-athletes were asked to perform seven movement patterns that included; 1) the deep squat which assesses bilateral, symmetrical, and functional mobility of the hips, knees and ankles, 2) the hurdle step which examines the body’s stride mechanics during the asymmetrical pattern of a stepping motion, 3) the in-line lunge which assesses hip and trunk mobility and stability, quadriceps flexibility, and ankle and knee stability, 4) shoulder mobility which assesses bilateral shoulder range of motion, scapular mobility, and thoracic spine extension, 5) the active straight leg raise which determines active hamstring and gastroc-soleus flexibility while maintaining a stable pelvis, 6) the trunk stability push-up which examines trunk stability while a symmetrical upper- extremity motion is performed, and 7) the rotary stability test which assesses multiplane trunk stability while the upper and lower extremities are in combined motion. The data acquisition and athletic training was performed by five certified athletic trainers from the University of Rochester Department of Orthopaedics. As a feasibility pilot study, the primary goals were to demonstrate our ability to: 1) recruit and retain the human subjects throughout the 10-week study period, 2) evaluate global health quantified by PROMIS (depression, anxiety, pain, peer relationships and physical function), and 3) assess risk of injury quantified by FMS testing. All performance data was obtained pre- and post-intervention. PROMIS scores were tabulated as t-scores using data taken from the first and last week of the intervention. To determine each individual’s maximal effort on the bench, press a weight was selected based on reps achieved during warm-up, each athlete lay in the supine position, un-racked the bar, and bench pressed the pre-selected weight five times.
The weight was either increased based on the athlete’s ability to obtain five repetitions. The test was stopped when the athlete was incapable of reaching five repetitions and the highest weight that they were able to achieve five reps without assistance was taken as their maximal effort. To deem a repetition, complete the individual’s hips must stay on the bench (i.e. you can’t lift the hips or “thrust” the weight up with your lower body), they must lock out the elbows at the top of the lift, and they are allowed to take a breath or pause at the top in between repetitions. Combined pro agility data was obtained by asking each athlete to start the test in a crouched position, in between two cones which are 10-yards apart. The test goes as follows: From the crouched position, the athlete explodes to the right and touches the line with their right hand, they then explode out of this cut and sprints 10 yards, touching the line with their left hand, and then explodes back through the middle cone. After a short break the test is the repeated but starts by going to the left first. Time starts on the athlete’s first move out of the crouched position and ends once they cross the middle line the second time. The average was taken from both right and left test. Statistical analyses to assess changes after the 10-weeks of athletic training were performed using paired t-test for pre/post differences and Kaplan-Meier curve were utilized to assess attendance.
Results & Discussion
Fifteen students completed the 10-week training, and no adverse events of the training or study were reported. A Kaplan- Meier assessment of the Pilot revealed that there was excellent student retention throughout the 10 weeks (Figure 1). We also tracked the attendance of each student, which showed that there was no difference in weekly attendance between the students that completed the Pilot vs. the dropouts (p=0.88), indicating that the students were highly motivated to attend during the time that they were in the program. The PROMIS data are presented in mean ± std (Figure 2). While no significant differences were found for fatigue and physical function, the pilot significantly improved anxiety (45.8 ± 7.4 vs.41.4 ± 7.0, p = 0.006), peer relationships (51.5 ± 6.8 vs.54.1 ± 6.5, p = 0.02), pain interference (47.0 ± 6.4 vs.44.1 ± 7.8, p = 0.02), and trended towards significance for depression (47.0 ± 7.9 vs.44.1 ± 6.8, p = 0.08). This is particularly encouraging since we were not expecting to observe these dramatic effects of the Pilot on such a challenging demographic with a very small cohort of students. The physical performance data are presented in mean ± std (Figure 3). Note that the Pilot significantly improved Bench Press (70.2 ± 10.7lbs vs. 82.0 ± 13.9lbs, p = 0.0009), Combined Pro Agility (5.8 ± 0.5sec vs. 5.4 ± 0.4sec, p = 0.005), and Total FMS (20.3 ± 4.6 vs. 30.4 ± 4.5, p <0.0001). Although the improvements in physical performance were predicted from the known effects of athletic training, surprisingly, there were 10 students (67%) in peril of sports-related injury (FMS<14) at the start of the program, and all but 1 (90%) eliminated this serious risk factor.
Figure 1: Excellent Retention and Regular Attendance of Students in the CHAMPP Pilot.
Figure 2: Effects of the CHAMPP Pilot on Students’ Anxiety, Depression, Peer Relationships and Pain by PROMIS.
Figure 3: Effects of the CHAMPP Pilot on Students’ Athletic Performance and Risk of Injury.
We enrolled 30 female high school students into the CHAMPP Pilot, and their (A) retention is piloted over the 10 weeks. Note that there were seven students who dropped out within 30 days, and the rest completed the program. To assess compliance, we quantified the (B) percentage of sessions that each student attended normalized to their drop-out or completion date. The percent attendance for each of the seven students that dropped out and the 23 students that completed the Pilot are graphed separately with the mean for each group. Circle represent data collected at baseline. Squares represent data collected after the intervention. PROMIS scores at baseline and after 10 weeks of the Pilot for each student for: (A) Anxiety, (B) Depression, © Peer Relationships and (D) Pain Interference. Significant changes from baseline were observed for all except Depression, which almost reached significance (*p<0.05). Note that negative (E) % change is the desirable outcome for all measures except Peer Relationships. Circle represent data collected at baseline. Squares represent data collected after the intervention. Student athletic performance data (n=15) were collected in Ortho Metrics TM at baseline and after 10 weeks of the Pilot for each student with the mean and % change is presented for Bench Press, Combined Pro Agility, and Total FMS. Significant changes from baseline are shown. Note that students with an FMS score below 14 are considered to be at risk for injury, and that the 25% increase in FMS score for the group was highly significant. Circle represent data collected at baseline. Squares represent data collected after the intervention.
Conclusion
Etiology and pathogenesis of PCLGC are unclear, however it is proposed that repetitive microtrauma of joint and soft tissue can promote expansion of mucin from ligament fibers and acting as a potential trigger [20]. Recognition of PCLGC as a clinical entity leading knee pain and impairment is increasing due to the sensitivity of MRI to identify intra-articular abnormalities. The typical finding is an ovoid fluid filled cystic lesion which can frequently be multilocular in the intercondylar notch of the knee [22,25]. In our case report MRI shows a cystic multilocular mass with fluid signal intensity within the synovial layer of the PCL. Although most knee cysts are asymptomatic, in some case they could be a relevant source of pain [20,21]. Clinical manifestations of a knee cyst are mostly dependent on the pathologic process involved, along with its location, size, mass effect, and relationship to surrounding structures [26]. The typical presentation of symptomatic PCLGC include posterior knee pain, restriction of ROM, stiffness and mild swelling [20,21].
Limited ROM is a typical finding with an intra-articular ganglion arising from the PCL, mainly with inability and pain to extreme flexion due to the compression of the cyst mass between the PCL and the posterior joint capsule. With this clinical picture in mind, athletes between 20 and 40 years old who present knee pain with restriction on hyperextension or full flexion, with no previous macrotraumatic report or knee instability, should raise a high level of suspicion for intra-articular ganglion cysts. Only symptomatic PCLGC need to undergo treatment. There a broad spectrum of treatments described for these lesions, from a rehabilitation program focused on ROM, strengthening and proprioception to avoid kinetic impairment, to ultrasound or CT-guided aspiration or infiltration, or even arthroscopic excision. Treatment choice must take into account several criteria such as level of activity, time for recovery, risk of joint damage and recurrence of the cyst. Arthroscopic treatment has demonstrated good outcomes with up to 95% of patients reporting good results and associated with the lowest recurrence rate, but it needs an hospitalization, anesthesia and a longer recovery period, which can become a major problem when we are dealing with competitive sports [23,24].
Athletes require quick return to play with minimal side effects, so we need to take into account less invasive treatments like US or CT-guided procedures, or even load management in addition to a rehabilitation program.
Conclusion
CCP is a rare and often asymptomatic condition. Its pathogenesis and prognosis are still unclear. In a young adult with posterior knee pain (popliteal aspect), no history of major event, limited ROM (hyperextension and extreme flexion), meniscus and ligament test negative and no confidence in demanding tasks it is important to think about this condition. The therapeutic option stems from the patient’s characteristics, but US or CT- guided puncture should be considered.
For more Lupine Publishers Open Access Journals Please visit our website:
http://lupinepublishers.us/
For more Orthopedics and Sports Medicine articles Please Click Here: https://lupinepublishers.com/orthopedics-sportsmedicine-journal/index.php
To Know More About Open Access Publishers Please Click on Lupine Publishers
Follow on Linkedin : https://www.linkedin.com/company/lupinepublishers
Follow on Twitter : https://twitter.com/lupine_online
#Lupinepublishers#Lupine publishers#Lupine Publishers LLC#Lupine Publishers Group#lupine publishers indexing Journals#lupine publishers indexing sites
33 notes
·
View notes
Text
Lupine Publishers | Model Development for Life Cycle Assessment of Rice Yellow Stem Borer under Rising Temperature Scenarios
Lupine Publishers | Agriculture Open Access Journal
Abstract
A simple model was developed using Fortran Simulation Translator to study the influence of increased temperature on duration of various life cycle phases of yellow stem borer (YSB) in Bangladesh environment. Model was primarily based on Growing Degree Day concept, by also including cardinal temperatures sensitive for specific growing stages of YSB. After successful calibration and validation of the model, it was taken for climate change (only temperature rise considered in the present study) impact analysis on the growing cycle of YSB. Temperature increase values of 1, 2, 3 and 4 oC were considered and compared with the Control (no temperature rise), by using historic weather of representative locations in eight Divisions of Bangladesh. Differential spatial response in the life cycle of YSB under various temperature rise treatments was noticed, and in general the growing cycle hastened with the rising temperature. The life cycle of YSB is likely to be reduced by about 2 days for every degree celcius rise in temperature, while averaged over locations. This means that there will be 2.0-2.5 additional generations of YSB in pre-monsoon season about 2.9-3.2 in wet season of Bangladesh. There is a need to include the phenology module developed in subsequent design of population dynamics model for YSB.
Keywords: Model; Growing degree days; Yellow stem borer; Life cycle assessment; Temperature rise
Introduction
Yellow stem borer (YSB) is the most destructive and widely distributed insect-pest of rice. It causes dead heart or white head, depending on infestation time and significantly reduces rice yields by 5-10% and even up to 60% under localized outbreak conditions [1]. It can grow in places having temperature >12 oC and annual rainfall around 1000mm. Generally, temperature and high relative humidity (RH) in the evening favors stem borer growth and development [2]. The female moth oviposits from 1900 to 2200hr in summer, 1800 to 2000 hr in spring and autumn, and deposits one egg mass in a night and up to five nights after emergence. Optimum temperature is 29 oC having 90% RH for maximum number of eggs deposition. Optimum temperature for egg hatching is 24-29 oC with 90-100% RH. Larvae die at 35 oC and hatching is severely reduced when RH goes to below 70% [1]. Larvae can�t molt at 12 oC or below and they die. The last instar larvae can survive unfavorable growth condition as diapauses, which is broken by rainfall or flooding. In multiple rice cropping, no diapauses takes place. The pupal period can last for 9-12 days and the threshold temperature for its development is 15-16oC.
The number of generations in a year depends on temperature, rainfall and the availability of host [1]. The occurrence of the pest is generally the highest in wet season [3]. Since there are many stem borer species, the average life cycle of rice stem borers varies from 42-83 days [4], depending on growing conditions. This implies that heterogeneous population can be found in the same rice field. Manikandan [5] also reported that development time by different phases of YSB decreases with higher temperature and thus increased population likely in future at early growth stages of rice crop. However, no such data is available in Bangladesh. Keeping the acute problem of YSB in Bangladesh, the present study was undertaken to develop a simple phenology-based) model to assess the life cycle of YSB in two major growing seasons of rice and subsequent taking it to evaluate the effect of rising temperature on growth cycle of rice yellow stem borer in representative locations of eight Divisions of Bangladesh.
Materials and Methods
Model description
Model for assessing the phenology of yellow stem borer was written in Fortran Simulation Translator and the compiler used is FSTWin 4.12 [6]. This model will subsequently be used to develop population dynamics model for YSB in rice-based cropping systems prevalent in Bangladesh. Growing degree days (GDD) concept was used for this purpose, with base temperature assumed as 15 degree Celsius, below which growth and development activity in the life cycle of YSB does not take place. Each day, average temperature (mean of maximum and minimum temperatures) minus the base temperature is integrated over the growing cycle, and subsequently the development stage is achieved when critical value for attainment of a particular stage is crossed.
In the INITIAL phase, the GDD is taken as zero, which is read one time during running of the model
INCON GDDI, initial value of GDD = 0.
In the DYNAMIC phase, the program is executed daily till the FINISH Condition is achieved.
DAS, days after start of simulation = INTGRL (ZERO, RDAS)
PARAM RDAS, day increment rate = 1.
The development stage can be expressed in development stage (0-1), but in the present study not used for development stage identification, which we will use in further design of population dynamics model in coming times.
DVS, development stage = INTGRL (ZERO, DVR)
DVR, rate of development stage increase, Arbitrary Function Generator- a well defined FST function=AFGEN (DVRT, DAVTMP)
Since the age of male is relatively lower than the age of the female, so the computation is done separately as indicated below:
*FOR FEMALE
FUNCTION DVRT = -10.,0., 0.,0.,15.,0.,35.,0.03325,40.,0.0415
*FOR MALE
FUNCTION DVRT = -10.,0., 0.,0.,15.,0.,35.,0.0342,40.,0.0426
Base temperature below which the activities do not take place, degree celcius, is given as under:
PARAM TBASE=15.
Reading of weather data, on daily time step, is read through external file, as per well defined format for FST compiler, as given below:
WEATHER WTRDIR=‘c:\WEATHER';CNTR=’ GAZI’;ISTN=1;IYEAR= 200
Where, various climatic elements are used as below:
RDD is solar radiation in J/m2/day
DTR = RDD
TMMX is daily maximum temperature; COTEMP is the climate change, temperature rise switch for evaluating the impact of temperature rise on the phenological development of the life cycle of YSB. TMMN is daily minimum temperature.
DTMAX = TMMX+COTEMP
DTMIN = TMMN+COTEMP
DAVTMP, average temperature (derived parameter) = 0.5* (DTMAX + DTMIN)
DDTMP, day time average temperature, derived parameter = DTMAX - 0.25* (DTMAX-DTMIN)
COTEMP is temperature rise/fall switch
PARAM COTEMP = 0.
DTEFF, effective temperature after deducting the base temperature = AMAX1(0., DAVTMP-TBASE)
SVP, is saturated vapor pressure in mbar, calculated from temperature (derived value)
SVP = 6.11*EXP (17.4*DAVTMP/(DAVTMP+239.1))/10.
VP is Actual vapor Pressure, mbar, an input for running of the modelAVP = VP
AVP = VP
RH is relative humidity, expressed in %, derived from the vapor pressure as below:
RH = AVP/SVP*100.
In the present study, only temperature and relative humidity effects are undertaken for computation of the phonological stages of the life cycle of YSB, although we have described the other climatic elements as part of the FST compiler, but the other parameters will also be used in deriving the population dynamics model, which we will take up in later course of time.
Since the development stages of YSB are influenced by relative humidity also, so we have to introduce the correction factor for including the effect of humidity, as below:
DAVTMPCF, RH induced temperature correction = DAVTMP*CFRH
TMPEFF=DAVTMPCF-TBASE
CFRH is the Correction Factor for relative humidity for judging temperature is computed as below: i.e. during hatching (CFRHH) and larva formation (CFRHL) stages, computed as below:
CFRH, correction factor for RH=INSW (GDD-EGHATCH, CFRHH, DUM11)
DUM11=INSW (GDD-979.9,CFRHL,1.)
Where INSW is FST Function, if GDD<979.9, then CFRHHD is taken and otherwise DUM11
CFRHH=AFGEN (CFRHHT, RH)
CFRHL=AFGEN (CFRHLT, RH)
FUNCTION CFRHHT=50.,0.9,60.,0.9,75.,1.,90.,1.1
FUNCTION CFRHLT=50.,0.95,60.,0.95,75.,1.,90.,1.05
WDS, wind speed in m/sec = WN
RRAIN, daily rainfall in mm = RAIN
TRAIN, total rainfall in mm = INTGRL (ZERO, RRAIN)
GDD is growing degree days, expressed in degree Celsius-days, is calculated as below:
GDD=INTGRL (GDDI, TMPEFF)
On the basis of literature search from the published literature, the growing degree days for various stages were computed and used in development of the model, and is described as below:
EGHATCH is the thermal degree days requirement for egg hatch, is as below:
PARAM EGHATCH=119.7
INSTAR1 is thermal degree days for end of first instar 1 stage
PARAM INSTAR1=224.9
INSTAR2 is thermal degree days for end of second instar stage
PARAM INSTAR2=317.0
INSTAR3 is thermal degree days for end of third instar stage
PARAM INSTAR3=438.7
INSTAR4 is thermal degree days for end of fourth instar (larva) stage
PARAM INSTAR4=550.3
PUPA, is thermal degree days for end of pupa stage
PARAM PUPA=662.452
ADULT LONGIVITY is thermal degree days for end of adult longevity, which is different for male/female, For Male=741.484 and Female=773.538, depending upon the defined parameter SEX
ADULT=INSW (SEX-1.05, FEMALE, MALE)
SEX=1. For female and 2. For male
PARAM SEX=2.
PARAM MALE, growing degree days for male = 741.484
PARAM FEMALE, growing degree day for female = 773.538
Critical temperature above which the egg hatching stops is defined as below:
DEATH=REAAND (EGHATCH-GDD, DTMAX-40.)
HATMI, minimum temperature below which the Hatching stops, is defined as below
PARAM HATMIN=15.
DEATH1=REAAND (EGHATCH-GDD, HATMIN-DTMIN)
LATMIN, minimum temperature below which larval growing stages stop, and is given as under:
PARAM LATMIN=12.
DEATH2=INSW (GDD-EGHATCH,0.,REAAND(INSTAR4-GDD,LATMIN- DTMIN))
REAAND is FST Function, which will be 1 when both the variables within parenthesis are greater than zero; otherwise the value will be 0.
Duration of various stages is computed as below:
EGHATCHD is egg hatch duration, in days and computed as below:
EGHATCHD=INTGRL (ZERO, DUM1)
DUM1=INSW (EGHATCH-GDD,0.,1.)
INSTAR1D is INSTAR1 Termination Day
INSTAR1D=INTGRL (ZERO, DUM2)
DUM2=INSW (INSTAR1-GDD, 0.,1.)
INSTAR2D is INSTAR2 Termination Day
INSTAR2D=INTGRL (ZERO, DUM3)
DUM3=INSW (INSTAR2-GDD, 0.,1.)
INSTAR3D is INSTAR3 Termination Day
INSTAR3D=INTGRL (ZERO, DUM4)
DUM4=INSW (INSTAR3-GDD, 0.,1.)
INSTAR4D is INSTAR4 Termination Day
INSTAR4D=INTGRL (ZERO, DUM5)
DUM5=INSW (INSTAR4-GDD, 0.,1.)
PUPAD is PUPA Stage Termination Day
PUPAD=INTGRL (ZERO, DUM6)
DUM6=INSW (PUPA-GDD,0.,1.)
ADULTD is Adult Life End Day
ADULTD=INTGRL (ZERO, DUM7)
DUM7=INSW (ADULT-GDD, 0.,1.)
Stop of Run Condition is as under:
FINISH DEATH > 0.95
FINISH GDD> 775.
Integration conditions for running of the program are as under:
TIMER STTIME = 360., FINTIM = 600., DELT = 1., PRDEL = 1.
TRANSLATION_GENERAL DRIVER='EUDRIV’
PRINT DAY, DOY, DVS, RH, AVP, SVP, WDS, TRAIN, GDD, DAVTMP, DAVTMPCF, ADULTD, PUPAD
In the TERMINAL stage, the final values at the stop of model run can be written in an external file:
CALL SUBWRI (TIME, COTEMP, EGHATCHD, INSTAR1D, INSTAR2D, INSTAR3D, INSTAR4D, PUPAD, ADULTD)
END
Reruns options for evaluating the impact of temperature rise on the development stages of the YSB can be run through this given below procedure:
PARAM COTEMP=1.
END
PARAM COTEMP=2.
END
STOP
Experimental
Growing degree days for attainment of various growing stages in the life cycle of YSB were collated from the published literature in this region. The model was calibrated with 2003 weather data of Bhola district of Bangladesh against the findings of Manikandan [5] at 30 oC. After model calibration, it was subsequently taken to climate change window, temperature rise only considered in the present study. Eight divisions (Dhaka, Mymensingh, Rajshahi, Rangpur, Sylhet, Khulna, Chittagong and Barisal) of Bangladesh were taken and one representative location was chosen from each division and historic weather data of 35 years were taken for running of the model and the duration of each development stage was computed and compared amongst temperature rising conditions. In the present study, daily temperature rise from 1-4 oC were considered for two growing seasons, .com rice season i.e. premonsoon (April to June) and Aman Rice season i.e. Monsoon (late June to November) of Bangladesh.
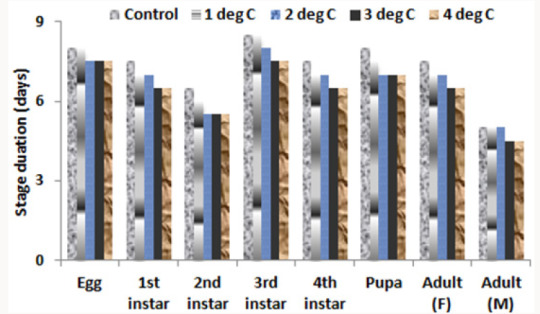
Figure 1: Days required for completion of growth stages of rice yellow stem borer with increased temperature by 1, 2, 3 and 4 degree celcius in the growing environment of Bhola, Bangladesh.
Results and Discussion
During the test period, minimum temperature averaged 26�0.115 and maximum temperature around 31�0.32, with the average temperature around 30 oC, which was used for calibration and validation of the model, and the model performed satisfactorily well, through nice agreement between observed and simulated results (Table 1). Depending on growth stages, the percent deviations were within the limit of model errors. The application of model for specific years of Bhola district showed that the growth stages of rice yellow stem borer (YSB) were decreasing (Figure 1) by about 1.76 days per degree rise in temperature (Y=1.7X+54.6; R2=0.932). This indicated that YSB is likely to infest more rice plants in future under increased temperature conditions. Ramya [7] also reported that YSB would likely to develop faster, oviposit early and thus enhanced population build up than expected. There are reports that temperature increase by 2oC may cause 1-5 times additional life cycles of insects in a season [8].
Table 1: Validation of various growth phases (days) of rice yellow stem borer.
Results, from represented locations in the eight Divisions of Bangladesh, showed that growth stage of YSB varied depending on season (Table 2). In .com pre-monsoon season, life cycle of YSB would likely to be completed within 47-53 days, depending on locations and temperature rise from 1-4 degree celcius. Similarly in Aman wet season, it would about 45-50 days for temperature rice from 1-4 degree celcius. However, under the Control (no temperature rise) condition, it requires around 52 days for T. Aman and 55 days for .com. Our findings indicate that growth cycle of YSB is likely to decrease by 2.04 days per degree rise in temperature in the .com season and 1.70 days in T. Aman season (Figure 2). Similar results were reported by Manikandan [5]. Generally, insect population build up depends on favorable weather conditions and availability of host. So, there will be ups and downs in the peak build ups in a cropping season [9]. Although model data needs to be cautiously adopted, it clearly showed that with climate change impact the infestation of YSB would be increased, which might be cause of yield reduction, if not proper management is taken at the right time [10].
Figure 2: Total life cycle duration of yellow stem borer as influenced by temperature rise during .com and T. Aman, season (averaged over eight Divisions of Bangladesh).
Table 2: Developmental phases (in days) of rice yellow stem borer as influenced by temperature rise in different growing seasons.
Conclusion
Yellow stem borer of rice crop is a major concern in Bangladesh. Dead hearts and white heads caused by YSB significantly reduce growth and yield of rice crops, especially in .com (Pre-monsoon) and T. Aman (Monsoon) seasons. There is a need to understand the phenology i.e. life cycle assessment and population dynamics of YSB in the growing environments of Bangladesh. In the present study, a simple model, as written in Fortran Simulation Translator (FST), was developed to assess the life cycle of YSB. The model was primarily based on growing degree day�s concept, by also considering cardinal temperatures for specific phenological/ development growth stages of YSB. The model was successfully validated with the growing environment of Bhola district of Bangladesh. Subsequently, the model was taken to assess the impact of rise in temperature on life cycle of YSB in representative locations of eight Divisions of Bangladesh. The response was spatiotemporally and seasonally variable. The life cycle hastened with the rise in temperature by 1-4 degree celcius. We, in near future, plan to develop a population dynamics model for YSB and to subsequently link it with the rice growth model to evaluate the yield reductions associated with YSB infestations.
Acknowledgement
We greatly acknowledge the support of Krishi Gobeshona Foundation, Dhaka, Bangladesh in conducting this research through CRP-II project.
https://lupinepublishers.com/agriculture-journal/pdf/CIACR.MS.ID.000144.pdf
For more Lupine Publishers Open Access Journals Please visit our website: https://lupinepublishersgroup.com/
For more Agriculture Open Access Journal articles Please Click
Here: https://www.lupinepublishers.com/agriculture-journal/
To Know More About Open Access Publishers Please Click on Lupine publishers
Follow on Linkedin : https://www.linkedin.com/company/lupinepublishers
#Lupinepublishers#Lupine Publishers LLC#Lupine publishers#lupine publishers indexing Journals#LOJ Immunology and Infectious Diaseases
33 notes
·
View notes
Text
Lupine Publishers | The Oral and Dental Health Status in Children Under Haemodialysis

Lupine Publishers | Journal of Pediatric Dentistry
Abstract
Untreated dental infection in End Stage Renal Disease (ESRD) patients can potentially contribute to morbidity and transplant rejection. There is a need for detailed assessment and provision of good dental care following the diagnosis of chronic renal failure (CRF). Hence, regular clinical review is important for the early identification of oral complications of renal disease.
Aim: The present study was carried out at Pediatric Nephrology Unit in Zigzag University Hospital to evaluate the dental health status in CRF children.
Design: The dental health status of 50 children under 15 years suffering from CRF were compared results to the results of an age and sex matched control group (n=50). This study was done to evaluate enamel hypoplasia, dmft, DMFT, Gingival Index (GI), Plaque Index (PI), intrinsic and extrinsic stain and the changes in oral microflora including salivary Calcium, phosphorus, alkaline phosphatase and urea concentrations were measured using phenol Sulphur acid colorimetric method. The estimated stimulated salivary pH, buffering capacity and count of Streptococcal Mutants and lactobacilli were determined on selective media of all participants.
Results: The study and control groups did not significantly differ in daily tooth brushing frequency and periodic dental check up frequency. Severe enamel hypoplasia was present in study group. The means of dmft, DMFT and PI were significantly greater in the study group (p< 0.05). The differences among groups for GI were statistically insignificant. Our findings of intrinsic brown staining were 22% and 20% extrinsic staining of patients.
Conclusion: The salivary pH of patients and salivary levels of cariogenic S. mutans and lactobacilli in the study group were significantly lower than the control group, probably due to increased concentrations of antibacterial chemicals such as urea in the saliva of CRF children. The presence of uremia during the development of dentitions cause Intrinsic staining but black brown extrinsic staining due to using ferrous sulfate syrup for treatment CRF children anemia. Although dental treatment need is not high, these children should receive dental health education, including oral hygiene instruction, in order to improve their overall oral health.
Keywords:End Stage Renal Disease Orthodontic; Chronic Renal Failure; Dental; Streptococcal Mutans; Caries; Children; Haemodialysis
Introduction
Chronic kidney disease (CKD) is a major health problem worldwide with increasing incidence and prevalence that is threatening to bring on the onset of a real ‘epidemic and characterized by a gradual loss of kidney function over time [1-3]. Childhood CKD presents clinical features that are specific and totally peculiar to the paediatric age, such as the impact of the disease on growth. In addition, some of the typical characteristics of paediatric CKD, such as the etiology or cardiovascular complications, represent variables, not only influencing the health of the patient during childhood, but also having an impact on the life of the adult that this child will become. CKD in children is a major problem of public health both in poor and developed countries and it is an important cause of morbidity and mortality in children worldwide [4,5]. There is limited information on the epidemiology of CKD in the pediatric population due to the absence of a common definition and well-defined classification [6]. According to ItalKid Project, a prospective, population-based Italian study on CKD epidemiology, and the North American Pediatric Renal Trials and Collaborative Studies (NAPRTCS), CKD was defined as having a glomerular filtration rate (GFR) of below 75ml/min/1.73m2 [7,8]. While other authors based their definition on serum creatinine levels themselves or on other thresholds of GFR [9,10]. The National Kidney Foundation’s Kidney Disease Outcomes Quality Initiative (NKF-K/ DOQI) published a guideline on CKD, which included a classification system for CKD severity, independent of cause, and applicable to children. This classification system identifies five stages of CKD based on the level of GFR. CKD is now defined by the presence of kidney damage (for example, any structural or functional abnormality involving pathological, laboratory or imaging findings) for≥3 months or a GFR< 60 ml/min/1.73 m2 for ≥3 months [11]. CKD causes are different between children and those in adults. The congenital causes, including congenital anomalies of the kidney and urinary tract (CAKUT) (48%) which is predominated in younger patients and hereditary nephropathies (10%), were the most common. Glomerulonephritis accounts for 14% of cases which is the leading cause in children older than 12 years of age and there are variations of the cause’s distribution with ages and races, according to NAPRTCS annual report [12]. According to United States Renal Data System (URDS) Registry, the congenital disorders (CAKUT and hereditary nephropathies) were the most common etiologies in the youngest ESRD group, whereas the proportion of acquired diseases increased progressively with age [13]. The similar distribution of causes of CKD has been reported in Europe, where the proportions of CAKUT and hereditary nephropathies were 58-59% and 15-19%, respectively. The proportion of glomerulonephritis was (5–7%) which was lower than United States that’s could be due to the difference in racial distribution [14]. CAKUT is the leading cause of CKD (47– 62%) with clear predominance of uropathies over hypo dysplasia followed by hereditary nephropathies (17 to 30%) in Middle East [10,15]. But the neuropathic bladder remained an important cause of CKD in Turkey (15%) than other Middle East communities [16]. The prevalence of dialysis patients in Egypt is presumed to have increased from 10 per million population (pmp) in 1974 to about 165 (pmp) in 1995 and more recent study showed a further increase in CRF prevalence to 225 (pmp) in 1999 [17]. The highest prevalence was 483 (pmp) in 2004 as reported by Afifi et al. [18] in the ninth annual scientific meeting of the Egyptian Renal Registry in 2008. Most CRF patients are treated by haemodialysis, as reported in different studies [18,19]. The chronic glomerulonephritis is the main reported cause of CKD in various studies and this may be related to high prevalence of bacterial, viral, and parasitic infections that commonly affect the kidneys in developing countries, as well as a different age distribution dies from Southeast Asia, Latin America and Caribbean area with a prevalence ranging from 30 to almost 60% [20,21]. The CAKUT are the main causes, accounting for (34- 43%) of pediatric ESRD cases in Europe, Japan, Australia, and New Zealand. The proportion of ESRD caused by glomerulonephritis was lower in Europe according to the ESPN/ERA-EDTA registry (15%) compared with a Japanese study (22%) and the Australia and New Zealand Dialysis and Transplant Registry (ANZDATA) this may be due to the age distribution of patients, with fewer young patients being treated for ESRD at that time [22,23].
Clinical Features of CKD in Children
Growth impairment is a common and perhaps the most visible complication of CKD in children and its increase as GFR declines, even though a significant decrease in growth was seen at all levels of kidney function [1,24-26]. In children with CKD the risk factors that contribute to impaired growth include: malnutrition, metabolic acidosis, mineral and bone disorders, anaemia, and fluid and electrolyte abnormalities [27,28]. That’s making the inadequate nutrition (due to anorexia or vomiting) appears to be the most important factor contributing to growth impairment at that age and maximizing caloric intake to at least 80% of requirements has been found to effectively improve growth in children who developed CKD as infants [29]. Anemia is one from the most a common complication in children with CKD causing many adverse clinical consequences such as; poor quality of life, depressed neurocognitive ability, reduced exercise capacity and progression of cardiovascular risk factors, such as left ventricular hypertrophy (LVH) [30,31]. However the diagnosis of anemia in children with CKD is not as straightforward and its s in prevalence with advancing stages of CKD. Anemia of CKD is the result of many interacting factors, but decreased production of erythropoietin by the unhealthy kidney and iron dysregulation (including iron deficiency and iron-restricted erythropoiesis) are the primary defects [32]. The hypertension can be present from the earliest stages of the disease and its prevalence increases as GFR progressively declines [33,34]. effective control of BP reduces not only cardiovascular morbidity and mortality, but also the rate of progression of CKD [35]. The CKD have significantly increased rates of cardiovascular morbidity and mortality in both adult and paediatric compared to the general populations [36,37]. For paediatric population with CKD the risk reach 1000 times higher in the ESRD group compared with the age-matched non-CKD population [38]. CVD in the CKD population ensues from a combination of traditional (e.g. hypertension, dyslipidaemia, abnormal glucose metabolism and obesity) and CKDrelated risk factors (e.g. increased calcium-phosphorus product, hyperparathyroidism and anemia) [34] and there are evidences that the cardiovascular anomalies begin early in the course of renal failure, irrespective of the age of onset, and rapidly progress when dialysis is initiated [39]. Chronic kidney disease–mineral and bone disorder (CKD-MBD) is defined by the presence of one or a combination of the following findings: abnormalities in calcium, phosphorus, parathyroid hormone (PTH) or vitamin D metabolism; abnormalities in bone histology, linear growth, or strength; vascular or other soft tissue calcifications [40]. The Renal osteodystrophy is an aspect of CKD-MBD that refers only to bone pathology. The changes in calcium and phosphorus metabolism can significantly alter bone remodeling and somatic growth making the optimization of bone health, growth and final adult height must be a focus of CKD management in children [41]. The effective treatment of CKD-MBD affects the progression of cardiovascular disease, as phosphate is also a strong vascular toxin either or through its effect on PTH and fibroblast growth factor 23 [42,43]. Progressive loss of renal function causes retention of excretory products leading to uremia and azetomia [44]. Azetomia is an increase in blood urea nitrogen (BUN) may be associated with adverse clinical signs and symptoms to produce uremia that is with malnutrition resulting from a protein-restricted diet leads to an immune deficient state resulting in a significant impaired host deficiency and higher susceptibility to infection [45]. Dialysis patients may form calculus more rapidly than healthy individuals may possibly due to high salivary urea and phosphate levels. Calculus is always covered with a non-mineralized layer of plaque [46]. Renal failure is also associated with a reduced prevalence of caries, and its early intraoral symptoms include bad metallic taste and ammonia odor. Loss of lamina dura, loosening of teeth, bony fractures, bone tumors, radiolucent cyst-like lesions, malocclusion, narrow pulp chamber, and thick pre-dentin may also be seen in these patients [47,48]. Davidovich et al. [49] reported that, the patients suffering from (ESRF) and those receiving dialysis are more prone to periodontal disease and other oral health problems. The renal failure patients had higher gingival index (GI) and bleeding; probing depths, attachment loss, hypoplasia, obliteration and less caries. The plaque was found to be higher in the dialysis and pre-dialysis patients than the normal. Infections in the oral cavity may act as foci for disease or injury in other sites of the body [50]. Many researchers have investigated the salivary content and flow rate in adults with CRF. Significantly, higher concentrations of salivary proteins, potassium and sodium were observed in unstimulated saliva collected from adults undergoing haemodialysis compared with healthy volunteers [51]. Others reported that the pH and buffer capacity of the unstimulated saliva was also increased in haemodialysis patients [52]. Various authors examined the relationship between the composition of saliva and cariogenic activity and the control of inflammatory processes of the mouth. A rise in the levels of free radicals (reactive oxygen species) has been found to be the common factor in these processes [53]. Untreated dental infection in immunosuppressed individuals can potentially contribute to morbidity and transplant rejection [54]. There is a need for detailed assessment and provision of good dental care following the diagnosis of chronic renal failure (CRF) so that, regular clinical review is important for the early identification of oral complications of renal disease [55,56]. Advances in pediatric nephrology during the last two decades have resulted in a marked increase in the number of children surviving with CRF. Considering the consequences of oral health concerns for children with CRF and ESRD, the present study was conducted to gain further insight into oral microflora changes of these patients in comparison with the healthy control group (Figure 1).
Figure 1: 8 years old child with ESRD on haemodialysis machine. .
Subjects and Methods
Table 1: Primary kidney disorders in children with end-stage renal disease (ESRD).
According to World Medical Association, declaration of Helsinki [57], study population and ethical local institutional approval for study in this cross-sectional study sample comprised 100 participants with the same socioeconomic conditions and aged from 2-15 years. Control group (G1) was composed of 50 healthy randomly selected individuals whose were scheduled for treatment at (Outpatient Dental Clinics, Zigzag University Hospital, Egypt). Patients with debilitating diseases or neurological disorder or who examined for possible ear infections were excluded from the study. Another study group (G2) consisted of 50 CRF patients were undergoing regular haemodialysis treatment in the paediatric nephrology unit at Zigzag University Hospital, Egypt which their information retrieved from their files, patients were categorized according to the primary kidney disorder (Table 1). No other systemic disease was diagnosed in any of these patients. All parents or legal guardians received adequate information and written consent to participate in the study. The study did not include any invasive technique leading to contamination to or from these patients. The same examiner performed the clinical examination and allocated participants in both groups blindly.
Clinical Examinations
The examination of each patient was carried out using a mouth mirror and a probe according to the criteria of the World Health Organization [58,59]. Each subject was assessed for daily tooth brushing frequency and periodic dental checkup frequency. Following a general appraisal of the mouth, the teeth were examined in both study and control groups for tooth caries, hypoplasia, discolorations, gingival status, and plaque indices.
a) Caries Status: Determined by recording the number of decayed (d, D), missing (m, M), and filled (f, F) teeth in the primary and permanent dentitions for each patient and were referred to as dmft for primary teeth and DMFT for permanent teeth.
b) Dental Plaque Recording: The deposits were assessed using the Plaque Index. The children were asked for crushing the disclosing tablet or applying disclosing solution for young children and the plaque assessed by numerical scoring of plaque (PI) Plaque Index [60] (Table 2).
Table 2:
Figure 2: Painted teeth after using disclosing tablets to detect amount of plaque on teeth surfaces.
Figure 3: Gingiva of child suffer from CRF from one a year ago with pale gingival color but can bleed easily.
c) Gingivitis Recording: The gum status was assessed using the Gingival Indices The gingiva were examined for inflammation using a Gingival Index (GI) by using mouth mirror and blunt periodontal explorer [61] (Table 3).
Table 3:
d) Discolorations Recording: Detect any discoloration on the teeth of child and differentiate if it was black or brown extrinsic stain or brown intrinsic stain.
e) Enamel Hypoplasia Recording: Enamel hypoplasia was assessed as (none, mild, moderate, sever) using the criteria determined by Alaluusa et al. [62] (Table 4).
Figure 4: Teeth of CRF child with sever enamel hypoplasia & intrinsic discoloration
Table 4:
Figure 5: Teeth of CRF child with mild enamel hypoplasia, intrinsic & extrinsic discoloration. .
Salivary Tests
Children in both groups should be without any antibiotic therapy in the last week before the sample collection. For measuring the Streptococcus mutans (S. mutans) and lactobacilli count in saliva by means of selective culture media. Before collecting saliva for the bacteriological counting test, the patients were asked not to eat or drink for at least an hour and salivation was stimulated by having the children chew a paraffin pellet for 5 minutes. About 5ml of the saliva from each child was collected in a sterile calibrated container. The containers were stored in ice for transfer and kept frozen at - 80°C until the time of assay. Each sample was divided into three separate samples in sterile tubes, two of them inoculated onto selective media while the samples was taken. Bacterial counts from each of the different media were obtained and compared. The third sample processed for detect level of salivary calcium (Ca), phosphorus (pH), alkaline phosphatase (AP), salivary urea and salivary pH.
a) Streptococcal Mutans count (S. Mutans): About 3ml from saliva samples which collected were stored in a sterile calibrated universal container that were divided into two separate parts of samples, one of them inoculated onto Mitis Salivarius agar media (Becton Dickinson and DIFCO Company, Chicago, USA) was used for isolation S. Mutans that is the selective medium [63]. (Figure 6) Mitis salivarius agar media contents: (Pancreatic digest of casein 6gm, Proteose peptone 9gm, Proteose peptone 5gm, Saccharose 50gm, Dextrose 1gm, Dipotassium phosphate 4gm, Trypan blue 0.075gm, Crystal violet 0.008gm and Agar 15gm) after the samples were taken. The medium was prepared according the manufacturing instructions as: 90gm of the medium and 150gm sucrose were dissolved in 1liter of distilled water by heating. The dissolved components were autoclaved at 121°C for 15 minutes and left to cool to 45-50°C and just prior to pouring, 1ml of 1% sterilized potassium tellurite and 1ml of 200 units/ml sterilized bacitracin were added. Sterilization of potassium tellurite and bacitracin was performed by filtration through millipores bacterial filters. About 20ml of the medium was poured in each Petri plate, all allowed to solidify at room temperature and then stored in the refrigerator at 4°C for no more than four weeks. Identification of oral S. Mutans was confirmed by biochemical tests like mannitol and sorbitol fermentation and catalase [64] colony counting was done with a magnifying glass and the count of S. Mutans was expressed as the number of colony forming units per milliliter (cfu/ ml) of saliva. Semi quantitation of the number of colonies was done by multiplying the actual colony count with 1×10⁵ because of the part that the saliva sample was diluted one thousand times 1:5 dilution [65,66].
Figure 6: Mitis Salivarius agar media (Becton Dickinson and Difco Company, Chicago, USA), for isolation of S. mutans. .
b) Lactobacillus Acidophilus Count: Second part of saliva sample were incubated on Tomato agar media for isolation of Lactobacilli for 1L of medium dissolve in distilled water [67]. Tomato agar media contains: (Glucose 10.0gm, Yeast extract 5.0gm, Polypeptone 5.0gm, KH2PO4 0.5gm, KCl 0.125gm, CaCl2.2H2O 0.125gm, NaCl 0.125gm, MgSO4.7H2O 0.125gm, MnSO4.4H2O 0.003gm, Bromocresol green 0.03gm, Canned tomato juice 150.0ml). The ingredients were heated to dissolve the components, autoclaved at 121°C for 15 minutes and left to cool. Approximately 20 ml of the medium was poured into each Petri plate and left to solidify at room temperature, then stored in refrigerator at 4°C until used. Plates were incubated within an anaerobic jar containing gas pack in the incubator for 2-4 days at 37°C. Lactobacilli were identified by colonial morphology catalase test and Gram stainingbinding agents (calcium carbonate) that confirmed it [68]. (Figure 7) Colony counting was done with a magnifying glass and the count of S. mutans and Lactobacilli was expressed as the number of colony forming units per milliliter (cfu/ml) of saliva. Semi quantitation of the number of colonies was done by multiplying the actual colony count with 1x10⁵ because of the part that the saliva sample was diluted one thousand times 1:5 dilution [69].
Figure 7: Tomato agar media for isolation of lactobacillus.
Chemical Tests
The 3rd part of collected saliva sample was processed to measure the salivary urea level was measured by U.V. method with (ELI TECH kit) using autoanalyzer system (Advia 1650), salivary alkaline phosphatase level was measured by kinetic method (SERAPAK ® kit) using (Advia 1650, salivary Calcium and phosphorous level by (ELI TECH kit) using micro lab analyzer spictrophoton (Micro lab 300).
a) Salivary pH and Buffering Capacity
Last part of saliva samples used to measure salivary pH by using pH meter [70] (pH 18 Aqua Lytic Co, USA). Buffering capacity is determined by quantitative test using a handheld. This method involves the addition of 0.5ml of saliva to 1.5ml of 5M HCl. Mixture was vigorously shaken. Then stream of Nitrogen was passed through the mixture for 20 minutes to eliminate carbon dioxide from the sample and allowed to stand for 10 min when the final pH is measured [71].
Pilot Study
A pilot study was first conducted to establish intra-examiner reliability. ten children were selected from outpatient dental clinic for that purpose. They were examined using the dental indices (deft, DMFT, GI and PI) and subsequently recorded by the examiner and scored by the same examiner. All the patients were re-examined after 24 h. Kappa values were more than 89% for all indices, indicating good reliability.
Result
Table 5: Shows the mean values, standard deviations and the statistical analysis of for sex and age.
Insignificant differences (p>0.05) NS
Data were checked, entered and analyzed by using SPSS (version 25). Data were presented as mean and Standard Deviation (SD) or quantitative variable. The qualitative data were presented as numbers and percentages and the Chi square test was used for comparison between groups. The quantitative data were presented as mean± standard deviation and the Student t-test was used for comparison between the groups. The following formulae were used in statistical analysis of results at level of significant 0.05. Normality was tested using the Shapiro-Wilk test. (Table 5) shows the characteristics of study participants. No group differences were found in participant age and sex (P > 0.05). Since no statistically significant differences were found between sex and age so that, data were combined for them. Table 6 shows that salivary concentration of Ca, Phosphorous, alkaline and phosphatase which these values did not differ between the two groups (P>0.05). On the other side, the salivary pH, S. mutans and Lactobacillus count were significantly higher in salivary samples obtained from study group (P< 0.001). Additionally, buffering capacity were significantly higher (P < 0.05) in study group. PI were significantly higher in study group (P < 0.05), however, dmft and DMFT were significantly higher in control group (P< 0.001) and GI did not differ between both groups (P>0.05). (Table 7) shows the study group had significantly more enamel hypoplasia (46%) than the control group (6%). The presence of extrinsic stain and intrinsic stain is statically increase in study group (P< 0.05). All ages with the disease duration of less than one year showed no clinical evidence of enamel hypoplasia, and the oldest age group, from 6 to 12 years, showed the highest number of enamel hypoplasia records (eleven patients) (Table 5).
Table 6: Shows the mean values, standard deviations and the statistical analysis of the oral variables using the Student t-test.
Significant differences (P < 0.05) * Highly significant differences (P < 0.001) ** Insignificant differences (p > 0.05) NS
Table 7: Distribution of tooth discoloration and enamel hypoplasia in study and control groups using Chi-square test.
Significant differences (P < 0.05) *
Table 8: Distribution of children in study group with enamel hypoplasia, according to the age of onset and duration of the disease.
Table 9: Daily tooth-brushing frequency (%) and dental check-up frequency in study and control group using Chi-square test.
Insignificant differences (p > 0.05) NS
Discussion
In the present study, the 50 children with ESRD clearly differed from a normal childhood population in most of the dental parameters increase such as enamel hypoplasia, tooth discoloration, S. mutans and lactobacilli counts, salivary pH, salivary urea level and buffer capacity of saliva. However, the chemistry of saliva denoted that there were insignificance differences in salivary Ca, phosphorus and Alkaline phosphatase levels (Table 6). The low caries prevalence which recorded by low dmft, DMFT in CRF children was the most interesting finding of this study, although the patients had poor oral hygiene and were maintained on high-carbohydrate diets that agrees with earlier work [72-74]. Salivary urea elevated salivary pH, possibly negating the effect of any acid formation by these cariogenic bacteria resulting from sugar intake. This mechanism also inhibits caries because of its antibacterial properties and its inhibitory effect on plaque formation. In addition, high salivary phosphate concentrations found in patients with uremia may facilitate remineralization of incipient carious lesions [72]. So that, both the mean dmft and DMFT were significantly lower in the CRF children, which agrees with earlier work [72,73]. The prevalence of the caries was reduced despite poor oral hygiene in uremic children (Table 7). This is most likely because of increasing both salivary urea concentration that raise salivary pH, which may inhibit the growth of S. mutans and lactobacillus. In many reports, there is a positive correlation between dental caries and S. mutans, and lactobacilli counts [74,75]. The total count of S. mutans and lactobacillus, in present study, were significantly decreased in CRF patients than control group that agrees with earlier work [76]. Some other authors [77-79] have reported that, the total count of S. mutans was significantly greater in the control group compared with CRF children and there was no significant difference in number of lactobacilli of either CRF or control group. Our clinical finding revealed that 46% of the patients demonstrated various degrees of enamel defects, compared to Wolff [80] study 47.4%, in the form of hypoplasia. This increase in hypoplasia prevalence was probably due to abnormal calcium and phosphate metabolism. The enamel hypoplasia in CRF patients was significantly increased (P>0.05).
As regards frequency of enamel hypoplasia, in this finding, there was 94% had no hypoplasia, 4% had mild hypoplasia and 2% had moderate hypoplasia in G1 while there was 54% had no hypoplasia, 20% had mild hypoplasia, 20% had moderate hypoplasia and 6% sever hypoplasia in study group. These reports agreed with earlier workers [72,84]. Also, Nunn JH et al. [72] reported that, 83% of their renal patients had enamel defects. Many authors [72,81] stated that, calcium depletion with renal impairment during mineralization of the developing dentition, often resulting in enamel hypoplasia, is a likely sequela. There was an evident correlation between the location on the teeth of hypoplastic changes and the age of onset of severe renal failure, which was like the findings of (Table 8). Koch MJ et al. [82] who investigated the exfoliated primary teeth of CRF or ESRD patients microscopically and showed that enamel hypoplasia was limited to postnatal enamel, and hypoplasia increases with the duration of the disease and the early onset. Tooth discoloration was increased in CRF patients significantly. The stain may be intrinsic or extrinsic (Table 8). Extrinsic stain can be readily removed from the surface of the teeth with an abrasive prophylactic material. As regards frequency of tooth discoloration (%) in present study, there was 90% had not discoloration, 8% had intrinsic discoloration and 2% had extrinsic discoloration in control group while there was 38% had no discoloration, 22% had intrinsic discoloration and 40% had extrinsic discoloration in study group. There were significant differences between both groups as regards all items (P< 0.05). Intrinsic staining is generally a result of adsorption of pathological pigments onto the dentine matrix. Brown discoloration can be seen when uremia is present during development of the dentitions. Intrinsic stains are also seen in some haemodialysis patients resulting from the use of tetracycline to treat infection during the period of calcification of the primary and permanent teeth. Intrinsic stains in our study group were not related to tetracycline use since the patients’ physicians were aware that tetracycline could stain developing teeth and did not prescribe it. Our findings of intrinsic brown staining in 22% of patients may be due to the presence of uremia during the development of the dentitions; this agrees with previous reports [81,84]. The children with CRF were being treated for anemia with ferrous sulfate in syrup form, which caused the black-brown extrinsic staining on the teeth [73]. Although, the mean of Plaque Index score was significantly greater in the CRF children compared with the controls, there was no significant difference in gingival inflammation, which agrees with results of earlier researchers [72,84-86]. The gingiva in individuals with CRF can be pale due to anemia, with possible loss of the demarcation of the mucogingival junction and when there is platelet dysfunction, the gingiva may bleed easily [87-90]. This is attributed to a modified tissue response because of immunocompromised. In addition, anemia is a common problem in patients with CRF and it is possible that gingival inflammation is masked by the paleness of the gingiva. However, another study revealed that, accelerated periodontal disease in patients with renal failure, possibly related to impaired white cell function [91]. Jaffe EC et al. [73] who found that, plaque amounts were similar in both groups, but the gingival status was lower for the ESRD patients. Davidovich et al. [49] reported that, the patients suffering from (ESRF) and those receiving dialysis are more prone to periodontal disease and other oral health problems. The renal failure patients had higher gingival index (GI) and bleeding; probing depths, attachment loss, hypoplasia, obliteration and less caries. It appears that patients with uremia undergoing haemodialysis have a reduced gingival inflammatory response to bacterial dental plaque compared with the controls. As regards daily tooth brushing (%) and periodic dental check-up (%), in present study, there was 90% not perform tooth brushing at all and 10% performing it once daily in control group while there was 88% not perform tooth brushing at all and 12% performing it once daily at least in patients group with insignificant difference in oral health status between both groups (P>0.05). There was 92% not perform periodic dental check-up at all 6% perform it rarely and 4% perform it regularly in control group while there was 96% not perform periodic dental check-up at all, 2% perform it rarely and 2% perform it regularly in study the group with insignificant difference between both groups (P>0.05). It is likely to relation between the patients’ level of education and low socioeconomic status (Table 9). These findings indicate that there is a need for dental health education for all children and their parents.
Conclusion
The proportion of CRF children with dental caries was significantly less than for the matched controls. This is most likely because of a greater salivary urea concentration and high pH and buffering capacity, which may inhibit the growth of S. mutans and lactobacillus. The increased plaque score in both the primary dentition and permanent dentition and gingival changes suggest a need for dental advice and supervision beside the general medical care is needed by these children.
Recommendation
The incorporation of a dental service into the general medical program would benefit these children. Effective tooth brushing from an early age would help to prevent the development of periodontal disease, as adults would also be minimized. Awareness must be raised among CRF patients, their nephrologists and their dentists about the need for primary dental prevention. See the patient for dental check-ups as regularly as would be the case if they were not undergoing dialysis.
Acknowledgement
The authors wish to thank all children, participants and their parents or guardians for their valuable participation in this study. This study was supported clinically by all staff of pediatric department, clinical pathology department and microbiology department of Faculty of Medicine in Zigzag University. We would like to thank Professor Ali MM Abu Zeid, Professor of Pediatric Department Zigzag University and Professor. Samy Y. Elbayoumy, Head of Pedodontic and Dental Public Health Department, Faculty of Dental medicine, Al-Azhar University for their continuous encouragement, cooperation and support. This study was supported by self-fund of authors.
For more Lupine Publishers Open Access Journals Please visit our website:
http://lupinepublishers.us/
For more Open Access Journal on Pediatric Dentistry articles Please Click Here:
https://lupinepublishers.com/pediatric-dentistry-journal/
To Know More About Open Access Publishers Please Click on Lupine Publishers
Follow on Linkedin : https://www.linkedin.com/company/lupinepublishers
Follow on Twitter : https://twitter.com/lupine_online
#Lupinepublishers#Lupine publishers#Lupine Publishers LLC#lupine publishers indexing Journals#LOJ Immunology and Infectious Diaseases
30 notes
·
View notes
Text
Lupine Publishers | Climate Change Adaptation Considerations for Agriculture for North-East Iraq

Lupine Publishers | Agriculture Open Access Journal
Abstract
Analysis of climatic data of the last three decades reveals that there is a noticeable shift in climate and water resources regime of north-east Iraq. Analysis was done on the five major tributaries of Tigris River-Khabur, Greater Zab, Lesser Zab, Al-Adhiam and Diyala rivers. At first glance, the region appears to have plenty of freshwater, but due to high temporal and spatial variability combined with inadequate infrastructure, water scarcity is widespread. Agriculture is the primary user of freshwater, and therefore, any adverse effect on water availability will have far reaching consequences. For forecasting purposes, SWAT model was chosen for simulation and GCM ensembles were used for long-range forecasts. The paper explores how the population are adjusting to the shift in climate regime and what kinds of climate change adaptation measures are socio-culturally viable. The analysis framework featured separation of freshwater availability into blue and green waters, climate forecasts with a lead time of about half-a-century to 2049-2069 and about one-century to 2080-2099, and feedback from grass-root level of the government and focus groups as to how the population are adjusting and likely to adjust in the future to climate change.
Keywords: Climate change; Adaptation; Agriculture; Northeast iraq
Introduction
The north-east Iraq, which includes autonomous Kurdistan, is regarded to have adequate freshwater, but due to high spatial and temporal variability, and accessibility issues owing to lack of proper infrastructure, water scarcity is widespread in the region. Freshwater availability is of critical importance for food security, public health and environment protection in the region, but detailed information on water resources and water scarcity is very limited [1] to address these issues adequately. Adding to the complexity in addressing these issues is the need for conformity of strategies to the social and cultural norms and expectations. Nevertheless, some data exist in disperse and disparate sources, which hitherto have not been used in planning [2], but can be collated for a coherent and thorough assessment of water resources of the region. This study attempted to achieve that objective, and then, explored the implications in social-cultural context. The quantity and quality of water resources in a basin is impacted by a multitude of factors such as precipitation and other meteorological variables, vegetation and other land cover, natural calamities such as hurricanes and earthquakes, and induced catastrophes such as bushfires. Changes in the quantity and quality of water can also occur with changes in population, climate and land use with alteration in supply and demand. Climate change has the potential to impact the hydrological cycle through the alteration of evapo transpiration and precipitation [3]. Changes also can be unprecedented because the water system could be vulnerable to climate change outside the range of historical events [4].
Falkenmark [5] first introduced the concept of blue water and green water. Blue water is water which humans can directly access such as stream flow and groundwater. Green water is water which humans cannot directly access such as evapo transpiration and soil moisture but it is useful for vegetation and agriculture. The blue/ green water notion has provided fresh ideas and new methodologies for water resources management in several regions especially in arid and semi-arid regions where water stress is severe due mainly to increased socioeconomic development and population growth. Blue/green concept can assist in supporting sustainable and equitable water resources management Jansson 1999. In this study SWAT model was chosen to simulate blue/green water due to its popularity, it has been widely used in varied physiographic regions and in various parts of the world [6,7]. SWAT is a physics-based distributed model well recognized for the analysis of the impacts of land management practices on water, sediment, agriculture, and non-point pollution in large complex watersheds [8]. Furthermore, SWAT model is capable of assessing the impacts of climate change on hydrological and biochemical cycles on a long term basis [9]. As is usually done, the impacts of climate change for the long-term has been assessed in this study by making forecasts through General Circulation Models (GCMs).
IPCC in its Fifth Assessment Report envisioned four Representative Concentration Pathways (RCPs) of future greenhouse gas concentrations, which replaces the SRES proposed by IPCC in its Third Assessment Report. For brevity, this study presents results from three RCPs - low (RCP2.6) which assumes sustained net negative anthropogenic GHG emissions after 2070, medium (RCP4.5) which assumes stabilization without overshoot to 4.5 W/m2 radiative forcing after 2100, and high (RCP8.5) which assumes continued anthropogenic GHG emissions. Coupled Model Inter comparison Project 5 (CMIP5) uses a number of sophisticated GCMs for climate forecasts. In this study six GCMs, namely CCSM4, MIROC-ECM, GFDL-CM2.1, MRI-CGCM3, CNRM-CM3, and IPSLCM5A- LR were selected for ensemble climate change projections in north-east Iraq. The projected temperatures and precipitation were downscaled by BCSD method Maurer 2014. After we analysed the historical data and projected future climatic conditions and availability of water resources, we sought feedback from General Managers of Water Authority and focus groups on how the local population are currently adjusting to already manifest climate change, and how they are likely to adjust to the projected climate change in the future. A General Manager in the Ministry of Water Resources heads each basin who is assisted by engineers, technicians and water monitors.
Study Area
Tigris River has five major tributaries namely Khabur, Greater Zab, Lesser Zab, Al-Adhiam and Diyala Rivers (Figure 1). These tributaries are located in the left bank of the Tigris River between latitudes 33.20N and 37.30N and longitudes 42.90E and 46.90E and have significant contributions to Tigris flow. These tributaries are shared between Iraq and Turkey or Iraq and Iran except Al- Adhiam River. The region is mountainous with many springs in the north and east and changes to flat terrain in the south and west. The mountainous areas generally get higher proportion of precipitation with generally typical near-natural nival regime. The characteristics of the basin of each tributary are summarized in Table 1.
Figure 1: Location map of the study area.
Table 1: Description of the basins of the five tributaries of Tigris River.
Impacts of Climate Change
SWAT model was used for hydrologic simulation and GCMs were used for climate forecasts. Basic data requirements for SWAT included digital elevation model (DEM), land use map, soil map, weather data, and discharge data. DEM was extracted from ASTER Global Digital Elevation Model (ASTERGDM) with a 30 meter grid and 1*1 degree tiles (http://gdem.ersdac.jspacesystems.or.jp/ tile_list.jsp). The land cover map was obtained from the European Environment Agency (http://www.eea.europa.eu/data-and-maps/ data/global-land-cover-250m) with a 250 meter grid raster for the year 2000. The soil map was collected from the global soil map of the Food and Agriculture Organization of the United Nations (FAO 1995). Weather data which included daily precipitation, 0.5 hourly precipitations, maximum and minimum temperatures were obtained from the Iraq’s Bureau of Meteorology. Monthly stream flow data were collected from the Iraqi Ministry of Water Resources/National Water Centre. To evaluate the performance of SWAT, the sequential uncertainty fitting algorithm application (SUFI-2) embedded in the SWAT-CUP package [10] was used. Figure 2 captures the decade wise changes in precipitation for the past three decades. It is evident from the figures that water availability is decreasing with time. This study considers the period 1980- 2010 as the baseline period for comparisons with future scenarios. Figure 3 captures the changes which are expected in the future from GCM outputs fed into SWAT - outputs from SWAT consisting of 320 HRUs for simulation.
Figure 2: Spatial distribution of precipitation in Northeast Iraq.
Figure 3: The impacts of climate change on the precipitation of the five basins (a) Anomaly based on scenario RCP 2.6 for the period 2049-2069, (b) Anomaly based on RCP 2.6 for 2080-2099, © Anomaly based on RCP 4.5 for 2049-2069, (d) Anomaly based on RCP 4.5 for 2080�2099, (e) Anomaly based on RCP 8.5 for 2049-2069, and (f) Anomaly based on RCP 8.5 for 2080-2099.
Climate Change Adaptation
Although climate change is a physical process linking with alterations in climatic variables, it impacts and also is impacted by social processes associated with the way society evolves over time. Climate change has impacts on social, economic, and environmental systems and forms scenarios for food, water, and health security [11]. The capability of mitigating and adapting to climate change influences is dependent on proactive measures adopted by different socioeconomic groups living in differentiated geographical circumstances [12]. Climate change intensifies the vulnerability of the society. It leads to enhanced water scarcity, exposure to diseases and undermining of growth opportunities. The impacts of climate change in northeast of Iraq will vary geographically. The south part which includes Diyala and Al-Adhiam are projected to be most impacted by droughts and shortened growing seasons. Extreme droughts have categorized that region in the last three decades. Severe drought has caused a reduction in agricultural production especially in the areas of rain-fed crop, which resulted in an observed reduction in farmers’ income. The social dimension, which influences physical and economic dimensions, mainly boosts vulnerability to climate change. In light of the sharp decline in oil prices and the increase in terrorist operations which have led to the deterioration of the economy, institutional structures, and individual capabilities Iraq is unable to manage the current climate variability and will struggle with projected changes due to insufficient financial resources available for adaptation and mitigation.
Vulnerability in the context of climate change has three components which are exposure, sensitivity and adaptive capacity [13]. For example, agricultural vulnerability to climate change can be described in terms of exposure to increased temperatures, decreased rainfall and thus reduction in water resources. The sensitivity of crop yields can be described through how sensitive the crops are to these changes. Adaptive capacity is defined as the ability of the farmers to adapt to the effects of this exposure and sensitivity by, for example, growing crop varieties that are more drought-resistant. Recent studies stress the significance of socioeconomic factors for the adaptive capacity of a system, especially underlining the essential role of institutions, governance and management in determining the ability to adapt to climate change [14]. The adaptive capacity of any system is fundamentally shaped by human actions and, it influences both the biophysical and social elements of a system. Generally, agricultural adaptation includes two forms of amendments in agricultural production systems. The first strategy is enhanced agricultural diversification through, for example, using drought tolerant varieties to temperature stresses. The second strategy emphasizes crop management practices, for instance, managing critical crop growth stages by not coinciding with very harsh climatic conditions such as mid-season droughts. According to Orindi [15], shifting the length of the growing period and changing planting and harvesting dates are among the common crop management practices that are used in agricultural adaptation to climate change.
For this study, focus groups of farmers were formed organized by general managers of each catchment. The discussion thread centred on farmers’ perception of climate change and the adaptation measures they already have or would take to respond to the negative impacts of climate change. From their answers it became evident that planting trees, crop diversification, changing planting dates, and soil conservation are the major adaptation strategies that farmers recognize as appropriate for rain-fed agriculture. Planting trees - This strategy includes growing trees in the farm to serve as shade against severe temperature. Growing trees and a forestation enhance agricultural productivity, where it often contributes to climate change mitigation through enhanced carbon sequestration [16]. Crop diversification - Farmers grow different crop varieties that have ability to survive in adverse climatic conditions. In addition, growers plant early ripening crop varieties and grow drought tolerant crops and crops that are resistant to temperature stresses. These are significant forms of insurance against rainfall fluctuations [15]. Furthermore, planting diverse crop varieties in the same field or various plots with different crops moderates the risk of whole crop failure because different crops are influenced differently by climate events and thereby gives some minimum assured returns for livelihood security [17,18].
Changing planting dates - Early and late planting is another strategy to adapt to climate change. This strategy enables farmers to protect sensitive growth stages to ensure that these critical stages do not coincide with severe climatic conditions. Soil conservation - Soil conservation practices are to increase productivity on-farm [19-23]. Decreasing rainfall and increasing prolonged periods of drought, due to climate change, are highly likely to reduce crops. Increasing soil health and fertility leads to increase crop productivity, thus serve to moderate the impact of climate change on agricultural productivity [24,25].
Conclusion
Northeast Iraq has witnessed declining water availability in the past few decades and the model predictions are that the situation will get worse in the future. These findings may have far reaching consequences because a large area already suffers from per capita water scarcity. Already a majority of the farmers in the focus groups have observed that the climate has become hotter and drier, and the availability of water has decreased significantly especially in the southern region. This fits with the mathematical model inferences. The good part is that most farmers are willing to adopt modern methods to deal with climate change. A common theme that emanated from the focus groups is that a large proportion of farmers are poor and they cannot sustain consecutive crop losses or very low yields. Some of them have quit farming and have moved into or seeking alternative livelihood. For the stability of the social fabric, it is desirable to entice those people back into farming and for that to happen, financial support would be necessary. However, a large portion of the population is Muslim, and therefore preferably, finance source, destination and transaction process should be free from interest (riba), gambling (maysir), uncertainty (gharar), coercion (ikrah), and forbidden (haram) - directives of Islamic law.
https://lupinepublishers.com/agriculture-journal/pdf/CIACR.MS.ID.000143.pdf
For more Lupine Publishers Open Access Journals Please visit our website: https://lupinepublishersgroup.com/
For more Agriculture Open Access Journal articles Please Click
Here: https://www.lupinepublishers.com/agriculture-journal/
To Know More About Open Access Publishers Please Click on Lupine publishers
Follow on Linkedin : https://www.linkedin.com/company/lupinepublishers
#Lupinepublishers#Lupine Publishers LLC#Lupine publishers#lupine publishers indexing Journals#LOJ Immunology and Infectious Diaseases
34 notes
·
View notes
Text
Lupine Publishers | Fertilizer Effects on Nutrient Elements, Total Polyphenols and Anti-oxidant Contents of Roselle (Hibiscus sabdariffa) Leaves

Lupine Publishers | Agriculture Open Access Journal
Abstract
A great deal of research has been geared toward the calyces of roselle due to their medicinal properties. Though leaves of roselle have been consumed by diversed ethnic groups, little research efforts have been focused on leaves due to unestablished beneficial bioactivities. This paper provides preliminary data on the effect of various types and rates of fertilizer on fresh fruit yields, total polyphenol and antioxidant contents of the leaves of roselle (Senegal accession). Fertilizer applications at planting time had nonsignificant increasing effect on fresh fruit yield/plant and non-significant reduction in total polyphenol and antioxidant contents of the leaves. Inconsistent effects of applied fertilizer on macro and micro nutrient contents of the leaves were observed. In general, N, P, K, Ca, Mg, S, B, Mn and Zn were significantly (P<0.05) increased by selective fertilizer types and rates while Cu and Fe contents were not significantly affected by fertilization. Further studies on fertilization along with increased frequencies of application are needed to validate these findings.
Keywords: Roselle; Hibiscus sabdariffa; Fertilizer; Phenols; Antioxidants and fruit yield
Introduction
More than 300 species of Hibiscus species (Malvacea family) can be found growing in both tropical and subtropical regions of the world [1]. Roselle, Hibiscus sabdariffa L., is only one of the hibiscus species that has its sepals of the flower developed into a swollen red calyx enclosing the mature fruit at maturity. The calyces are found to be rich in nutrients and photochemical compounds that exhibits anti-oxidant activities Consequently, economic interests have been mainly focused on roselle calyces which are used worldwide in the production of herbal tea, cold refreshing drinks, jellies, jam, sauces, chutneys, wines, preserves and food colorants (D'Heureux-Calix and Badrie, 2004). Because of the folk’s medicinal uses, a great deal of research has been geared toward roselle calyces. Most research has been heavily directed toward the studies of phytochemistry, anti-oxidant properties and effects of calyx extracts on anti-oxidant activities, and other bioactivities such as anti-inflammatory action, anti-microbial, and antitumor activities [2] and Wang 2015. Even though leaves are widely consumed by a diverse population of ethnic groups, particularly in tropical regions of Africa, little research effort has been focused on leaves. In recent studies [2], roselle leaves are found to be a good source of phenolic acids and flavonoids that exhibit anti-oxidant activities. The purpose of this preliminary study is to evaluate the effect of various types and rates of fertilizer application on roselle fruit yield, nutritional, phenolic and antioxidant content of the leaves.
Materials and Methods
Chemicals and reagents
ABTS (2,2’-azino-bis (3-ethylbenzothiazoline-6-sufonic acid), potassium persulfate were purchased from Sigma-Aldrich of St. Louis, MO, USA. Folin Ciocalteu’s phenol reagent was purchased from MP Biomedicals of Solon, OH, USA. Water and methanol were purchased from Fisher Scientific of Fair Lawn, BJ, USA.
Experiment and plant samples
A field experiment was conducted to evaluate the effects of the applied fertilizers at planting time on roselle plants of Senegal accession during the 2014 growing season at Southern University’s research farm, Baton Rouge, Louisiana which has a subtropical climate (30.5240N and 91.1900W and elevation of 22m). The area has an average precipitation of 1700mm and the average annual temperature is 19.70C. The field has a silty clay loam soil with a pH of 7.1. The seeds of Senegal accession were planted in the 2x2 cell-pack trays in the greenhouse at the beginning of April, 2014. Seedlings were hand-transplanted into the field one month after germination. A completely randomized design with a total nine applications as treatments. These treatments were the control; 3, 6 and 9# (lb=454g)/30.48m. of organic fertilizer 4-2-2, respectively; 3, 6 and 9# (454g)/30.48m of organic fertilizer 8-5-5, respectively; and 3 and 6# (lb=454g)/30.48 m. of inorganic fertilizer 13-13-13, respectively. Each treatment consisted of 16 plants spaced at 6 feet (1.83m) between plants within a 3.5ft (1.07m) row. Between row spacing was 8 feet (2.44m.). Fertilizers were applied and incorporated on top of the raised bed. Seedlings were planted one day after fertilizer applications. Leaves were randomly collected in late July from branches at waist height from 10 plants of each treatment.
Nutrient elemental analysis
Leaves in the brown paper bags were dried at 500C in the Precision Thelco Laboratory oven for 8 hours in the oven and then ground using Thomas-Wiley Model 4 grinder with a 30 mesh screen. The ground samples in the vials were subject to one-hour of drying before they were stored in the desiccator to prevent moisture contamination. Three individual 0.5g of composite ground leaf samples from each treatment were placed in 50mL Digi-tubes (SCP Sciences) and were digested using DEENA automatic digester. Each digested sample in the Digi tube was brought up to a total volume of 20mL with distilled water. The solution with digested sample was vacuum-filtered with a 1.0 micron Digi-filter. The filtrate was analyzed by SPECTRO ARCOS ICAP for Al, Bo, Ca, Cu, Fe, Mg, Mn, Mo, P, K, NA, S and Zn. Separately, 0.15g of dried leaf sample was used for determining the amount of carbon and nitrogen using LECO CN Analyzer.
Sample preparation for total phenol and antioxidant activity determination
The method of sample preparation was adopted from Xu [3] and Zhen [2]. A 100mg of each dried and ground leaf sample was measured and placed in a volumetric flask. Twenty-five mL of 70% (v/v) methanol/water with 0.1% acetic solution was added into the flask. The sample extraction was then put in ultrasonic water bath for 10 minutes followed by shaking at room temperature for overnight. The extract of each sample was then filtered through 0.45um filter. The filtrate was used for the Folin-Ciocalteu and ABTS radical scavenging assays.
Phenolic content determination (Folin-Ciocalteu assay)
The Folin-Ciocalteu assay with modifications [4] used by Zhen [2] was adopted for the determination of the total phenolic content of the leaves. 40ul of the prepared leaf extract was mixed with 900ul diluted Folin Ciocalteu’s reagent followed by incubation at room temperature for 5 minutes. Then, 400ml of 15% sodium carbonate was added. The mixture was allowed to react at room temperature for 45 minutes. The UV absorption of the mixture solution at wavelength of 752nm was measured against a blank solution. The standard curve was measured based on the prepared gallic acid standard solution (0.38, 0.19, 0.095 and 0.475mg/ml). The result was transformed as mg/g of gallic acid. The results were calculated from the mean of three replicates.
In vitro antioxidant activity (ABTS radical scavenging assay)
The procedure of the decolonization of the ABTS radical cation [5] used by Zhen [2] was adopted for the determination of antioxidant activity. 38.4 mg of ABTS and 6.6 mg of potassium per sulfate were co-dissolved in 10ml of water and stored for 16 hours in the dark environment to form stable radical action (ABTS+). The stored radical solution was then diluted using ethanol to a concentration with UV absorption of 0.70+/-0.20 at734nm. 900ul of the diluted ABTS radical working solution was mixed with 10ul of the leaf extract followed by 20 minutes of reaction at room temperature. The decolonization of the mixed solution indicates that antioxidant compounds in the extract quenched ABTS radical actions. There was a quantitative relationship between the reduction absorbance at 734nm and the concentration antioxidants present in the sample [2]. The standard curve was built up by plotting the concentrations of Trolox against the percentage of inhibition. The value of antioxidant capacity of the sample was calculated as Trolox equivalent antioxidant capacity. The final result was expressed as the % of antioxidant per dry weight basing on the calculation from the mean of three replicates.
Results and Discussion
Figure 1 shows the effects of the type of fertilizer and its rate on fresh fruit yield/plant. There was a trend to indicate that applied fertilizers increased fresh fruit yield of roselle of Senegal accession under this study. However, the yield increases were observed to be non-significant. Since all fertilizers were applied at the planting time in spring, the effect of fertilization might have faded away during the late summer and early fall during which fruits were produced. This fading effect of applied fertilizers can be supported by various extension publications indicating the recommended side-dressing of fertilizers are needed for various vegetable crops during the growth period [6-8]. Figure 2 shows the effects of the type and rate of fertilizer applied at planting time on the total polyphenol and antioxidant content of roselle leaves in % of dry weight. There appeared to have a trend that increased amounts and rates of fertilizer exhibited a reduction in total polyphenol content. The reduction in polyphenol content might be due to less nutritional stress by plants receiving increased amount of fertilizer. It is hypothesized here that further application of fertilizers to enhance plant growth and yield may cause significant reduction in polyphenol production. It had been reported that plants under stress provided more antioxidants in response to stresses [9-12].
Figure 1: Effects of the type and rate of fertilizer applied at planting time on fresh roselle fruit yield in kg/plant. Note: # is denoted as lb. (454 g) of fertilizer applied per 100 feet (30.48 m) row.
Figure 2: Effects of the type and rate of fertilizer applied at planting time on total polyphenol and antioxidant contents of roselle leaves in % of sample dry weight. Note: # is denoted as lb. (454 g) of fertilizer applied per 100 feet (30.48 m) row.
Figure 3 shows the effects of the type and rate of fertilizer applied at planting time on (A) macro-nutrients and (B) micro-nutrients of roselle leaves. The results when the effects were compared to that of the Control treatment, showed that (a) 3# of organic fertilizer 4-2-2 and 3#, 6# and 9# of organic fertilizer significantly (P<0.05) increased N content of the leaves, (b) all fertilizer treatments had no significant effect on P content of the leaves, © 9# of organic fertilizer 4-2-2 significantly (P<0.05) increased K content of the leaves, (d) all fertilizer treatments had no significant effect on Ca content of the leaves, (e) 9# of organic fertilizer 4-2-2 , 6# and 9# of organic fertilizer 8-5-5 significantly (P<0.05) increased Mg content of the leaves, (f) 3#, 6# and 9# of organic fertilizer and 6# of inorganic fertilizer 13-13-13 significantly (P<0.05) increased S content of the leaves, (g) all fertilizer treatments had no significant effect on Cu and Fe contents of the leaves, (h) 3# and 6# of organic fertilizer significantly (P<0.05) increased B content of the leaves, (i) 3# and 9# of organic fertilizer 4-2-2, 9# of organic fertilizer 8-5-5 and 3# and 6# of inorganic fertilizer 13-13-13 significantly increased Mn content of the leaves and (j) 9# of organic fertilizer 4-2-2, 3#, 6# and 9# of organic fertilizer 8-5-5 and 6# of inorganic fertilizer significantly increased Zn content of the leaves. The results of this study showed inconsistent in nutrient elemental contents of plants in response to fertilizer treatments. In general, N, P, K, Ca, Mg, S, B, Mn, and Zn were significantly increased by selective fertilizer types and rates while Cu and Fe were not significantly affected by the fertilizer applications.
Figure 3: Effects of the type and rate of fertilizer applied at planting time on (A) macro-nutrients and (B) micro-nutrients of roselle leaves. Note: # is denoted as lb. (454 g) of fertilizer applied per 100 feet (30.48 m) row. Macro-nutrients are expressed in % of dry weight while micro-nutrients are expressed in PPM in dry weight.
Conclusion
Fertilizer applications at planting time enhanced many macro and micro nutrient elemental contents of roselle leaves but did not adequately affect fresh fruit yield, leaf total phenol and anti-oxidant contents. Reviewed literature provides evidence a significant increase in fruit yield can be obtained through an increase in fertilizer application as side-dressing. Evidence provided by literatures also suggests that an increase in fertilizer applications which reduce nutritional stress can also possibly reduce polyphenol content and antioxidant activity of roselle. Inconsistent results of this study suggest that further studies on the effect of fertilizer and the frequency of fertilizer application are needed to validate the results of these findings and conclusion
https://lupinepublishers.com/agriculture-journal/pdf/CIACR.MS.ID.000142.pdf
For more Lupine Publishers Open Access Journals Please visit our website: https://lupinepublishersgroup.com/
For more Agriculture Open Access Journal articles Please Click
Here: https://www.lupinepublishers.com/agriculture-journal/
To Know More About Open Access Publishers Please Click on Lupine publishers
Follow on Linkedin : https://www.linkedin.com/company/lupinepublishers
31 notes
·
View notes
Text
Chemical Contaminants in Food Grains: The Burning Health Issues in Asian Countries
Lupine Publishers- Environmental and Soil Science Journal

Abstract
Food security is a high-priority issue for sustainable global development both quantitatively and qualitatively. Once pesticides are applied, residues may be found in soil, on plant, on harvested product, on application equipment, in water and irrigation canals, in pesticide storage area, on cloth of applicant. Short term poisoning effects like nausea, vomiting, headache, chest pain, eye, skin and throat irritation etc. and potential long-term health effect like allergies, cancer, nervous system damage, birth defects, reproductive problem have been reported in recent decades, adverse effects of unexpected contaminants on crop quality have threatened both food security and human health. Heavy metals, metalloids (e.g., Hg, As, Pb, Cd, and Cr) from pesticides and fertilizers can jeopardize human metabolomics, contributing to morbidity and even mortality. Those during crop production include soil nutrient depletion, water depletion, soil and water contamination, and pest resistance/outbreaks and the emergence of new pests and diseases.
Discussion
Growth in global population means that farmers must produce food for an estimated 9.1 billion people expected to inhabit the earth by 2050 [1]. Humans cultivate only about 150 of an estimated 50,000 edible plant species worldwide, with only 30 plant species comprising the vast majority of our diets. Just three of these (rice, maize and wheat) provide about 60% of the world’s food energy intake [2,3]. These plants are susceptible to 80,000 to 100,000 diseases caused by everything from viruses to bacteria, fungi, algae, and even other higher plants [4]. Again, Food plants have to compete with some 30,000 different species of weeds worldwide, of which at least 1800 species are capable of causing serious economic losses [5]. Globally, around 20-30% of agricultural produce is lost annually due to insect pests, diseases, weeds and rodents, viz, growth, harvest, and storage [1,6]. According to World Bank, South Asian countries are home to home to 33% of the world’s poor and economies have among the highest levels of public debt in the world [7]. Mean consumption of whole grains 38.4 g/day in between 1990 to 2010. Southeast Asian nations along with 2/3 Sub- Saharan African regions had the highest intakes. Overall, 23 of 187 countries had mean whole grain intake ≥2.5 (50g) servings/day, representing 335 million adults and 7.6% of the world adult population [8]. Southeast Asia is a region that produces high amounts of key food commodities and includes areas of divergent socio-economic status. The major grain crops produced in the region are rice and maize [9]. The potential sources for the contamination of grains are mostly environmentally based and include air, dust, soil, water, insects, rodents, birds, animals, microbes, humans, storage and shipping containers, handling and processing equipment [10]. The rates of destruction often are higher in less developed nations and they are now accounting for a quarter of the world’s pesticide use [5,11]. Therefore, judicious use of pesticides plays a major role in plant protection. Today’s more than 10,400 pesticides are approved worldwide. It has been reported that the consumption of pesticides accounts two million tons every year worldwide [12]. Interestingly, many pesticides still widely used in the USA, at the level of tens to hundreds of millions of pounds annually, have been banned or are being phased out in the EU, China and Brazil [13]. Pesticide residues reported in fruits, vegetables and grains of India [14], Nepal [15], Bangladesh [16], China [17] and Indonesia [18]. Farmers habitually apply fertilizers and hazardous insecticides in high quantities without assessing the actual field requirements due to inadequate knowledge [1,19]. Since pesticides are directly applied on crops, fruits, and vegetables in most agricultural applications, infants, children, and adults can be exposed to pesticides by the ingestion of those pesticide-contaminated foods [20-23]. Pesticides can exist in residential air by the evaporation of volatile and semivolatile pesticides, such as organochlorine pesticides, from crops and residential surface soil [24-27]. Soil is an important source for heavy metals (like mercury/cadmium) in crops and vegetables since the plants’ roots can absorb these pollutants from soil, and transfer them to seeds [28,29]. According Retamal-Salgado et al. 2017 cadmium (Cd) distribution in the different plant organs, more than 40% of Cd is absorbed and translocated to the aerial part of the plant (grain and straw), and it could be directly (grains) or indirectly (animals) ingested and negatively affect humans [30]. It accumulates in the liver and kidneys for more than 30 years and causes health problems. Toxicity of this metal involves kidney and skeletal organs and is largely the result of interactions between Cd and essential metals, such as calcium [31-35]. China feeds 22% of the world population with 7% of the worlds arable land. Sodango et al. 2018 reported that 20 million hectares (approximately 16.1%) of the total arable land in China is highly polluted with heavy metals, according to Ministry of Environmental Protection (MEP), China [36]. It is estimated that between 900,000 and 1,360,000 kg arsenic per year was introduced into Bangladesh soil through contaminated groundwater used for irrigation [37]. The use of sewage sludge for agricultural purposes can be limited by the potential content of heavy metals and toxic organic compounds that pose a threat to the environment [38]. Pajewska-Szmyt et al. 2019 reported that maternal exposure to heavy metals as Pb or Hg and persistent organic pollutants were associated with children neurodevelopment delay and also indirectly affects reproductive, respiratory, and endocrine system [39]. The use of pesticides has helped to increase rice yields but has also led to an increased pollution that presents a potential toxicity threat to the environment and public health [40]. Combined with outdated waste management technologies, there are potential health risks to farmers through occupational waste management practices, along with consumers through consumption of waste-contaminated products [41]. The WHO has estimated that more than three million farmers in developing countries are poisoned by agrochemicals each year [42]. In another study, WHO) and UN Environmental Program estimated that one to five million cases of pesticide poisoning occur among agricultural workers each year with about 20000 fatalities [43]. Skin injury, eye injury, headache, stomachache, and fever reported in cotton workers in southern Pakistan due to pesticide exposure [44]. Pesticide induced occupational hazards has been reported to many other similar studies in Nepal [45], China [46-48], India [49-51], Bangladesh [52], Sri Lanka [53], Myanmar [54] and Philippines [55]. The US Centre for Disease Control and Prevention confirmed more than 11,000 foodborne infections in the year 2013, with several agents like viruses, bacteria, toxins, parasites, metals, and other chemicals causing food contamination [56]. Widespread agricultural use of pesticides and home storage make them easily available for acts of self-harm in many rural households. Stability of organophosphorus pesticides are also important issue [57]. It was found that malathion was more unstable than dichlorvos and diazinon, there was an over 70% loss in 90 days even at -20 °C in coarsely chopped form [58]. It could be another reason for haphazard use of pesticides in the field and stored food commodities [59]. Around 600 million food borne illnesses and 420,000 deaths occur each year due to poor food handling practice. Such contaminants get access to contaminate food mainly due to food handler’s poor knowledge and negligence during handling activities [60,61]. Hassan et al. says increased prevalence of diabetes in South Asia may be related to the consumption of arsenic contaminated rice depending on its content in the rice and daily amount consumed [62]. Sabir et al. demonstarted that arsenite can bind covalently with sulfhydryl groups in insulin molecules and receptors, enzymes such as pyruvate dehydrogenase and alpha ketoglutarate dehydrogenase, and glucose transporters (GLU-T), which may result in insulin resistance [63]. According to Kumar et al. 50%-60% cereal grains can be lost during the storage stage due only to the lack of technical inefficiency. Use of scientific storage methods can reduce these losses to as low as 1%-2% [64]. Factors like increasing climatic variability, extreme weather events, and rising temperatures pose new challenges for ensuring food and nutrition security in Asian region. The South Asian region is one of the least integrated regions according to Washington based-IFPRI [65]. Agriculturally beneficial microorganisms may also contribute directly (i.e., biological N2 fixation, P solubilization, and phytohormone production, etc.) or indirectly (i.e., antimicrobial compounds biosynthesis and elicitation of induced systemic resistance, etc.) to crop improvement and fertilizers efficiency [66]. Overuse of chemical fertilizers and pesticides have effects on the soil organisms that are similar to human overuse of antibiotics. Indiscriminate use of chemicals might work for a few years, but after a while, there aren’t enough beneficial soil organisms to hold onto the nutrients [67]. Also, resistance to certain pesticides against brown planthopper (BPH), Nilaparvata lugens, and the white-backed planthoppers (WBPH), Sogatella furcifera reported in Asian countries has been reported [68-72]. Also, the higher exposure of crop plants to heavy metal stress reduces growth and yield and affect the sustainability of agricultural production [73]. Cadmium (Cd) is a well-known metal imposing threats to human health, and it can be accumulated in polished rice over the permitted range of 0.2mg kg1 [74]. It leads to reduction in the plant productivities as well by inhibiting their growth, photosynthesis, pigments, nutrient uptake, germination, electron transport chain [75]. Applications of phosphorusbased fertilizers improve the soil fertility and agriculture yield but at the same time concerns over a number of factors that lead to environmental damage need to be addressed properly [76]. Easy availability of pesticides has another interesting but pathetic outcome. approximately 110,000 pesticide self-poisoning deaths each year from 2010 to 2014, comprising some 14% of all global suicides [77]. According to Serrano-Medina et al. higher rates of suicide committed in areas with intensive use of pesticides compared to areas with less use of pesticides [78]. In Bangladesh, selfpoisoning by pesticide is responsible for about 40% of poisoning cases admitted to hospital and 8-10% of overall mortality in medical wards [79]. At the Philippine General Hospital in Metro Manila, Philippines (2000- 2001), recorded pesticide poisoning cases showed that more than 80% were intentional in nature [80]. Public concern about the adverse environmental and human health impacts of organochlorine contaminants led to strict regulations on their use in developed nations since 1940 [81]. Nevertheless, DDT and several other organochlorine insecticides are still being used for agriculture and public health programs in developing countries in Asia and the South Pacific [82-86]. As a consequence, humans in this region are exposed to greater dietary levels of organochlorines (Figure 1).
Recommendations
Around 600 million food borne illnesses and 420,000 deaths occur each year due to poor food handling practice. Such contaminants get access to contaminate food mainly due to food handler’s poor knowledge and negligence during handling activities [87,88]. Accordingly, alternative methods for exposure and risk assessment have to be developed, which vary from the use of expert opinion and pre-marketing models to the use of combination of data from the literature, measurements, and expert opinion [89]. Many studies are there to overcome fertilizer/pesticide induced health effects. Rastogi et al. reported use of silicone nanoparticles can provide green and eco-friendly alternatives to various chemical fertilizers without harming nature [90]. It has been reported that selenium (Se) application decreases Cd uptake [75]. In similar studies, selenium, copper, zinc oxide and many other metallic nanoparticles [91-97] have been studied in food processing, packaging and preservation against phytopathogens and rodents. The washing with water or soaking in solutions of salt and some chemicals e.g. chlorine, chlorine dioxide, hydrogen peroxide, ozone, acetic acid, hydroxy peracetic acid, iprodione and detergents are reported to be highly effective in reducing the level of pesticides [98]. Various foodprocessing operations include sorting, trimming, cleaning, cooking, baking, frying, roasting, flaking, and extrusion that have variable effects on mycotoxins [99]. Cooking rice in excess water efficiently reduces the amount of arsenic (As) in the cooked grain [100].
For more Lupine Publishers Open Access Journals Please visit our website:
https://lupinepublishers.us/
For more Open Access Environment Journal articles Please Click Here:
https://lupinepublishers.com/environmental-soil-science-journal/index.php
To Know More About Open Access Publishers Please Click on Lupine Publishers
Follow on Linkedin : https://www.linkedin.com/company/lupinepublishers
Follow on Twitter : https://twitter.com/lupine_online
32 notes
·
View notes
Text
For more Lupine Publishers Open Access Journals Please visit our website:https://lupinepublishersgroup.com/ For more open access journal of Immunology & Infectious Diseases articles Please Click Here:https://lupinepublishers.com/immunology-Infectious-disease-journal/ To Know More About Open Access Publishers Please Click on Lupine PublishersLupine Publishers | Does there is Relevancy between Falooda Ice Cream loving and Urine Nitrites?

Lupine Publishers | LOJ Immunology and Infectious Diseases
Abstract
Naturally source of nitrites are vegetables like cabbage, spinach and vegetables, it is form of nitrogen. High levels of nitrites in urine is sign of urinary tract infection. Some bacteria are responsible for urinary tract infection such as proteus and klebsiella, but doctor also prescribed some antibiotics against bacteria. Women are more suffering in urine tract infection than men. Positive test for nitrites is called nitrituria. For measuring the levels of nitrites in urine urinalysis is done. Falooda ice cream looking beautiful with different layers that make it healthy drink but a few of people try to avoid by eating it because it contains high levels of sugar.
Keywords: Nitrites; E. Coli; Antibiotics; Urethra; Diabetes; Urinary tract infection
Introduction
Nitrites is form of nitrogen, which contains two oxygen atoms. Nitrites is naturally found in vegetables like cabbage, celery, carrot and spinach. The presence of nitrites in urine may be harmful mean sign of urinary tract infection. The presence of nitrites in urine is due to bacterial infection in urinary tract. Urinary tract infection can occur in urethra, kidneys, ureters and bladder. Some bacteria have ability to convert the nitrates into nitrites due to presence of specific enzyme. The presence of nitrites in urine can be diagnosed with urinalysis test. The bacteria that are responsible for urinary tract infection, proteus, klebsiella, pseudomonas. But most common bacteria are E. coli in which urease enzyme is present that acidifies the urine. The symptoms of urinary tract infection include blood in urine, cloudy urine, strong smelling urine and burning with urination. Urinary tract infection is most common in pregnant women and may be dangerous. Urinary tract infection can cause premature delivery, headache, abdominal pain and high blood pressure in pregnant women if left untreated. If test for the nitrites in urine is positive it is called nitrituria. While negative nitrites test happens with dilute urine or low colony forming unit. A urinary tract infection is most common in women aged 20 to 50 years than man. There are many ways that one can prevents from nitrites in urine or urinary tract infection. Such as by drinking plenty of water bacteria can be flash out that is present in urinary system. Cranberry juice and apple cider vinegar also treat the urinary tract infection. Doctor also prescribed some medication for the treatment of nitrites in urine. Doctor prescribed antibiotics on the basis of what kind of bacteria cause infection. Patient should also take enough sleep and adopt personal hygiene. There are many drinks and foods that keep the body cool and fresh, similarly falooda ice cream is one of the most popular drink that sweet in taste and delicious. Falooda ice cream is a rich source of energy, one glass contains 218 calories. This is sweet dish that served to the people during hot days. This is made in tall glass which give beautiful appearance. The main ingredients of falooda ice cream sabja or basil seeds and semeia that is good for skin and hair have cooling properties. Other ingredients that are present in it like cream, milk, falooda, rooh afza and sugar. Sabja seeds help in weight loss and lowering the high blood pressure. Falooda ice cream has many health benefits, it provides energy to the body, keep body cool during hot days. There are many flavours of falooda ice cream like rabdi, rose syrup, royal, and kesar. People can make it at home easily. First, soaked basil seeds, dry them also soaked semeia seeds, boiled milk. Put them into blender and blend them. Then pour into tall glass add dry fruits, falooda, Almonds, ice cream and rooh afza and served it. If you want energy, then drink cold and sweet falooda ice cream because it contains vitamin and minerals due to presence of dairy products. People should drink or eat it 3 to 4 times per day. But patients of diabetes should avoid it because it contains too much glucose or sugar and cause heart disease and diabetes. The objective of present study was to correlate the falooda ice cream with urine nitrites [1,2].
Materials and Methods
For measuring the levels of nitrites in urine urinalysis is done. First of all, person will need an empty and clean plastic container so that filled it with fresh sample of urine. A strip and gloves are also required. By wearing the gloves dipped the new strip into container and stirred it into urine sample for 2 seconds. The colour of strip will change than before as it will dip into container. Draw out strip from the sample so that measured the levels of nitrites into urine. In the last discard the gloves, strip and container [3-6].
Project Design
There were 100 subjects who completed this survey, but main goal of this survey was asked to the students of Baha Uddin Zakariya university about falooda ice cream loving. Mostly students said that by eating falooda ice cream one can prevent from the hypertension and get too much energy. But the subjects who disagreed it said, that falooda ice cream lead to obesity and cardiovascular diseases (Table 1) [7].
Table 1: Relation between falooda ice cream and urine nitrites to the people that love falooda ice cream.
Table 2: Relation between falooda ice cream and urine nitrites to the people that do not love falooda ice cream.
This table shows males that have negative value of nitrites in their urine are 27% which are falooda ice cream loving and those who have positive value of nitrites are 13 % which are also falooda ice cream lover. Similarly, females having negative value are 22% and females with positive value are 8% which like the falooda ice cream. About the opinions of these males and female’s preparation of falooda ice cream is very easy and not cost expensive dish having many ingredients that prevent us from different diseases (Table 2).
This table shows that males with negative values are 17% and with positive values are only 4 % All of these males are not loving the falooda ice cream. Similarly, females having negative values are 6 %which are not like falooda ice cream. While females having positive value of nitrites in their urine are just 3% which are not loving falooda ice cream [8-10].
Conclusion
This was concluded that there is no relevancy between urine nitrites and falooda ice cream loving.
https://lupinepublishers.com/immunology-Infectious-disease-journal/fulltext/does-there-is-relevancy-between-falooda-ice-cream.ID.000105.php
For more Lupine Publishers Open Access Journals Please visit our website:
https://lupinepublishersgroup.com/
For more open access journal of Immunology & Infectious Diseases articles Please Click Here:
https://lupinepublishers.com/immunology-Infectious-disease-journal/
To Know More About Open Access Publishers Please Click on Lupine Publishers
Follow on Linkedin : https://www.linkedin.com/company/lupinepublishers
Follow on Twitter : https://twitter.com/lupine_online
#Lupinepublishers#Lupine Publishers LLC#Lupine Publishers Group#Immunology#lupine publishers indexing Journals
0 notes
Text
Focusing on Food Security or Targeting the Economy: A Study on Maize and Cotton Production in Kandi Commune

Lupine Publishers- Environmental and Soil Science Journal
Abstract
Maize and cotton are two crops that are highly produced in North Benin. Their production has advantages as well as constraints. These advantages and constraints are taken into account in the choice of the producer to cultivate one of them. The objective of this study is to present, at first, the advantages and constraints that the producers of Kandi commune face on these two crops. It also aims to expose the producers’ preference according to the advantages and constraints listed by them. To achieve this, the data were collected in two districts of the municipality over a period of two weeks. Semi-structured interviews were conducted with fifty producers through an interview guide. Data processing was carried out using a dual approach (quantitative and qualitative) which, on the one hand, consisted in carrying out statistical tests and, on the other hand, analyzing the statements collected during the data collection. The main statistical test used in this study is Kendall’s W-concordance test, which has been used to prioritize constraints. At the end of the analyses, it appears that cotton, just like corn, enables producers to meet the needs and social development of their households. On the other hand, the non-organization of the maize sector, the lack of inputs and the delay in their distribution, maize prices fluctuation and difficulties in the evacuation of cotton are the main constraints reported by producers. Despite its lack of organization and the other constraints to which it is subject, maize crop is the most preferred. In view of this, it would be appropriate to consider the organization of the maize sector and the optimization of the services provided by the organizations in charge of the cotton sector. This will be beneficial to both production systems and also to all actors involved.
Introduction
Agriculture is one of the crucial activities that human being cannot neglect for his survival. It keeps the human species alive and contributes to its evolution. In Benin, it plays a great role in strengthening the economy and provide about 75% of jobs [1]. Among all the crops produced in the territory, two prove to be vital both in the constitution of the national economy and in the fight for food security: Those are corn and cotton. Known as the main cash crop in Benin [2] and the engine of the Beninese economy [3], cotton alone counts for 27% of exports and contributes by 7% to the national GDP. Its production has not stopped growing over the last five years. It reached in 2016, a tonnage of 451,000, which is an increase of more than 70% from the year 2015 [4]. Due to its multiple outlets, the cotton sector remains the country’s best organized sector [5]. If cotton receives a lot of attention from the Beninese government, corn itself does not have such a privilege. Nevertheless, it is the crop that could be an alternative to cotton production [6] in northern Benin. It comes second, after cotton as a subsistence and cash crop [7]. Indeed, its cultivation occupies nearly 70% of the total area devoted to cereals in Benin and represents about 75% of cereal production [8]. Together with cowpea, cassava and yam, it forms the staple crops of people’s diet [9]. Studies have shown that 63.1% of households in Benin consume 7 days out of 7, maize being the main cereal in the food ration [9]; [10]. Apart from the aspects raised, corn also has medicinal properties. According to [11], the corncob is used in combination with other plants to cure knee and low back pain. Some use it to treat diseases such as malaria.
Material and Methods
Study Area
The study took place in the municipality of Kandi, county town of the department of Alibori. Located in the agro ecological zone of the cotton pan, it is limited by the communes of Malanville (North), Gogounou (South) Ségbana (East) and Banikoara (West). It is spread out an area of 3421Km2 and includes ten districts, sixty-seven villages and fifteen districts. The climate in Kandi is of Sudanese type characterized by two seasons that follow each other: The first, rainy from May to October and the second, dry from November to April. Climate change in sub Saharan Africa does not leave the Kandi commune on the side-lines. It is worth noting since a few decades in the commune and its surroundings an early drying up and a late or sometimes violent arrival of rains. Several studies carried out in the region have noted this [12-15]. In addition, the soil found at Kandi is of tropical ferruginous type. The relief is made up of plateau and one distinguishes by place hills made of granites and quartzite. As for vegetation, the town has grassy savanna, shrub and trees with some gallery forests. In terms of agricultural production, Kandi has a good reputation coming in second place after Banikoara, the giant cotton supplier in Benin. Apart from this asset, the municipality is essential in the department in terms of corn production. The following table gives an idea of the evolution of these two crops from 2011 to 2016 (Table 1).
Table 1: Production in tons of the last five years.
Analysis of this table shows a peak of cotton and maize production between 2014 and 2016 with a respective tonnage of 48853.09 and 102240. The respective average production of the two crops is 362681.86 and 66394.68 tons.
Methodological Approach
Among the ten districts of Kandi commune, only two were chosen to shelter the study. These are the districts of Angaradébou and Sonsoro. This choice was made in a participatory way with the coordinator of the Interprofessional Association of Cotton Producers. Firstly because of their performance in the production of both crops within the municipality and secondly because of their positioning. This choice was made for a wide variation of collected data and the obtaining of a socio cultural diversity in order to better touch the realities of the producers of Kandi as a whole. The data was collected using an interview guide designed to collect qualitative and quantitative data. The collection took place during the month of April of the year two thousand and eighteen (2018) and lasted 2 weeks. After an individual interview with five producers, the questionnaire underwent a slight adjustment. Faced with the unavailability of some farm managers, other people who were relatively close to them and involved in the farming activities of the households proved to be able to provide the necessary information for the study. A total of 25 subjects per district producing maize and cotton were included in the study. These have been identified by secretaries of cooperatives who hold leadership positions within their community. The following Table 2 provides an overview of the structure of the sample considered in the study.
Table 2: Structure of the study sample.
Data Analysis
The data capture and analysis was carried out exclusively with SPSS v21.0 32bits software. The data processing was done using descriptive statistics, speech analysis and Kendall’s W-concordance test. The descriptive statistics essentially allow to obtain the frequencies and average of variables characterizing from a social and demographic point of view the interviewed farmers. The comments received from producers were analyzed and then used to model the “benefits and constraints” section. This technique was chosen inspired by the work of several authors including [16- 18]. The Kendall’s W-concordance test was also used to prioritize production constraints in order of importance.
Results
Table 3 below summarizes the socio-demographic characteristics of the producers surveyed in this study. It indicates that the subjects included in the sample are predominantly male (90%) with a low representation of women (10%). Ninety-four per cent of them live entirely depending on agriculture, compared to six per cent who make it as a secondary activity. Their farming experience varies from 3 to 40 years with an average of 16.92 years. Compared to the size of farm households in both localities (13 persons), the average number of farm active Worker (7 approximately) is relatively small. Farmers send their children to school until they are unable to move on. Sixty percent received formal education and forty percent got literate in local languages. Among those who have been literate 22% hold the certificate of primary school, 10% hold the certificate of secondary school and 2% hold the high school diploma and bachelor’s degree. Anyone wishing to cultivate cotton is required to belong to a Village Cooperative of Cotton Producers, this justifies the membership to an organization unanimously own by the respondents. The average area of cotton planted is 6.62 ha on an average total area of 15.62 ha. In contrast, the average area of maize grown is 5.69 ha. An observation of these figures allow to say that the cotton takes with a small difference, the top on the corn in terms of cultivated area in the commune. This could be explained by the several constraints faced by corn producers. Note that these results are quite similar to those obtained by [19] in their studies in the same commune. able 2: Structure of the study sample ese two crops from 2011 to 2016.
Table 3: Socio-demographic characteristics.
Advantages
Advantages Related to Cotton Production
Cotton plays a major role in the lives of Kandi producers. From the exchanges held with the 50 people surveyed, it appears that several benefits are derived from the production of cotton. It allows heads of households and farms to make investments (buying cattle for traction, rolling stock, building houses …), to perform ceremonies (marriage, baptism, burial …) and then to meet regular expenses in their households and farms (schooling, food, expenses and debts of agricultural campaigns). The Interprofessional Cotton Association known as ‘’AIC’’ is the structure in charge of the cotton sector throughout the national territory. It has set in place a mechanism that allows producers to get inputs on credit before the campaign. They receive the inputs on credit, use them for production, and subsequently pay their debts at the time of payment. This approach is appreciated by the producers because, they lack sufficient financial means at the time of starting the campaign. Through the comments transcribed below, two producers support what has been said above. “The cash of cotton appears for me like a tontine, it allowed me to buy my bike, to build the house where I live. Thanks to the cotton I bought a ginning machine that serves me a lot after the corn harvest. My eldest son is already old enough to marriage. I need to buy him a motorcycle and prepare for his wedding by next year. It is on the cash of the cotton that I count to be able to do it. “ “The cash we get from cotton also allows us to do ceremonies. It is an obligation for us. In our culture, when someone close to your family dies, that means that your money is dying too. You cannot have money hidden somewhere without doing it. It’s like a duty for us.
Advantages Related to Maize Production
Corn in the first place ensures the food needs of households and the farm. After production, much of the crop is set aside to allow the producer, his family and those who serve him to overcome hunger, one of Maslow’s primary human needs. In the same way, the seeds used by the producers are taken from the previous crops. Apart from these two aspects, a great part of the producers have said that corn helps them financially. In fact, after harvest they reserve a larger portion for commercial purposes. The main reason behind this, is to cover regular expenses and household contingencies. These unforeseen events are usually cases of illness or death. Growing maize for the farmer is therefore a way to keep his relatives in safe from the food and financial point of view. The comments collected on this issue were analyzed and reissued below. “Corn helps us a lot, that’s what we eat at home almost all the time. In the form of dough, boiled, and akassa (local meal made with corn). When we are facing a financial problem we just have to take a bag of maize, sell it and the problem is solved. “Cotton’s cash lasts before coming. All the while, it’s corn that keeps us alive. Corn helps us a lot without lying to you.”
Cotton Production Constraints
The benefits of cotton and corn production are enormous. However, during the survey, producers listed a number of constraints they face every day. Seven main constraints came back during the exchanges. They have been grouped in the following table with their respective average ranks. It is noted after analysis of the table that the main constraint reported by the population studied is the insufficiency of the seeds supplied to them. The majority of producers have not only deplored the lack of seeds but also the late availability of these inputs. Similarly, the removal of seed cotton, the late payment of cotton costs, the inadequacy of herbicides and the high cost of inputs are the secondary constraints recorded in this study. It is also important to note through the Kendall coefficient (0.379) that the order of importance of these constraints varies quite remarkably from one producer to another (Table 4).
Table 4: Classification of constraints related to cotton production.
Corn Production Constraints
Concerning corn production constraints, there is a relatively high degree of agreement on the ranking (Kendall’s coefficient = 0.698). The first three constraints recorded are the lack of specific inputs for maize, the obligation to sell cheap the crops, and the lack of financial means to cover the expenses inherent to production. The lack of agricultural equipment and the fluctuation of the price of maize occupy the last places in this ranking (Table 5).
Table 5: Classification of constraints related to corn production.
Corn or Cotton
The objective of this section is to expose the respondents’ position after having simulated a situation where they are faced with making a choice between the two crops. It also aims to explain the reasons justifying their respective positions. Table 6 presents the distribution of producers according to the crop chosen. From this table, it appears that more than half of the producers (58%) chose corn, 22% cotton and 20% decided not to take a position. Table 7 below is a summary of the reasons given by the producers following the choice made. Producers, who opted for cotton justify their choice by the fact that the sector is organized, the price is fairly stable, and inputs are provided on credit. At the same time, those who chose maize justify this by its ability to cope with the producer’s financial problems, its ability to keep them alive before the arrival of cotton revenue and also by its easiness and short production cycle. Producers who have maintained a neutral stance argue that the two crops are inseparable and that in the current context, corn production is necessary in order to reap the benefits of cotton.
Table 6: Crop chosen by farmers.
Table 7: Summary of the reasons given by the producers following the choice made Farmer stances.
Discussion
As maize is a foodstuff, it is mainly used to cover the food needs of producers and their households. The forms under which it is consumed differ from one region to another, or even from one social category to another [20]. In Kandi commune, it is consumed in the form of porridge, paste and akassa. Secondarily, it is the subject of a commercial transaction and generates significant income for producers. After discussions with these producers, it is noted that the income earned is used for security purposes and social fulfilment. Purchases of food, buildings and ceremonies (marriage, baptism, death …) are the main uses made of these incomes. They also, but very rarely, invest money that can add value to their production. Purchasing production equipment is generally limited to the minor tools that are necessary. This could be explained not only by the relatively large size of households living at the expense of these incomes, but also by the primacy of physiological and security needs over other needs. The difficulties that undermine the maize sector in the municipality are enormous, as well as the benefits that result from it. The lack of specific maize inputs outweighs all constraints by unlawfully resorting to inputs for cotton production. According to [5]; [7] and [21], this diversion is reflected in the low yields obtained at the cotton level. One could say that maize seems to be in the study area a parasite of the cotton crop. Studies conducted by [22] on the corn seed production and distribution system in accordance with this study revealed that the lack of input is one of the main weaknesses of the maize sector. The study also shows that, apart from the lack of inputs, the sale at low prices of harvests is a strategy developed by producers in urgent need of financial means. They are often lacking when they harvest the cotton. Cases of illness or other unforeseen events arise occasionally. In response to these problems, they sell corn crops. Those who do not adhere to this practice generally resort to Micro Finance Institutions (MFIs) loans as mentioned by [23]. The ‘‘warrantage’’, (a sort of securing by storing a part or the full harvest) implemented in Benin for more than a decade [24] in response to this situation hasn’t unfortunately had a significant impact in the study area. With regard to cotton, it is noted that income from production has the same purpose as corn, with the difference that cotton is exclusively sold and used more for sustainable projects. In some localities in the study area, cotton producers pay contributions after receiving cotton income to build classrooms or other community infrastructures. Numerous producers greet the organization around the cotton sector and mainly the credit-input which is granted to them. This credit would allow them, according to [25], to effectively fight against pests and raise the level of fertility of their land. Nevertheless, the high cost of inputs, the insufficiency of seeds supplied and especially the delay in their delivery are denounced as the real handicaps of the sector. Many are forced to informally leave money in order to have the extra amount of seed needed. Added to this, the evacuation of cotton harvests from the production areas to the factory loses its nature of gratuity at a given period of the campaign. All these constraints call into question the performance of the production system.
Conclusion
The aim of this study was to shed light on the two most important agricultural value chains in northern Benin. This, through the advantages and constraints that characterize their productions. At the end of the study, it appears that cotton as much as maize represents a lot. farmers. Corn is the staple of their diet and significant revenues are derived from the production of both crops. These revenues are mainly used to meet the needs of households and their social development. Cotton, on the other hand, enables producers to meet their economic and social needs. Besides, the two production systems are subject to constraints that need to be considered for the betterment of these sectors and the actors involved. Giving common attention to both crops through the organization of the maize sector and the optimization of the services provided by the AIC are means likely to boost the satisfaction of all the actors involved.
For more Lupine Publishers Open Access Journals Please visit our website:
https://lupinepublishers.us/
For more Open Access Environment Journal articles Please Click Here:
https://lupinepublishers.com/environmental-soil-science-journal/index.php
To Know More About Open Access Publishers Please Click on Lupine Publishers
Follow on Linkedin : https://www.linkedin.com/company/lupinepublishers
Follow on Twitter : https://twitter.com/lupine_online
30 notes
·
View notes
Text
Lupine Publishers | Fertilizer Effects on Nutrient Elements, Total Polyphenols and Anti-oxidant Contents of Roselle (Hibiscus sabdariffa) Leaves

Lupine Publishers | Agriculture Open Access Journal
A great deal of research has been geared toward the calyces of roselle due to their medicinal properties. Though leaves of roselle have been consumed by diversed ethnic groups, little research efforts have been focused on leaves due to unestablished beneficial bioactivities. This paper provides preliminary data on the effect of various types and rates of fertilizer on fresh fruit yields, total polyphenol and antioxidant contents of the leaves of roselle (Senegal accession). Fertilizer applications at planting time had nonsignificant increasing effect on fresh fruit yield/plant and non-significant reduction in total polyphenol and antioxidant contents of the leaves. Inconsistent effects of applied fertilizer on macro and micro nutrient contents of the leaves were observed. In general, N, P, K, Ca, Mg, S, B, Mn and Zn were significantly (P<0.05) increased by selective fertilizer types and rates while Cu and Fe contents were not significantly affected by fertilization. Further studies on fertilization along with increased frequencies of application are needed to validate these findings.
Keywords: Roselle; Hibiscus sabdariffa; Fertilizer; Phenols; Antioxidants and fruit yield
Introduction
More than 300 species of Hibiscus species (Malvacea family) can be found growing in both tropical and subtropical regions of the world [1]. Roselle, Hibiscus sabdariffa L., is only one of the hibiscus species that has its sepals of the flower developed into a swollen red calyx enclosing the mature fruit at maturity. The calyces are found to be rich in nutrients and photochemical compounds that exhibits anti-oxidant activities Consequently, economic interests have been mainly focused on roselle calyces which are used worldwide in the production of herbal tea, cold refreshing drinks, jellies, jam, sauces, chutneys, wines, preserves and food colorants (D'Heureux-Calix and Badrie, 2004). Because of the folk’s medicinal uses, a great deal of research has been geared toward roselle calyces. Most research has been heavily directed toward the studies of phytochemistry, anti-oxidant properties and effects of calyx extracts on anti-oxidant activities, and other bioactivities such as anti-inflammatory action, anti-microbial, and antitumor activities [2] and Wang 2015. Even though leaves are widely consumed by a diverse population of ethnic groups, particularly in tropical regions of Africa, little research effort has been focused on leaves. In recent studies [2], roselle leaves are found to be a good source of phenolic acids and flavonoids that exhibit anti-oxidant activities. The purpose of this preliminary study is to evaluate the effect of various types and rates of fertilizer application on roselle fruit yield, nutritional, phenolic and antioxidant content of the leaves.
Materials and Methods
Chemicals and reagents
ABTS (2,2’-azino-bis (3-ethylbenzothiazoline-6-sufonic acid), potassium persulfate were purchased from Sigma-Aldrich of St. Louis, MO, USA. Folin Ciocalteu’s phenol reagent was purchased from MP Biomedicals of Solon, OH, USA. Water and methanol were purchased from Fisher Scientific of Fair Lawn, BJ, USA.
Experiment and plant samples
A field experiment was conducted to evaluate the effects of the applied fertilizers at planting time on roselle plants of Senegal accession during the 2014 growing season at Southern University’s research farm, Baton Rouge, Louisiana which has a subtropical climate (30.5240N and 91.1900W and elevation of 22m). The area has an average precipitation of 1700mm and the average annual temperature is 19.70C. The field has a silty clay loam soil with a pH of 7.1. The seeds of Senegal accession were planted in the 2x2 cell-pack trays in the greenhouse at the beginning of April, 2014. Seedlings were hand-transplanted into the field one month after germination. A completely randomized design with a total nine applications as treatments. These treatments were the control; 3, 6 and 9# (lb=454g)/30.48m. of organic fertilizer 4-2-2, respectively; 3, 6 and 9# (454g)/30.48m of organic fertilizer 8-5-5, respectively; and 3 and 6# (lb=454g)/30.48 m. of inorganic fertilizer 13-13-13, respectively. Each treatment consisted of 16 plants spaced at 6 feet (1.83m) between plants within a 3.5ft (1.07m) row. Between row spacing was 8 feet (2.44m.). Fertilizers were applied and incorporated on top of the raised bed. Seedlings were planted one day after fertilizer applications. Leaves were randomly collected in late July from branches at waist height from 10 plants of each treatment.
Nutrient elemental analysis
Leaves in the brown paper bags were dried at 500C in the Precision Thelco Laboratory oven for 8 hours in the oven and then ground using Thomas-Wiley Model 4 grinder with a 30 mesh screen. The ground samples in the vials were subject to one-hour of drying before they were stored in the desiccator to prevent moisture contamination. Three individual 0.5g of composite ground leaf samples from each treatment were placed in 50mL Digi-tubes (SCP Sciences) and were digested using DEENA automatic digester. Each digested sample in the Digi tube was brought up to a total volume of 20mL with distilled water. The solution with digested sample was vacuum-filtered with a 1.0 micron Digi-filter. The filtrate was analyzed by SPECTRO ARCOS ICAP for Al, Bo, Ca, Cu, Fe, Mg, Mn, Mo, P, K, NA, S and Zn. Separately, 0.15g of dried leaf sample was used for determining the amount of carbon and nitrogen using LECO CN Analyzer.
Sample preparation for total phenol and antioxidant activity determination
The method of sample preparation was adopted from Xu [3] and Zhen [2]. A 100mg of each dried and ground leaf sample was measured and placed in a volumetric flask. Twenty-five mL of 70% (v/v) methanol/water with 0.1% acetic solution was added into the flask. The sample extraction was then put in ultrasonic water bath for 10 minutes followed by shaking at room temperature for overnight. The extract of each sample was then filtered through 0.45um filter. The filtrate was used for the Folin-Ciocalteu and ABTS radical scavenging assays.
Phenolic content determination (Folin-Ciocalteu assay)
The Folin-Ciocalteu assay with modifications [4] used by Zhen [2] was adopted for the determination of the total phenolic content of the leaves. 40ul of the prepared leaf extract was mixed with 900ul diluted Folin Ciocalteu’s reagent followed by incubation at room temperature for 5 minutes. Then, 400ml of 15% sodium carbonate was added. The mixture was allowed to react at room temperature for 45 minutes. The UV absorption of the mixture solution at wavelength of 752nm was measured against a blank solution. The standard curve was measured based on the prepared gallic acid standard solution (0.38, 0.19, 0.095 and 0.475mg/ml). The result was transformed as mg/g of gallic acid. The results were calculated from the mean of three replicates.
In vitro antioxidant activity (ABTS radical scavenging assay)
The procedure of the decolonization of the ABTS radical cation [5] used by Zhen [2] was adopted for the determination of antioxidant activity. 38.4 mg of ABTS and 6.6 mg of potassium per sulfate were co-dissolved in 10ml of water and stored for 16 hours in the dark environment to form stable radical action (ABTS+). The stored radical solution was then diluted using ethanol to a concentration with UV absorption of 0.70+/-0.20 at734nm. 900ul of the diluted ABTS radical working solution was mixed with 10ul of the leaf extract followed by 20 minutes of reaction at room temperature. The decolonization of the mixed solution indicates that antioxidant compounds in the extract quenched ABTS radical actions. There was a quantitative relationship between the reduction absorbance at 734nm and the concentration antioxidants present in the sample [2]. The standard curve was built up by plotting the concentrations of Trolox against the percentage of inhibition. The value of antioxidant capacity of the sample was calculated as Trolox equivalent antioxidant capacity. The final result was expressed as the % of antioxidant per dry weight basing on the calculation from the mean of three replicates.
Results and Discussion
Figure 1 shows the effects of the type of fertilizer and its rate on fresh fruit yield/plant. There was a trend to indicate that applied fertilizers increased fresh fruit yield of roselle of Senegal accession under this study. However, the yield increases were observed to be non-significant. Since all fertilizers were applied at the planting time in spring, the effect of fertilization might have faded away during the late summer and early fall during which fruits were produced. This fading effect of applied fertilizers can be supported by various extension publications indicating the recommended side-dressing of fertilizers are needed for various vegetable crops during the growth period [6-8]. Figure 2 shows the effects of the type and rate of fertilizer applied at planting time on the total polyphenol and antioxidant content of roselle leaves in % of dry weight. There appeared to have a trend that increased amounts and rates of fertilizer exhibited a reduction in total polyphenol content. The reduction in polyphenol content might be due to less nutritional stress by plants receiving increased amount of fertilizer. It is hypothesized here that further application of fertilizers to enhance plant growth and yield may cause significant reduction in polyphenol production. It had been reported that plants under stress provided more antioxidants in response to stresses [9-12].
Figure 1: Effects of the type and rate of fertilizer applied at planting time on fresh roselle fruit yield in kg/plant. Note: # is denoted as lb. (454 g) of fertilizer applied per 100 feet (30.48 m) row.
Figure 2: Effects of the type and rate of fertilizer applied at planting time on total polyphenol and antioxidant contents of roselle leaves in % of sample dry weight. Note: # is denoted as lb. (454 g) of fertilizer applied per 100 feet (30.48 m) row.
Figure 3 shows the effects of the type and rate of fertilizer applied at planting time on (A) macro-nutrients and (B) micro-nutrients of roselle leaves. The results when the effects were compared to that of the Control treatment, showed that (a) 3# of organic fertilizer 4-2-2 and 3#, 6# and 9# of organic fertilizer significantly (P<0.05) increased N content of the leaves, (b) all fertilizer treatments had no significant effect on P content of the leaves, © 9# of organic fertilizer 4-2-2 significantly (P<0.05) increased K content of the leaves, (d) all fertilizer treatments had no significant effect on Ca content of the leaves, (e) 9# of organic fertilizer 4-2-2 , 6# and 9# of organic fertilizer 8-5-5 significantly (P<0.05) increased Mg content of the leaves, (f) 3#, 6# and 9# of organic fertilizer and 6# of inorganic fertilizer 13-13-13 significantly (P<0.05) increased S content of the leaves, (g) all fertilizer treatments had no significant effect on Cu and Fe contents of the leaves, (h) 3# and 6# of organic fertilizer significantly (P<0.05) increased B content of the leaves, (i) 3# and 9# of organic fertilizer 4-2-2, 9# of organic fertilizer 8-5-5 and 3# and 6# of inorganic fertilizer 13-13-13 significantly increased Mn content of the leaves and (j) 9# of organic fertilizer 4-2-2, 3#, 6# and 9# of organic fertilizer 8-5-5 and 6# of inorganic fertilizer significantly increased Zn content of the leaves. The results of this study showed inconsistent in nutrient elemental contents of plants in response to fertilizer treatments. In general, N, P, K, Ca, Mg, S, B, Mn, and Zn were significantly increased by selective fertilizer types and rates while Cu and Fe were not significantly affected by the fertilizer applications.
Figure 3: Effects of the type and rate of fertilizer applied at planting time on (A) macro-nutrients and (B) micro-nutrients of roselle leaves. Note: # is denoted as lb. (454 g) of fertilizer applied per 100 feet (30.48 m) row. Macro-nutrients are expressed in % of dry weight while micro-nutrients are expressed in PPM in dry weight.
Conclusion
Fertilizer applications at planting time enhanced many macro and micro nutrient elemental contents of roselle leaves but did not adequately affect fresh fruit yield, leaf total phenol and anti-oxidant contents. Reviewed literature provides evidence a significant increase in fruit yield can be obtained through an increase in fertilizer application as side-dressing. Evidence provided by literatures also suggests that an increase in fertilizer applications which reduce nutritional stress can also possibly reduce polyphenol content and antioxidant activity of roselle. Inconsistent results of this study suggest that further studies on the effect of fertilizer and the frequency of fertilizer application are needed to validate the results of these findings and conclusion.
https://lupinepublishers.com/agriculture-journal/fulltext/fertilizer-effects-on-nutrient-elements-total-polyphenols-and-anti-oxidant-contents-of-roselle-hibiscus-sabdariffa-leaves.ID.000142.php
For more Lupine Publishers Open Access Journals Please visit our website: https://lupinepublishersgroup.com/
For more Agriculture Open Access Journal articles Please Click
Here: https://www.lupinepublishers.com/agriculture-journal/
To Know More About Open Access Publishers Please Click on Lupine publishers
Follow on Linkedin : https://www.linkedin.com/company/lupinepublishers
39 notes
·
View notes
Text
Lupine Publishers | Consumer’s Preference and Willingess to Pay for Organic Foods in Osogbo Southwest, Nigeria

Lupine Publishers | Agriculture Open Access Journal
Abstract
Despite millions of smallholder vegetable farmers along the market chain of subsistence agriculture in most developing countries, consumption of organic vegetables in Nigeria has been reported to be significantly low. Consumers’ preference for organic vegetable with emphasis on wareness, perception and willingness to pay was studied. One hundred consumers were randomly selected. A questionnaire was used to obtain information on socioeconomic characteristics and other relevant variables. Data were analyzed with descriptive statistics and Spearman ranking. The result showed that there was high awareness of organic vegetable in the metropolis and Consumers were mostly informed through television (27.8%), radio (23.2%) and internet (29.3%). Consumers preferred organic vegetables to conventional ones as it was perceived to be healthier (77%), of better quality (76%), tastier (66%), less harmful (66%) but expensive (30%) respectively. There was good supply of organic vegetable in the market and Okro (21.6%), Amaranths vegetables (20.4%) and tomato (19.8%) were the organic vegetables mostly consumed in the metropolis. Health concern (80%), satisfaction (79%) and safety (78%) respectively are the major reasons why consumer opted for organic vegetable. The consumers’ familiarity with organic vegetables mostly influences them to be willing to pay premium on the vegetables. Facilities to expand, proper certification and labelling of organic products were recommended to encourage continuous growth of the market.
Keywords: Awareness; Perception; Consumers; Organic-Food
Introduction
Organic foods are foods produced by organic farming. While the standards differ worldwide, organic farming in general features cultural, biological, and mechanical practices that foster cycling of resources, promote ecological balance, and conserve biodiversity [1]. Synthetic pesticides and chemical fertilizers are not allowed, although certain organically approved pesticides may be used under limited conditions. In general, organic foods are also not processed using irradiation, industrial solvents, or synthetic food additives [2]. Fruit and vegetable consumption has grown over the last few years because people are more concerned about staying healthy and eating right. Research into nutraceuticals and functional food has highlighted the health compounds found in fruits and vegetables. There has also been an increase in vegetarian diets and a stronger demand for exotic produce, resulting in a wider and dynamic market during all seasons of the year [3]. Several studies have justified that diets rich in vegetables confer health benefits and may even be protective against the risk of different types of diseases such as diabetes, cancer and strokes [4-6]. According to The World Health Organization [7], low fruit and vegetable intake is estimated to cause about 31% of Ischaemic heart disease and 11% of stroke worldwide. Overall it is estimated that up to 2.7 million lives could potentially be saved each year if fruit and vegetable consumption was sufficiently increased. Due to increasing concerns about food safety and environmental quality, organic food has rapidly emerged as an important food industry in many countries of the world and organic vegetable is gradually creating a niche for itself in global market. According to Lia [8] City and sub-district markets are more lucrative and profitable for organic vegetable traders because consumers in those locations are affluent, quality conscious and willing to pay higher prices. A perceived scarcity can result in affluent consumers increasing purchases. Frequent weekly visits indicate those consumers prefer markets as the main source of vegetables for their household [9]. Traders have responded to this opportunity by developing appropriate market chains. In response, consumers also express a willingness to pay higher prices for better quality.
This preference is particularly strong with those with a higher education, and those of a younger demographic. Most of who are under age 35 choose organics when possible but price has been found to be the primary reason that consumers preferred nonorganic vegetables. The perceived shortage of commodities and consumers’ willingness to pay premium prices for quality provides opportunities for farmers and traders to increase production, processing and marketing of quality commodities [8]. In a study by FAO [9]. The reasons consumers frequently give for not eating more organic vegetable include traditional and individual indifference, high prices and variable availability, their taste, quality and safety. It is a known fact that consumers want foods that are readily available, affordable, convenient to acquire and prepare, socio-culturally appropriate, safe and healthy. Despite the increased awareness of the importance of organic vegetables to healthy living, low intake of this vegetable has been a widespread characteristic among Nigerians [6]. Though studies have shown that many consumers prefer organic foods to conventional foods, price is often a major factor that influences their behavior as organic vegetables are especially price sensitive given its daily consumption [2,10]. In spites of the importance of organic vegetables to human health and the environment, there is still a short fall in consumption in the country and which has reduced the availability of organic vegetables in mainstream markets, thus preventing the market from expanding. Similarly, many Nigerian farmers are still hesitant to adopt the production of organic vegetables in large scale due to inadequate information on the consumers’ willingness to pay. This research therefore intends to: (a) Identify the consumers’ socioeconomic characteristics, (b) Examine the consumers’ perception of organic vegetables over conventional vegetables, © Assess reasons for consumers’ perception of organic vegetables over conventional vegetables (d) Analyzed factors influencing consumers’ preference for organic vegetables and (e) Analyzed factors that influence consumers’ willingness to pay for organic vegetables.
Willingness to pay (WTP)
Willingness to pay (WTP) for a commodity is the amount of money a person would be willing to pay for a higher level of environmental or commodity quality. WTP is a measure of the resources individuals are willing and able to give up for a reduction in the probability of encountering a hazard that compromises their health [11]. Spencer [12] opined that a theoretical correct measure of the value individuals attach to improvements in food safety is their ‘WTP’ for safer food. This, therefore, is the largest amount that an individual is willing to pay for a specific improvement in food safety. The notion of willingness to pay could be defined as the sum of money representing the difference between consumers’ surplus before and after adding or improving a food product attribute [11,13]. Models that estimate consumers’ willingness to pay when adding or enhancing a given quality attributes are based on the Lancaster approach [14], which maintains that consumers directly derive utility from the attributes of goods. According to James [15], tools for measuring WTP (which include the contingent valuation, travel cost and hedonic pricing) can be used to answer questions such as how much consumers are willing to pay for a quality upgrade or what effect a particular government intervention might be. In this regard, consumers’ willingness to pay (WTP) for organic food products can be measured using a direct valuation method such as the contingent valuation (CV). The procedure consists of a dichotomous choice (DC) question and a maximum WTP question. In the DC question, consumers are asked whether or not they are willing to pay a premium, to buy an organic vegetable instead of a conventional one. The amount they are willing to pay is a percentage over the price of the conventional product and differs across consumers. Consumers’ responses are YES if they are willing to pay more for an organic vegetable or NO otherwise. Consumers are then asked for the exact premium they are willing to pay.
Methodology
The study was carried out in Osogbo metropolis which is the capital and a local government in Osun State, Nigeria. Osogbo lies between 70461N 40341E. It occupies an area of 47km2 and has a population of 156,964 [16]. Osogbo is the center of commerce, trade and agriculture in Osun State. The study area is inhabited by farmers, artisans and civil servants; and the major economic activities include farming, trading, teaching, publishing, handcrafting, ect. The study adopted a two stage sampling technique. At the first stage, stratified random sampling technique was used to stratify the population into professionals in the health sector, educational sector and civil service sector. At the second stage, purposive sampling was used to select 100 respondents and primary data were collected through the use of well structured questionnaire. The questionnaire was drawn broadly to cover information about the socio economic characteristics, knowledge and perceptions of the respondents. Some of the questions asked involved some botanical names and their common names for easy identification. The analytical methods used were descriptive statistics and Spearman’s ranking method. The Descriptive statistics used frequency distribution, tables and percentages to analyze the socio-economic characteristics of the respondents. Spearman’s ranking which is a non parametric measure of statistical dependence between two variables was used to analyse the level of consumers’ awareness of organic vegetables as compared to inorganic vegetables as well as consumers’ perception of organic vegetables. The mean values represent the average values of the respondents on each factor influencing the perception of organic vegetables which ranged from Agree, Disagree to Undecided. The highest perception was chosen based on the least mean because “Agree” was allocated the least value on coding.
Results and Discussion
Socio economic characteristics of organic vegetable consumers in the study area
This was discussed in relation to the gender and age of the respondents, marital status, education, major occupation of household head, household income, household size, household income spend on food. From Table 1, consumers of organic vegetable were female dominated (60.0%) with a mean age of 33 years. This indicated that consumers of organic vegetables were young and energetic people who have high propensity to consume. The finding confirms Ohen [6] who declared that this age group of respondents has a strong influence on preference and taste habit of consumers which may in turns influence their consumption pattern for fruits and vegetables. Table 1 also revealed that consumption of organic vegetable was mostly embraced by both educated single (47.0%) and married (48.0%) people in the study area. This result is expected to have positive influence on the perception of consumers for organic vegetable. The result affirms Dipeolu [11] who declared that the higher the educational status of people, the better they will be informed and educated people have positive perception for organic vegetable because they are more informed than the uneducated. The consumption of organic vegetable was by people of different professions but more by civil servants (59.0%) and businessmen/women (18.0%) who had stable source/flow of income. Table 1 also showed that the households in the study area were low income earners and it may have negative influence on their consumption of organic vegetables. This result agrees with Essoussi [17] who reported that high price of organic vegetable was one of the major factors that influence consumers to give in for conventional vegetables. Majority of consumers of organic vegetables (63.0%) in the study area had moderate family size of 1-5 members and spend maximum of ₦ 50,000 on food per month. The indication of this was that there was high potential market for organic vegetable in the study area because the higher the population, the higher the demand for goods and service.
Table 1: Socio-economic Characteristics of Respondents.
Source: Field Survey, 2013.
This was discussed in relation to the gender and age of the respondents, marital status, education, major occupation of household head, household income, household size, household income spend on food. From Table 1, consumers of organic vegetable were female dominated (60.0%) with a mean age of 33 years. This indicated that consumers of organic vegetables were young and energetic people who have high propensity to consume. The finding confirms Ohen [6] who declared that this age group of respondents has a strong influence on preference and taste habit of consumers which may in turns influence their consumption pattern for fruits and vegetables. Table 1 also revealed that consumption of organic vegetable was mostly embraced by both educated single (47.0%) and married (48.0%) people in the study area. This result is expected to have positive influence on the perception of consumers for organic vegetable. The result affirms Dipeolu [11] who declared that the higher the educational status of people, the better they will be informed and educated people have positive perception for organic vegetable because they are more informed than the uneducated. The consumption of organic vegetable was by people of different professions but more by civil servants (59.0%) and businessmen/women (18.0%) who had stable source/flow of income. Table 1 also showed that the households in the study area were low income earners and it may have negative influence on their consumption of organic vegetables. This result agrees with Essoussi [17] who reported that high price of organic vegetable was one of the major factors that influence consumers to give in for conventional vegetables. Majority of consumers of organic vegetables (63.0%) in the study area had moderate family size of 1-5 members and spend maximum of ₦ 50,000 on food per month. The indication of this was that there was high potential market for organic vegetable in the study area because the higher the population, the higher the demand for goods and service.
Perception about organic vegetables over convectional vegetables
The survey in Table 2 revealed that most of the respondents had positive perception for organic vegetable as being healthier (77%), of better quality (76%), tastier (66%), has no harmful effects (66%). Interestingly, only 30% indicated that organic vegetables were more expensive than conventional vegetables. The indication of this result is that there is potential market for organic vegetable in the study area because perception does influence consumption as Dipeolu [11] reported in their work that positive perception of organic has the tendency of increasing its consumption while negative perception similarly decreases. Furthermore, this result agrees with Ohen [6] that despite the fact that consumers are aware of many positive sides of organic vegetables, yet, its consumption is still low because of high price and inconsistent supply to the market.
Table 2: Socio-economic Characteristics of Respondents.
Reasons for consumers’ preference for organic vegetables over conventional vegetables
The result in Table 3 showed that consumers preferred organic vegetables because of their health consciousness (80%), satisfaction derived from it (79%), safety (78%) and its taste (79%). It is also revealed in Table 3 that some respondents preferred organic vegetables to conventional ones because it is economical to them. As some respondents viewed it that the more they eat organic vegetables, the lesser would be the possibility of hospital bills and drug usage. Similarly, some consumers preferred organic vegetables because they see it as environmentally friendly (66%), encourages traditional agriculture (66%), highly preservable (57%) and aesthetically pleasing (57%). These results agreed with Petrescu (2013) and Bonti and Yiridoe [18] who reported that concern for human health and safety is a key factor that influences consumer preference for organic food (vegetables). This is consistent with observed deterioration in human health over time and, therefore, motivates consumers to buy organic food (vegetables) as insurance and investment in health.
Table 3: Reasons for Consumers Preference for Organic Vegetables over Conventional Vegetables.
Source: Field Survey, 2013.
Source of Information on Organic Vegetables
As observed in Table 4, the study showed that television (27.8) and radio (23.2) were the major sources of information on organic vegetables in the study area. 13.0% were informed through friends; 16.7% through pamphlets/newspapers and 14% heard about it from the internet. This implies that it is easy to get information on organic vegetable in the study area and but more people are likely to be informed about it through television and radio.
Table 4: Distribution of the respondents by source of information.
Source: Field survey, 2013.
The type of organic vegetables consumed by the respondents
The result in Table 5 revealed that the organic vegetables mostly consumed in the study area were Okra (21.6%), Amaranths (20.4%), tomato (19.8%) and pepper (16.1%) respectively without consideration for certification and labeling of the products. This implies that organic market in the study area is still new and underdeveloped. The result affirms Dipeolu [11] that in the event of extensive cultivation of organic vegetable, there is a ready market in the south western part of Nigeria but more education should be given on the distinction between certified and non-certified organic food.
Table 5: The types of organic vegetables consumed by the respondents.
Source: Field survey, 2013.
Factors influencing consumers’ willingness to pay for premium for organic vegetables
The willingness to pay the premium may be attributed to consumers’ knowledge and awareness and perception of organic vegetable. The results in Table 6 show that 88% of the respondents were willing to pay premium for organic vegetables because they have eaten them at one time or the other. The finding agrees with Thomson [19] who stated that every year, more people are getting attracted to organic foods and some are willing to pay premium on it for several reasons. Similarly, 87% of the respondents were willing to pay premium for organic vegetables because they had in one time bought organic vegetables. 80% said they would be willing to pay more for organic vegetables because they had prior knowledge of its many benefits to man, animals and the environments. 74% agreed to pay premium on organic vegetables because they had in one time or the other seen organic vegetables before and this may because of their belief in organic vegetables as aesthetically pleasing and has a higher shelf life. 64% stated that they will be willing to pay for organic vegetables because of their household size. This finding agrees with Lia [8] who stated that households with low household size have high tendency to pay premium for organic vegetables than those with large family size due to its high price. 59% agreed that they will be willing to pay premium for organic vegetables because of their age. This therefore confirms Khaw [10] who reported that consumers are usually more health conscious as they advance in age and are willing to pay premium for good health condition [20,21].
Table 6: The types of organic vegetables consumed by the respondents.
Source: Field survey, 2013.
Conclusion and Recommendation
There is high awareness and positive perception of organic vegetable among the consumers. The consumers are educated and have good access to organic vegetables but its high price was a constraint to its consumption. There is positive perception of organic vegetable among the respondents as being healthier, safer, and tastier and of better quality and most of the respondents are willing to premium on organic vegetable in the study area. These therefore show that there is a strong potential market for organic vegetables in southwest Nigeria. It is therefore recommended that programmes and facilities that will promote the expansion of organic market should be put in place in the study area.
https://lupinepublishers.com/agriculture-journal/fulltext/consumers-preference-and-willingess-to-pay-for-organic-foods-in-osogbo-southwest-nigeria.ID.000141.php
For more Lupine Publishers Open Access Journals Please visit our website: https://lupinepublishersgroup.com/
For more Agriculture Open Access Journal articles Please Click
Here: https://www.lupinepublishers.com/agriculture-journal/
To Know More About Open Access Publishers Please Click on Lupine publishers
Follow on Linkedin : https://www.linkedin.com/company/lupinepublishers
34 notes
·
View notes
Text
Lupine Publishers | Review of Ten Years’ Experience of Endoscopic Skull Base Surgery in A Regional Hospital ENT Department - Queen Elizabeth Hospital

Lupine Publishers | Journal of Otolaryngology High Impact Factor
Abstract
Endoscopic skull base surgery is a relative new approach in ENT specialty. ENT Department of Queen Elizabeth Hospital started to do some ten years ago. It is a review of the types and experience of that endoscopic transnasal approach to manage skull base disease. 63 procedures in four types of surgery is recorded in a ten years period in that regional hospital in Hong Kong. The largest number being done is endoscopic nasopharyngectomy which is more common in southern part of China.
Introduction
The endonasal and endoscopic approach to the skull base provides a minimally invasive way to remove tumors that would otherwise require either a large cranial opening and brain retraction or disfiguring facial scars. Instead, an endoscope is advanced through the natural opening of the nasal cavity. A variety of tumors can be removed in this fashion, in various locations, with different maneuver of the endoscope to the desired location. This approach was first developed by endoscopic sinus surgeons but is now being used as minimally invasive skull base surgery to treat tumors as well. A ten years review of the cases being done in a regional hospital in Hong Kong gives some information about the possible future development of this field of surgery.
Method
Cases review of hospital notes and operative records from 2010 to 2019 in ENT Department of Queen Elizabeth Hospital. Different surgery involved skull base lesion done with endoscopic endonasal approach were studied.
Result
Four types of endoscopic endonasal skull base surgery were being done
a) Endoscopic nasopharyngectomy about 54 procedures done for recurrent NPC and result like open surgery.
b) Five procedures done for CSF leak & one is repeat procedure.
c) Two intranasal neuroblastoma & 1 sphenoid sinus procedures done for inverted papilloma.
d) Two intraorbital and intraconal haemangioma removal procedures.
Discussion
The development of navigation system and other power instrument used endoscopically helped the development of endoscopic skull base surgery to be done more safely and effectively. Example of endoscopic nasopharyngectomy was done first in ENT department QEH in 2010 for a post radiotherapy nasopharyngeal carcinoma patient with primary adenocarcinoma. It was done with two surgery four hands technique (Figure 1) and a complete excision was achieved. Subsequent endoscopic nasopharyngectomy were done for recurrent NPC patients with aid of power instrument of coblator which give a thin cut layer by layer when approaching the dangerous area of carotid and skull base (Figures 2&3) A nasoseptal flap were created to cover the nasopharyngectomy wound and help patient recovery faster (Figure 4). The overall longterm result is about the same as open surgery. The second types of surgery done for skull base lesion is cerebrospinal fluid leak which either resulted from iatrogenic causes or spontaneous causes or from meningocele. Dura seal and fibrin glue and cauterization of meningocele were used to stop the CSF leak. Lumbar drain was used by neurosurgeon in these cases when two specialty worked together (Figures 6 & 7).
The third type of surgery is for tumor of neuroblastoma and inverted papilloma involving skull base. Endoscopic approach with post operation radiotherapy is used for a complete control of two cases of neuroblastoma with no intracranial extension. One inverted papilloma occupied and expands the sphenoid sinus and removed endoscopically (Figures 8 & 9). The last type of surgery is endoscopic removal of intraconal intraorbital tumor. It was done together with eye doctor to debulk and excise one cavernous haemangioma and one schwannoma (Figure 10). Lastly the degree of difficulty of endoscopic skull base surgery can be classified into different ladder according to some expert (e.g. Prof. Richard Carrau) It starts with level 1 to level 5. Level include sinonasal surgery, level 2 Pituitary gland surgery, CSF leak. Level 3 is extradural surgery of transcribriform to transodontoid etc. Level 4 is intradural and level 6 in cerebrovascular surgery. It takes a great effort to learn the technique in advanced level and a high-risk surgery. A teamwork with neurosurgeon is essential when intradural pathology is managed and therefore not every center even with neurosurgery support can do these surgeries especially with inadequate caseload experience.
For more Lupine Publishers Open Access Journals Please visit our website: h
http://lupinepublishers.us/
For more Journal of Otolaryngology articles Please Click Here:
https://lupinepublishers.com/otolaryngology-journal/
To Know More About Open Access Publishers Please Click on Lupine Publishers
Follow on Linkedin : https://www.linkedin.com/company/lupinepublishers
Follow on Twitter : https://twitter.com/lupine_online
38 notes
·
View notes
Text
Lupine Publishers | Do you really know what Periodontal Disease is?

Lupine Publishers | Journal of Dentistry
Introduction
The etiology includes the sum of evidences related to the causes of a disease. Majority of all forms of periodontal diseases, are considered as microorganisms-induced dependent. However, it is improbable that bacteria alone cause periodontal disease. The etiological concept of the inflammatory periodontal disease is an exceedingly complex interaction of bacteria and predisposing risk factors. The predisposing risk factor may be an inherent characteristic associated with an increased rate of a subsequently occurring disease, but does not necessarily cause the disease. In periodontal disease, the predisposing risk factors may be defined as local environmental factors, behavioral factors in nature and systemic factors, which may be responsible in providing an ideal environment for bacterial colonization and/or fragility in a determinate tooth or teeth and adjacent periodontal tissues and/ or interference in the inflammatory process. Local environmental factor may interfere in the fragile equilibrium of the gingival sulcus defense by favoring microbial colonization and growth or/and altering the local susceptibility of the periodontal tissues to be damaged by the bacterial onslaught.
When predisposing risk systemic factors affect the individual, a deficient interaction of the bacteria with cells of the inflammatory process may occur, inducing an incomplete defensive process, leading to the periodontal destruction. Periodontal disease could be considered as sequel of the inflammatory reaction, which must be always active, protecting individual against infection and possible septicemia, by bacteria present in the gingival sulcus, a critical area where junctional epithelium is an exclusive and fragile structure, separating connective tissue from an infected humid and warm oral environment. Periodontitis a protective inflammatory mechanism, begins with microbial challenge, which induce a host- mediate response and destruction of periodontal tissue, caused by bursts of clastic cell activity, triggered by hyperactivated or primed polymorphonuclear leukocytes and factors generated during the inflammatory acute phase, such as eicosanoids and various proteins as enzymes that cause damage and rupture of the periodontium, as ulceration of the junctional epithelium, loss of connective tissue and alveolar bone, causing apical migration of the junctional epithelium, promoting periodontal pocket establishment.
Periodontal pocket development is the most important clinical and pathologic alteration associated with inflammatory periodontal disease and also may be considered as a local predisposing risk factor for periodontal disease progression, by generating an anaerobic environment to be contaminated as a result of repeated infection by the various species or combination of the species as exogenous anaerobic and facultative bacteria (periodontopathogenic bacteria). These putative periodontal pathogens and their products may induce substantial pathological alterations, essentially in root surface exposed to the contaminated periodontal pocket. On the other side, due bacterial approximation to the ulcerated pocket epithelium, infected periodontal pocket also could be an infectious focus linked to the various systemic disorders, probably led by anachoresis, a process associated with dissemination of the microorganisms or/and toxics products into blood stream, assisting or causing infection in the various vital organs. In addition, the destruction produced during the periodontal disease progression, may present similar characteristics, but the association among the bacteria and the various predisposing risk factors, may be distinct and inherent to each person, depending on the host’s susceptibility, which does not always present an identical susceptibility to the various local and/or general predisposing risk factors.
All types of periodontal disease are multifactorial diseases, which progress through successive destructive acute phases, always interposed, by reparative chronic phases. The indication of the periodontal disease reparative phase is possible to find in untreated periodontal pocket, as cementum and the gingival- attached connective tissue zone, separating the apical end of the ulcerated periodontal pocket epithelium from the underlying destructed alveolar bone which always presents a repaired cortical bone at a range of levels protecting the cancellous bone. In untreated periodontal disease, the gingival-attached connective tissue zone should be destructed, but they arise most often in untreated periodontal pockets. After each successive destructive acute phase, variations in the quantity and quality of the etiological agents and the predisposing risk factors would arise. However, periodontal disease always ceases the brief acute destructive phase beginning in the sequence a long chronic reparative phase.
This fact demonstrates that, etiological agents and predisposing risk factors during the periodontal disease progression, acquired better quality and quantity, but could not be able to maintain the periodontal disease destructive phase activity all the time. Probably, the periodontal disease initiates and progress when at a given time, a specific temporary fragility, inherent for each individual, assists involved etiological agents in initiating the destructive acute phase to establish the progression of the periodontal disease. Then periodontal disease is a complex defensive mechanism which avoids penetration of bacteria into the periodontal tissues. However as a side effect this mechanism of protection induces periodontal tissues destruction that is considered as periodontal disease. Based on these considerations we can reflect asking some questions:
i. Periodontal disease is a disease?
ii. Is it possible to prevent periodontal disease only through biofilm control?
iii. What is the best method to diagnostic the destructive phase of the periodontal disease?
iv. What is the best time to treat the periodontal disease: in the stable and reparative chronic phase or in the acute destructive phase?
v. Is it possible treating periodontal disease only by applying conventional periodontal therapy as scaling and root planning?
vi. sIs it possible to induce experimental periodontal disease only by seeding periodontopathogenic bacteria in a group of teeth without a predisposing risk factor as a ligature around the teeth?
These are only some of the many questions that we can still ask about the periodontal disease. Do general dentists really know what periodontal disease is and really know how to treat it?
For more Lupine Publishers Open Access Journals Please visit our website:
http://lupinepublishers.us/
For more Open Access Journal on Dental and Oral Health articles Please Click Here:
https://lupinepublishers.com/dental-and-oral-health-journal/
To Know More About Open Access Publishers Please Click on Lupine Publishers
41 notes
·
View notes
Text
Scientific Student Societies: A Way of Scientific Research Vocations Boosting| Lupine Publishers

Journal of Surgery | Lupine Publishers
Abstract
Born in Russia at the end of the XIXth century the Scientific Student Societies have developed a rather original way of initiation and involvement of the young in the scientific research during High School and University cursus. All through the XXth century and up to now, they have given several generations of Russian scientists an adequate pre formation consisting not only of skill acquisition in their future speciality but also in planning, realization and organization of scientific research and sharing of its results. Their popularity was also due to the high degree of initiative and autonomy left to the students.
Abbreviations: SSS: Scientific Student Societies
Introduction
In our days, when most of young people with a diploma of physician are no more inspired by a scientific career possibility, and though Occidental World has general negative opinion about Russia and its institutions, it is not forbidden to exhume some moments which have proved efficacy and may be useful for.com now. Such an interesting institution (from my point of view) was the Scientific Student Societies (SSS) [1], existing in all the High Schools and Universities, but may be especially activated in Medicine Faculties. They were created in the end of XIXth century by famous scientists such as VI Vernadski (Figure1) and his colleagues in Sankt Petersburg (1882) and in the beginning of the XXth century by NE Jukovski (Figure 2) in Moscow (1909) [1-4]. In the 30-ies they were reactivated and widespread through all the country. After the 2nd World War, SSS were also working in the other countries of the “East Bloc”. The links and experience exchanges were current between them (International meetings and conferences, scientific information share, student exchanges and so on). Presently in the XXIth century they have not disappeared: “NIRS” - student scientific research work - remains a preoccupation of the academic staff in Universities and High Schools as well as different Ministries of the Russian Federation. Student scientific associations still exist, may be a little modified, sometimes independently as “Meridian”, “Luch” (that means ray or beam). Books including scientific articles written by students are still published [5-7], regional and national competitions are organized.
Figure 1: Vladimir Vernadski (1863-1945) famous chemist and mineralogist, creator of the first student scientific circles in Russia.
Figure 2: Monument to NE Jukovski (1847-1921) - The “Father of Russian Aviation” - in the Entry Square of the Petrovski Palace (Aviation school) in Moscow.
Description and Commentaries
The SSS aims were: to popularize scientific research among students, to find out the most talented among them and to help them to develop towards an eventual scientific career. It was also a mean for students to acquire deeper knowledge in one or several disciplines and to choose their future speciality. The Student Scientific Circles eventually provided the departments with qualified helpers, as a just return for the teaching staff mobilisation during the young researcher’s formation. The structure schema of the SSS is presented in Figure 3. At the basis level was the Circle. As soon as they wanted, students were invited to join a student scientific circle by the department of their choice and to begin their initiation according to their trends with one of the assistant or docent. At this level, the students learned step by step how to manage scientific literature, to review it, to deepen their knowledge’s in the chosen subject, to acquire technical skills and, last but not least, to participate to the research of their mentor/supervisor, or even to start their own investigations on their personal research topic.*NB. The work performed within the SSS activity differed from end of cycle obligatory works, but the members of SSS were allowed to include their personal data in the end of cycle work, if it was adequate. The students - members of a circle - elected their president - responsible who organized periodic reunions for reviewing the work performed by the circle members. During these meetings experienced assistants and docents or professors were invited to present lectures or demonstrations helping the students to assess the peculiarities and the research specifics of the discipline (Figure 4). The best student ‘works were selected and recommended for reporting at Faculty and inter Faculties student scientific conferences.
Figure 3: Schema of a Student Scientific Society structure.
Figure 4: Professor SHOR GV (1812-1944) - well known Pathologist - with students at a meeting of the student scientific circle of Pathologic Anatomy in the 30-ties.
The next level was Faculty and University or High School Scientific Student Society. The department circles joined forming faculty and institute Student Scientific Societies (SSS), which were gathered as University or High School SSS. They were handed by students and only supervised by a responsible chosen among docents and professors of the Faculty. Students elected their president and delegates for contacts with other faculties, institutes of the country and of foreign countries. They organized faculty conferences, Inter-faculty scientific sessions. Their activity was financed either by the Professional Union of their School or by the University budget. The most promising students - members of SSS were further recommended for scientific work either in the department where they started their work, or in Scientific Research Institutes and other High School Faculties (according to the young specialist’s will and the possibilities of the aforementioned institutions). The Ministries took into account the SSS activity of the young specialist when his future was considered after the end of his cursus. Besides career start consideration, other awards were current: scientific books, scientific travels, being the co-author of a “chief’s paper, and so on. So the students made acquaintance not only with the individual searching process itself (Figure 5), but also with elements of organizing scientific research, co-operative investigation, discussion and peer evaluation of its results both by other students and by the Faculty staff scientists. Students also learned to communicate at different levels and, if they wanted, to prepare themselves to a scientific career. If not, nevertheless the aptitudes obtained during their work in the SSS was precious for their further professional activity: acquaintance with special literature research methods, reviewing and critics of scientific publications, acquisition of some technical skills, capacity to plan scientific research and organize scientific meetings.
Figure 5: Students at Research work in a Technical High School in the 80-ies.
It is estimated that about 20% of the students attended the SSS. Among them about 30% have presented a valuable work (compilation, fundamental or applied research). Most of the exmembers of SSS have pursued a career in the previously chosen specialty. In Russia, all through the years 1930-1990 and up to now most of those who have followed a successful scientific or pedagogic career, were ancient members of the SSS. (That does not mean that without SSS a scientific career was not possible). Many of the students, even foreigner hosts, who have passed through this “school” have been later eminent scientists of their countries (for instance: Academician VI Shumakov - the first Director of the Transplantation Institute in Moscow, Professor VM Filipov - present Rector of the Russian University od People Friendship; Professor R Roman Ramos - Dean of the Medicine Faculty of the Mexico Autonomous University)
Conclusion
The SSS have given several generations of motivated Russian scientists an adequate pre formation consisting not only of skill acquisition in their future speciality (especially precious in surgical disciplines) but also in planning, realization and organization of scientific research and share of its results. This was capital for a developing country and remains important nowadays. The large autonomy and initiative given to the students in the SSS has certainly contributed to their popularity and success. This experience ought to be adapted to the conditions of our present society development and could enhance individual initiative and motivation, as well as collective research organization. It ought to be included into Faculties staff task and financing.
To know more about Journal of Surgery click on https://lupinepublishers.com/surgery-case-studies-journal/index.php
To know more about Lupine Publishers Click on https://lupinepublishers.us/
Follow on Linkedin : https://www.linkedin.com/company/lupinepublishers
Follow on Twitter : https://twitter.com/lupine_online
39 notes
·
View notes
Text
Lupine Publishers | Assessment of the Application of Micro-Irrigation Systems and Calculation of the Definition of its Economic Efficiency in the Conditions of Azerbaijan

Lupine Publishers | Agriculture Open Access Journal
Annotation
For a well-known purpose in 2010-2015, Guba-Khachmaz RAEM, Tartar and RAEM Shamakhi TSB have been confirmed by numerous research findings in the field of mountain watering, in terms of the development of irrigation, the mountainous slopes include soybean, sugar beet, trees, and germination (barley, wheat, etc.), the microcirculation method was not cost-effective in terms of efficiency, and preventive measures such as surface soil wash, sliding, irrigation and drowning, erosion characteristic for mountainous terrain zones , which is of particular importance, confirms the feasibility study of the farm calculated with the following formula.
Keywords: Leakage, Micro-irrigation, Investment,Bringing costs, Irrigation
Introduction
(Figure 1) Rapid growth of the world population, limited land plots, lack of fresh water resources, environmental degradation, climate variability and so on. problems have highlighted the problem of food humanity, which in turn requires proper regulation of land protection and improvement of the public administration mechanism of land resources. From this point of view, 60% of the land with difficult relief and complex natural climatic characteristics has been eradicated from the threatened state of the intensive development of mountainous zones and has been partially implemented in order to rehabilitate the fertility of these areas in the direction of agricultural destination, The scientific and economic importance of irrigation irrigation systems for progressive water is an undeniable fact. In this regard, it is aimed to calculate the effectiveness of these irrigation systems with more accurate method and methodology. The calculation of the economic efficiency of the use of the microscopy in terms of production experience with respect to the application of the application of the microscopy is considered to be one of the key factors.
Figure 1:
The Course of the Study
In accordance with the methodology for determining the importance of the application of new techniques and technology applied to the existing agricultural sector, the annual economic benefit obtained by the application of sugar beet micro-gradient is as follows:
Equation 1:
here w1 and w2 [1] hectares base case and new sources for the introduction of products owned by agricultural practices directly with the account mentioned costs; with USD. TS TS and -1 hectares base case and new sources of agricultural techniques involved, giving accounts belonging to the production plant; from USD. And [2] -annual volume applicator, ha. He compared to the sources of new methods for sufferers of traditionally implemented furrows watering sources. Ammortizasiya countries, major industrial distribution ammortizasiya popular norma and fond of Shamil running costs and repair costs in “Sojuzvodproekt”-n recommendations methodological guidance mainly accredited [3]. And studied at the settlement, belonging to the current irrigation natural indicators (parameters) Importance of the importance of Daka important elements in analysis. Micro-irrigation’s a series of hail shower processes physiological Mammary sugar, basic version compared to 20% to stimulation, he believes qn (cf. 1). From the table, July-October, months hang sources. This product is comparable to a 32.4% microscope option and down to the country’s product range of 54.3s/ha. In this difference, serious sources of water are effective (Table 1). This is the largest amount of supplies in the United States dollars volumesopposite or complementary sources of water is to take prices production Shehzad (increment) is generally characterized by (Table 2 ). Table 2 also available with situations mentioned, mikrosuvarmada/1 cents to get additional product name şırım Deng with sh 2-2, 5 times less water to spend relatively olunurki and that the sources of saving water [4]. Economic comparative efficiency sources for questioning, is the microelements macro and cotton from sugar beet using micro-irrigation with an additional set of products that have been achieved before Wahid overloaded costs the cost of establishing the system of mikrosuvarma, according to the variant set of products in production costs (labor, land cultivation) taken into consideration and s. (Tables 3 & 4). the report results Table 5-inch Micro-irrigation is generally characterized by observable short produced sugar beet , Ana Rajendra indicators during PA effectiveness will depend on several noted:
Table 1: Effect of yield of sugar beets from Micro-irrigation.
Table 2: Sources of water in the production of effective use of for sugar beets (July-October months average).
Table 3: According to agricultural cultivation and maps of harvest sugar beets.
Table 4: According to agricultural cultivation costs spent cards and harvesting of sugar beet.
Table 5: Economic evaluation of sugar beet micro-irrigation.
a) New Micro-irrigation technology application gives you the opportunity to increase the sources of water this means 90%, so the sources of water for more than 2 times in savings;
b) Labour cost fee-owned SH 3 has dropped from more than times;
c) Traditional furrow irrigation sugar beets is compared with an embedded micro-irrigation systems from annual economic income of $959.6, for reality in 3’s provinces from additional 1 hectare reclaimed area average investment return in the year.
Ecology of economically reliable, efficient and economic point reasonable are one of the sources who develop it worshipped the mikrosuvarma experience scientific institutions in our country system, produced the social sphere, pole təsərrüfanlarında and other qurumlarında to be self-sufficient it is spread wide, this mountain was regarded [5] agriculture as sources to use to obtain ownership of agricultural bitkilərindən Ecology of the retrieval of a set of products enables you to clean it. Now 25 metres below according to main, Nagorno positions in the zone zonada duties YAP torpaqlarında area management and mikrosuvarmanın economic efficiency identification and here is the production they created new gardens and Vineyard development of Fame main götürülərək system applied to them economic to be evaluated. That’s on top of research appointed economic efficiency will depend on several, which Yao 0.5 ha area Shamakhy region Soil a new worked asked Alma and pears arrested for ties and studied. Economic efficiency here is never possible. So that, a new 2-3 only after liberation and other in the morning pears GH property [6].
But despite this, they separate the option of economic efficiency of alloy conditions, shrink microwave for conditions for şəraitləri conditions comparative effectiveness of efficiency (roofing, lubrication, cultivation of agrotechnical program, the establishment of the microwave system sources and costs and phenology on the economic implications of the observed comparative effectiveness of efficiency fully aware. Table 5 mikrosuvarma ((roofing, lubrication, etc.) creating a system of actual expenditures and for fruit (pears) proqrama cultivation of agrotechnical program for current expenditure. Information that, 1 ha of orchards in the establishment of the microwave system you want to belong to the largest expenses 1006 USD. Use this operation despite the expenses without electric power less than many water sources explains, because that same value (1m3 in 0.0041 dollars) compared to 0.27 against $. irrigation is equal to $0.7. Low intensity (Dadia wildlife sources incarnation) sources, sources of water systems using in roaming which as a result of the current 2.6 2.4 times too low expenses time reduction seconds. At the same time, low intensity sources bathing condition unlike the reserves compared with in the ground present in tree fruit thanks to physiological activity stimulates moisture [7] (Table 6).
Table 6: Effect of yield of sugar beets from Micro-irrigation.
Note
a) Low-intensity (micro drip irrigation sources hot and s.) the establishment of a system of recurrent expenditure sources really $606 is because locking-pumps 400 USD, establish stocks of some unwinding of the following. This natural water in the summer, it is considered that the lack of ownership of water scarcity in the country, its water will be used from another source (small reservoirs) necessary.
b) ASMO is an integral part of the technology systems for automated control system is not given for free, so, in a small area and also in the objects of study due to its great expense and it is not installed in the system account is not maintained Therefore, the record.
https://lupinepublishers.com/agriculture-journal/pdf/CIACR.MS.ID.000140.pdf
For more Lupine Publishers Open Access Journals Please visit our website: https://lupinepublishersgroup.com/
For more Agriculture Open Access Journal articles Please Click
Here: https://www.lupinepublishers.com/agriculture-journal/
To Know More About Open Access Publishers Please Click on Lupine publishers
Follow on Linkedin : https://www.linkedin.com/company/lupinepublishers
20 notes
·
View notes
Text
Lupine Publishers| Domestication and Responses of Wheat (Triticum aestivum L) Growth, Yield Parameters, Quality Indices and Soil Fertility improvement to Different Organic Fertilizers

Lupine Publishers | Agriculture Open Access Journal
Abstract
Purpose:Field and nursery experiments were conducted in Akure in the rainforest zone of Nigeria to evaluate the effects of woodash, pig, goat and poultry manures on the soil fertility improvement, growth, grain yields parameters, crude fibre, crude ash, protein and nitrogen of wheat (Triticum aestivum L) in 2014 and 2015 cropping seasons.
Methods.The four (4) organic fertilizer treatments were applied each at 6t/ha with a reference treatment NPK 15-15-15 fertilizer applied at 300kg/ha and a control treatment which were replicated four times and arranged in a randomized complete block design.
Results:The results showed significant increases (P<0.05) in the soil nutrients, growth and grain yield, crude fibre, protein, nitrogen, crude ash, straw yield and root biomass of wheat under different organic fertilizers application compared to the control treatment. The highest values of wheat plant height, leaf area, number of tillers, stem girth, number of spikelets/plant, leaf population, straw weight, root biomass, grain yields, crude fibre, crude ash, nitrogen and protein were obtained with the application of poultry manure followed by NPK 15-15-15 fertilizer, pig, goat manures and wood ash respectively. Wheat grains yield, straw weight, root biomass, crude fibre, % nitrogen, crude fibre and crude ash, plant height leaf area, number of tillers, stem girth, number of spikelets/plant and leaf population increased by 13%, 2%, 1%, 27%, 33% , 33%, 27%, 14%, 10%, 2%, 11% and 15% respectively with the application of poultry manure compared to NPK 15-15-15 fertilizer. Wood ash application produced the highest values of soil pH, K, Ca and Mg while the application of poultry manure treatment gave the highest values of Soil O.M, N and moderate values of P, K, Ca and Mg. NPK 15-15-15 fertilizer application decreased soil O.M, Ca, Mg and had the highest K/Mg, K/Ca and P/Mg ratios of 85:1, 127:1 and 1280:1 compared to 3:1 K/Ca, K/Mg 4:1 and P/Mg 57:1 in poultry treatment.
Conclusion:Poultry manure applied at 6t/ha gave the best results in improving soil properties, growth, grain yield crude ash, crude fibre, nitrogen and crude protein of wheat and this was because of its balanced nutrient contents and the least C/N ratio which enhanced faster decomposition and uptake of nutrients.
Keywords: Domestication; Growth; Yield of wheat; Soil fertility improvement; Proximate analysis and organic fertilizers
Introduction
Wheat (Triticum aestivum L) belongs to the family Poaceae (Gramineae) and originated from Ethopian Highlands [1]. Wheat is one of major crop in the temperate countries used for human food and livestock and can be grown in different agro-climatic zones Iftikhar [2] and Hussan [3]. Shewry [4] reported that wheat whole grains contributed essential amino acids, minerals, vitamins, beneficial phytochemicals and dietary fibre components to the human diet. Besides, wheat grain is a staple food used to make flour for leavened, flat, and steamed breads, biscuits, cookies, cake, breakfast cereal, pasta, noodles, fermented alcoholic beverages (beer) and biofuel Sharma [5]. They reported further that the gluten protein fraction in wheat confers the visco-elastic properties that allowed the dough to be processed into above mentioned food products. Shewry [6] also explained that high content of starch (60- 70%) in wheat whole grain and relatively low protein content (8- 15%) made the crop still important source of calories and protein for human and livestock nutrition. Therefore, the nutritional importance of wheat proteins should not be under estimated particularly in less developed countries where bread, noodles, burger and other products provide a substantial proportion of the diet. Despite the economic and nutritional importance of wheat cultivation in Nigeria and other African countries, its production output has not met the current high demand by the people because of low yield. The wide gap in the supply and demand for wheat in Nigeria has put serious pressure on the country foreign exchange reserve. Central Bank of Nigeria CBN [7] reported that Nigeria spent N1.30 trillion naira annually to import wheat for domestic and industrial uses which cannot be sustained because of dwindling oil prices.
The trend of low wheat yield could be attributed to factors such as lack of improved agronomic practices for its cultivation by farmers, vagaries of weather conditions and climate change, shortage of sufficient water and mineral nutrients, effects of pests and diseases and increased population pressure on land which allowed continuous cultivation without fertilizer use. Therefore, different efforts meant to increase soil nutrients (i.e soil fertility improvement) are limited by high cost of inorganic fertilizers and the effect of the continuous use of such fertilizers on the destruction of soil properties Moyin [8]. Current and future concerns for researchers, agronomists, food policy makers and processors are to look for ways of sustaining increased wheat production and quality with reduced inputs of agro-chemicals, inorganic fertilizers and encouraged massively the use of low cost organic fertilizers for both human and livestock nutrition. This justifies the need for the use of poultry, pig, goat manures and woo dash as source of fertilizers for soil fertility improvement in this research study. In-addition, wheat has not been widely domesticated in Nigeria, West African countries and other regions in the world with similar climatic conditions. The few farmers growing wheat in the Northern regions of Nigeria where rainfall is very low (600mm/ annum) depended heavily on irrigation which is very expensive, technical and increased the cost of production. However, there have been no traces of wheat cultivation in the South West Nigeria, where rainfall is bi-modal between 1000-2064mm per annum and annual temperature between 29 -32oC. Feldman [9] reported that provision of sufficient water, mineral nutrients and effective control of pests and diseases were important for high yields of wheat.
Now that there is an increasing climate change effects in Nigeria and throughout the world, thus neccesitating an urgent need to encourage farmers in Southern region of Nigeria, West African countries and other regions in the world with similar climatic conditions to domesticate wheat cultivation on commercial basis under rainfed agriculture especially the second peak of raining season between July and November using low cost organic fertilizer inputs. Having reviewed literature critically, there is a paucity of research information on the use poultry, pig, goat manures and wood ash on the growth and yield parameters of wheat except the works of Jubrin [10] on the effect of poultry manure on herbage production of wheat, Abdul [11] using NPK fertilizers on growth and yield of wheat and Jabbar [12] who worked on effect of potassium application on yield and protein contents of late sown wheat. The choice of wood ash, pig, poultry and goat manures as sources of organic fertilizer materials in the research study was due to their availability and abundance in large quantities from the study area and the surrounding communities where majority of the farmers are cassava growers with associated processing mills, poultry, pig and goat producers.
Purpose of the experiment
The following research questions would be answered for the experiment (a) Is there any significant difference between the applied organic fertilizers on growth and yield parameters of wheat? (b) Is there any significant difference between the applied organic fertilizers and post cropping soil properties?
The objectives of the research work are to (a) determine the effect of poultry; pig, goat manures and wood ash on the growth, yield and quality parameters of wheat (b) determine the effect of these organic fertilizers on post cropping soil properties.
Materials and Method
The nursery and field experiments were carried out in Akure, South West in the rainforest zone of Nigeria (elevation 10m 7o 151N, 5o 151 E) in 2014 and was repeated in 2015 to validate the results. The climatic data for 2014 and 2015 is presented in Table 1 while the soil is loamy sand, skeletal, kaolinitic, isohyperthomic oxic paleustalf (Alfisol) Soil Survey Staff [13].
Table 1: The Climatic data for Akure in 2014 and 2015.
Source: Agro-climatology Department Ondo State Ministry of Agriculture
Pre cropping Soil Sampling and analysis
30 core samples were collected from 0-15cm depth, bulked, air-dried, sieved with 2mm sieve for routine analysis. Soil P was extracted by Bray P1 extractant and the extract was developed on Murphy blue coloration and determined on a spectronic 20 [14]. The soil pH (1:1 soil/water and 1:2 soils/0.01M CaCl2) was read on pH meter Crockford [15]. The organic matter was determined using wet oxidation method through chromic acid digestion Walkley [16]. Soil. K, Ca, Mg and Na were extracted with 1M NH4OAC pH7 and their contents K, Ca and Na were read on the flame photometer [17] while Mg content was read and determined on atomic absorption spectrophotometer. The Soil N was determined using the micro Kjedahl method. Jackson [18] while the micronutrients (Fe, Cu, Zn and Mn) were extracted with 0.01M HCl and read on atomic absorption spectrophotometer. Parricle size analysis was carried out using hydrometer method Bouycous [19].
The soil pH 5.63 showed that the soil is slightly acidic. The soil organic matter 0.34% and soil available P 5.22mg/kg were far below 3% O.M and 10mg/kg P critical levels recommended for sustainable crop production in South West Nigeria Agboola [20]. The soil exchangeable bases (K, Ca, Mg and Na) were below 0.20mmol/ kg recommended critical level in the study area Folorunso [21]. The soil textural class is loamy sand while the micronutrients were sufficient for crop production; higher than 5.0mg/kg Fe, 3.0mg/ kg Zn, 1.0mg/kg Cu and Mn 1.5mg/kg critical levels respectively Adeoye [22]. The soil N content of 0.05% was lower than 0.15% N critical level recommended for crops by Sobulo [23] (Table 2 ).
Table 2: Pre-cropping soil analysis for wheat.
Sources and processing of organic fertilizers used for the experiment
Poultry, pig and goat manures were obtained from the 10,000 poultry birds, 500 pigs and 500goats in the livestock unit of Federal College of Agriculture, Akure while the wood ash was obtained from the large scale cassava processing unit which processed cassava tubers from 10,000 hectares of cassava farm in the same institution. NPK 15-15-15 fertilizer was purchased from Agricultural Development Programme (ADP), Akure Ondo State while the imported wheat seeds (Durum L) were also purchased from a certified seed company, Agro-Farm enterprises, Akure Nigeria. The organic fertilizer materials were processed; wood ash was sieved with 2mm sieve to remove pebbles and charcoals while poultry, pig and goat manures were cured before application.
Chemical analysis of the organic fertilizers used
Two (2) grammes each of the processed organic fertilizers were analysed. P, K, Ca and Mg analysis was done using wet digestion method based on 25-5-5ml of HNO3–H2SO4-HCLO4 acids while Nitrogen (N) content was determined by the kjedahl method Jackson [18]. Table 3 presents the chemical analysis of the organic fertilizers used for the research experiment. Poultry manure had the highest values of N, P and least value of C/N ratio followed by pig, goat manures and wood ash respectively. The wood ash had the highest values of %K, Ca, Mg, Fe Mn, Cu and Zn respectively. Its highest C/N value of 11.76 might delay decomposition and quick release of nutrients to crops when compared to poultry, pig and goat manures respectively. The NPK 15-15-15 fertilizer had 15%N, 15%P and 15%K nutrient contents respectively.
Table 3a: Pre-cropping soil analysis for wheat.
Table 3b: Pre-cropping soil analysis for wheat.
Nursery establishment for wheat seedlings
Land clearing with packing of debris where carried out followed by construction of bamboo made of erected bamboo poles and covered on the top with moderate spread of palm fronds. Ten nursery beds with a size of 4mx4m each were prepared. The wheat seeds (durum L) variety were sown in June manually into rows spaced at 20cm apart, covered lightly with soil, watered regularly twice a day (morning and evening time) to aid good seeds germination and establishment of seedlings. Germination of wheat seeds occurred four days after planting and seedlings were nursed for 3 weeks before transplanting. The nursery experiment is important because direct sowing of wheat seeds on field will not bring out healthy seedlings with high germination percentage, thus, the use of shade structure was to control the prevailing temperature for higher rate of seeds germination to plant on large scale field.
Field Experiment
The experimental land was cleared, ploughed, harrowed and marked into different plots. Each plot size was 5mx5m (5m2). There were four organic fertilizer treatments, namely wood ash, poultry, pig and goat manures, applied at 6t/ha with a reference treatment NPK 15-15-15 fertilizer applied at 3000kg/ha and a control treatment (no fertilizer application). The experiment was arranged in a randomized complete block design and replicated four times. The choice of 6t/ha for wood ash, pig, goat and poultry manure for this research was based on the research works of Folorunso [24] and Moyin Jesu [25] on determination of soil critical levels for N,P,K, Ca and Mg using organic fertilizer materials and concluded that application of 6t/ha was the best critical level for optimum crop yield in the study area.
The incorporation of the organic fertilizers into the soil was done one week before transplanting the wheat seedlings using hand trowel. Twenty one day old wheat seedlings were transplanted to the experimental plots at 20cm spacing between rows and 5cm within rows on July, 2014. After transplanting, watering was carried out every morning and evening for one week for full establishment of seedlings. Tillering of wheat seedlings started at 4 weeks after transplanting. Weeding operation was done manually 14 days after transplanting and continued at three (3) weeks interval until harvest. Wheat seedlings were sprayed with Avesthrin (Cypermethrin 10EC) at 10ml/litre of water at 3 weeks interval until 9 weeks after transplanting to control leaf defoliating insects and other pests of wheat.
Wheat growth parameters such as plant height (cm), number of tillers, number of spikelets, leaf population, stem girth (cm) leaf area (cm2) and plant population were measured starting from 15 days after transplanting (DAT) until 70 days after transplanting. The leaf area was estimated using the non-destructive and accurate method of Pandey and Singh (2011) based on determination of individual leaf area using a simple equation leaf area (cm2) =x/y where x is the weight (g) of the area covered by leaf outline on a millimeter graph paper and y is the weight of one cm2 of the same graph paper. The formation of panicles in wheat started between 7–8 weeks after planting. At 12 weeks after planting, harvesting of matured wheat panicles at 15% moisture started for each treatment as they attain maturity, the panicles were cut from the base using knives, weighed (kg), bagged and sun dried for five days to attain 13% moisture content. The dried panicles were threshed to remove carefully the wheat grain yield and weighed per each treatment plot. The weight of wheat straw and root biomass were also measured to determine the ratio between the grain yields and shoot weight.
Proximate analysis of wheat grains
2 grammes each of wheat grains per treatment were weighed into crucibles and placed in a muffled furnace for 6 hours at 450oC. Thereafter, ash was allowed to cool down, made into solution and filtered to obtain clear solution through which the crude fibre,nitrogen, crude protein (%N x6.25) and crude ash were determined as described by AOAC [26].
Post cropping soil analysis
Soil samples were collected after harvesting from each of the treatment plot, bulk together, air-dried, sieved and analysed for soil N, P, K, Ca, Mg, pH and O.M as earlier described for pre-cropping soil analysis.
Statistical Analysis
All data collected on the growth and yield parameters of wheat were subjected to Analysis of Variance (ANOVA) F-test and their means were separated using Duncan Multiple Range Test at 5% level of significance Gomez [27].
Results
The growth parameters of wheat plants under different organic fertilizer treatments between 15 and 70 days after transplanting Significant increases (P<0.05) in the wheat plant height, leaf area,number of tillers, stem girth, number of spikelets/plant and leaf population under different organic fertilizers compared to the control treatment (Table 4a & b). The highest values of wheat plant height, leaf area, number of tillers, stem girth; number of panicles per plant and leaf population were obtained with the application of poultry manure followed by NPK 15-15-15 fertilizer, pig, goat manures and wood ash respectively. When compared with NPK 15- 15-15 fertilizer, poultry manure increased wheat plant height, leaf area, number of tillers per plant, stem girth and number of panicles per plant by 14%, 10%, 2%, 11%, 15% respectively except leaf population where NPK 15-15-15 fertilizer increased the parameter by 3% more than poultry manure. Pig manure also increased the plant height, leaf area, and number of tillers, stem girth, number of panicles and leaf population by 1%, 14%, 33%, 3%, 8% and 23% respectively compared to the goat manure. The wood ash treatment application increased moderately the values of wheat growth parameters while the control treatment where there was no fertilizer application had the least values of growth parameters.
Table 4a:
Treatment means within each column followed by the same letters are not significantly different from each other using Duncan Multiple Range Test at 5% level.
Table 4b : The growth parameters of Wheat under different organic fertilizer treatments.
Treatment means within each column followed by the same letters are not significantly different from each other using Duncan Multiple Range Test at 5% level.
Effect of different organic fertilizers on the yield parameters of wheat
There were significant (P<0.05) increases in the wheat grains yield (kg/ha), straw weight and root biomass under different organic fertilizer treatments compared to the control treatments (Table 5). The highest values of wheat grain yields, straw weight and root biomass (kg/ha) were recorded with the application of poultry manure followed by NPK 15-15-15 fertilizer, pig, goat manures and wood ash respectively. Application of poultry manure increased the wheat grain yield, straw weight and root biomass by 13%, 2% and 1% compared to NPK 15-15-15 fertilizer. In-addition, it was observed that the wheat straw yield and root biomass values in NPK 15-15-15 fertilizer were slightly higher than the pig goat, manures and wood ash respectively. Pig manure increased wheat grain yields, straw weight and root biomass by 16%, 2% and 12% compared to wood ash. The goat manure and wood ash increased moderately the yield parameters of wheat while the control treatment where there was no fertilizer application had the least values of wheat yield parameters. The higher straw yield and root biomass of wheat in all the treatments also gave an indication of their potential uses as fodder, hay and silage for animals in the study area.
Table 5 : The yield parameters of Wheat under different organic fertilizer treatments.
Treatment means within each column followed by the same letters are not significantly different from each other using Duncan Multiple Range Test at 5% level.
Proximate analysis of wheat grain yield under different organic fertilizer treatments
The % crude fibre, %N, % crude protein and % crude ash of wheat grains increased significantly (P<0.05) under different organic fertilizer treatment compared to the control treatment (Table 6). The poultry manure application produced the highest values of wheat grains crude fibre, %N, % crude protein and crude ash followed by pig, goat manures, wood ash and NPK 15-15-15 fertilizers. Poultry manure treatment increased the wheat grains % crude fibre, %N, % crude fibre and crude ash by 27%, 33%, 33% and 27% respectively compared to NPK 15-15-15 fertilizer. Among the organic fertilizer treatments, poultry manure had the highest values of % crude fibre, %N, crude protein and crude ash compared to pig, goat manures and wood ash. Pig manure increased the % crude fibre, %N, % crude protein and crude ash by 16%, 17%, 17% and 11% compared to wood ash while the control treatment with no fertilizer application had the least values of wheat grains %N, crude protein, crude ash and fibre.
Table 6 : Proximate analysis of wheat grain yield under different organic fertilizer treatments.
Treatment means within each column followed by the same letters are not significantly different from each other using Duncan Multiple Range Test at 5% level of significance.
Post-cropping soil chemical composition under different organic fertilizers after harvesting wheat.
The soil pH, O.M, N, P, K, Ca and Mg increased significantly (P<0.05) under different organic fertilizer treatments compared to the control treatment (Table 7a & 7b). Application of poultry manure increased soil N, Ca, Mg, pH and % O.M by 5%, 98%, 95%, 24% and 90% respectively compared to the NPK 15-15-15 fertilizer. However, NPK 15-15-15 fertilizers increased slightly the soil P and K by 2% and 9% respectively compared to the poultry manure. The NPK 15-15-15 fertilizer also decreased soil pH and O.M. Among the organic fertilizers, poultry manure treatment produced the highest values of soil N, P, and O.M closely followed by pig, goat manures and wood ash treatments. In-addition, wood ash also had the highest values of the soil K, Ca, Mg and pH compared to others.
Table 7a : Proximate analysis of wheat grain yield under different organic fertilizer treatments.
Treatment means within each column followed by the same letters are not significantly different from each other using Duncan Multiple Range Test at 5% level.
Table 7b : Soil Chemical Composition after harvesting wheat under different organic fertilizers.
Treatment means within each column followed by the same letters are not significantly different from each other using Duncan Multiple Range Test at 5% level.
Poultry manure treatment increased the soil N, P and O.M by 30%, 60% abd 20% compared with goat manure while wood ash treatment increased the soil K, Ca, Mg and pH by 11%, 20%, 23% and 4% respectively compared to the poultry manure treatment. The values of soil K/Ca, K/Mg and P/Mg ratios in NPK 15-15-15 fertilizer treatment were 127:1, 85:1 and 1280:1 respectively compared to K/Ca (3:1), K/Mg (4:1) and P/Mg (57:1) ratios in poultry manure treatment. The control treatment where there was no fertilizer application had the least values of soil N, P, K, Ca, Mg, Soil O.M and pH.
Discussion
The control treatment had the least values of growth, yield parameters, proximate analysis of wheat and soil properties after harvest and this was due to low soil nutrient status before planting, hence, there is need to incorporate fertilizers to the soil to improve the performance of these growth, yield and soil parameters in wheat. This was in line with Moyin [28] who reported that organic fertilizers applied at 6t/ha increased the soil and leaf, N, P, K, Ca and Mg concentrations which resulted into an increase in soil pH, O.M content and growth parameters of Coconut seedlings. Similarly, Maqsood [29] reported that the cereal grains and stover yields increased by 37% and 49% respectively when fertilizers were incorporated compared to when there was no fertilizer application. The significant increases in wheat plant height, number of tillers per plant, number of spikelets/plant, leaf area stem girth, straw yield, root biomass and grain yields obtained with the application of poultry manure compared to others might be due to its rich and balanced nutrients (N,P,K,Ca,Mg ) and least C/N ratio which were made available to wheat crop very quickly for uptake and sustainable performance. This result agreed with the findings of Jubril who reported that higher number of wheat tillers obtained with 7.5t/ha of poultry manure might be attributed to the more readily available nitrogen which played a vital role in cell division. In-addition, Abdul [11] also reported that wheat has high requirement for nitrogen (N), potassium (k), phosphorus (P), Zinc and sulphur. The deficiency of nitrogen either organic or inorganic forms to wheat will lead to stunted growth and low yield.
Parveen [30] also reported that nitrogen significantly affected the plant height, fertile tillers, number of spikelets, 1000 grain weight and grain yields of wheat. This was because nitrogen played an important role in plant metabolism which increased better seed development, seed maturity and grain production in wheat. The average grain yield of wheat obtained with the application of poultry and pig manures in this experiment compared favorably with the world average of 3010 Kgha-1 and China (4710kgha- 1) as reported by Abdul [11]. It is believed that planting of new high yielding wheat varieties adapted to the new environment will increase the average yield per hectare in the study area. Phosphorus is important as component of Ribulose 1,5 phosphate and phospho-glyceric acids in photosynthesis (ATP). Therefore,wheat is a C3 plant which makes use of sunlight to photosynthesize and produce phosphorus based product that subsequently led to higher grain yields. This observation was supported by Getachew [31]. who reported significant responses of wheat to phosphorus on nitosols in the Central Ethopian highlands. Besides, the prevailing temperature, rainfall amount and insolation hours (sunshine hours) in the study area (Table 1) might also be responsible for the good photosynthetic process and the yields of wheat even without irrigation as practiced in Northern Nigeria and other countries with low rainfall. Hence sustainable increases in wheat yields, depend on adequate level of water and nutrients.
The ratio of straw yield and root biomass to the grain yields of wheat in this experiment was very comparable to the ratio 2:1 obtained by Wang [32]. The straw yields and root biomass are potential sources of fodder and hays for the small and large ruminant animals (goats, sheep and cattle) as part of wheat value chain which is yet to be explored. Besides, the availability of these fodder and hays from wheat will reduce drastically the frequent conflicts between the farmers and normadic herdsmen in the study area and other regions of the world. The root biomass will enhance stability of the soils against erosion which can deplete soil nutrients; also, it will help to stabilize the wheat plants against lodging. This observation was supported by Fischer and Stapper [33] who reported that the use of organic manures reduces soil bulk density which promoted vigorous rooting in wheat and confers stability to the crops against wind attack and reduced lodging. Lodging in cereals also leads to significant reduction in the stover and grain yields. It was also observed that the high nitrogen content in NPK 15-15-15 fertilizer might be responsible for the excessive vegetative growth in wheat plants (i.e luxury consumption) which delayed maturity and subsequently the reduced yields of wheat compared to poultry manure. Besides, the application of NPK 15- 15-15 fertilizer at 300kg/ha led to nutrient imbalance as shown in the high soil K/Ca, K/Mg and P/Mg ratios which made nutrient availability difficult and the uptake of P, K, Ca, and Mg. This could also be responsible for the lower wheat grains yield, tillers, number of spikelets, root biomass and so forth. The above observation agreed with Moyin [34] who reported that continuous use of NPK 15-15-15 fertilizers and other chemical fertilizers promoted decline in soil organic matter, decrease uptake of K, Ca and Mg as well as increasing soil acidity. Increase acidity (low pH) significantly affected soil microbes activities (pseudosomonas, nitrosomonas and nitrobactor) which played active part in nitrogen cycle supply of nitrogen to the soils for crop use as reported by Odu [35].
Moyin [25] also reported that interactions of soil K/Ca, K/Mg and P/Mg in NPK fertilized soils will lead to nutrient dilution and could be responsible for the lower quality indices of wheat grain yield (crude fibre, crude ash, nitrogen and crude protein). Besides, Maqsood [29] reported excessive uptake of nitrogen would lead to luxury consumption and prolonged maturity leading to Nitrogen –phosphorus interaction in NPK 15-15-15 fertilizer application. The ultimate end is nutrient dilution and low yields of wheat. Nevertheless, this type N/P interaction was not noticed in the experiment conducted by Parven [30] using organic manures. The NPK fertilizers contained mainly N, P and K and very low traces of Ca and Mg. Tong [36] reported that excess nitrogen in chemical fertilizers might be leached downwards to pollute underground water. Calcium (Ca) has been reported to increase the root biomass which subsequently increased the nutrient uptake by wheat plants for high grain yields while Mg is also important in the formation of chlorophyll with nitrogen. This will encourage higher photosynthesis rate culminating into formation of high number of wheat tillers number of spikelets and grain yield as noticed in the poultry, pig, goat manures and wood ash fertilized plots in the experiment. The above observation was supported by Craighead and Martin [37] who reported that there was a significant increase in wheat grain yield, tillers and spikelets to Magnesium (Mg) fertilizer application.
Wood ash application to soils increased most the soil pH and this could be due to its having the highest values of K, Ca and Mg (exchangeable bases) which subsequently increased the soil buffering capacity and base saturation as observed by Moyin [29]. Besides, Obatolu [38] also reported that soil pH influenced nutrient availability and uptake of nutrients by crops. Potassium is important in wheat grains filling and formation, strengthening of plant stems, opening and closing of stomata and cell division for higher photosynthetic rate. This could be responsible for the better grain yield, number of tillers and spikelets of wheat in wood ash fertilizer treatment. This observation was also supported by Adu Daap [39] who reported that cocoa pod ash and wood ash increased the availability and uptake of soil K, Ca and Mg nutrients in soils. Owureke [40] reported that potassium is important in water conservation, enhancing flowering, fruit maturity and yield of crops particularly in pineapple. However, the highest C/N ratio of wood as compared to that of poultry and pig manures could hamper decomposition and reduced the release and uptake of nutrients. This could be responsible for the lower wheat grain yield, root biomass and growth parameters in wood ash fertilized plots. The processing of the organic fertilizers in this study helped to reduce their C/N ratios and the results obtained would have been extremely different if unprocessed organic fertilizers were used. Adebayo [41] reported that the C/N ratio of unprocessed saw dust and wood ash were 135:1 and 130:1 respectively, hence, the need for processing of organic fertilizers to reduce C/N ratio. The tillage practices such as ploughing and harrowing employed in this research were also important in the establishment of transplanted wheat seedlings in the field. The soils tilth was improved which made the seedlings to root easily and this reflected in the increased number of tillers, spikelets and grain yield of wheat as observed by Moyin [42] who reported that tillage practices significantly improved the establishment and yield of cabbage. Besides, the application of organic fertilizers such as wood ash, pig, goat and poultry manures reduced the soil bulk density and increased soil porosity as observed by Moyin [43] who reported that wood ash and the amended forms with poultry reduced significantly the soil bulk density and subsequently improved root development.
One of the major significant contributions of this study was the raising of wheat seedlings in the shaded nursery for full establishment in the field after transplanting. Direct sowing of wheat seeds in the field did not have good germination because of direct impact of weather (temperature and water stress). This observation was in line with the work of John [44] who reported that high temperature >35.4C and water stress were inimical to the growth of wheat at leaf initiation stage, shoot growth, vernalisation, terminal spikelets, anthesis and grain filling. The crude ash, nitrogen, protein and crude fiber contents of wheat grains in this study were very comparable and adequate when compared with 1.17 -2.96% crude ash, 8.3 -19.3% protein and 1:11–2% crude fiber obtained by Davis [45] indicating that the application of poultry manure, pig, goat and wood ash fertilizers increased the quality indices of wheat. Therefore, the significant improvement in crude fiber, ash and protein of wheat could be linked to the nutrient compositions of pig, poultry, goat and wood ash which translated to ensuring high quality indices. This observation was supported by Zuzana [46] and Davis [47] who reported that grains quality content such as carbohydrate, protein, minerals, crude fibre and ash were derived from crops when consumed by people. The intake of these nutrients would enhance sound health and productivity which would reduce the amount of money expended in buying synthetic drugs and supplements. Crude ash and crude fiber are reported to have beneficial effects in protection against heart disease, cancer, normalization of blood lipids, regulation of glucose absorption and prevention of constipation while protein is responsible for the body development and growth Flagella [48]. In-addition, another significance of this research work is that the successful domestication of wheat in South West Nigeria has opened wide opportunities in wheat value chains by providing raw materials for establishment of more confectioneries enterprises (baking breads, biscuits, cakes, cookies, pasta and noddles) which will bring more income for farmers and reduced the increasing rate of unemployment programmes.
This success could be replicated in all the Southern areas of West Africa (Benin, Togo, Ghana, Cote d’voure, Gambia, Liberia, Sierra Leone, Senegal and Gambia) and other regions in the world with similar climatic conditions. Furthermore, the domestication of wheat in South West Nigeria under rainfed agriculture in the second cropping season (July–Nov) has reduced significantly the cost of irrigation as being practiced in the Northern region of Nigeria, drier parts of Asian countries (Iran, Iraq, Syria etc) and African countries. The increasing effects of climate change in reducing the volume of irrigated water in dams coupled with extreme high temperature and low rainfall amount in the Northern parts of Nigeria and other drier regions in the world for wheat cultivation had created a serious threat to wheat production in the world, thus, increasing the wide gap of supply and demand for the crop. Flagella [49] reported that water stress adversely affected plant establishment, growth and cell development. It also diminishes photosynthesis and affect grain yield at milking and filling stage in wheat. However, it is suggested that further research studies should be carried out to develop more high yielding varieties of wheat that are adaptable to the climatic fluctuations, drought, pest and diseases resistance in Nigeria and other countries in the world willing to domesticate wheat cultivation on commercial basis.
Recommendation and Conclusion
The research work has shown vividly that the use of different forms of organic fertilizers namely pig, poultry, goat manures and wood ash applied at 6t/ha significantly increased the wheat growth, grain yield parameters, crude fibre, crude ash, protein, nitrogen qualities, soil pH, organic matter, N.P,K, Ca and Mg. Hence, it is recommended that poultry manure be applied at 6t/ ha to increase availability of essential soil nutrients, growth, grain yield parameters, crude ash, crude fibre, and nitrogen and protein qualities of wheat which would enhance sustainable production of wheat on commercial basis. In-addition, if there is scarcity of poultry manure in your environment, pig manure is also a good alternative to it in term of performance. Besides, the use of poultry manure would substitute for application of high quantity of NPK15- 15-15 fertilizer. This recommendation is very essential because the purchase of inorganic fertilizers by small scale and commercial farmers of wheat is very expensive/exorbitant. Also, the benefits of secondary/residual effects of these organic fertilizers on soil fertility improvement and enhancing sustainability of the environment must be considered as important
https://lupinepublishers.com/agriculture-journal/pdf/CIACR.MS.ID.000139.pdf
For more Lupine Publishers Open Access Journals Please visit our website: https://lupinepublishersgroup.com/
For more Agriculture Open Access Journal articles Please Click
Here: https://www.lupinepublishers.com/agriculture-journal/
To Know More About Open Access Publishers Please Click on Lupine publishers
Follow on Linkedin : https://www.linkedin.com/company/lupinepublishers
30 notes
·
View notes
Text
Lupine Publishers | Risk Stratification at Patients with the Defect Vessels and High Blood Pressure: New Mathematical Model

Lupine Publishers | Journal of Complementary Medicine
Short Communication
It is noted, that today the population of Uzbekistan unprecedentedly increases consumption of salt and have low physical activity in general. Besides for the last 25 years, the population of Uzbekistan was enlarged twice. Today such tendency of population increase is followed by its aging. The positive aspect of this phenomenon is augmentation of average life expectancy. However, a negative side that the augmentation of life expectancy doesn’t correspond to its quality. Deterioration first of all is bound to augmentation of prevalence of age chronic diseases, such as a hypertension. For example, today in Uzbekistan, one of three adults has raised by the ABP, and excess weight occurs at every second (WHO/STEPS 2014). As a result it caused double increasing of visits of the doctor and total number of patients in general. The purpose of our research was in developing the prognostic model of the turnpike arteries biological age at hypertensive patients. To study the arterial blood pressure daily profile at sick with the arterial hypertension (AH) with the metabolic syndrome (MS) [1].
Material and Methods
The study included 96 healthy volunteers and 96 men with arterial hypertension AH in average age of 56.06 ± 7.86 years, diagnosed abdominal obesity (BMI 34.54 ± 3.83 kg/m2) and metabolic disorders. In order to estimate the clinical status, the following risk factors were studied: elevated arterial BP, smoking; clinical and biochemical parameters: 12-lead ECG; 24-hour Holter ECG monitoring; exercise stress test; echocardiography (EchoCG); carotid artery intima-media thickness (IMT) [2,3].
Prognostic Model
We selected clinical signs for creation of the prognostic table by means of the method of the consecutive diagnostic procedure based on a technique of the sequential analysis offered by A. Wald. For each informative sign gradation of this or that indicator were selected to equal the diagnostic value of each of indicators (Figure 1). On the basis of local research grant analysis the calculator of risk was developed to provide patients with AH I-II -degrees the important prognostic information. We also considered that population of modern Uzbekistan have tendencies of negative impact at vessels damage such as: salt and the increased body weight. As a result, nine best factors for stratification of risk at patients with the defect vessels and raised SBP, including easy available, clinical parameters were included in this calculator (Figure 1). We applied multistage stratification of risk, based on nine parameters which were included in the developed equation of nine factors [4]:
Figure 1: Prognostic model.
(a-SBP; b- IMT intima-media thickness; s- Salt; d-smoking; e-age; *m- metabolic index *m= t x g / h2; i-BMI; t- Triglycerides, g- Glucose; h- HDL-C).
During this experiment, patients noted informational content of the calculator for the objective comprehension of their cardiovascular status (Sensitivity–85 %, Specificity–63%) (Table 1). However long-term preventive effect, in prevention of the recurrence was not confirmed [5-7].
Table 1: Example Clinical data.
Conclusion
On completion of the therapy clinical tests indicated the high sensitivity at average specificity model that was acceptable in an opportunity to estimate medical effect. Unfortunately, the calculator could show the rate of damage vessels in the cases of actual disease, but not in cases of its prediction or probable emergence.
For more Lupine Publishers Open Access Journals Please visit our website:
http://lupinepublishers.us/
For more Open Access Journal on Complementary & Alternative Medicine articles Please Click Here:
https://lupinepublishers.com/complementary-alternative-medicine-journal/index.php
To Know More About Open Access Publishers Please Click on Lupine Publishers
Follow on Linkedin : https://www.linkedin.com/company/lupinepublishers
Follow on Twitter : https://twitter.com/lupine_online
40 notes
·
View notes
Text
Lupine Publishers | Focusing on Food Security or Targeting the Economy: A Study on Maize and Cotton Production in Kandi Commune

Lupine Publishers- Environmental and Soil Science Journal
Abstract
Maize and cotton are two crops that are highly produced in North Benin. Their production has advantages as well as constraints. These advantages and constraints are taken into account in the choice of the producer to cultivate one of them. The objective of this study is to present, at first, the advantages and constraints that the producers of Kandi commune face on these two crops. It also aims to expose the producers’ preference according to the advantages and constraints listed by them. To achieve this, the data were collected in two districts of the municipality over a period of two weeks. Semi-structured interviews were conducted with fifty producers through an interview guide. Data processing was carried out using a dual approach (quantitative and qualitative) which, on the one hand, consisted in carrying out statistical tests and, on the other hand, analyzing the statements collected during the data collection. The main statistical test used in this study is Kendall’s W-concordance test, which has been used to prioritize constraints. At the end of the analyses, it appears that cotton, just like corn, enables producers to meet the needs and social development of their households. On the other hand, the non-organization of the maize sector, the lack of inputs and the delay in their distribution, maize prices fluctuation and difficulties in the evacuation of cotton are the main constraints reported by producers. Despite its lack of organization and the other constraints to which it is subject, maize crop is the most preferred. In view of this, it would be appropriate to consider the organization of the maize sector and the optimization of the services provided by the organizations in charge of the cotton sector. This will be beneficial to both production systems and also to all actors involved.
Introduction
Agriculture is one of the crucial activities that human being cannot neglect for his survival. It keeps the human species alive and contributes to its evolution. In Benin, it plays a great role in strengthening the economy and provide about 75% of jobs [1]. Among all the crops produced in the territory, two prove to be vital both in the constitution of the national economy and in the fight for food security: Those are corn and cotton. Known as the main cash crop in Benin [2] and the engine of the Beninese economy [3], cotton alone counts for 27% of exports and contributes by 7% to the national GDP. Its production has not stopped growing over the last five years. It reached in 2016, a tonnage of 451,000, which is an increase of more than 70% from the year 2015 [4]. Due to its multiple outlets, the cotton sector remains the country’s best organized sector [5]. If cotton receives a lot of attention from the Beninese government, corn itself does not have such a privilege. Nevertheless, it is the crop that could be an alternative to cotton production [6] in northern Benin. It comes second, after cotton as a subsistence and cash crop [7]. Indeed, its cultivation occupies nearly 70% of the total area devoted to cereals in Benin and represents about 75% of cereal production [8]. Together with cowpea, cassava and yam, it forms the staple crops of people’s diet [9]. Studies have shown that 63.1% of households in Benin consume 7 days out of 7, maize being the main cereal in the food ration [9]; [10]. Apart from the aspects raised, corn also has medicinal properties. According to [11], the corncob is used in combination with other plants to cure knee and low back pain. Some use it to treat diseases such as malaria.
Material and Methods
Study Area
The study took place in the municipality of Kandi, county town of the department of Alibori. Located in the agro ecological zone of the cotton pan, it is limited by the communes of Malanville (North), Gogounou (South) Ségbana (East) and Banikoara (West). It is spread out an area of 3421Km2 and includes ten districts, sixty-seven villages and fifteen districts. The climate in Kandi is of Sudanese type characterized by two seasons that follow each other: The first, rainy from May to October and the second, dry from November to April. Climate change in sub Saharan Africa does not leave the Kandi commune on the side-lines. It is worth noting since a few decades in the commune and its surroundings an early drying up and a late or sometimes violent arrival of rains. Several studies carried out in the region have noted this [12-15]. In addition, the soil found at Kandi is of tropical ferruginous type. The relief is made up of plateau and one distinguishes by place hills made of granites and quartzite. As for vegetation, the town has grassy savanna, shrub and trees with some gallery forests. In terms of agricultural production, Kandi has a good reputation coming in second place after Banikoara, the giant cotton supplier in Benin. Apart from this asset, the municipality is essential in the department in terms of corn production. The following table gives an idea of the evolution of these two crops from 2011 to 2016 (Table 1).
Table 1: Production in tons of the last five years.
Analysis of this table shows a peak of cotton and maize production between 2014 and 2016 with a respective tonnage of 48853.09 and 102240. The respective average production of the two crops is 362681.86 and 66394.68 tons.
Methodological Approach
Among the ten districts of Kandi commune, only two were chosen to shelter the study. These are the districts of Angaradébou and Sonsoro. This choice was made in a participatory way with the coordinator of the Interprofessional Association of Cotton Producers. Firstly because of their performance in the production of both crops within the municipality and secondly because of their positioning. This choice was made for a wide variation of collected data and the obtaining of a socio cultural diversity in order to better touch the realities of the producers of Kandi as a whole. The data was collected using an interview guide designed to collect qualitative and quantitative data. The collection took place during the month of April of the year two thousand and eighteen (2018) and lasted 2 weeks. After an individual interview with five producers, the questionnaire underwent a slight adjustment. Faced with the unavailability of some farm managers, other people who were relatively close to them and involved in the farming activities of the households proved to be able to provide the necessary information for the study. A total of 25 subjects per district producing maize and cotton were included in the study. These have been identified by secretaries of cooperatives who hold leadership positions within their community. The following Table 2 provides an overview of the structure of the sample considered in the study.
Table 2: Structure of the study sample.
Data Analysis
The data capture and analysis was carried out exclusively with SPSS v21.0 32bits software. The data processing was done using descriptive statistics, speech analysis and Kendall’s W-concordance test. The descriptive statistics essentially allow to obtain the frequencies and average of variables characterizing from a social and demographic point of view the interviewed farmers. The comments received from producers were analyzed and then used to model the “benefits and constraints” section. This technique was chosen inspired by the work of several authors including [16- 18]. The Kendall’s W-concordance test was also used to prioritize production constraints in order of importance.
Results
Table 3 below summarizes the socio-demographic characteristics of the producers surveyed in this study. It indicates that the subjects included in the sample are predominantly male (90%) with a low representation of women (10%). Ninety-four per cent of them live entirely depending on agriculture, compared to six per cent who make it as a secondary activity. Their farming experience varies from 3 to 40 years with an average of 16.92 years. Compared to the size of farm households in both localities (13 persons), the average number of farm active Worker (7 approximately) is relatively small. Farmers send their children to school until they are unable to move on. Sixty percent received formal education and forty percent got literate in local languages. Among those who have been literate 22% hold the certificate of primary school, 10% hold the certificate of secondary school and 2% hold the high school diploma and bachelor’s degree. Anyone wishing to cultivate cotton is required to belong to a Village Cooperative of Cotton Producers, this justifies the membership to an organization unanimously own by the respondents. The average area of cotton planted is 6.62 ha on an average total area of 15.62 ha. In contrast, the average area of maize grown is 5.69 ha. An observation of these figures allow to say that the cotton takes with a small difference, the top on the corn in terms of cultivated area in the commune. This could be explained by the several constraints faced by corn producers. Note that these results are quite similar to those obtained by [19] in their studies in the same commune. able 2: Structure of the study sample ese two crops from 2011 to 2016.
Table 3: Socio-demographic characteristics.
Advantages
Advantages Related to Cotton Production
Cotton plays a major role in the lives of Kandi producers. From the exchanges held with the 50 people surveyed, it appears that several benefits are derived from the production of cotton. It allows heads of households and farms to make investments (buying cattle for traction, rolling stock, building houses …), to perform ceremonies (marriage, baptism, burial …) and then to meet regular expenses in their households and farms (schooling, food, expenses and debts of agricultural campaigns). The Interprofessional Cotton Association known as ‘’AIC’’ is the structure in charge of the cotton sector throughout the national territory. It has set in place a mechanism that allows producers to get inputs on credit before the campaign. They receive the inputs on credit, use them for production, and subsequently pay their debts at the time of payment. This approach is appreciated by the producers because, they lack sufficient financial means at the time of starting the campaign. Through the comments transcribed below, two producers support what has been said above. “The cash of cotton appears for me like a tontine, it allowed me to buy my bike, to build the house where I live. Thanks to the cotton I bought a ginning machine that serves me a lot after the corn harvest. My eldest son is already old enough to marriage. I need to buy him a motorcycle and prepare for his wedding by next year. It is on the cash of the cotton that I count to be able to do it. “ “The cash we get from cotton also allows us to do ceremonies. It is an obligation for us. In our culture, when someone close to your family dies, that means that your money is dying too. You cannot have money hidden somewhere without doing it. It’s like a duty for us.
Advantages Related to Maize Production
Corn in the first place ensures the food needs of households and the farm. After production, much of the crop is set aside to allow the producer, his family and those who serve him to overcome hunger, one of Maslow’s primary human needs. In the same way, the seeds used by the producers are taken from the previous crops. Apart from these two aspects, a great part of the producers have said that corn helps them financially. In fact, after harvest they reserve a larger portion for commercial purposes. The main reason behind this, is to cover regular expenses and household contingencies. These unforeseen events are usually cases of illness or death. Growing maize for the farmer is therefore a way to keep his relatives in safe from the food and financial point of view. The comments collected on this issue were analyzed and reissued below. “Corn helps us a lot, that’s what we eat at home almost all the time. In the form of dough, boiled, and akassa (local meal made with corn). When we are facing a financial problem we just have to take a bag of maize, sell it and the problem is solved. “Cotton’s cash lasts before coming. All the while, it’s corn that keeps us alive. Corn helps us a lot without lying to you.”
Cotton Production Constraints
The benefits of cotton and corn production are enormous. However, during the survey, producers listed a number of constraints they face every day. Seven main constraints came back during the exchanges. They have been grouped in the following table with their respective average ranks. It is noted after analysis of the table that the main constraint reported by the population studied is the insufficiency of the seeds supplied to them. The majority of producers have not only deplored the lack of seeds but also the late availability of these inputs. Similarly, the removal of seed cotton, the late payment of cotton costs, the inadequacy of herbicides and the high cost of inputs are the secondary constraints recorded in this study. It is also important to note through the Kendall coefficient (0.379) that the order of importance of these constraints varies quite remarkably from one producer to another (Table 4).
Table 4: Classification of constraints related to cotton production.
Corn Production Constraints
Concerning corn production constraints, there is a relatively high degree of agreement on the ranking (Kendall’s coefficient = 0.698). The first three constraints recorded are the lack of specific inputs for maize, the obligation to sell cheap the crops, and the lack of financial means to cover the expenses inherent to production. The lack of agricultural equipment and the fluctuation of the price of maize occupy the last places in this ranking (Table 5).
Table 5: Classification of constraints related to corn production.
Corn or Cotton
The objective of this section is to expose the respondents’ position after having simulated a situation where they are faced with making a choice between the two crops. It also aims to explain the reasons justifying their respective positions. Table 6 presents the distribution of producers according to the crop chosen. From this table, it appears that more than half of the producers (58%) chose corn, 22% cotton and 20% decided not to take a position. Table 7 below is a summary of the reasons given by the producers following the choice made. Producers, who opted for cotton justify their choice by the fact that the sector is organized, the price is fairly stable, and inputs are provided on credit. At the same time, those who chose maize justify this by its ability to cope with the producer’s financial problems, its ability to keep them alive before the arrival of cotton revenue and also by its easiness and short production cycle. Producers who have maintained a neutral stance argue that the two crops are inseparable and that in the current context, corn production is necessary in order to reap the benefits of cotton.
Table 6: Crop chosen by farmers.
Table 7: Summary of the reasons given by the producers following the choice made Farmer stances.
Discussion
As maize is a foodstuff, it is mainly used to cover the food needs of producers and their households. The forms under which it is consumed differ from one region to another, or even from one social category to another [20]. In Kandi commune, it is consumed in the form of porridge, paste and akassa. Secondarily, it is the subject of a commercial transaction and generates significant income for producers. After discussions with these producers, it is noted that the income earned is used for security purposes and social fulfilment. Purchases of food, buildings and ceremonies (marriage, baptism, death …) are the main uses made of these incomes. They also, but very rarely, invest money that can add value to their production. Purchasing production equipment is generally limited to the minor tools that are necessary. This could be explained not only by the relatively large size of households living at the expense of these incomes, but also by the primacy of physiological and security needs over other needs. The difficulties that undermine the maize sector in the municipality are enormous, as well as the benefits that result from it. The lack of specific maize inputs outweighs all constraints by unlawfully resorting to inputs for cotton production. According to [5]; [7] and [21], this diversion is reflected in the low yields obtained at the cotton level. One could say that maize seems to be in the study area a parasite of the cotton crop. Studies conducted by [22] on the corn seed production and distribution system in accordance with this study revealed that the lack of input is one of the main weaknesses of the maize sector. The study also shows that, apart from the lack of inputs, the sale at low prices of harvests is a strategy developed by producers in urgent need of financial means. They are often lacking when they harvest the cotton. Cases of illness or other unforeseen events arise occasionally. In response to these problems, they sell corn crops. Those who do not adhere to this practice generally resort to Micro Finance Institutions (MFIs) loans as mentioned by [23]. The ‘‘warrantage’’, (a sort of securing by storing a part or the full harvest) implemented in Benin for more than a decade [24] in response to this situation hasn’t unfortunately had a significant impact in the study area. With regard to cotton, it is noted that income from production has the same purpose as corn, with the difference that cotton is exclusively sold and used more for sustainable projects. In some localities in the study area, cotton producers pay contributions after receiving cotton income to build classrooms or other community infrastructures. Numerous producers greet the organization around the cotton sector and mainly the credit-input which is granted to them. This credit would allow them, according to [25], to effectively fight against pests and raise the level of fertility of their land. Nevertheless, the high cost of inputs, the insufficiency of seeds supplied and especially the delay in their delivery are denounced as the real handicaps of the sector. Many are forced to informally leave money in order to have the extra amount of seed needed. Added to this, the evacuation of cotton harvests from the production areas to the factory loses its nature of gratuity at a given period of the campaign. All these constraints call into question the performance of the production system.
Conclusion
The aim of this study was to shed light on the two most important agricultural value chains in northern Benin. This, through the advantages and constraints that characterize their productions. At the end of the study, it appears that cotton as much as maize represents a lot. farmers. Corn is the staple of their diet and significant revenues are derived from the production of both crops. These revenues are mainly used to meet the needs of households and their social development. Cotton, on the other hand, enables producers to meet their economic and social needs. Besides, the two production systems are subject to constraints that need to be considered for the betterment of these sectors and the actors involved. Giving common attention to both crops through the organization of the maize sector and the optimization of the services provided by the AIC are means likely to boost the satisfaction of all the actors involved.
For more Lupine Publishers Open Access Journals Please visit our website:
https://lupinepublishers.us/
For more Open Access Environment Journal articles Please Click Here:
https://lupinepublishers.com/environmental-soil-science-journal/index.php
To Know More About Open Access Publishers Please Click on Lupine Publishers
Follow on Linkedin : https://www.linkedin.com/company/lupinepublishers
Follow on Twitter : https://twitter.com/lupine_online
36 notes
·
View notes