
Author Pradeep Chintagunta is the Joseph T. and Bernice S. Lewis Distinguished Service Professor of Marketing. His research focuses on the analysis of household purchase behavior, pharmaceutical markets, and technology products. This blog reflects his individual views and opinions.
Don't wanna be here? Send us removal request.
Statistics
We looked inside some of the posts by kiltscenter-blog and here's what we found interesting.
Average Info
Notes Per Post
9
Likes Per Post
7
Reblog Per Post
2
Reply Per Post
0
Time Between Posts
2 months
Number of Posts By Type
Text
5
Photo
12
Last Seen Tumblr Blogs


Fun Fact
Tumblr has a low social media market share in South America.
Text
How the Amazon and Whole Foods merger will impact other businesses
The Amazon–Whole Foods merger has shaken up the world of supermarkets and supercenters. But it’s also expected to affect and disrupt some other businesses.
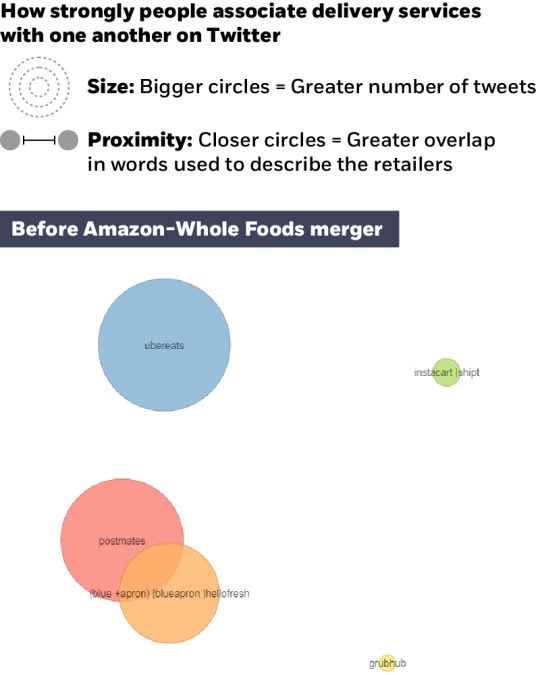
These include but are not limited to online restaurant-order-and-delivery businesses (including Grubhub and UberEats), online grocery-delivery businesses (such as Instacart and Shipt), meal-kit subscription services (Blue Apron, HelloFresh, etc.), and more general-purpose delivery services (such as Postmates). With the help of Chicago Booth MBA student Yogesh Kansal, I used Twitter to examine the impact on some of these businesses. We used the same three time frames as when we analyzed the impact of the deal on traditional retailers.
We began with the sentiment scores of the following businesses: Grubhub, UberEats, Instacart and Shipt together, Blue Apron and HelloFresh together, and Postmates.
UberEats went from having 50 percent positive sentiment before the announcement to about 60 percent positive sentiment in both periods after the announcement. The same is true for the Instacart-Shipt combination, which also saw a sizable improvement in sentiment. Grubhub initially increased from 28 percent positive to 48 percent positive but slipped back down to just 14 percent positive after the deal closed, with this low figure persisting until September 24. The meal-kit business seemed largely unaffected by the merger announcement, at least on Twitter. But general-purpose delivery may have suffered a bit as well.
Word clouds indicate that Amazon and Whole Foods figured prominently in the Twitter streams of all the players mentioned, with the exception of UberEats and Postmates, which reflects the more generic nature of these delivery services. While UberEats is itself focused on restaurant delivery, it is part of the larger Uber business, which also includes services such as UberRush, a general-purpose delivery service. The strongest presence for Amazon and Whole Foods registered in Instacart-Shipt, which stems from Instacart’s delivery relationship with Whole Foods. On the other hand, after the merger closed, the only players that saw a continuing presence of the word “Amazon” in their Twitter streams were the meal-kit delivery companies.
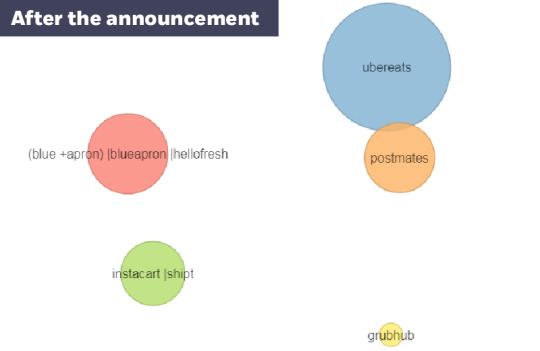
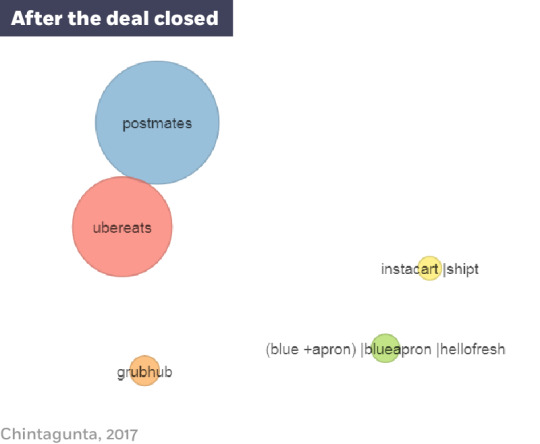
Next, we looked at the perceptual maps of these players to see if relative perceptions were affected by the announcement. We observed a key change in the relative locations of UberEats, Postmates, and Blue Apron–HelloFresh. Prior to the announcement, it appeared, Postmates and the meal-kit delivery services were perceived as having more in common with each other than with UberEats. Postannouncement, however, it seemed that UberEats was viewed as broader than just food, taking it closer to Postmates’ location.
Finally, I looked at feature association maps and saw some consistencies over time in terms of companies and features. Specifically, Instacart-Shipt was associated with the “product” feature (in this case, more specifically with the word “assortment”), whereas Blue Apron–HelloFresh was associated with “price,” and GrubHub with “competition.” By and large, the consistencies seemed to outweigh any marked changes in feature associations, at least over this rather short time interval. A confounding factor to note in this analysis: the time period also involved the initial public offering of Blue Apron, which had a fairly rocky start as a public company.
To the extent that we observed on Twitter, any changes to these businesses seemed limited mostly to the positive sentiment that consumers have for the companies.
Pradeep K. Chintagunta is Joseph T. and Bernice S. Lewis Distinguished Service Professor of Marketing at Chicago Booth. He blogs at kiltscenter.tumblr.com. He thanks Booth MBA student Yogesh Kansal for his feedback and input.
0 notes
Text
How Amazon’s Whole Foods deal impacts supermarkets and supercenters
In the wake of Amazon buying Whole Foods, there has been much hand-wringing by analysts over the fate of supermarkets and supercenters. Clearly, the concern is that the merger will result in lower prices and improved efficiency of operations at Whole Foods, and will combine these prices and efficiencies with delivery, thereby severely impacting traditional supermarkets such as Kroger, as well as supercenters such as Walmart. Indeed, the stock prices of traditional supermarket chains suffered as a consequence of the deal.
With the help of Chicago Booth MBA student Yogesh Kansal, I looked at audience reaction to the event on Twitter. In particular, we looked at the reaction the week before the June 16, 2017, announcement, the week after, and the week after the deal closed on August 28. Since one would expect an increase in the volume of tweets, we looked instead at other metrics such as sentiment and relative perceptions. For purposes of the analysis, we looked at Kroger, Walmart, and Safeway (as well as, of course, Amazon and Whole Foods). In the wake of Amazon buying Whole Foods, there has been much hand-wringing by analysts over the fate of supermarkets and supercenters. Clearly, the concern is that the merger will result in lower prices and improved efficiency of operations at Whole Foods, and will combine these prices and efficiencies with delivery, thereby severely impacting traditional supermarkets such as Kroger, as well as supercenters such as Walmart. Indeed, the stock prices of traditional supermarket chains suffered as a consequence of the deal.
Sentiment Comparison
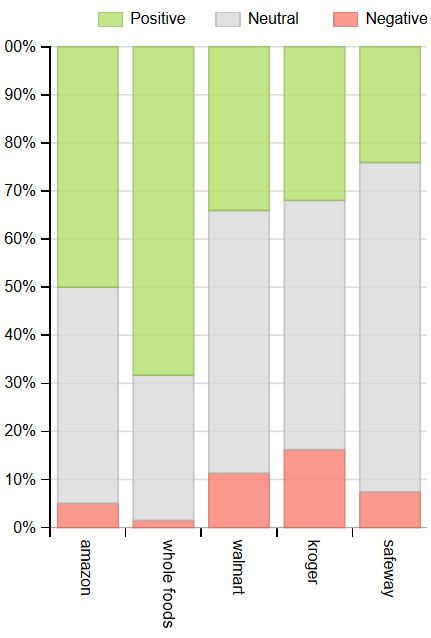
From the sentiment figures, we see that the positive sentiment for Amazon ranged from 45 to 50 percent (negative sentiment was 5–8 percent), with positive sentiment slightly rising and negative sentiment slightly dipping right after the announcement. However, in the week after the deal closed, positive sentiment for Whole Foods went up from about 68 percent after the announcement (it suffered a slight dip from 73 percent before the announcement) to 75 percent after the deal closed.
To dig more into possible reasons for the rise in positive sentiment, we looked at word clouds from the three periods for Whole Foods. The price cuts seem to have had some effect. Note that, in this case, the cuts are quite credible, i.e., this was not a case of the company replacing products with lower-quality items. Hence the perception of value was enhanced, leading to a more positive sentiment.
Before announcement
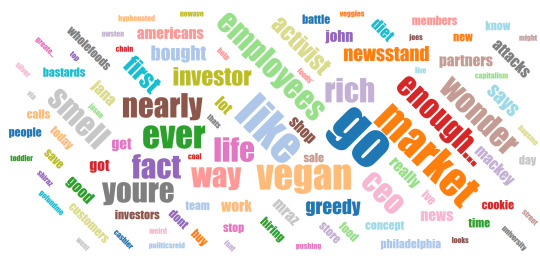
After announcement
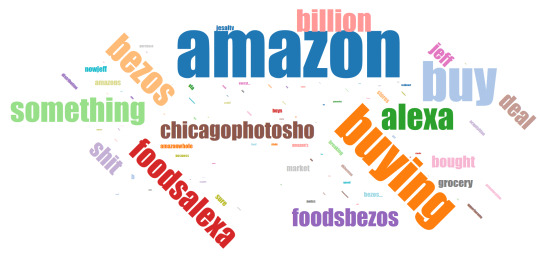
At deal closing

So how did the other supermarkets fare in the eyes of the Twitterati? While the sentiment for Walmart does not seem to have been affected much, both Kroger and Safeway showed a change. In particular, Safeway saw a large drop in positive sentiment, from over 50 percent to just a bit over 20 percent. However, according to data examined over longer time periods—from May 1 to May 31 and from September 1 to September 24—the positive sentiment level for Safeway was between 25 and 30 percent, suggesting that there were idiosyncratic factors (combined with a relatively low tweet volume) that contributed to the high positive sentiment between June 9 and 15.
Kroger, on the other hand, does seem to have seen a drop in positive sentiment from the low to mid-30s, again verified by looking at data from May 1, to the low to mid-20s right up to September 24. However, here as well there is the confounding factor of Hurricane Harvey, at least for the latter part of August, although this would not necessarily explain the stable September numbers.
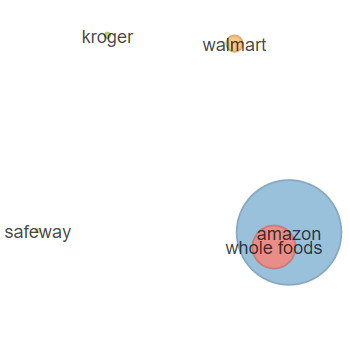
Next, we looked at the relative perceptions of the retailers over time. As mentioned in previous CBR essays (such as “As Sears fails, who will buy its brands?” Summer 2017), these maps are constructed from similarity metrics constructed between each retail pair. The similarity metrics are obtained from looking at the overlap in words used on Twitter to describe the retailer in each time period considered. The size of the circles represents the volume of tweets associated with that retailer. The maps below suggest that Twitter users’ perceptions of the retailers only changed in the short run and, by the time the merger closed, had reverted back to what they had been before the announcement. So at least in the immediate aftermath, we do not see any fundamental changes in perceptions of the various retailers.
Relative perceptions
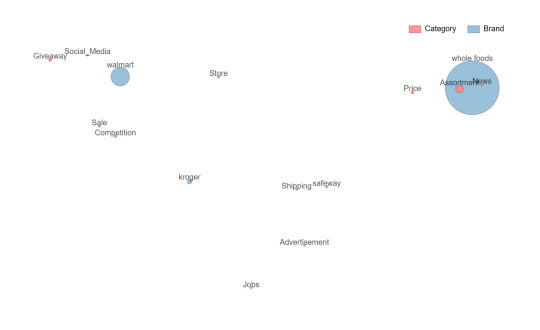
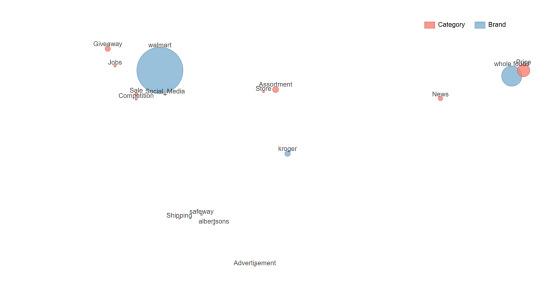
In the last piece of analysis, we looked at the topics associated with the tweets for each of the retailers in each of the three time periods. There are several noteworthy points to glean from the pictures. The first is that Walmart and Whole Foods were generally located at opposite ends of the spectrum in each time period. Walmart was associated with social media, giveaways, and its stores. Whole Foods, on the other hand, was associated with several features but not strongly pegged to any of them.
After the announcement, however, we see a marked change. While Whole Foods and Walmart were still viewed as “opposites,” the former showed a strong association with price and assortment, whereas Walmart’s main features continued to be its stores, giveaways, and social media. Finally, after the merger closed, Whole Foods retained its association with price, largely because of the price cuts instituted by Amazon. Assortment shifted back toward Walmart and appeared equidistant to both retailers. Thus it seems Amazon was able to clearly highlight the impact it was having or planning to have on prices at Whole Foods.
Another observation from these maps is that, by and large, Albertsons and Safeway stores, which share the same ownership umbrella, had reasonably proximal locations on all maps. At least from a positioning perspective, this is good news for these retailers in terms of projecting a uniform image to consumers.
Brand feature associations Before announcement
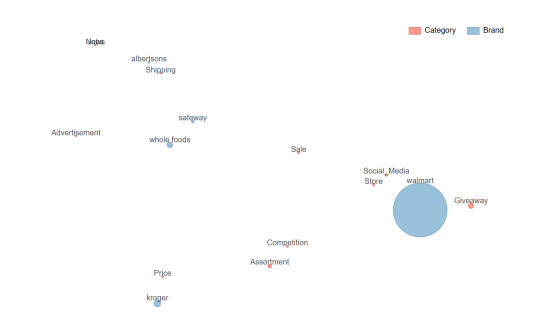
After announcement
At deal closing
To summarize, the data seem to reveal some short-term changes in sentiments, perceptions, and associations for these top retailers. Whether these changes can be sustained over time, and whether they prove more or less successful for the retailers, remains to be seen.
Pradeep K. Chintagunta is Joseph T. and Bernice S. Lewis Distinguished Service Professor of Marketing at Chicago Booth. He blogs at kiltscenter.tumblr.com. He thanks Booth MBA student Yogesh Kansal for his feedback and input.
0 notes
Text
With Whole Foods, can Amazon fill your every need?
It’s trying, by embracing scope, scale, and speed
Amazon’s recent acquisition of Whole Foods has triggered a lot of discussion about the motives behind the purchase. But many of these explanations can be rationalized by looking at Amazon’s primary mission, which says, “At Amazon, we are committed to being the most customer-centric company on earth.” That is not only a rather audacious statement; indeed, it is a tall order. And while some people may in the past have perceived the mission statement as purely aspirational, over time, with moves such as this acquisition, it is increasingly clear that Amazon is trying to make what seemed aspiration into a reality.
One way in which marketers often approach customer analysis is by studying what has been referred to as the customer’s “journey,” or the “consumption chain.” Essentially, studying this journey includes mapping the steps that a customer goes through when fulfilling a specific need, then trying to make sure that your company’s product can fulfill that need.
For example, let’s say a customer needs to wash clothes. With the consumption chain in mind, one can trace a number of innovations that detergent manufacturers have incorporated into their products over time. One step in the customer’s journey is knowing when it is time to buy more detergent. Accordingly, manufacturers introduced transparent “windows” in containers of liquid detergent so consumers could gauge when they were running low. Another step is the act of pouring the detergent. To help customers avoid making a mess on the side of the container or dripping detergent on the floor, manufacturers added spouts designed to ease pouring, as well as channels to allow excess detergent to drip back into the bottle. (Manufacturers are more reluctant to add clearer markings than they currently do on the insides of caps that would help customers measure detergent according to the size of their loads, since they would rather customers use more detergent than required.)
Amazon has taken the idea of mapping the customer’s journey beyond merely fulfilling a specific need to trying to address all the needs a customer might have over the course of a day. In many instances, this goal involves providing services that complete the need-fulfillment journey for specific categories. In the detergent example, after a customer recognizes that he needs to buy detergent, he still needs to go to the store, pick the product from the shelf, pay for it, come home, and use it. Amazon is able to help a customer complete nearly all of these steps through Amazon Prime Now, a single service that delivers products within two hours of an order.
But Amazon has gone beyond even this by creating ways to make the process simpler. The first is the Amazon Dash Button, a physical button that customers press when they need a specific product. If you’re running low on Tide detergent, press the Tide Dash Button that you’ve affixed to your washing machine to order more. However, while Dash buttons solved a specific problem, Amazon also created the Echo speaker, which takes voice commands. Echo obviates the need for multiple Dash buttons while also offering other, unrelated services, including the ability to control devices such as alarms and radios.
A customer’s daily activities include more than washing clothes, of course they also include waking up, eating breakfast, taking a shower, getting dressed, going to work, returning from work, relaxing in front of the television, preparing dinner, and going to bed. It is not hard to see how, over time, Amazon has increasingly crept into these activities—by delivering groceries for breakfast, toiletries to use in the bathroom, clothes to wear, television and content to enjoy while relaxing, and more groceries as well as other food delivery for dinner. The inexorable moves to map and fill a customer’s daily needs mean that Amazon is becoming increasingly central to the consumer’s experience, as much as it is becoming more customer-centric in everything it does. This idea of occupying “adjacencies”—meeting customer needs proximal to those that you currently fulfill—has been a pillar of marketing practice for a long time. Amazon, for its part, has done this aggressively and expansively, by meeting a core or “primitive” need first, and then layering on top of this need to meet additional needs over time.
Scope, scale, and speed To be more customer-centric, Amazon has clearly recognized the power of the three s’s: scope, scale, and speed. In order to become the one-stop destination for the consumer, what Amazon really needs is scope. The more products and services that consumers can find under one roof, and the more easily consumers can access these services, the more benefits consumers will see and accrue by engaging with Amazon.
But customers will not be attracted to Amazon if they find prices too high, which is where scale and efficiency come in. Having access to a very large customer base allows Amazon to obtain favorable terms from suppliers, while having efficient operations keeps a further lid on costs.
And then there is speed. One-stop, lowcost shopping is certainly attractive, but if a customer’s need is not immediately met, the shopping experience will not be fulfilling. This is where speed comes in: having more locations conveniently located close to the customer will enable Amazon to fill a variety of orders inexpensively and quickly. Delivering what the customer wants, when she wants it, at a price she is willing to pay is the ultimate value proposition.
But there are three things that Amazon needs in order to deliver the three s’s. First and foremost, it needs data, both external and internal. External data include information from Amazon’s own customer base and the customer bases that come in via acquired companies. It can mean data from the marketplace, which includes competitors and companies with other business models and innovations. Amazon also needs internal data. How are the internal processes doing? Where can they be improved? Are there bottlenecks that can be eliminated?
Amazon also needs innovation to retain and enhance its customer-centricity. This could be innovation in product (such as Alexa, the voice service that powers the Amazon Echo), process (such as delivery by drone), or content (such as the Amazon original TV series Fortitude). With Amazon facing ever-changing customer needs, the ability to marry data with innovation will be a key driver of the company’s future success.
Lastly, as the company increasingly moves from the online world to the offline, it needs to think of ways of replicating its platform strategy offline. The ability to offer a wide range of products online was made possible by bringing third-party sellers onto Amazon’s platform. These sellers provide mainstream products, plus they extend the breadth of product offerings by giving consumers access to more obscure products (those in the “long tail” of customer needs). This reinforces the consumer benefit from visiting and shopping on the Amazon site. Initial moves at Whole Foods seem to be going against this notion, however, as the acquired company announced a reduced emphasis on local suppliers. But Amazon needs to nevertheless explore ways in which it can better leverage physical locations as local platforms.
The idea behind the three s’s, and what is needed to support it, bears a strong resemblance to what Amazon refers to internally as the “flywheel.” In the traditional strategy literature, organizational “fault lines,” where one activity may require skills that are not consistent with those required for other activities, are associated with the organization’s need to manage the three s’s. What Amazon has been able to do thus far, and needs to continue to do, is manage effectively across these fault lines.
Putting the three s’s into action Now let’s get back to the original question of why Amazon acquired Whole Foods and, in light of the above analysis, examine various reasons Amazon provided.
·One argument is that as grocery purchasing increasingly migrates online, Amazon will be able to use its access to Whole Foods to fulfill this need.
·Another is that Whole Foods can act as a distribution hub since it has urban and suburban locations. Because the locations have attractive demographic profiles, with high-earning residents, Amazon can physically reach its customer base in these areas. In addition, the stores can become showrooms for Amazon products, such as Alexa, that have been optimized to allow consumers to shop more easily on the Amazon website.
·Third, and related, is that as Amazon gets access to the Whole Foods customer base, Whole Foods shoppers who are not big Amazon buyers may be tempted to sign on with a Prime bundle designed specifically to appeal to them.
·Fourth, the company will get more out of customer data. By combining offline data from Whole Foods with online shopping data, Amazon may be able to further refine the scope of its product offerings.
·Fifth, with its experience in running its own operations efficiently, Amazon may help improve the efficiency of Whole Foods operations. From sourcing and dynamic replenishment to dynamic pricing and streamlined store operations, there are many ways in which the companies may be able to lower costs while enhancing the overall customer experience.
Other reasons: the retail locations can become sites where customers who find store returns convenient can return products purchased on Amazon, rather than go to the post office or UPS store. Also, the acquisition gives Amazon access to a set of retail employees considered some of the most customer-centric in the business, and who may help Amazon better understand ways of enhancing employee satisfaction at Amazon itself. Ultimately, as many marketers have pointed out, the profit chain runs through both employees and customers.
The acquisition also gives Amazon access to Whole Foods’ private-label product line 365. Recall the customer’s journey for detergent. The one factor that Amazon still has no control over is the detergent itself, since detergents are manufactured by outside companies. Because this limits Amazon’s profit margins, the company has increasingly been launching its own products—AmazonBasics batteries and cords, for example. This own-brand push will be significantly enhanced by the 365 line from Whole Foods.
Many more reasons for the acquisition have been advanced, but as should now be clear, most of them fit into the broad rubric of enhancing Amazon’s scope, scale, and speed. Indeed, the acquisition also has a direct impact on some of the enablers: data, innovation, and platform.
While growing size, product, and service variety are clear advantages for now, Amazon cannot discount the possibility of upsetting customers as it engages more deeply in their lives. I was recently on the site, trying to buy some cranberries. I was met with a dizzying array of products and processes including AmazonFresh, Amazon Prime Pantry, Amazon Prime, and a host of third-party sellers. These options, plus even more unique possible combinations, made me decide to buy the product elsewhere. In the end, I was unable to locate the right combination of product (organic cranberries in a 3 lb package), process (Prime), and price—even though I knew that the right combination existed somewhere in the multitude of search results.
I find there’s typically a movie quote for every situation—and in this case, a perfect one comes to mind. Toward the end of The Lincoln Lawyer, the title character, Mick Haller (played with gusto by Matthew McConaughey), offers his services for free to a potential client. His chauffeur, Earl (played by Laurence Mason), overhears this generous offer and asks, “Are you all right?” To this Haller replies, “Repeat customers, Earl. We’ll stick it to ’em next time.” As Amazon scoops up customers who become more reliant on it, these customers should hope that the company does not behave like Haller and stick it to them down the line.
Pradeep K. Chintagunta is Joseph T. and Bernice S. Lewis Distinguished Service Professor of Marketing at Chicago Booth. He blogs at kiltscenter.tumblr.com. He thanks Booth MBA student Yogesh Kansal for his feedback and input.
0 notes
Photo
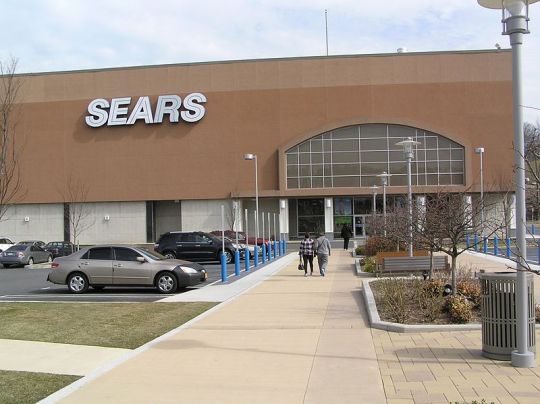
If Sears Wants to Sell Kenmore...
When a retail chain such as Sears is in trouble, the usual levers to examine in order to improve performance are location (or convenience); assortment (or the variety of categories carried and the brands within each category); price (price positioning – upscale, midscale, etc. and pricing or merchandising strategy – everyday low pricing or “high-low” pricing); and most importantly, the overall quality of its merchandise.
Over the years, the company has tried to move the needle by engaging each of these levers. For example, it’s experiment of opening a store in downtown Chicago in 2001 to serve the clientele coming to that area to shop at neighboring stores (including Macy’s, Old Navy, Gap, Target etc.) ended in 2014 as it failed to generate enough traffic and sales to justify the premium location. In 2002 it tried to return to its catalog roots (Sears that started as a mail order catalog company in the late 19th century and started opening retail locations only in 1925, abandoned the general merchandise catalog in 1993) by acquiring the Land’s End – a higher end clothing, luggage and home furnishings catalog retailer. However, that did not end well either with Sears spinning off Land’s End in 2013. And further back in 1989, Sears tried to move from a high-low pricing policy, where merchandise is sold at a higher regular price coupled with occasional discounts of varying depths on different products, to an everyday-low-price strategy (akin to Wal-Mart’s) where regular prices are lower but there are fewer discounts. This attempt also resulted in failure, as the customer who came to Sears wanted to feel the thrill of having discovered a quality product at a low price. So over the years, Sears has been declining. It first started losing out to Wal-Mart and Target in the bricks-and-mortar era; unable to compete with Wal-Mart at the lower-end value positioning or at the slightly upper end with Target. More recently the online assault mounted by Amazon has largely decimated what was left of the “Great American Store.”
Unlike many other retail chains however, Sears owns several brands that are well known and trusted by American consumers. These include the Kenmore range of appliances, Craftsman tools and Die Hard batteries (jointly known as K-C-D). Recently, the company has sought to raise money by selling these iconic brands. First among them was the sale of the Craftsman brand to Stanley Black & Decker, another larger manufacturer of tools. While the Craftsman range will still be available in Sears stores, ownership will pass to the purchasing company. Sears has also been interested in selling the Kenmore brand. Clearly there are other manufacturers such as Whirlpool, Electrolux (a Swedish manufacturer), Haier (a Chinese appliance maker), Samsung and LG (Korean manufacturers) who could potentially be interested in acquiring the Kenmore brand name. Obviously there are financial, operational and other considerations that would go into the decision to acquire the brand. Here, I take a limited perspective by (i) focusing on the consumer to see if the Kenmore brand provides a better “fit” to these other players; (ii) ignoring the two big Korean manufacturers from the analysis (since these are large conglomerates with interests well beyond appliances the calculus for these firms will likely be very different); and (iii) looking at what consumers say on one specific social media platform - Twitter. The caveats from doing so are obvious; nevertheless such an analysis might provide some insights for these firms.
Yogesh Kansal (MBA 2018) as always helped me with this analysis; and for this particular post I also received assistance from Shweta Desiraju (College 2017). I look at data from the 2-month period from November 7, 2016 to January 7, 2017 for the analysis.
As always I begin by looking at “buzz” – the amount of activity being generated on the platform by the various brands. The reasoning here is that if Kenmore is a brand generating buzz and you are a brand that is currently not front and center in the consumers’ minds then acquiring a brand with more “top of mind” awareness might be beneficial for you. Figure 1(a) shows the temporal variation in the relative number of posts on Twitter for each of the brands and Figure 1(b) shows the overall numbers for the entire duration.
Figure 1(a): Time series plot showing relative numbers of tweets
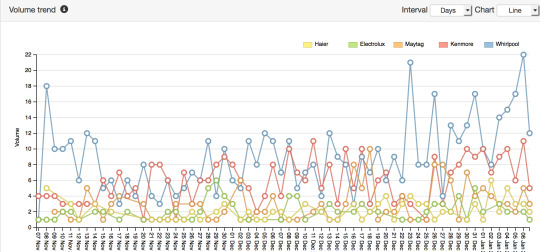
Figure 1(b): Overall share of posts of the brands
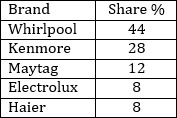
We see from Figure 1(b) that Whirlpool and its subsidiary Maytag, already control over 50% of all the conversations in this market. So per se, adding Kenmore to the mix, while significantly expanding coverage, is less of a benefit (of course, since Whirlpool already does the manufacturing of some Kenmore products an argument can be made from an operations perspective). However, both Electrolux and Haier will benefit significantly from adding Kenmore to their portfolios while giving them access to the US market.
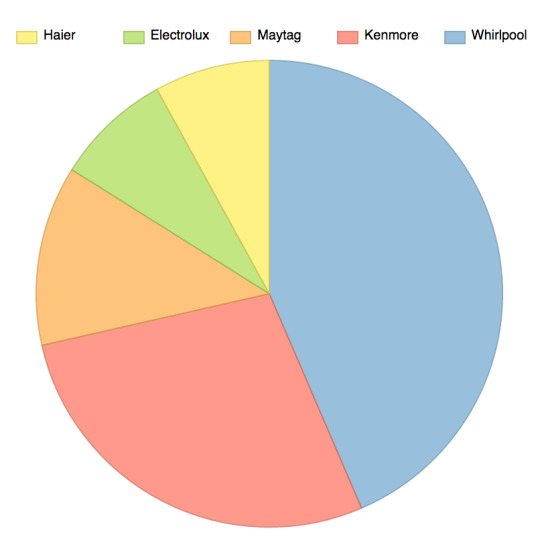
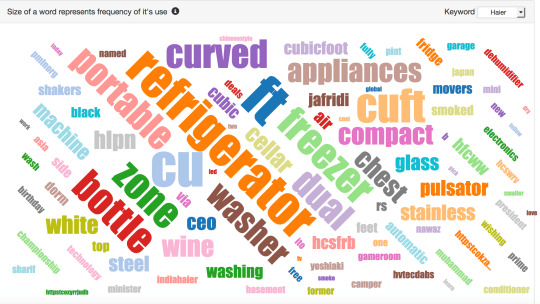
Does the volume of conversations also carry over into benefits from the sentiments associated with these brands? In Figure 2, I show the positive (green), negative (red) and neutral (grey) sentiments associated with each of the 5 brands analyzed.
Figure 2: Brand sentiments from the tweets
From Figure 2 we see that the brand likely to benefit the most is Haier since the sentiments associated with its tweets are less positive than those for the other brands (with the possible exception of Whirlpool). Kenmore has the highest positive sentiment associated with it, making it a valuable addition to the company’s product portfolio. Also note that Electrolux in this case is already generating fairly high positive sentiments although the negative sentiments are also high for this brand. From that perspective Electrolux might also benefit from an association with Kenmore.
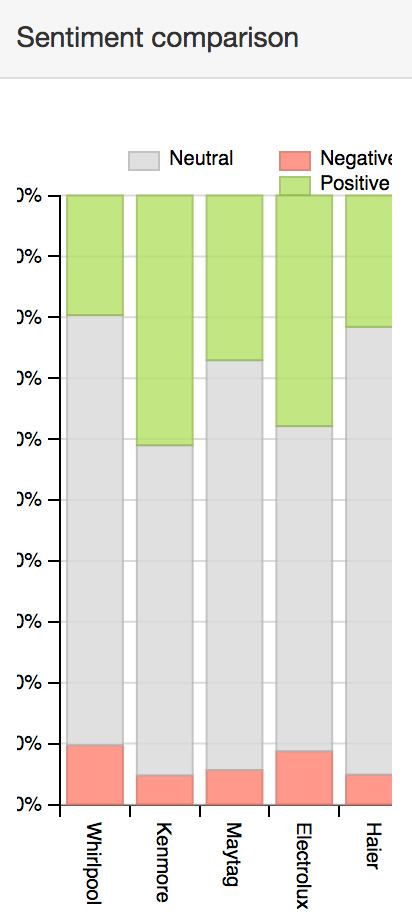
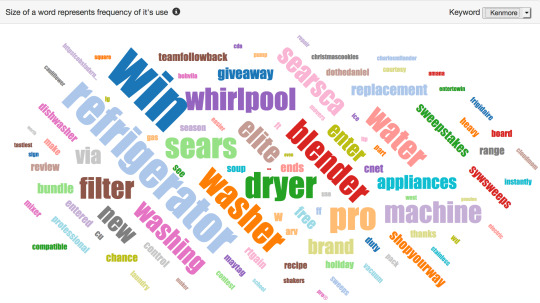
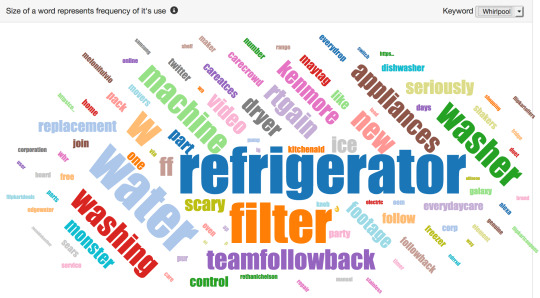
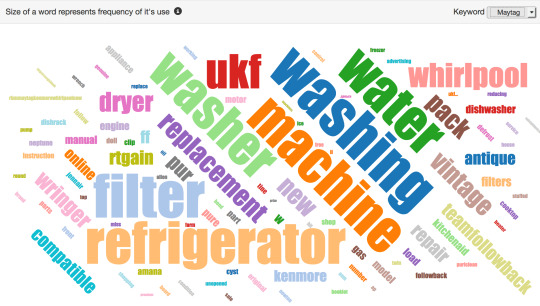
Next we look at the contents of the tweets from the different brands via wordclouds. The idea behind this is whether there are some complementary features or other attributes that Kenmore provides from the perspective of each of the other brands. Figures 3(a) through 3(e) display this information for the 5 brands.
3(a): Haier Wordcloud
3(b): Kenmore Wordcloud
3(c): Whirlpool Wordcloud
3(d): Maytag Wordcloud
3(e): Electrolux Wordcloud
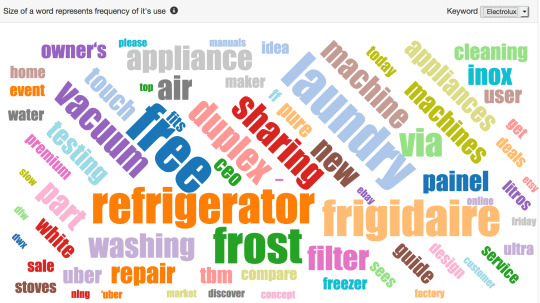
From the wordclouds it appears that the brands are all very similar in terms of the content of the tweets. Other than Maytag, the refrigerator appears to be the major appliance that generates most of the tweets. The one dimension that Kenmore could potentially bring to each of the other brands comes from its product line also including small kitchen appliances such as blenders. This is reflected in its wordcloud as well.
To dig deeper into the perceived “similarity” between the various appliance makers in terms of the overlap in words used in their respective tweets, I next construct a similarity “matrix” that provides the extent of word overlap between brands. This overlap metric is akin to a correlation matrix. With this similarity matrix as an input one can use standard statistical methods to come up with a “perceptual map” such as the one in Figure 4 below. The size of each bubble is proportional to the number of tweets for the corresponding brand.
Figure 4: Perceptual Map and Similarity measures
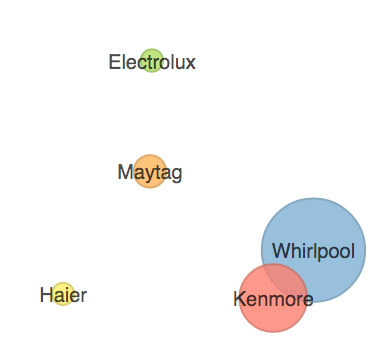
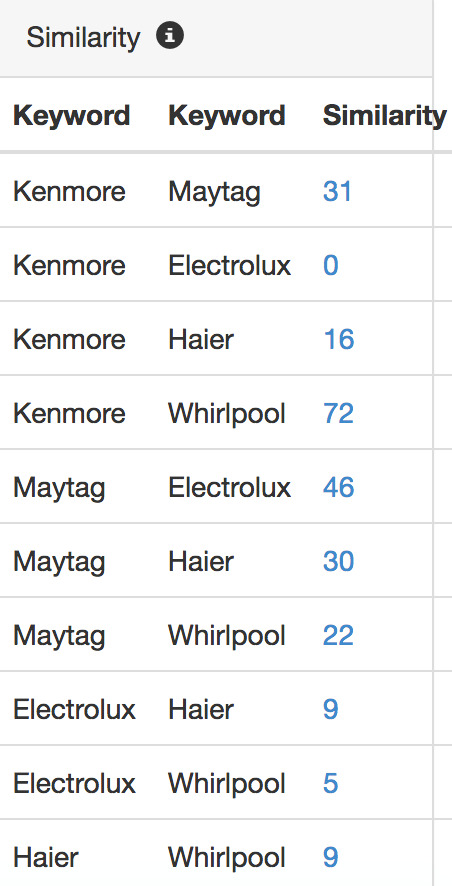
Note that unlike a typical perceptual map, the dimensions in the above figure are not specified and are open to the reader’s interpretation. Nevertheless, the map provides a pictorial representation of the similarities in the tweets between the 5 brands. In particular, those of Whirlpool and Kenmore appear to be quite similar to one another, reinforcing the earlier point that the benefits to Whirlpool of combining with Kenmore maybe limited. On the other hand, it does appear that both Haier as well as Electrolux would benefit given the limited similarity / overlap that they share with Kenmore.
Since the above map does not give much information on the underlying attributes, I turn next to mapping the brands onto features via the following feature association map. This map provides information on which “topics” are included in the content of the tweets and the topics related to each of the brands. I interpret these topics in terms of the features of interest to consumers. The Feature-Association map is depicted in Figure 5.
Figure 5: Feature – Association Map
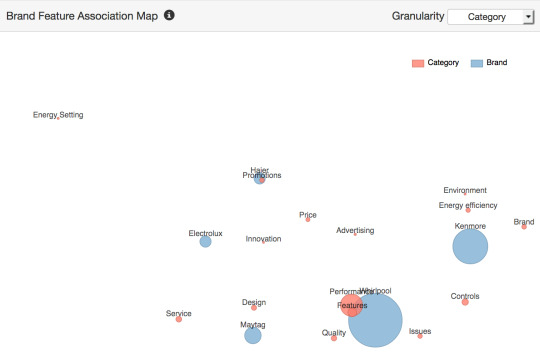
Figure 5 shows interesting differences across brands in terms of the features most closely associated with them. In particular, Whirlpool tweets reflect product features, performance and quality but also issues that consumers maybe having with them (recall the large negative and low positive sentiment associated with this brand). Maytag’s tweets reflect design, quality and service and Kenmore’s are associated with the brand, energy efficiency and the environment. On the other hand Haier seems most strongly associated with price and promotions (and design to a lesser extent) and Electrolux with innovation, design and service. Based on this information, it does appear the Haier may be the firm that would benefit the most from being associated with a strong brand that also emphasizes energy efficiency.
Taken together, the above analysis seems to suggest that Kenmore would make a good purchase for Haier or Electrolux but perhaps for different reasons. For Electrolux, Kenmore would bring more visibility in the US market and a strong brand with an association with the environment and energy efficiency. For Haier the benefits include the visibility as well as the positive sentiment as well as a move beyond just being associated with price and promotions. It will be interesting to see how this plays out going forward.
.
0 notes
Text

Calls & Recalls: Samsung Note 7 – What the data tells us
In the previous two posts I discussed the reason why the recall of the Note 7 was important and what the potential reasons behind the recall may have been. Here, with the help of Yogesh Kansal (MBA ’18), I will look at Twitter data from August 15 to September 15 to see if there are any insights we can obtain from those data. Keep in mind that the data come from the publicly available 2 percent of tweets that Twitter allows us to freely access. Before getting started, let’s review the timeline of events.
Timeline of events (Source: Wikipedia):
August 2, 2016: Samsung unveils Galaxy Note 7
August 19, 2016: Samsung’s official release date for Galaxy Note 7
August 31, 2016: First report that Samsung is delaying release to "perform additional tests"
September 2, 2016: Samsung voluntarily recalls Galaxy Note 7
September 7: Apple unveils iPhone 7
September 8: FAA issues advisory warning for Galaxy Note 7
September 9: Consumer Product Safety Commission issues warning to stop using the Galaxy Note 7
September 16, 2016: Apple releases iPhone 7
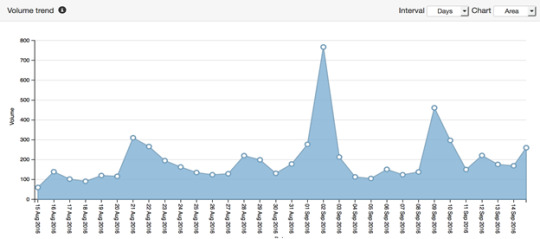
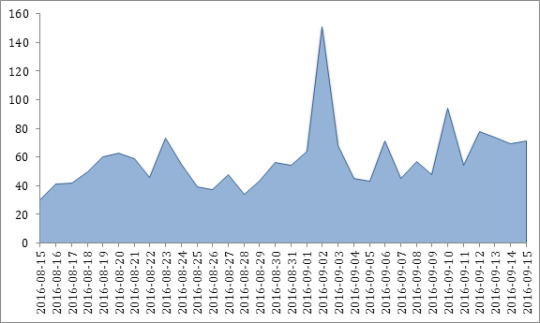
I begin in Figures 1 and 2 by plotting the time-series in tweet volume over this time period for “Samsung” and for “Galaxy Note.” Not surprisingly, we see a spike corresponding to the recall announcement on September 2. There is also a spike corresponding to the times of the CPSC and FAA warnings. In addition, we note from both figures that the numbers remain somewhat elevated all the way through the middle of the month.
Figure 1: Volume trend for Samsung
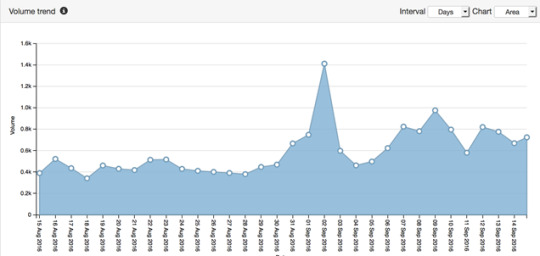
Figure 2: Volume trend for Galaxy Note
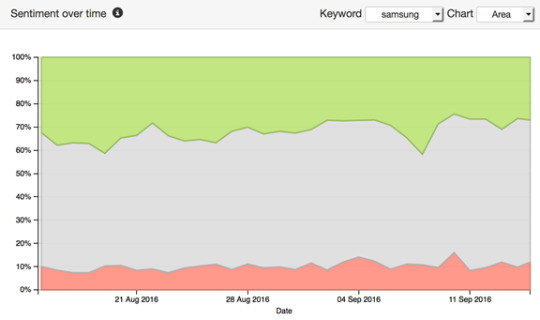
Next, we look at the overall sentiment for the “Samsung” brand in this period. The split, which was 31 percent positive, 59 percent neutral and 10 percent negative, indicates that overall, Samsung has not been too badly affected by the recall (we’ll compare this with number for other brands later). This is also evident from the sentiment trend that I plot in Figure 3.
Figure 3: Sentiment trend for Samsung
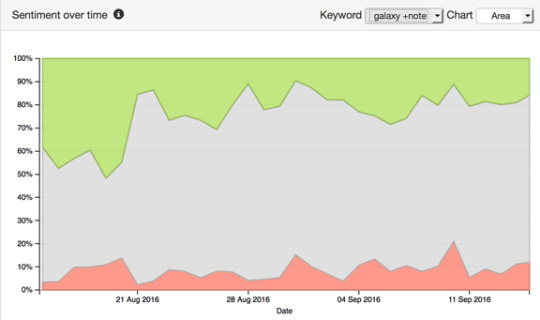
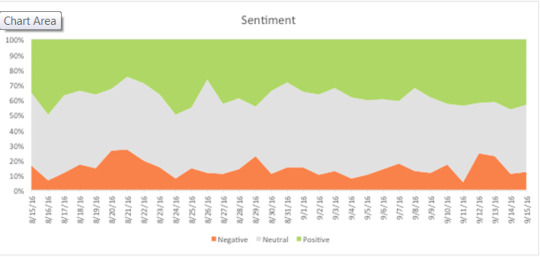
What about the Galaxy Note sub-brand? The news is less positive. Here the overall positive sentiment is only 21 percent and shows a clear dropoff over time (see Figure 4). However, the negative sentiment is not too high but shows peaks around August 31, when the announcement of shipment delays was made, and then again after the FAA and CPSC warnings.
Figure 4: Sentiment trend for Galaxy Note
Digging more into the two negative sentiment peaks mentioned about, we see the following in the word clouds formed from the tweets on those days. Consumers are clearly unhappy about the delay in the shipments, as shown in Figure 5. This is understandable since this would eliminate bragging rights the Samsung owners would have vis-à-vis buyers of the Apple iPhone 7, which was set to come out later.
Figure 5: August 31 negative sentiment word cloud
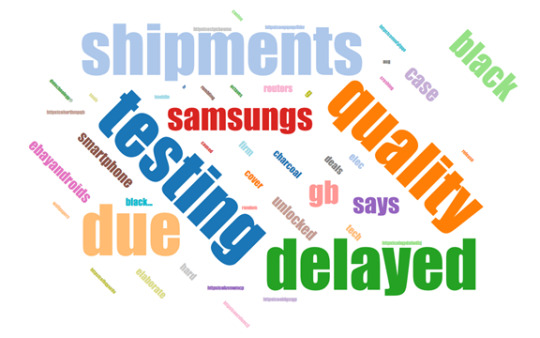
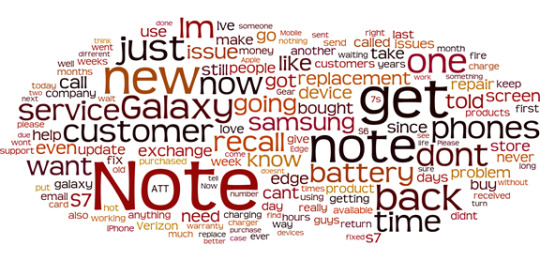
Figure 6 shows that consumers were confused by the recall. Samsung could have reacted to their confusion by issuing clear instructions. In the context of a global launch, where different governments may require different interventions, Samsung needed to come up with a comprehensive global response.
Figure 6: September 9th negative sentiment Word cloud
Putting things in context:
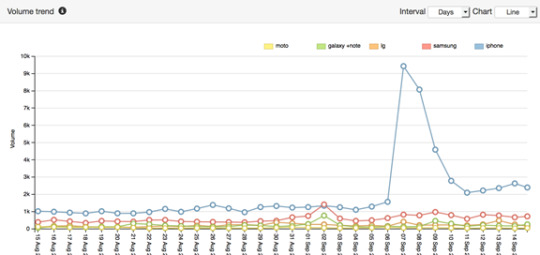
Next, I put the action on Twitter related to Samsung and the Galaxy Note in context with the conversation around Apple, LG, and Moto at the same time. Figure 7 shows that despite the peaks we saw earlier in Figure 1, the volume of tweets in that figure is dwarfed by the tweet volume generated by the iPhone. Indeed, the volume for the iPhone is several orders of magnitude larger than that of the other players in the market. This is especially obvious around the time of the iPhone announcement on September 7. While one may believe there was considerable buzz around the Samsung event, it was quite small in the context of the iPhone. In this time period, 65 percent of tweets were about iPhones, 20 percent were about Samsung, 7 percent were about the Galaxy Note 7, 7 percent were about LG, and 2 percent were about Moto.
Figure 7: Twitter volume trend across brands
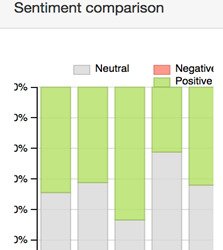
Next, what about the sentiment across the brands? We look at the overall sentiments across these brands in the one-month period. This information is depicted in Figure 8. It is clear that Samsung and Galaxy Note have the lowest positive sentiments, although negative sentiments are no higher than those for the other brands. So working to regain the trust of the customers would hopefully result in an increase in positive sentiment.
Figure 8: Sentiment comparison across brands
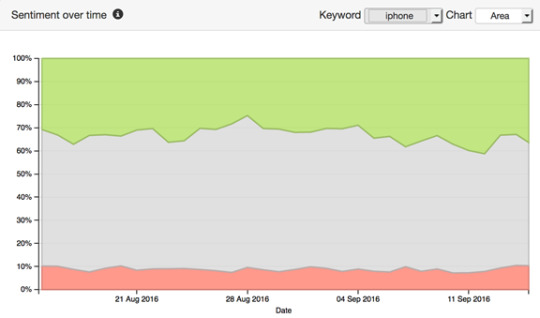
Do other brands benefit from Samsung’s travails? In Figure 9, I plot the sentiment trend for the iPhone. While there does appear to be a slight uptick in positive sentiment, this could easily be attributed to Apple’s own announcement of the next-generation iPhone. It appears there aren’t any major beneficiaries of Samsung’s missteps.
Figure 9: Sentiment trend for iPhone
Some information from Facebook
The last chunk of data we’ll look at are Facebook posts on the Samsung Mobile USA page in the two-week period prior to September 2 and the two-week period after. The contents are depicted as word clouds in Figures 10 and 11. There aren’t a whole lot of additional insights to get from these figures. Essentially, Figure 11 reflects issues raised vis-à-vis the recall and the battery problem as would be expected.
Figure 10: Wordcloud for the two-week period up to September 1, 2016
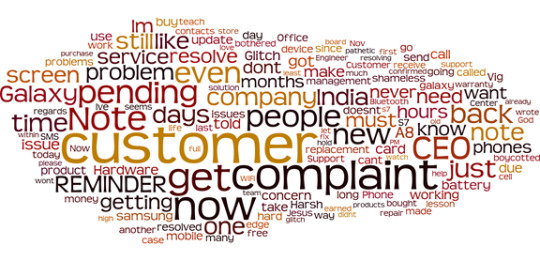
Figure 11: Wordcloud for the two-week period from September 2, 2016
What about the volume of Facebook posts? Are they similar in pattern to that observed for tweets or is there a difference? In Figure 12, I plot the post volume. It is clear that the pattern is very similar to that for tweets with peaks on roughly the same days and of similar relative magnitudes.
Figure 12: Volume trend for Samsung Mobile USA Facebook posts
What about the sentiment of these posts? This is depicted in Figure 13.
Figure 13: Sentiment trend for Samsung Mobile USA Facebook posts
As with the volume of posts, we see that the sentiment of the posts also closely mirrors what we saw with the tweets with obvious spikes in negative sentiment at the anticipated dates. Nevertheless the overall sentiment does not change dramatically to the negative.
Overall, the above look at the data suggests that while problematic, and while holding important lessons for Samsung going forward, they should be able to eventually overcome the fallout from the Galaxy Note 7 recall. Most of the negative sentiment seems focused on the specific product rather than the parent company. Perhaps this is an instance where having a product line might have contributed to the problem while at the same time limiting the extremely negative consequences of the incident. Of course all this depends critically on whether the company moves decisively to address the problems. The announcement that replacements begin shipping (at least in South Korea) on September 28 is hopefully the first step in the process.
0 notes
Text

Calls and recalls - Causes and consequences of the Galaxy Note 7 disaster
“There’s a saying in England: where there’s smoke, there’s fire.” So said James Bond, played by the inimitable Sean Connery, after setting fire to a bunch of Spectre boats in the movie from From Russia with Love. The recent outbreak of flammable Samsung Galaxy Note 7 phones suggests the reverse—where there are fires, there must have been some smoke. There must have been some signals ahead of that unfortunate outcome for Samsung. So what may have been some of these signals and the reasons behind them?
First is the issue of product design. The smartphone market has become more competitive, and in recent times we haven’t seen the types of technological breakthroughs that characterized the early period of the product’s life cycle. Manufacturers have instead focused on making phones bigger, thinner, faster, and brighter. This and the desire for a longer battery life put a lot of pressure on the design of the Lithium-Ion battery embedded in these phones.
According to cNet, this is why there’s little room for error:
“Phones use lithium ion battery packs for their power, and it just so happens that the liquid swimming around inside most lithium ion batteries is highly flammable. If the battery short-circuits – say, by puncturing the incredibly thin sheet of plastic separating the positive and negative sides of the battery – the puncture point becomes the path of least resistance for electricity to flow. It heats up the (flammable!) liquid electrolyte at that spot. And if the liquid heats up quickly enough, the battery can explode.”
Firms in general (and in this case, Samsung in particular) need to very sensitive to the products��� design parameters.
The second issue is product testing. The best way to minimize the probability of such problems is to subject the product to rigorous testing: alpha tests, performed in-house; beta tests, with some subset of customers; and delta tests, which assess longer-term wear and tear. With the pressure on to bring to market new and improved devices, the amount of testing that products are being subjected to is likely declining. Less testing, in conjunction with more complexity of design, is likely to increase the likelihood of episodes such as those recently suffered by Samsung.
The third aspect, perhaps more unique to Samsung, is that unlike Apple, which generally sells only one (or more recently, two) flagship product, the company sells an entire product line with several series, including A, C, E, J, S, Y, and Note. It has more products to test. An issue with even one of the products is liable to damage the company’s reputation. Designing and testing each product in each of the lines is clearly a challenge for the company, even before it faces the marketing challenge of differentiating these series in the minds of consumers (of course, some of the series are country specific, e.g., the C series was launched in China).
The above factors may have all contributed to the greater likelihood of the Note catching fire. Along the same lines, there are marketplace factors that Samsung (and other manufacturers for that matter) needs to pay attention to in the future. The first issue that should make companies more circumspect when launching products is the new pricing and promotion policies being followed by wireless service providers. As the technologies underlying the products advance (faster chips, brighter displays), the cost of manufacturing remains high ($255 by one estimate) and the market prices for the phones keep rising. Granted, Samsung is in a somewhat enviable position of being more vertically integrated than other manufacturers, and so according to the above source has managed to keep costs in line with that of the previous generation phones. But a high retail price has implications for consumers. In the past, wireless carriers like AT&T and Verizon would subsidize the cost of the phone to the consumer. In effect, the consumer paid only about $199 for the device. However, facing competitive and margin pressures of their own, these wireless carriers have started to end the price subsidies and now consumers are required to pay full price (albeit, in most cases, in installments). If consumers are paying $700 for a phone, when they used to pay $200, they’re likely to be a lot more sensitive to a phone’s quality. Having the device catch fire could have longer-term consequences in this new pricing and promotion regime. In other words, it would behoove Samsung and its rival manufacturers to take into account that consumers are spending more than ever before when making a smartphone purchase and expect to have a robust device for that price.
A second marketplace consideration for Samsung is the role of the wireless carrier. In most cases these service providers are also the device’s distributors. When a device is recalled, carriers need to work with the customers who previously purchased the phone to retrieve the recalled phones and provide a replacement. There is also the issue of phones in the carriers’ inventories. In a world with a few device manufacturers, wireless carriers may be more dependent on these manufacturers. However, there are several manufacturers now competing for share in the devices marketplace making the carriers less dependent on a particular manufacturer, especially one that might be having an issue with its products. Samsung needs to recognize the power of the carrier and ensure that it keeps its relationship with these players strong.
In the movie Suicide Squad, the character Harley Quinn (played by Margot Robbie) retorts to a disapproving statement by Rick Flagg (Joel Kinnaman) thus: “We’re bad guys, it’s what we do.” Fortunately, that statement does not apply to Samsung. Exercising care in future new product launches will save it from such a reputation in the future. This would help it avoid long-term negative fallout from the incident. Hear Pradeep Chintagunta speak more about the recall incident on a recent episode of Marketplace.
Special thanks to Yogesh Kansal (MBA ’18) for his help with this post.
#booth #marketing #recall #product design #product testing
0 notes
Photo

Calls and recalls - The Samsung Note 7 smartphone
Like Scarecrow in the Wizard of Oz, who screams “Help! I’m burning! I’m burning!,” the owners of the Samsung Galaxy Note 7 phones that recently caught fire must have felt seriously singed. It was not the first time that Samsung has had troubles with the batteries in its cellphones. Both the S3 and S4 generations had issues with batteries that couldn’t hold a charge, and swelled up (prompting the infamous battery “spin test”). As consumers we have also experienced explosions with laptop batteries (Sony’s recall of Panasonic batteries in June and its recall of laptop batteries in 2006) and car batteries (Chevy’s earlier problems with the Volt’s batteries). In each case, Lithium-Ion batteries have been the culprit. The public is aware of issues with these batteries, but since batteries are usually hidden within our laptops, smartphones, and cars, we tend to not think about the potential dangers they present. With this as background, why all the brouhaha about the Galaxy Note 7? There are several reasons.
The first is that the Galaxy Note 7 was very popular prior to recall. It had received good reviews, and Samsung had manufactured and distributed several million. When the company recalled 2.5 million phones, several people, including children, had reported injuries and other incidents (like cars catching on fire). At the same time, the Galaxy Note 7’s manufacturing defect affects less than 0.01 percent of all Note 7 handsets sold, according to unnamed sources from within the company. It’s possible that we’re looking at fewer than 1,000 defective phones. However, this is of little solace to the consumer who has no way of knowing whether (s)he has one of the defective ones. By contrast, many in my generation can recall Intel’s “Pentium flaw,” when Intel’s flagship microprocessor chip would mess up certain simple arithmetic operations. While Intel claimed that the common user would experience the flaw once every 27,000 years, examples of the flawed computation were widely available that prompted consumers to immediately determine whether or not their machines had the flawed chip! The bottom line is, consumer products like smartphones are supposed to improve our lives—not make them more difficult. The concerns about the Galaxy Note 7 are completely justified from this perspective. Scale and ubiquity simply exacerbates the problem.
A second reason is that Samsung considered the Galaxy Note 7 to be an important driver of revenue for the company. In its Q2 2016 earnings release, the company notes the following under Q2 results and business outlook:
Focus on YoY earnings increase by strengthening H(igh)/E(nd) line-up and maintaining solid profitability of mid to low-end products
- High-end: Maintain solid sales led by new flagship product launch and continuous global sales of S7
- Mid/Low: Expand global sales of A/J series while streamlining product line-ups
Not only are smartphones an important part of Samsung’s business, but in addition to generating revenues on its own, the flagship Galaxy Note 7 does a lot to pull in sales for other products lower down in the product line. So the Galaxy Note 7 (and the S7) is a key part of the company’s strategy.
A third reason is the presence of competitive considerations. First, Samsung has been under a lot of competitive pressure in non-US markets from a number of domestic players—Huawei, Oppo and Vivo in China; Micromax in India, etc. While many of these players used to compete in the mid-to-low end of the smartphone market, they are all moving upmarket to challenge Samsung. Second, Samsung competes heavily with Apple in the US market. By being able to launch its latest-generation phones before the iPhone 7, it looked like Samsung had managed to steal the thunder from Apple’s launch. Indeed this notion got further credence from the positive buzz surrounding the Samsung product. So the timing of the Samsung recall just prior to Apple’s launch announcement for the iPhone 7 last week really seemed to take the wind out of Samsung’s sails. The iPhone has since reported very strong early orders and while it may be highly premature for Apple to declare victory for this generation of smartphones, the fact that Samsung has halted sales of its own flagship product does not hurt.
Finally, the way Samsung has gone about the recall has been criticized by many. For example, the Wall Street Journal ran this headline:
“How Samsung Botched Its Galaxy Note 7 Recall.”
As I have repeated often in this column (see many of my earlier posts including those on the VW scandal and the Maggi lead crisis), the response to these incidents has to be swift, sincere, and solutions-oriented. So far, Samsung has been found wanting at least along some of these dimensions. Eventually, being a strong consumer company, Samsung should be able to bounce back. After all, even the fire from Scarecrow eventually ended up destroying the Wicked Witch of the West, so some good might come out of the battery incident. In the short-run however, it seems that it is Samsung that has been burned.
Special thanks to Yogesh Kansal (now MBA ’18!) for his help with this post.
#samsung #BoothMKTG #chintagunta
2 notes
·
View notes
Photo
Creating a brand in a fragmented marketplace: The Indian Experience
There are several industries in emerging markets that tend to be highly fragmented – retail, artisanal crafts, indigenous clothing. These industries are characterized by firms with limited brand recognition on a national level (although many of them have a strong presence in small local areas). An increasingly widespread phenomenon in these markets is the emergence of national (or super-regional) branded players who have tried to transform these industries into brand-conscious ones. Before jumping into the factors that might be driving this phenomenon, let us first revisit the role of branding in a broader marketing context.
As I have noted in an earlier post, the basic objective of marketing is to generate demand – this is where companies focus on fine tuning their marketing strategy and marketing mix to better cater to consumer needs so they end up buying more; perhaps even creating longer-term relationships. The second objective is to build brands – essentially the marketer wants to create an associative network of benefits, emotions, images, etc. that are unique to her product or service. This helps sustain the relationships the marketer is trying to engender. The third objective is to create completely new categories of products where none existed before – this way the brand becomes synonymous with a category – say like Xerox. And finally the role of marketing is to aid society by not only accomplishing the first 3 objectives but also benefitting the larger society at the same time – think of products like the Pure-It water filter. So branding fits into this larger rubric of marketing.
So what are the factors that are leading to a push towards brands in fragmented markets? There could be several factors – here are some.
i) Differentiation. First and foremost, branding is a means of differentiating your product from the other “unbranded” products out there. Consider the case of atta (the flour that goes into the making of the Indian bread or roti). The consumer had typically used atta that was ground in their presence or in the neighborhood mill. Such a fragmented market is often ripe for entry by a branded player. Why? First, any individual player in this market has very limited market power. Consumers typically purchase raw wheat in bulk, clean it by hand, store it, and bring some every week to the local mill or chakki, where it is then ground to produce the atta. But as smaller mills get replaced by larger mills, a consumer’s access to mills decreases as there are now fewer mills available. In urban areas, the cost of real estate also affects the ability of a small mill to continue operations. Further, consumers have less time to devote to this activity themselves or to get it done in a mill. Second, the market for the product is large. So even if the branded player can only get a small share of the market, it can create a profitable business opportunity. Fragmentation associated with a large market size was also a driver in the jewelry business and now in the saree business as well. With product categories like food and jewelry, branded players can also create a strong emotional bond between consumers and their products via advertising – something the players in the fragmented market may not be able to afford other than in a very localized manner. Related to this point is that if the product is largely perceived as a commodity (as in the case of atta), any means of differentiation is likely to stand out. A downside however in such markets, with several branded players, is that the market can become price competitive as was the case when ITC entered the atta market.
ii) Quality assurance. A second reason for creating brand affinity is that of quality assurance. In a fragmented market that is based on a strong relationship between the firm and the customer (as in the traditional jewelry business), the relationship servers as the basis for quality assurance. However, for the inexperienced consumer or one that only needs the product occasionally, quality assurance based on relationship does not exist. At the same time, given the big ticket size and the possibility that the jeweler may be adulterating the product, the risk associated with the purchase is high. In such instances, a strong brand can effectively signal high quality to the consumer. Consider for example, a household in S India that traditionally consumed rice, wants to switch to wheat and rotis due to diabetes concerns. Since this household is not experienced with the category, they might be more likely to be drawn to a branded atta that advertises on television compared to a no name atta purchased in the neighborhood store. Another category where brands play the quality assurance role is pharmaceuticals. Knowing that the drug is a “branded generic” produced by a reputable companies provides assurance to the physician that her patient will get access to the molecule that she is prescribed. Viewers of Tanishq commercials starring the film stars Jaya Bachchan and her husband Amitabh might recall the emphasis on quality assurance communicated in these ads: “Do you know anything about diamonds, whether they are pure or not?” she asks him. To which he is able to respond that the diamonds are all of the same quality, and that the diamonds can be exchanged if she did not like them.
iii) Status symbol. Brands can signal status – in some cases like automobiles, the signals can be overt. Driving a Mercedes-Benz for example, conveys to the bystander something about the passengers riding in that car. Similarly a jewel collection from Tanishq can communicate its exclusive and expensive nature to the right social circle that the wearer moves in. We can also start to see this in sarees – the ability to manufacture designs and prints exclusive to a particular brand or label – has the potential to signal status to the appropriate audiences. This is clearly related to the issue of differentiation. Being seen as a status symbol allows the brand to differentiate itself from other brands that cater to the mass market. This in turn allows the firm to charge a premium price for its offerings.
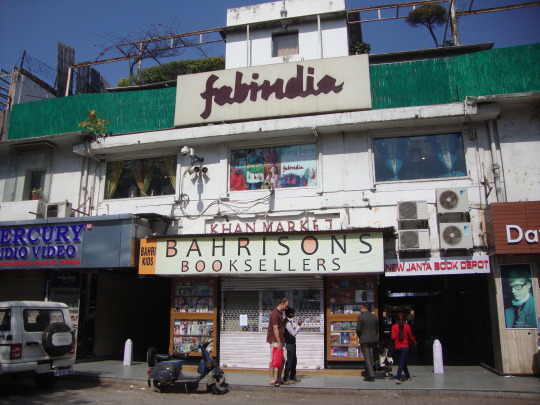
iv) Primary demand generator. When markets are fragmented, there is less of an ability for firms to stimulate primary demand. Consider the case of Indian consumers interested in desi clothes, i.e., Indian ethnic wear. For the small ethnic retailers in a given urban area, it would be difficult to get consumers to switch or augment their wardrobes with ethnic fare. First, they lacked resources to convey the value proposition effectively to these potential customers. Second, it would have been hard for the customer to have come across these retailers due to their small footprint. Enter a brand like Fabindia that decided to shift its business model from an export focus to one of India-based retail. Now you have a national brand with considerable retail footprint and access that could enter a consumer’s consideration set while buying clothing. This generates primary demand for such clothing that would have been difficult to do without the brand.
Besides brands like Tanishq for jewelry, and Fabindia for ethnic wear, one can also think of players like Amul, Mother Dairy and Aavin that have transformed the dairy products space from one with considerable fragmentation to a more streamlined supply route from the farmer to the consumer.
Going the branding route is not without its challenges. The first is to communicate effectively to the consumer that there is value in the branded alternative above and beyond the value that can be obtained in the unorganized sector. In other words, there needs to be a believable and communicable point of differentiation. In the case of Pillsbury’s Chakki Fresh Atta that was launched in 1998 it was the following aspiration of the Indian housewife “I wish there was a way to keep the rotis in my husband's lunch box soft till the time he eats them;” rotis so soft they stay soft over six hours (from the time of preparation around 7 AM to the time of consumption around 1 PM). But even if the value proposition is well communicated, if the consumer is very focused on price, it may not be possible to penetrate the market much. So the branded atta market is perhaps still about 2-3% of the overall (albeit large) atta market. The second challenge has to do with creating, maintaining and potentially expanding the product’s supply (or demand) chain. Consider the case where the branded firm does a good job of generating demand for the product. Growth in demand usually strains the supply chain. The value of the brand is now tied firmly with its ability to deliver top quality. If quality falters as a consequence of the growth, the firm is likely to face unhappy customers precisely at the moment when it has an increasing number of them. So managing the production and the supply chain as demand ramps up is a critical success factor for the firm. We see this happen at an uncomfortable frequency in the Indian pharmaceutical market especially when the manufacturers are trying to expand their footprints by supply generic products overseas. A third challenge has to do with distribution. If firms have to set up their company owned distribution chains it has the benefit of exclusivity and the ability to communicate the product’s positioning very clearly. However, this comes at a cost – retail is an expensive proposition – that can undermine the value proposition of the brand. So while this might be effective in luxury retail it can be a challenge for less upmarket brands.
Photo by Vasenka
3 notes
·
View notes
Photo

What’s the big deal: Flipkart, Snapdeal and the Indian e-commerce industry viewed through the lens of Twitter
With all the talk about Flipkart and Snapdeal, the e-commerce sites from India that have captured the imagination of investors, consumers and the general public with their business models and their valuations, their deals and price “wars,” and the sniping from the company’s executives, I decided to see what social media, specifically, Twitter had to say about these companies. For good measure I decided to include 3 other websites in my analysis – Infibeam, Jabong and Naaptol.
For those unfamiliar with these companies, Flipkart in May of this year (2015) raised $550 million for a valuation of $15 billion. At that time, the deal made Flipkart the third most highly valued, privately-held startup in the world. The company was launched in 2007 and today, ships over 30 million products in over 70 different product categories. The company follows a hybrid model a la Amazon.com – it sells products it inventories as well as allows other sellers to participate on its platform. Further, like Amazon, it has also launched its own private label brand. Snapdeal.com on the other hand works as online marketplace where millions of consumers can transact with over 150,000 sellers. Its assortment includes over 12 million products across 500+ diverse categories from thousands of regional, national, and international brands and retailers. It provides extensive access of sellers to buying residing in over 5000+ cities and towns in India. The company recently raised $500 million from Alibaba, Foxconn and SoftBank in addition to investors Temasek, BlackRock, Myriad and Premji Invest. This has valued the company at $5 billion.
As always, I started off by looking at the relative volume of tweets involving these companies. And as always, my thanks to Yogesh Kansal for helping put the facts and figures together for this post. In Figure 1 below I show the (relative) volume of activity on Twitter from April 1, 2015 to August 31, 2015 for the 5 e-commerce sites being analyzed. The figure shows that 45% of tweets relate to Flipkart, 43% to Snapdeal with the other sites collectively garnering only about 12% of tweets. The largest of the 3 is Jabong with a 10% share.
Given the similarity in overall volumes, the question is whether there is temporal variation in the tweet volumes. In Figure 2, I provide the plots of daily tweet volumes over the time period. This graph shows that while the overall numbers in Figure 1 are comparable across sites, this is not true on a daily basis. In fact, the volume shows dramatic swings for the two sites on different days. In particular, one sees big increases for Flipkart on April 14th and July 31st, the increases for Snapdeal come on May 25th, June 27th, July 27th and August 10th. Overall. The big difference in the two figures is that Flipkart shows many smaller peaks, Snapdeal’s activity seems to be concentrated more on fewer larger peaks.
Next, one might be interested in understanding more about these peaks and what the Twitterati are saying about the companies on these days. Figure 3 shows Flipkart-related tweets on April 14th depicted in a word cloud. The figure shows that most of the action is centered around the company’s decision to support net neutrality and to walk away from a deal with Airtel Zero that would not have conformed to such a stance. This was articulated by the company’s co-founder Sachin Bansal. On the other hand, looking at the August 10th peak for Snapdeal (Figure 4) we see that none of the words is particularly dominant. The words that do stand out seem to be related to Snapdeal’s marketing activities rather than about the company itself. The August 18th word cloud on the other hand does reflect the investment from Foxconn, Alibaba etc., but also shows words like “fashion,” “products,” “contest,” etc. that all reflect the marketing activities of the firm.
What about the overall text associated with the firms across the entire 5-month period? In the next set of figures we provide the word clouds for Flipkart, Snapdeal and for comparison, Naaptol. The results for Flipkart (Figure 5) suggest that the wordcloud we saw previously is not indicative of its entire tweet history. In particular, although words like “net neutrality” and the name of the co-founder continue to be seen, product- and marketing-related tweets appear to be more prominent – in particular, the book series Aoleon the Martian Girl is heavily reflected in the word cloud. In Snapdeal’s case (Figure 6) we continue to see a strong reflection of its marketing in the word cloud. In addition, we see emotion-laden words like “love,” “amazing,” “super,” “great” etc. reflected in the tweets. While a lot of this can be company and seller generated, the extent to which customers are expressing such feelings reflects well on the company.
The above differences, although not large, are reflected in the overall sentiments expressed towards the companies. In Figure 7, we see that in this time period, the overall sentiments for Snapdeal are a bit more positive (52% vs. 47%) and a bit less negative (3% vs. 6%) than for Flipkart. With Naaptol we see a large range of neutral sentiment. To assess why, we look at its word cloud over the 5-month period on Figure 8. Here we see that a vast majority of words are in Hindi rather than in English. These words are not easily picked up by the sentiment dictionary leading to the neutral sentiment assessment in Figure 7.
We can also dig deeper into the sentiment analysis to ascertain whether there are trouble spots for the two top players. In Figure 9 we show the word cloud for Flipkart’s June 6th Twitter activity. That day saw a spike in negative sentiment for the company. This related to the incident of the “fake discount” as shown in Figure 10 when a customer discovered that an item regularly priced at 399 Indian rupees was advertised as having a regular price of 799 which was discounted to 399 by Flipkart. So to the extent that the regular price was itself 399, consumers viewed this as a ”fake discount” – as noted by the ensuing tweets. It is clear that firms in the e-commerce space cannot afford to lose consumer confidence with such issues and the firm should guard against such recurrences. In general, though the good news is that even when there is a spike in negative sentiment for one of these companies, it is usually not associated with a concomitant spike in tweet volume, thereby indicating the limited reach of such sentiments.
While Figures 1 and 2 tell us overall volumes and the daily time series, it is hard to discern a trend for any of the firms from these figures. In the figure, Figure 11, I show the monthly aggregate tweets for the 5 players to see if any trends are visible. Figure 11 indicates that Snapdeal is showing an upward trend from April through August. Flipkart was trending up as well till July but has seen a dropoff in the last month. And Jabong rose till June but has trended down since.
To put the information in a broader perspective, I turn to data from Google Trends. From the data in Figure 12, we can see that Flipkart is googled about 60% more than Snapdeal over the past month (August 5 to September 5). A similar pattern holds over the past 3 months and 12 months as well. Alexa rankings also suggest that website visits are much higher for Flipkart than for Snapdeal. However Figure 1 showed that the two platforms have similar tweet volumes. To get to the bottom of why this might be happening, let’s look at who and what topics the Twitterati are tweeting about when it comes to these two brands. As can be seen by the relative circle sizes in Figure 13, the number of unique posters tweeting about Flipkart is much higher than about Snapdeal over this time period. And Figure 14 shows us that tweet topics for Snapdeal for the month of August are most closely associated with marketing activities and company news as compared to the tweet topics for Flipkart which are mostly associated with electronics products and prices. While not conclusive, these findings suggest that Snapdeal’s 150,000 sellers may be using Twitter as a platform to sell their products thereby pushing up its total tweet volume beyond that of Flipkart.
I would like to reiterate that the above analysis is (a) purely qualitative in nature; and (b) does not tell us much about important outcomes such as sales. Nevertheless it is important for these growing brands to monitor their social media presence in order to avoid debilitating snafus.
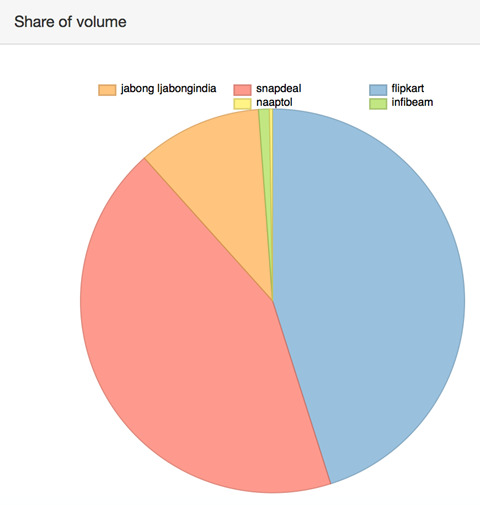
Figure 1. Relative share of tweet volume April 1, 2015 – August 31, 2015
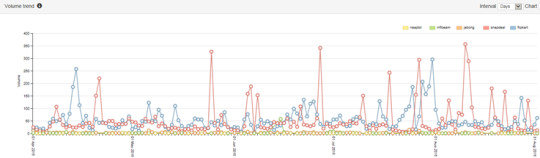
Figure 2. Daily tweet volume over time, April 1, 2015 – August 31, 2015
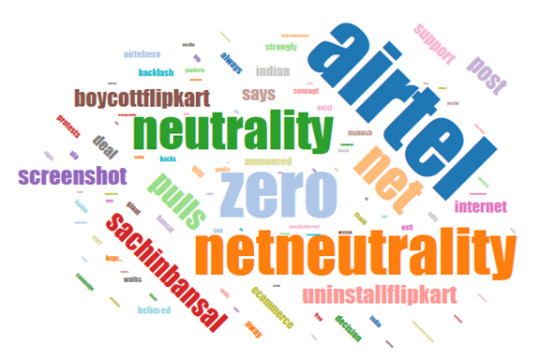
Figure 3. Flipkart word cloud for April 14th, 2015
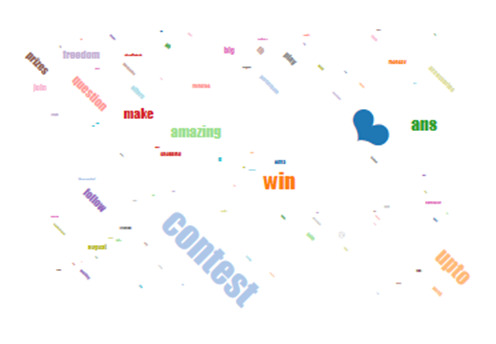
Figure 4. Snapdeal word cloud for August 10th 2015

Figure 5. Flipkart word cloud for 5-month period
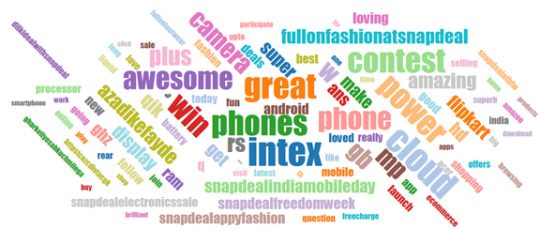
Figure 6. Snapdeal word cloud for 5-month period
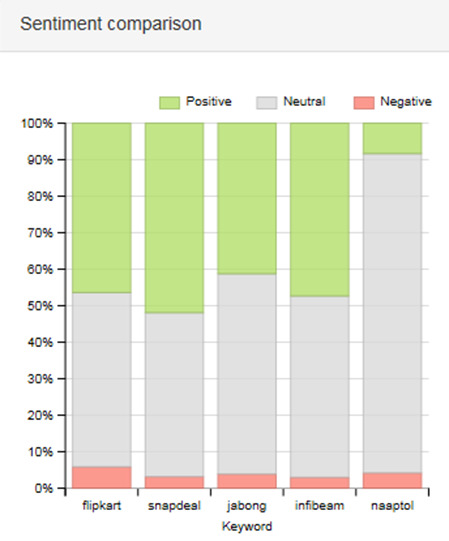
Figure 7. Overall sentiment towards firms over 5-month period

Figure 8. Naaptol word cloud for 5-month period
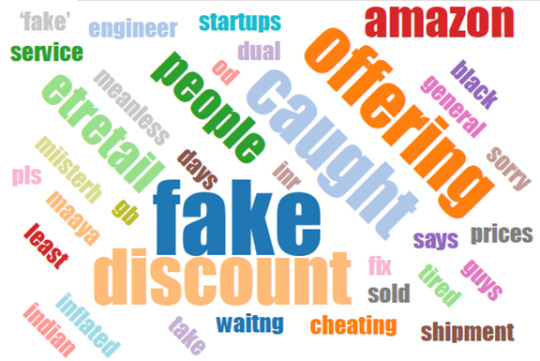
Figure 9: Word cloud for June 6th negative sentiment spike for Flipkart
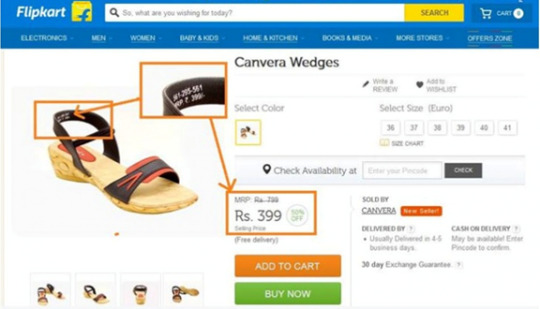
Figure 10. Screen shot of “fake discount” at Flipkart spikes negative sentiment
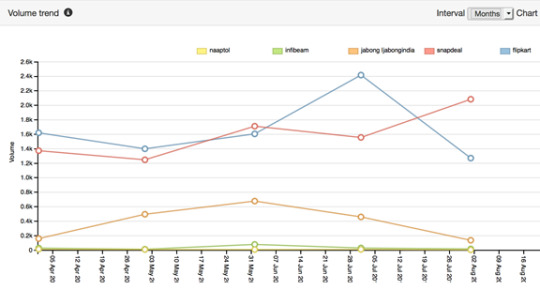
Figure 11. Monthly trends in tweet volume
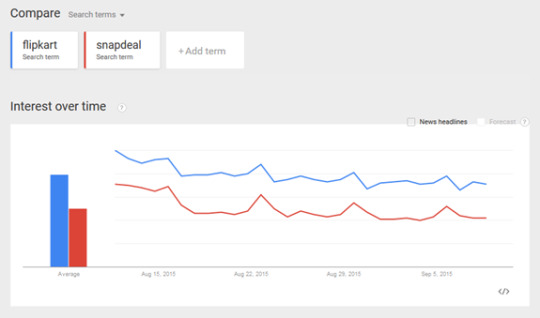
Figure 12. Google search trend for the words Flipkart and Snapdeal
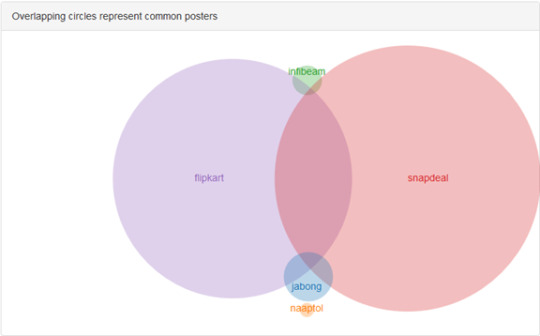
Figure 13. Overlap of posters tweeting about the brands. Size of a circle represents the number of unique posters tweeting about the brand
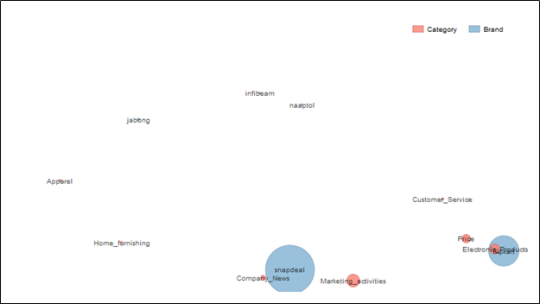
Figure 14. Topics and their associations with brands only for the month of August 2015. Proximity denotes association while size of a circle represents the volume of tweets.
Photo by Trademarks and copyrights held by Flipkart.com (www.flipkart.com) [Public domain], via Wikimedia Commons
0 notes
Photo

Anatomy of a scandal – How the Volkswagen episode unfolded on Twitter
With Yogesh Kansal’s help, in this post I provide an exploratory look at the reactions on Twitter to the unfolding of the VW diesel emissions scandal. First, for purposes of comparison, I provide the tweet volume and sentiment for the period from August 15th to August 29th – one month before the period that included the revelations. This will provide a baseline for looking at the later result. Figure 1 provides the volume in that two-week period for VW along with Audi, Skoda (Audi and Skoda are also VW brands), Toyota (which was unaffected due to limited exposure to diesel engines in the US) and Renault (a European manufacturer but with exposure to diesel technology although primarily focused on Europe).
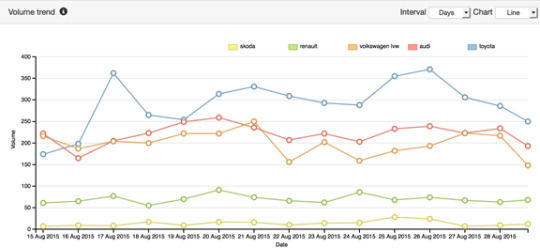
Figure 1: Tweet volume August 15 to August 29, 2015
Since the data are based on 1% of the tweets, these numbers might look small. Nevertheless the numbers are relevant when looking at them in relative terms. In August, Toyota has the highest number of tweets followed by Audi, VW, Renault and Skoda. The next figure (Figure 2) gives us a measure of the sentiments for these brands.
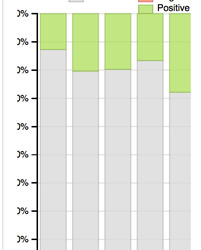
Figure 2: Tweet sentiment August 15 to August 29, 2015
We see from Figure 2 that Skoda (with the smallest volume in Figure 1) has the most positive (almost 30%) and least negative sentiment. In terms of positive sentiment it is followed by VW, Audi, Toyota and Renault. Audi seems to have the most negative sentiment associated with it although overall the negative sentiments are quite small. Zooming on the positive sentiment for VW, in Figure 3 we see that the trend in positive VW sentiment, if any is in the positive direction.
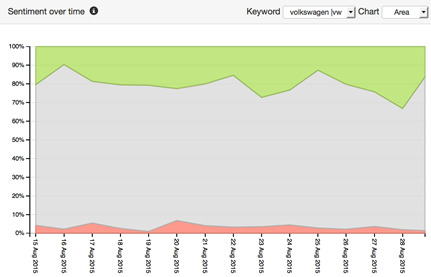
Figure 3: Tweet sentiment trend for VW from August 15 to August 29, 2015
We also look at the word cloud of tweets for VW in this time range, as depicted in Figure 4 below.
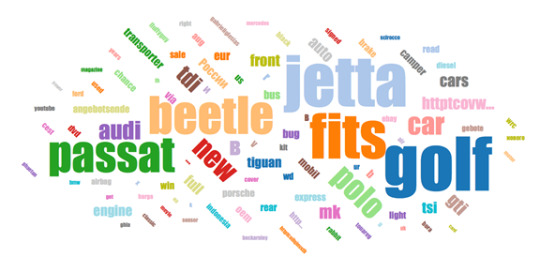
Figure 4: Wordcloud of tweets for VW from August 15 to August 29, 2015
It is clear that there is no hint of the emissions problem or the diesel scandal in the month before it happened. Let us now look at what happened a month later. First we look at the volume trend.
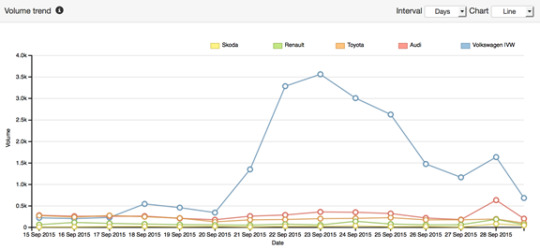
Figure 5: Tweet volume September 15 to September 29, 2015
In Figure 5 we see a dramatic change in volumes of tweets across brands. VW tweets increased 17-fold by September 22nd. By comparison the tweets volumes of the other brands appear miniscule. To see this more clearly, Figure 6 summarizes the information across the time period.
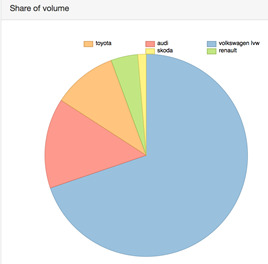
Figure 6: Tweet volume (proportion) over the September 15 to September 29, 2015 period
VW now accounts for 70% of tweets followed by 14% for Audi, only 10% for Toyota, 5% for Renault and 1% for Skoda. Figure 7 shows the reversal in sentiment. We see a declining trend in positive sentiment and an increasing trend of negative sentiment for VW. Figure 8 summarizes the information for the entire time period. We see that VW’s positive sentiment has shrunk to 12% from 21% with most other brands maintaining their share of positive sentiment from the previous month. We also see that negative sentiment for VW had doubled in this period.
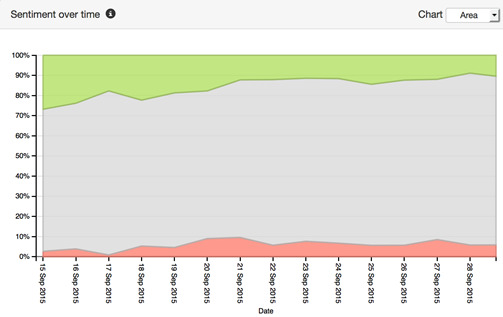
Figure 7: Tweet sentiment trend for VW from September 15 to September 29, 2015

Figure 8: Tweet sentiment from September 15 to September 29, 2015
Next, we start on September 18 and track the content of tweets on a daily basis to assess how they changed in this period from an emission test result to a scandal. Figures 9(a) through 9(l). By the third day the work “scandal” started becoming more prominent in the wordcloud and this has remained the case till the 29th of September. Towards the end we also see the increasing presence of the other VW brands – Audi and Skoda. While Porsche makes an appearance this is likely due to the new CEO being from that VW group company.

Figure 9(a) September 18 – VW Tweets

Figure 9(b) September 19 – VW Tweets
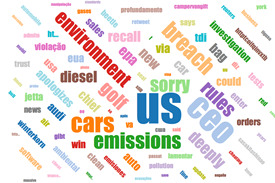
Figure 9(c) September 20 – VW Tweets

Figure 9(d) September 21 – VW Tweets

Figure 9(e) September 22 – VW Tweets

Figure 9(f) September 23 – VW Tweets

Figure 9(g) September 24 – VW Tweets
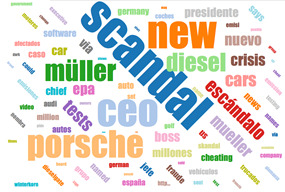
Figure 9(h) September 25 – VW Tweets
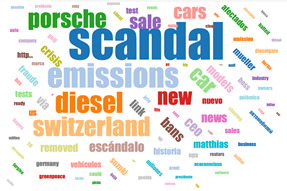
Figure 9(i) September 26 – VW Tweets
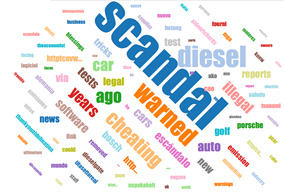
Figure 9(j) September 27 – VW Tweets

Figure 9(k) September 28 – VW Tweets

Figure 9(l) September 29 – VW Tweets
The final set of figures I present have to do with the similarity between the brand in the two time periods; where similarity between 2 brands is defined based on the common words used in tweets corresponding to those brands. Figure 10(a) corresponds to the earlier period and Figure 10(b) pertains to the “scandal” period. Circle sizes represent tweet volumes.
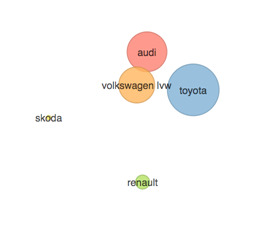
Figure 10(a) Brand similarity August 15-29
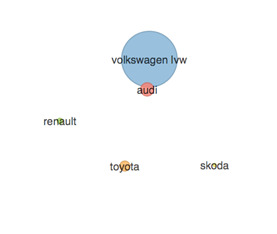
Figure 10(b) September 15- 29
An interesting pattern emerges from the two figures. In the earlier period Toyota and VW are perceived as being similar, largely because they cater to similar customer segments. Audi is also proximal to VW due to common ownership. In the latter period however, we see that VW and Audi are bunched together with the other brands being differently perceived. There is both good and bad news for VW here. On the positive side the scandal is not yet affecting the Skoda brand; and the Audi position hasn’t changed much. The bad news however is that it is no longer perceived to be as similar to its main rival, Toyota.
Overall, we see through this exploratory study the changes in volume, sentiment, content and similarity due to the breaking of the VW scandal.
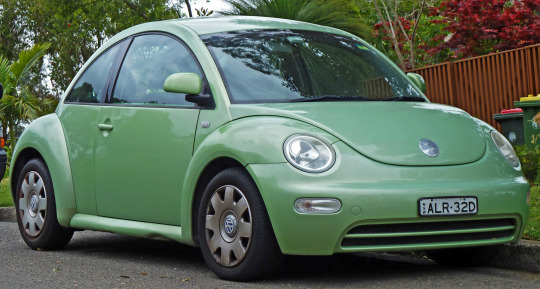
Photo by Volkswagen (Own work) [Public domain], via Wikimedia Commons
0 notes
Photo
Volkswagen and the auto industry – Déjà vu all over again
In the James Bond classic Dr. No, Bond, the character brilliantly portrayed by Sean Connery, deadpans to the title character “World domination. The same old dream.” While world domination per se might not have been on the agendas of the big car manufacturers, many of them have aspired to the top position in the auto industry, and like the fictitious Dr. No have paid a heavy price for it. In the case of the auto firms however, the price has not been fictitious and indeed has been real in terms of sales, profits and most importantly, brand reputations.
One has to go back a few decades, to the 1980s and the 1990s to trace the decline of the longtime market share leader, General Motors. Figure 1, excerpted from Mannering and Winston (1991, Brooking papers), shows how that company lost share over time – with a high of almost 50% in 1979 to the mid-30s by 1989. In large part this decline is attributed to the organization’s hubris. As the Economist magazine noted in 1998, “ALL empires contain the seeds of their own destruction. The ideas on which they were founded cannot adapt to changing times. Their wealth creates bureaucracy and complacency…. GM pops up in management books only as an example of what not to do—blamed for not introducing products quickly enough, for poor labor relations and so on.” The Japanese manufacturers led by Toyota, Honda and Nissan marched forward armed with concepts like total quality management and continuous improvement to gradually raise their share in the US market. By not focusing on their customers, employees and other stakeholders, GM squandered the brand loyalty and reputation that it had taken for granted. The result- losing market share and eventually, profits.
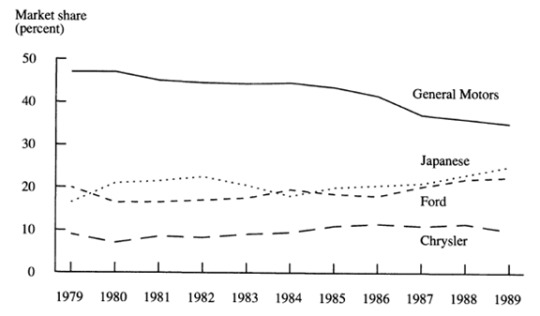
Fast-forward now to 2002; with GM in trouble, executives at Toyota set an ambitious goal – they decide to increase their share of the global auto industry to 15 percent by the year 2010. With that share they would overtake GM to become the world’s largest car manufacturer. Importantly, this meant that would have to grow by a whopping 50 percent in 8 years. This would not be easy as the company would have to build capacity, that too in many different countries and also introduce a veritable slew of new car models to cater to the segments and consumers they were currently not targeting. Well, it turns out that Toyota managed to do that. Remember though, the reason for having a large market share is to then leverage the good experiences consumers have with the product to ensure their subsequent conversion to loyal customers. A big reason why consumers purchased Toyota cars was their quality and reliability year after year. Sadly, in the quest to grow, Toyota sacrificed the one thing that it could not afford to – product quality. By 2010, Toyota had managed to achieve that goal but in January 2010 had to recall tens of millions of cars due to faulty gas pedals that could result in unintended acceleration of cars (reminiscent of the problems that Audi had with its 5000 model between 1982 and 1987 that resulted in several accidents and a few deaths). As the New York Times noted “Toyota managed to win bragging rights as the world’s biggest car company. But that focus on rapid growth appears to have come at a cost to its reputation for quality, creating an opportunity for others to potentially take back market share they lost to Toyota.” Further 3 of their top cars fell out of the Consumer Reports recommended list. Since them Toyota has had to work extra hard to regain the trust and confidence of the public.
Just five years later and we see another car company suffering a fate similar to Toyota’s. In the first half of 2015 VW sold 5.04M units in comparison to 5.02M for Toyota and 4.86M for GM. All this was in line with former CEO Martin Winterkorn’s strategy for the VW group. As quoted in the New York Times (see above), in 2011 he said “By 2018, we want to take our group to the very top of the global car industry.” The goal was, by 2018, for Volkswagen to be “the world’s most profitable, fascinating and sustainable automobile manufacturer,” VW had a sales target of over 10 million vehicles with most satisfied employees and customers to boot. A key part of this strategy however, was the US market. And to increase sales in this market where the demands on fuel efficiency are higher, the company saw “clean diesel” as the way to a larger customer base. Which brings us to the present day and the scandal at hand.
The basic message that these CEOs seem to forget is that being the biggest does not make you the best. If at all, it is the other way around – if you are the best you may become the biggest. CEOs in the auto industry seem to have forgotten this message. What these CEOs can hope is what “Sadness” (one of the emotions in the movie Inside Out) tells “Joy” (one of the other emotions) when the latter is walking through Riley’s (the girls whose emotions these are) mind carrying memory spheres “It's long term memory... you'll get lost in there.” Indeed the hope is that incidents such as these get lost in the long term memories of consumers of automobiles.
Photo By OSX (Own work) [Public domain], via Wikimedia Commons
0 notes
Photo
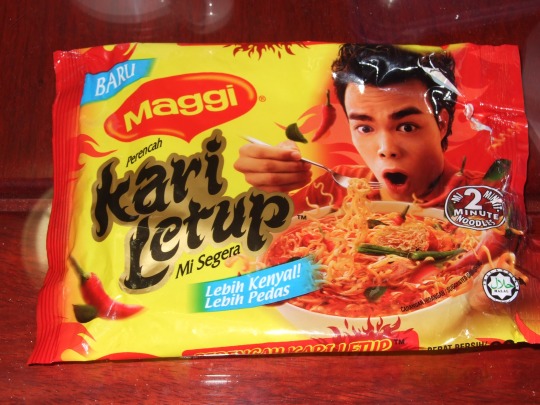
Maggi – the lead crisis
In the cult classic the Princess Bride, the Man in Black (Cary Elwes) engages with Vizzini (Wallace Shawn) over two glasses of wine to identify which is poisoned and which is not. “All right. Where is the poison?” he asks. “The battle of wits has begun.” Consumption of everyday food products by citizens should however, not be a “battle of wits” to determine which product is safe for consumption and which is not. Ultimately that responsibility rests with companies marketing their products and regulatory authorities that test and certify the safety of the products for the general public.
The recent withdrawal of Maggi noodles from the shelves of Indian stores is an unwelcome reminder that all three stakeholders – companies, consumers and regulatory authorities – have to be vigilant when consuming food products, even with those products that have been trusted for a long time. Maggi noodles have, after all been a mainstay at homes, restaurants and dorm rooms since 1983. I was in college then, but the arrival of the little yellow packages provided an added dimension to the college student’s repertoire of late night distractions while trying desperately to catch up with course material for the next day’s exam.
All companies, and especially large multinationals such as Nestle, have a responsibility before, during and after crises. Prior to the occurrence of a crisis it is imperative to take all necessary steps to avoid such an incident. While certainly possible that the company did engage in testing to ensure that the product conformed to Indian standards and regulations, the company does have the benefit of operating on an international scale. This gives it unique access to food standards and regulations from other countries as well. By conforming to the most stringent international standards for food safety the company can boost its trust credentials in all the markets that it operates in. Ultimately, if I am going to ingest a product sold by a company I must trust that the company is doing its best to maximize not just taste and flavor, but also the safety of the product.
Notwithstanding the above efforts, product scares do happen, so what companies do during such scares reflects critically on consumers’ views of them after the crisis. Some of us might recall McNeil / Johnson & Johnson’s decisive moves during the Tylenol scare in 1982. While the cyanide tainted bottles were found only in a few stores in Chicago, the company moved aggressively to immediately recall the product from the entire country. This was not a small amount by any means - about 31 million bottles and a loss of more than $100 million. The company also stopped all advertising for the product. If anything, even though the company was not responsible for the cyanide tainting, they assumed full responsibility for the crisis by ensuring public safety first (see this article for more details on the scare and how to handle a crisis). In a situation such as Maggi’s, there are several actions a company can take:
1. Like Tylenol, remove the product from public access.
2. Communicate to the public that you have withdrawn the product, you believe that the product is safe, and you are undertaking extensive testing to ensure this safety (testing in house and by independent entities, overseas agencies, etc.). What the public needs to see are actions that will restore their trust, not actions that may indicate the company is trying to blame others.
3. Work co-operatively with the testing agencies to understand what might have led to their findings and look for ways to resolve the issues going forward. WithTylenol, the company established relations with the Chicago Police Department, FBI, and FDA. This way it could have a part in the final solution and the role that the agencies played in the future of the product.
After (literally) getting a clean bill of health, the company must work to relaunch the product. In Tylenol’s situation, the company focused on a variety of tactical moves – new tamper-proof packaging, aggressive promotions and increased advertising. In the case of Cadbury and its 2003 worm scare in Maharashtra, the company also invested in new packaging to visually communicate the actions taken to prevent any reoccurrences of worms penetrating the packaging. At the same time, its Project Vishwas to rebuild confidence with retailers and the recruiting of a trusted name, film star Amitabh Bachchan, as brand ambassador were visible investments to win back the trust of the consumer. In Maggi’s case, as the issue centers on the product ingredients, the company has to think of some way of visually communicating a change on the inside (if any) with its packaging. This has to be coupled with effective communications that underscore the learning gained from the experience and a strong desire to rebuild trust, along with an explicitly stated commitment to the market.
Clearly, this is not the first time that Nestle has encountered such an issue – most recently, the company was ordered to recall melamine tainted baby formula in S. Africa in 2008. The use of melamine has typically been associated with an attempt to fake higher levels of protein in Chinese dairy products. This recall followed Taiwanese authorities banning sales of China-made Nestle infant formula and powdered milk after reportedly finding traces of melamine in them. Since dairy products find their way into other downstream foodstuffs like chocolate, the concern was that the problem was likely to be widespread. In response, Nestle announced the opening of a $10.2 million research and development center in Beijing. As reported in Bloomberg Businessweek, the center would invest in, among other equipment, advanced product testing machines that would be able to detect chemicals including melamine. Such moves are an explicit attempt to convey, in unequivocal terms, the company’s commitment to serving the needs of the consumers in those countries.
As an input for monitoring the situation, Nestle may also be interested in gauging consumer reactions to the Maggi episode. With help from Yogesh Kansal, I show below some data from Twitter from the period of May 12 to June 11 on tweets about Maggi Noodles. The first graph pertains to the daily volume of tweets in this period (each tick on the horizontal axis represents as day). As comparison, I provide the corresponding tweet volume for the term “Ramen” which includes the class of noodles and the brand Top Ramen. This is to see if volume and other metrics were differentially affected across these two brands.
Figure 1: Tweet volume
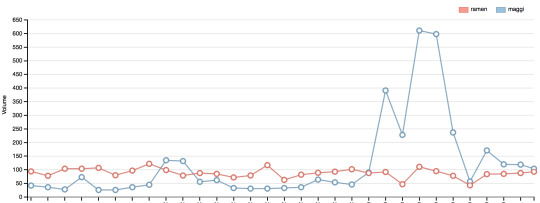
The blue line depicts the volume for Maggi and the red line for Ramen. It is clear that there is an increased activity first around May 21st – the initial reports about the problem. The volume then spikes dramatically in the latter half of the period as more reports of the lead issue crop up. To get a sense of what the “twitterati” were saying about the brand, I present the word clouds from the tweets below. Figure 2 is the word cloud for Maggi and Figure 3 is the corresponding one for Ramen.
Figure 2: Maggi Wordcloud
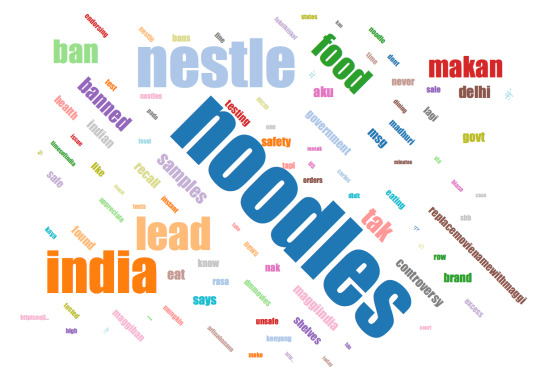
Note that the font size represents the relative volume of that word mentioned in the tweets in that period. We see that the problem issues figure prominently in Maggi’s cloud – “lead”, “ban”, “banned”, “testing”, “controversy” are all words that appear in the tweets indicating the top of mind awareness of these issues. By comparison, Figure 3 below shows much less evidence of an issue with Ramen noodles.
Figure 3: Ramen wordcloud
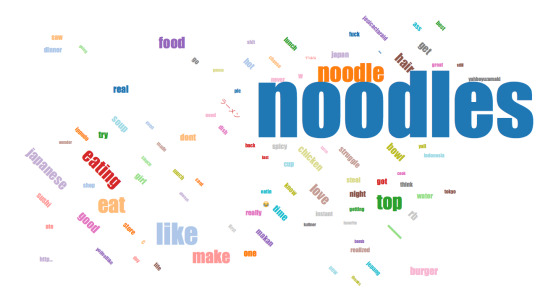
Next, I look at the sentiment for the brands over time:
Figure 4: Brand sentiment: Maggi
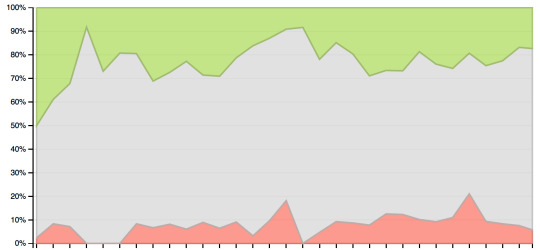
The green region represents positive sentiment, the red negative sentiment, and the grey neutral sentiment. Once again the data are plotted on a daily basis over the period from May 12 to June 11. We see that the strong positive sentiment for Maggi at the beginning of the time period is waning and there are two negative blips in sentiment corresponding to the release of reports and the recall imposed on the product.
Figure 5: Brand sentiment: Ramen
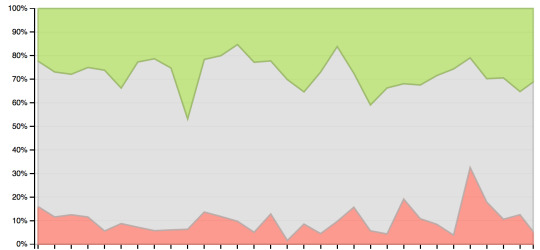
For Ramen we see the positive sentiment holding steady. However, there does appear to be some negative spillover in the later time periods. This is something the brands involved need to monitor carefully.
A question one may ask of all the above analyses is whether these patterns occur at other time periods irrespective of the negative news. In Figure 6 below, I plot the difference in the volume of tweets for the two brands relative to a benchmark period – the previous month’s tweets, the period of April 11 to May 11.
Figure 6: Difference in volume relative to a benchmark period

Figure 6 seems to clearly show that while the volume for Ramen was indistinguishable between the two time periods, Maggi tweets show a dramatic increase in tweets during the period of the trouble. This suggests that the increase in tweets is likely associated with the issues the company is facing.
The above analysis is purely exploratory in nature, but is suggestive of the types of monitoring companies can do of their brands to understand customer views and sentiments. By carefully monitoring these, Nestle may be able to chart a path back into the hearts and minds of its customers.
Originally posted on ETrail.com
Photo by asiangrocerch
#BoothMKTG#Pradeep Chintagunta#nestle#maggis#ramen#tweet#Twitter#word cloud#tylenol#cadbury#brand building#food safety
0 notes
Photo
McDonald’s recent moves – what do the data say and should the company be “lovin’it”?
In my last column I discussed some of McDonald’s recent marketing moves, and now this week I will look at the impact it has had on social media, specifically Twitter. As with most of these analyses involving Twitter, my thanks to Yogesh Kansal for making this possible.
First, let’s take a look at the volume of Tweets corresponding to McDonald’s actions. The data in the chart below represent a random sample of tweets about the company (representing a fixed proportion, say 1%, of the tweets about the company each day). We will look at the time period from March 24– the day of the “I’m lovin it 24” campaign – to April 2nd, a couple of days after the “breakfast all day” and “free coffee” announcements.
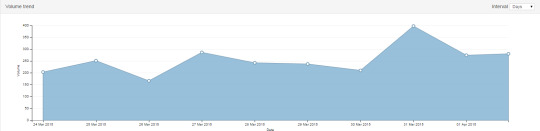
The chart suggests that the later announcements of the all-day breakfast and the free coffee giveaway had a bigger impact than the campaign across the 24 cities, at least for this time period. The next question is what happened to the sentiment (either positive or negative) expressed in these tweets over that time period, depicted in the chart below:
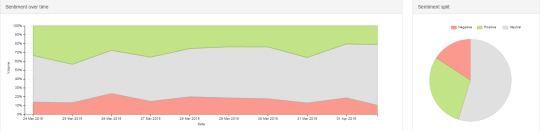
The pie-chart shows the sentiments expressed in the tweets throughout the period analyzed. Green represents positive sentiment, pink the negative sentiment and grey a neutral sentiment. Overall, it appears that a majority of the sentiments expressed are neutral. Further, the positive sentiment exceeds the negative sentiment. The time series pattern is also interesting. The company seems to have received a bump up in positive sentiment and a reduction in negative sentiment corresponding to both the marketing announcements. So while the “I’m lovin it 24” campaign did not generate many more tweets, it does seem to have shifted sentiment in favor of the company. The later announcements however, appear to have increased both the volume as well as the positive valence of the sentiments.
Next, we take a closer look at what is being said about the company in the tweets themselves. For this we first analyze the words in the tweets and then depict these words in sizes corresponding to the frequency of their mentions – i.e., larger fonts imply more frequent mentions.
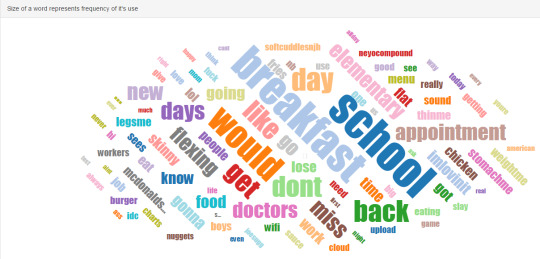
The figure above indicates that the word “breakfast” gets a large number of mentions. To see if this is driven by the announcement however, one needs to compare this figure to one generated in a time period without such an announcement. Indeed, repeating this analysis for the March 9th – March 18th time period does reveal the presence of the same term but with a much lower frequency of mentions. We also see the terms “imlovinit” and “neeyocompound” show up, which is reflective of the earlier campaign on the 24th (there were no corresponding mentions in the earlier time period). Finally, other initiatives also appear to have triggered some conversations, such as “workers” in the figure above.
To get a better sense as to what was happening with other firms during the March 24th to April 2nd time period, the figure below shows a comparison in volume with those for Burger King. The figure definitely shows some relative movement in the volume corresponding to McDonald’s announcements (the blue line) – such effects are absent in the line for Burger King (pink).
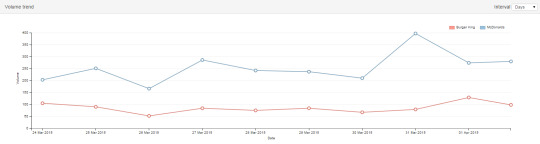
Next, I compare the overall sentiments for the two firms over this time period:
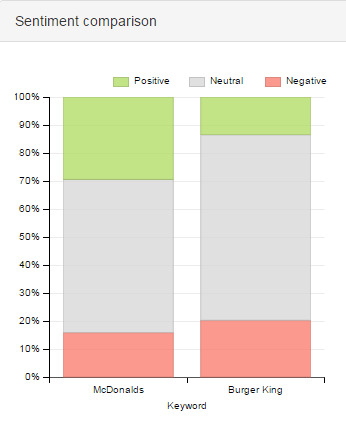
The figure above shows that McDonald’s has a greater positive sentiment associated with its tweets (29% versus 14%) and a lower negative sentiment (16% versus 20%) as compared to BK. Again, looking at these numbers in isolation is not very informative about the impact of the announcement, so one might want to know the sentiments associated with the two firms in the earlier time period (March 9th – March 18th). In this period McDonald’s positive sentiment level was 25% while Burger King’s level was 14%. So while one may not be able to draw any statistical or scientific inferences from this comparison at least in terms of directionality, McDonald’s appears to be better off after the announcements.
For one last piece of comparison, below is the word cloud corresponding to Burger King during the announcement period of interest:
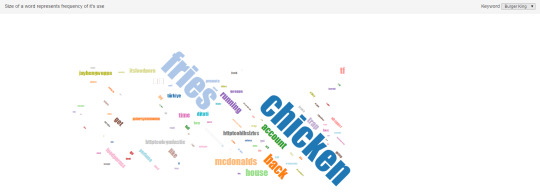
This figure suggests an entirely different focus for tweets about BK. This is not entirely surprising since the sets of tweeters for the two companies show little overlap, as the figure below suggests:
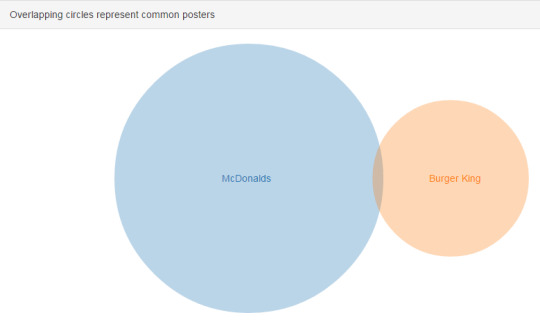
In summary, volume-wise the events on March 24th do not appear to have had a big impact compared to those on March 30th and 31st. However, both events seem to have generated positive sentiments among posters of the tweets. The word analysis also indicates some traction for the messages the firm was trying to communicate.
Photo by stratman² (2 many pix!)
#BoothMKTG#McDonald's#burger king#ImLovingIt#breakfast#fries#Pradeep Chintagunta#Twitter#egg mcmuffin
1 note
·
View note
Photo
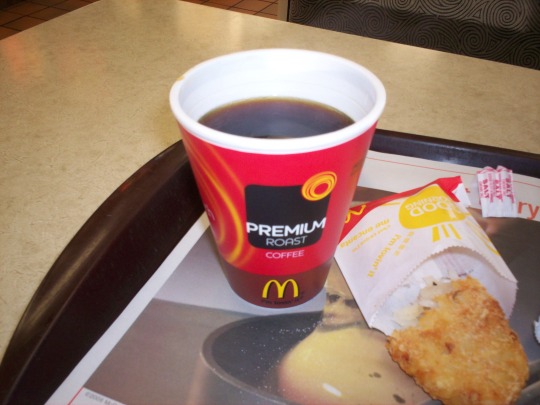
McDonald’s – more than just a clothing line?
In the last few days, McDonald’s – the Oakbrook basedfast-food company – has been in the news for reasons other than its recent financial woes. The firm has been making a flurry of announcements ranging from a line of clothing at a fashion show in Sweden to raising employee wages at its company-owned stores in the US (see my recent interview with CBS Chicago). While the financial consequences of such moves will likely be debated (and heavily) elsewhere, in this post I’d like to take a look at the marketing moves associated with these announcements, and in my next post the reactions to these announcements on social media, especially Twitter.
In particular, McDonald’s has made 3 marketing-specific announcements. First was the “I'm lovin' it 24” campaign - a global marketing effort that took place simultaneously in 24 cities in 24 different countries on March 24. The effort ranged from customers in Manila driving through a toll booth that had been temporarily converted into a McDonald's drive-thru and provided them with a free toll and breakfast to a surprise performance by Ne-Yo in Los Angeles. This endeavor by McDonald’s was targeted at reaching a younger, global audience – a group that the company is fighting hard to attract and retain (see recent article in AdAge) On the plus side, such a move could generate buzz for the brand, globally and otherwise, and also introduce potential new customers to its products and existing customers to products they may not have tried before. From an operational perspective, taking into account the extent to which these events went smoothly, McDonald’s could potentially benefit from such an initiative. Of course, the ROI of a move such as this is difficult to compute.
The second marketing initiative took place a few days later: the announcement that McDonald’s was testing the possibility of offering its breakfast items (e.g. the Egg McMuffin) throughout the day rather than only during a fixed period in the morning. This has been a move that both consumers and business folk have been calling for, given (a) the appeal of the breakfast items; (b) increased competition from other fast-food and fast-casual restaurants for this market; and (c.) it provides another reason for potential customers to walk into a McDonald’s. A key downside to this type of move, however, would be its impact on the operations within a store and the ability to deliver products quickly and at designed quality levels to customers. If adding these breakfast items detract from say, the speed of service in the store, then such a move could result in deleterious consequences for the firm.
The third marketing initiative was also launched by McDonald’s at the end of March: the announcement that the company will give patrons a free small McCafe coffee during breakfast hours from March 31 through April 13. Clearly, this is an attempt both to get current customers to sample the coffee they might have otherwise bought elsewhere and also to attract customers to walk into the store to get the free coffee but then purchase other items on the menu before walking out. In addition, McDonald’s announced that it was holding sampling events at transportation hubs and other high-traffic locations, where it plans to give free coffee to commuters. Such customers are at a greater risk of visiting McDonalds’ competitors like Starbucks, and a good experience with coffee from McDonald’s might dissuade them from doing so.
Of course, at the end of the day, the main reasons why people eat at McDonalds are the quality of the food (especially in a world of changing tastes), value, and convenience (locations and speed of service). Unless the company makes strides on all these dimensions, it will continue to struggle in the current environment. As Dominic Toretto (Vin Diesel) in Furious 7 puts it, “this time it ain’t just about being fast,” so too would McDonald’s be well-served by focusing on all the dimensions of success, not just operational efficiency.
Photo by Paul Swanson
1 note
·
View note
Photo
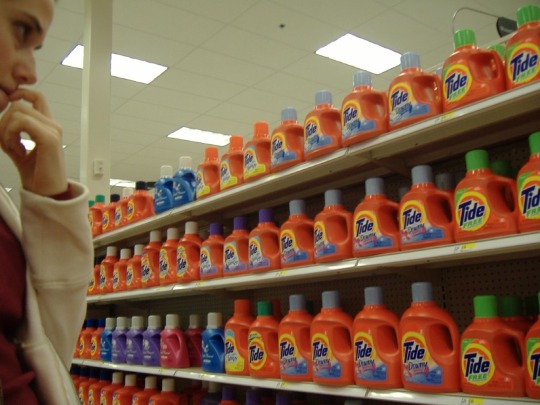
To hold the line or to shorten it…that’s the question
In the film Lord of the Rings: The Fellowship of the Ring (the first of the series), Bilbo Baggins (Ian Holm) says rather plaintively to Gandalf (Ian McKellan) that he feels “Sort of stretched, like... butter scraped over too much bread.” Firms with large product portfolios often feel like Bilbo. Indeed, Procter & Gamble recently announced its decision to pare 100 brands from its large product stable. Companies, especially those dealing in fast moving consumer goods (or FMCG products) periodically undertake the exercise of “rebalancing” their portfolio much as investors are admonished to rebalance their portfolios to ensure that they are “on track” to achieve their financial objectives. Generally speaking, what are the factors driving this portfolio reduction exercise?
First and foremost, the company needs to keep its eyes on the prize – who are our target customers and how can we most efficiently meet their needs? In other words, are there customer segments that we are currently serving that do not belong to our long-term set of targeted customers? Even if a business is thriving and profitable, when the customers that business catered to no longer fit the company’s strategic plan, their elimination is prompted. For example, if P&G no longer wishes to target customers for food products, there is little justification for holding on to products like Jif, Pringles, etc. - all brands that have been previously sold. At the same time, other brands like Dreft detergent, while small in size, might serve a strategic purpose. Dreft targets baby clothes, consistent with P&G’s focus on diapers and other baby-related products. In such cases, it may make sense to retain these brands in the portfolio. According to company reports, there are four sectors the company wants to focus on: household products, paper goods, beauty and grooming. By concentrating on customer needs in these sectors and innovating to add value to the targeted customers, P&G can get back on the path of adding value to customers, growing its businesses and benefiting its stakeholders.
A second consideration is where the products are in their life cycles. If a product has the potential for large sales volume in the short run, but would need significant investment in technology to ensure future growth and new applications, that might be a reason for jettisoning the business as well. Take the case of Duracell batteries. This is a business that will likely see a sustained volume over time; after all, we have plenty of electrical and electronic devices that need to be powered. Nevertheless, with the advent of new technologies, it is unclear how well this fits the profile of the typical FMCG customer especially in a world where devices might come with built-in batteries that can be recharged over the lifetime of the device. Since the business is still profitable it may make sense to sell the product to a different type of player, one who not only values the current steady revenue stream but may also be willing to invest in the new technologies necessary to create a sustainable business.
While starting with the targeted segments, both current and future, as the basis for product-line rationalization represents a “bottom-up” approach, many times companies also assess the performance of their brands from the perspective of the financial objectives they might have for them. So if a brand does not meet the company’s internal hurdle rate for profits, growth, rank in category or other priorities, eliminating the brand will leave the company with a set of products that do. In P&G’s case, the eliminated brands together would only account for 10 percent of the company’s sales and less than 5 percent of its profit in the past three years. Such a “top down” approach is also a popular paring mechanism when companies market multiple product lines.
FMCG companies, especially large ones like P&G, tend to be acquisitive in nature – on the prowl for products to add to their portfolios that might enhance shareholder value. Unfortunately, acquisitions can sometimes also bring with them products that don’t fit the company’s strategic agenda, or they could result in a duplication of products already in the firm’s portfolio. For example, the acquisition of Gillette brought with it toothbrush brands like Oral-B to P&G’s portfolio. However, P&G already had its Crest product line containing both toothpaste and toothbrushes. Thus the question becomes: should the firm retain both its brands or eliminate one of them?
Sometimes, the macro-economic environment induces companies to launch new products or firms to introduce products to cater to customers in specific channels. However, if those conditions change, the firm might find the continued presence of the new products as detracting from the positioning of the original products. For instance, in 2009 Procter & Gamble attempted to appeal to budget-conscious consumers by launching a lower-priced version of Tide detergent called Tide Basic. The product had limited distribution – primarily in Wal-Mart and Kroger- and was not widely available throughout the country, largely being sold in the southern part of the U.S. Eventually, with the economy beginning to upturn, Tide Basic would have been a distraction from the premium, value-added positioning of P&G products. The company therefore decided to axe the product.
Ultimately, companies need to make a tradeoff between the risks in carrying a product that might have an uncertain future against the potential rewards that might accrue from continuing with the brand. Making these tradeoffs would enable a company to manage a portfolio that best positions it to succeed. As Harry Hart (Colin Firth in Kingsman: The Secret Service) notes “If you're prepared to adapt, you can transform.” Companies will be well served by following Harry’s advice.
Photo by Rachel
0 notes
Photo

Social Media Interactions: Like a good neighbor…..
In the past I have discussed how firms have leveraged the power of social media to create interesting new business models (see previous post on Punchh). In this column I look at how social media can help companies deal with other issues and emergencies. Rather than describe the scenario myself, I have invited Chicago Booth Executive Education alumna Amy McClellan, Director of Marketing at Martin’s Supermarkets, located in Indiana, to explain what happened. What follows is her account.
“Unfortunately, one of our stores was victim to a tragic event in January of 2014. At approximately 10:15 p.m. on January 15, allegations were being made on social media that a shooting had just occurred inside of our supermarket locations. As Director of Marketing for the company, responsible for Public Relations as well, I was awoken by my husband to find this out after he noticed the posts on Facebook. Immediately, we turned on the local ten o'clock news and found citizen reporters on the scene speaking to the local Fox affiliate. Police had responded and closed the store not letting anyone in or out. Additional reports from the other local new affiliates filled the 11:00 p.m. broadcasts as well. No confirmation of deaths were being reported at the time as police had not released a statement yet.
Shortly after I began watching the news coverage, I received a call from our company President and CEO. What I had feared was reality. There had been 3 deaths inside our store: a customer, an employee and the shooter. I continued for the next hour to monitor the comments on social media and decided at 12:24 a.m. to post a comment, as follows:
Shortly after (12:45 a.m.) the Indiana State Police held a live press conference announcing the 3 deaths. We released an additional statement the morning following the event to the media and on our Facebook page with the same message. Social media was the most effective way to quickly communicate with our customers without having to rely on a third party news organization to get our message right. Additionally, national news organizations did not have to contact us for a comment, rather they used our Facebook page to relay our message across the entire country. As I watched the national news coverage the morning following the event and even 2-3 days later, they were using our words on social media as screen images. The statements I had posted were now telling our side of the story, but never did I personally speak to anyone from the national news affiliates.
The other role that social media played in this tragedy was it gave our customers a way to express their care and concern for the victims, our employees, and the community as a whole. The supportive response from the community was overwhelming. Here is a snapshot of one comment on our page that had a profound impact on my own personal journey through the tragic event having been a part of the Martin’s family for over 15 years. I do not personally know the person who wrote this comment but it will always be something I turn to when thinking about what had happened:
As a result, social media not only served as a medium for communication but also as a forum for words of encouragement, communication and healing in the most tragic time of our company history.”
Ultimately, as seen by Amy's account, social media is a means of enabling social interactions. Communicating in a manner akin to talking to a neighbor (about a tragedy in this case), helped the company navigate a difficult event.
Photo by lu_lu
0 notes
Photo

Leap of faith: Even while riding the high horse, CMOs should not lose sight of the ground reality.
‘Integral part of the strategic calculus’
Things CMOs can do and must not do in current times
To a large extent, organisations have been evolving to the point where marketing is viewed as a strategic rather than a tactical function. The typical thinking previously was the firm’s strategy was set by the CEO, CFO and other C-level executives and marketing would be involved only when it came time to translate these strategic objectives into tactical actions — how big a salesforce do we need, how much do we spend on advertising and the like. In many organisations, however, the realisation has dawned that marketing is an integral part of the strategic calculus of the firm — without thinking about which customers one wants to serve, what are the firm’s capabilities in terms of delivering value to these customers and how one can account for competitive actions and reactions vis-à-vis these customers and capabilities, firms are likely to be ill-equipped deciphering what product configurations to offer, what pricing mechanisms to put in place, how to communicate the value of the offerings to the customers and what channel setup to leverage. The consequence is that (i) more and more companies are hiring CMOs — a casual online search reveals the number of companies hiring first-time CMOs; and (ii) these CMOs are increasingly getting a say at the strategic decision-making table.
Data vs information At the same time, a parallel trend is taking shape with respect to the CIO (and occasionally the CDO — chief data officer) and her/his office. As companies are becoming more cognisant of the need for data as a critical input to decision-making, some organisations have moved in the direction of separating the data silo from the marketing silo. This can be a potentially counter-productive trend. Without ready access and integration of the data, distilling it into marketing information and intelligence will become difficult, thereby potentially hindering the strategic marketing function. If a firm starts equating data to information, it might fall into the trap of elevating the office of the person gathering, storing and processing the data into something beyond what it is. On the other hand, a successful organisation is one that either tightly integrates the data and marketing tasks or brings the two functions together under a common umbrella.
Several things have changed; and are still changing. The first is the customer landscape. The customer today is much better informed about products, services and providers. Further, due to the direct connectivity among customers (think social media), information also travels much faster than it used to. So, while the customer was always in the driver’s seat, today (s)he is really revving the engines. As a consequence, the firm needs to make sure that all aspects of the customer experience are superior not just for the moment but also when the customer goes speeding away from the current offerings of the firm. Many a well-established firm has fallen prey to the inability to continuously adapt and stay relevant to the customer.
At the same time, the competitive environment has sharpened as well. No longer are companies competing with just their well-known rivals; today there are new competitors from every corner of the globe with new capabilities, insights and offerings, ready to entice the customer away.
The third is the point I alluded to above — we live in a data-rich environment with bits and bytes pouring in from people (e.g., customers), companies (e.g., rivals’ promotional campaigns from TV to mobile devices, channel partners’ data, etc.), objects (think the “internet of things”) and the environment (e.g., weather patterns, environmental patterns, etc.). To continuously record, assimilate and transform the data into insights is no simple task. All these factors together have strained the capabilities of the firm — not only do your competencies need to address these issues, they need to also adapt to stay current.
Clear the hurdles First and foremost, a CMO dropped into a new organisation must step in with the clear understanding that there is no right or magic formula that applies to all businesses in all markets. Each organisational situation represents a unique challenge that must first be understood and then acted upon. Second, the CMO must be willing to experiment — for example, I may not know that the amount I am spending on advertising is too much or too little. But unless I change my advertising level, I will never know whether it is one or the other. With the willingness to experiment comes the third trait — a willingness and ability to learn and adapt. If something does not work, take away the key learning from the experience to make sure you do not repeat it. Fourth, it is important to institutionalise the insights. The more widespread the sharing of knowledge regarding the firm’s successes and failures and their likely causes, lesser the danger that others will make the same mistakes. Indeed, autopsying both positive and negative outcomes provides a better understanding of what tends to work when. Fifth, eliminate siloed existence. While it might be hard to do, bringing in insights from other disciplines and functions could lead to insights that might have been difficult to identify otherwise.
This article was originally featured in The Hindu BusinessLine
2 notes
·
View notes