
Statistics
We looked inside some of the posts by danielalisa-blog and here's what we found interesting.
Average Info
Notes Per Post
78K
Likes Per Post
46K
Reblog Per Post
32K
Reply Per Post
3
Time Between Posts
18 hours
Number of Posts By Type
Text
4
Photo
10
Link
3
Last Seen Tumblr Blogs


Fun Fact
Tumblr has 16.74 million mobile monthly users in the US.
Text
Collection, Curation & Creating- Week 5
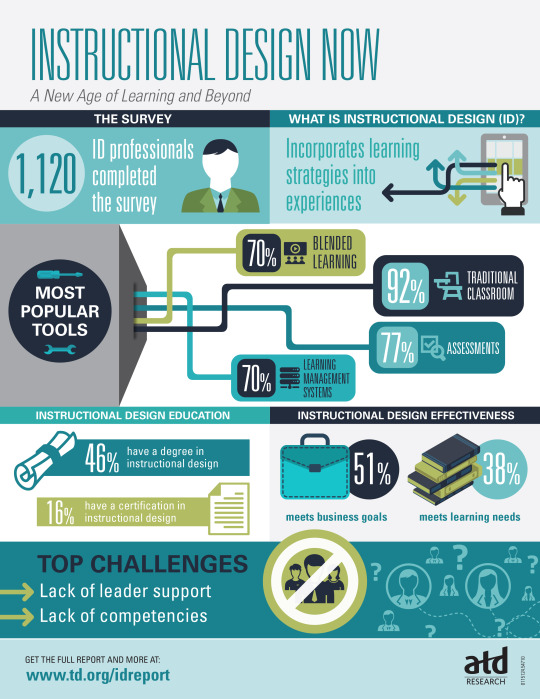
For my collection and curation aspect this week, I found several helpful design exercises that I think will help me make my resources better. The first link that I found was a link that had all of the social media demographics that I plan on using for my infographic resource. I liked how this had an explanation of each of the demographics, such as gender usage on Twitter. This will help me lay out the information that I am going to present on my graphic. This link also had a really interesting design of how the creators showed their infographic. While I think it was definitely unique, I don’t plan on having my infographic designed in the same way because I don’t think that this graphic contained all the necessary information someone might need in order to create a resource that businesses can look at and understand instantly who they are marketing to.
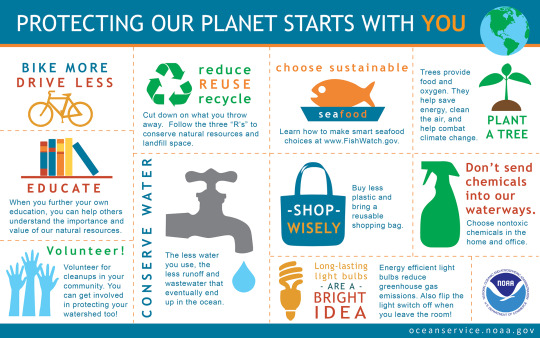
The next infographic that I found has more text than images. This is what I am planning on doing for my informative part. I think that this is a really great example because when I look at it, I can look at the water tap and know that they are talking about water, but it is only until I read the description that I understand the full scope of what the infographic is trying to convey. I think that this graphic would be helpful to me because it shows the relationship between concept and content and shows that in order to create a meaningful resource, the resource must make sense for what you are trying to explain. For example, I don’t think that this resource would have been as useful if it was in a video form because many people aren’t going to want to watch a whole video just to get some tips on how to help the environment. This shows me that the graphic is extremely important in relation to the message it is trying to give.
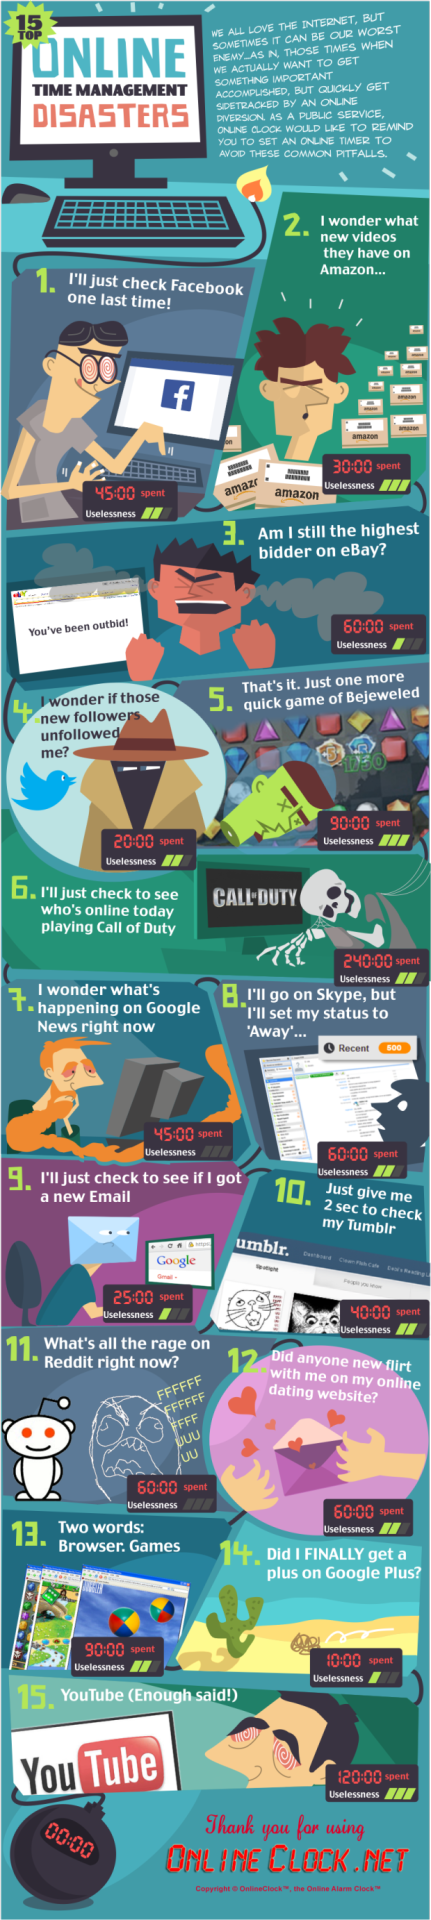
The next graphic that I chose was an infographic that had steps and some images in order to showcase healthcare. I really liked this one for my steps on how to create a Tweet. I believe that I am going to have some words just to point the user in the right direction to create a Tweet, but I am not going to overload the user with words because I believe that pictures will do just the right amount to allow the user to understand what is happening. I think this will help me decide how I am going to design my information because it shows me that while texts are extremely important, it is more important for certain things that images be added in order to understand what exactly is trying to be conveyed in an efficient and effective manner.
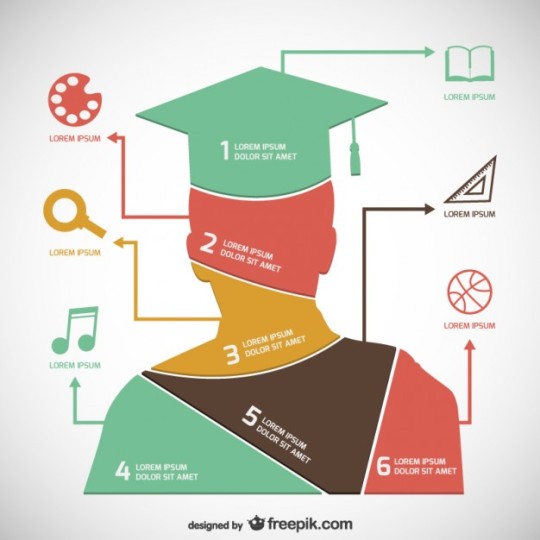
Finally, the last image that I chose was one that had showed a person who graduated with colors covering certain percentages of them. I chose this one because for my infographic, I want to put an image of females and males colored in to whatever percentage represents the portion of users of Twitter. I believe that this image gave me better inspiration and understanding of how to do that in order to make my image make sense.
1 note
·
View note

Photo

This is a rough draft image of an infographic that I created that explains “Twitter by the Numbers.” For this image, I found some statistics online and I put it into a picture form. I did this because the whole idea behind doing Twitter as my larger project is so that people who are wishing to sell their brands can use these images to see if Twitter is the correct place for them to use based on Twitter’s audience. I thought that this design plan was the best for this image because I don’t think that a video or audio file would do this justice. People want something that is easy and quick to look at and this image is something that can be used as a small graphic, such as just putting it as an image on a desktop to quickly reference, or it can be created on a large poster (such as posters in classrooms) that people can continuously refer back to. The information that I have for this text is the statistics that I found online that I plan to integrate in the form of an infographic.
For my instructive, I plan on making another graphic with steps because I am going to be explaining the steps use to create a Tweet, utilizing hashtags. I believe that this graphic is going to be much bigger and contain more information than the actual infographic one. The steps that I am going to have are going to start off with writing a Tweet, then I am going to show how hashtags can allow a tweet to become more visible to people who are on Twitter and are interested in the product, but don’t necessarily follow that particular Twitter user. As with the infographic, since this is going to be used to show people how to gain more interactions with their Tweets, I want it to be very easy to use and something that doesn’t need to be looked at from beginning to end in order to make meaning. I imagine someone composing a Tweet and then realizing that they don’t know which words to hashtag (“should I hashtag, ‘the’ or ‘laundry?’”) and quickly referencing this guide to see that by hash tagging “laundry” they are going to gain more useful and meaningful interactions than if they were to hashtag a word that’s as simple as “the.” Also, since Twitter is extremely interactive, I think that by adding pictures to the steps, it would make it much easier to follow along to as well, since images are a quick reference, in comparison to solely words. For this text, the information that I am going to base this on is my own knowledge of how to use Twitter.
Finally, for my informative part, I am going to show how businesses use Twitter Analytics in order to engage more customers. I imagine this to be more word heavy than graphic heavy. I believe that the only graphics that I am going to show for this part is where to find analytics and what the symbols mean. Other than that, I believe that the words will make it much easier to follow along. Since I want this to be a quick referencing booklet, I believe that by putting it in a poster/graphic form, it will be easy for people to reference in the future. They might see that the analytics function says something like “engagement” and they are not sure what that means, so they can go to the guide, see the symbol that relates to engagement and read up on it. This will allow them to make more sense of why their Tweet may be resonating with some audiences and not others. For this one, I plan on using my understanding of analytics in order to create a meaningful word/graphic combination.
0 notes
Text
Collection, Curation & Creating- Week 4
For my project, I decided to use Twitter as an umbrella topic. For my different resources regarding Twitter, I plan on utilizing infographics and instruction steps that have images as well. I was able to find so many resources online that I plan on use to aid with the development of the design for my topic. The first resource that I found was an infographic about cleaners. Even though this infographic is extremely long and does not relate to my topic, it had so many useful aspects of it. I liked how it was broken down into different sub-categories; like toxic chemicals and ingredients for DIY cleaning. I think when I make my infographic for my resource; I will definitely break it up like that. I might start with the age of users, then go into their average number of tweets sent per day. I think that this will be extremely useful because it will be pleasing on the eye and it might make a lot of sense for the user if it is broken down into simpler steps. I picked another infographic that I found online that really inspired me for the instruction resource. I liked how this infographic was set up with the numbered steps to go alongside the information. To me personally, the steps made a lot of sense and I think that it will be useful to set up how to compose a Tweet in this way since it isn’t just a one-step process. I also liked how there were images that went along with it, because I plan on adding images to my steps. This is because I believe that in order to properly understand how to compose a Tweet, you must see examples of how to do it as well as read a guide. For my final resource that has to do with data analytics, I plan on showing numbers broken down like the final resource. I will show how companies analyze if their Tweets are actually working for the consumer and how they measure the success rate of Twitter on their business. I really loved the colors that were in this infographic and how the colors really conveyed to me a sense of collaboration since they were all from the same color scheme group. I also found a great resource that I plan on using that has a lot of information on the demographics of Twitter. I added it to my Tumblr so I can always come back to it later on when I fully start making my graphics.
0 notes
Link
0 notes
Photo

Dishing the Dirt: Homemade Vs Store-Bought Cleaners
Full size infographic - http://infographicjournal.com/dishing-the-dirt-homemade-vs-store-bought-cleaners/
14 notes
·
View notes
Text
Design- Week 3
The text that I chose is brochure that I found in the Schine Student Center that has facts about Syracuse University.
The audience that I believe this text caters to are potential students. I believe that the motivation that they would have to access this text is to see if the university has all the attributes they want in a school. I think that this is true because it was in the Schine Student Center where the tours of campus originate. It is also next to a lot of other information that a potential student would want, such as housing, and information about the bookstore. Also, I believe that this is for potential students because current students probably know all of the facts that are already stated in the brochure so they wouldn’t be seeking out this information.
I also was able to find the brochure online, which I think is extremely important. Not only can students who visit the university see this information, but also students who are searching online can find out the same information. *For the purpose of this post, I will be talking about the print version because it folds in certain ways, but all the information contained in both are the same.
This brochure contains a lot of images and quick facts. As a result, it doesn’t take a lot of effort to read, so I am able to read it quite easily. If someone were hard of reading small print, this brochure would not be very useful to him or her. But, on the back of the brochure, there is information to obtain additional copies as well as phone numbers to get more information on the school.
The meaning that I take away from this brochure is all of the positive things that Syracuse University has to offer. It states famous alumni, the different programs that are offered as well as a little bit of history about the university. The way that this text opens up, really aids in my reading. As soon as you pick it up and open it, it gives a brief summary of the university, including history of the University, information about The Institute for Veterans and Military Families and information about how global the university is. On the other side is information about academic units and centers for research and scholarship. I think that it was a good idea that these bits of information were put first because it gives a great basis of the university as a whole. As soon as you open the brochure, there are facts about enrollment, student demographics, tuition and financial aid, faculty and staff, degrees conferred, library holdings, current alumni, sponsored program and endowment funds. These are great because it gives a very wide overview of the entire university. The way that the text is set up really guides my reading because it flows in a logical order. There is no obstruction because there are not a lot of images and the font of the text is easy to read and dark. On the back of the brochure contains places where someone can go in order to get more information about the school.
Using the best practices for creating accessible digital texts, the text can only be accessed using layout and design, and images
Layout and Design
The layout of this brochure is extremely simple, but it does get the point across
It is a fourfold brochure, so it is able to have a lot of information and not worry about one side of it being too text heavy
There is only one full side that has an orange background and I think that this was done in order to draw more attention to this, because it has the different schools that make up the university.
On this, the font color is white
On the rest of the brochure the other sides are all white with gray text and the headings are orange.
I think that this is a great tactic because by making it all orange, it might be extremely obnoxious to some people because orange is a bright color
On the four inside sides, the bottom quarter of it is orange, and has white text that has all of the famous alumni that graduated Syracuse University
I think that this was a good idea to do with an orange background because it breaks it up the solid white and gives it some variety
It was smart to do this information with an orange background because it is more “fun” information and not mundane so it doesn’t need to be boring and white
If the color was removed, it would be a boring white brochure that was basically just throwing facts out. By using the color, it makes it more fun to read and it showcases how “orange” the university is.
The flow of the brochure is extremely easy to read and while I was reading it I didn’t get distracted at all, because it was all fact based so it was a quick read
Images
There are only four images in the entire brochure. The main image on the front page of the brochure is of Hendrick’s Chapel. I think that this is a great choice because it is one of the main buildings on campus. If someone were to stand on the quad, they would automatically see the Chapel.
The next two images on the brochure relates to the Institute for Veterans and Military Families and the global aspect of the university.
The first image is of two students in camouflage gear walking through the quad nonchalantly.
I think that this is a great image because it shows that the university encourages Veterans to call Syracuse University their home
The second image is of a racing speedway
This image relates to globalization because it isn’t an image that represents Syracuse University in Syracuse, New York, but it does represent Syracuse University in cities that are all across the globe
The final image in the brochure is inside and it is of a man and a women who are walking on the quad together. The man is on a hover board and the women is walking a dog.
I think they picked this image to show the versatility of the school, because I don’t think a dog and a hover board are something that is shown in any other university’s brochure.
There are other little images on the brochure that are the Facebook, Instagram, YouTube, and LinkedIn symbol.
This shows that the University is constantly evolving with the time and is up-to-date on all the current technologies
This is actually my personal favorite, because by going on these different platforms, you are able to gain more information than if you just looked at a website because these are constantly being updated
http://www.syr.edu/about/pdf/FACTS_2015_2016F.pdf
0 notes
Text
Collection, Curation & Creation- Week 3
This week, I really liked the readings that we did, especially the usability and accessibility aspect of it. In one of the readings (http://technorhetoric.net/20.2/topoi/eyman-et-al/thecase.html), the author spoke about “access as usability” which basically tells people how to design information for the “broadest possible group of users.” I think that is so important because I know that I sometimes fall into the trap of just assuming that everyone has the same skills as me, so what I can do, everyone else can do as well which is extremely naïve of me.
In one of my marketing classes this week, we spoke about media literacy, which refers to “a customer’s ability to access, analyze, evaluate and communicate information in a variety of forms.” We spoke in class about how when some people look at an image, they may get a different idea than what the marketer was attempting to show. This is because the consumer doesn’t have the basic knowledge that the marketer assumes that they have. This definitely relates to usability and accessibility, because if a customer does not understand the image or the text, they will have a hard time interpreting it, thus leading to different ideas being spread.
My first Tumblr post this week is about the Rocket Book Wave. It’s basically a new system that allows a customer to take a picture of their notes, and using the Cloud system, it automatically sends it to whatever location you decide. I am a huge fan of technology and seeing where new things will take us. I think that I would definitely use this system to take notes for my future classes. After my classes are done for the semester, I think that the knowledge that I gained and wrote down is extremely important, but I hate hoarding all of my notebooks from my several years of high school and college, so I mostly end up throwing the notebooks away. But, this new Rocket Book Wave would be a great system for me because I would be able to take pictures of all of my notes and store them on the Cloud so if in the future I need to look at my accounting notes for a higher level accounting class, I can do it efficiently and easy.
My next post directs us to a link on ten guidelines to improve the usability and accessibility of a site. I think that this is extremely important because I know that I sometimes go on websites on my Apple Laptop that look extremely distorted because they were originally made for a PC. It’s important to realize that different people have different ways to access a website, so it’s crucial to make sure that whatever you are creating is able to be used across platforms –including phones. This post also has great additional fast suggestions such as including a transcript for a video that is posted. Not only is this great if someone just wants to skim the information provided, but it also allows people with hearing impairments to gain the same information from the video.
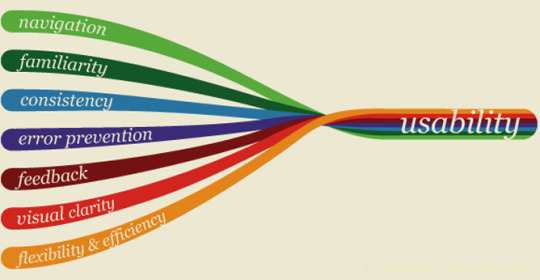
The next image shows all of the different things that must be considered when looking at the usability of a website. I thought this was a fun info-graphic that shows how each of these ties together in order to create usability.
My final post is about how we hold our gadgets. This links to a truly fascinating article that shows where a majority of people place their hands when they are holding something such as an iPad or an iPhone. It is critical to know where people’s hands fall, because if you don’t have that information, you might design an app that is practically unusable. I like how in this article, they are able to back up their findings with studies because it shows how a majority of the population acts.
0 notes
Photo
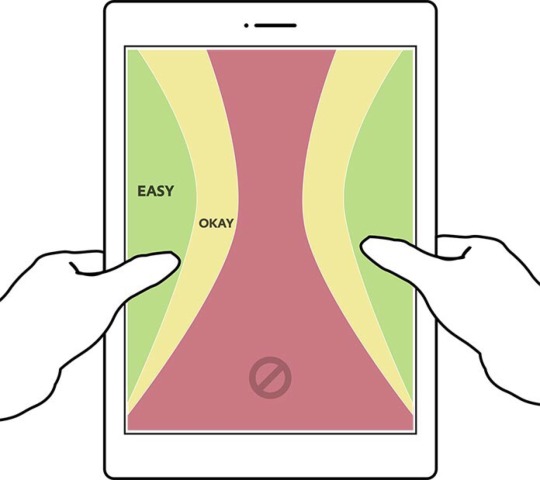
How We Hold Our Gadgets
By Josh Clark:
Where do hands and fingers fall on the device? This question is the linchpin for every form factor this book examines, and the answer tells you how to design your layout for comfort and efficiency. Since we hold phones, phablets, tablets, and laptops very differently, it’s no surprise that each of these touchscreen variations has its own UI needs.
47 notes
·
View notes
Photo


Rocketbook Wave is a cloud connected notebook. more information here
78K notes
·
View notes