I will post my progress on data visualization using Python
Don't wanna be here? Send us removal request.
Text
Selecting the best location for a specialized coffee shop
Colombian coffee production is now focused on excelso coffee instead of producing high volumes of standard coffee. One of the main goals of ColombianGrowers Federation (FNC) is improving the profitability of producers[1], it includes increasing the internal coffee consumption of specialized varieties of coffee
Problem: A group of coffee growers in the department of Nariño1is interested in establishing a specialized coffee shop in Bogota City. They do not produce big quantities of coffee, then, they want to offer a great experience around the excelso coffee, taking advantage of its special sensorial attributes2. Specifically, they want to know the best suitable location for the coffee shop.
Data sources
Neighborhoods:Bogotá is divided in neighborhoods and localities. It was required to have a dataframe describing this relationship. After searching in different web sites, it was decided to use a pdf file which come from the "Secretaria de Salud Distrital" [4], it was required to translate the file into CSV format.
Localities venues: the locality boundaries from the Laboratorio Urbano de Bogota [5].
Neighborhoods venues: I used the Forsquare API for getting the most common venues of each neighborhood in Bogotá city.
Localities socioeconomic aspects:from the Laboratorio Urbano de Bogota [5].
Methodology
First of all, I used iteratively the Nominatim geolocator of geopy Python library in order to get the spatial coordinates of each neighborhood, by means of this procedure I get the following dataframe:

Table 1: Neighborhood spatial coordinates dataframe
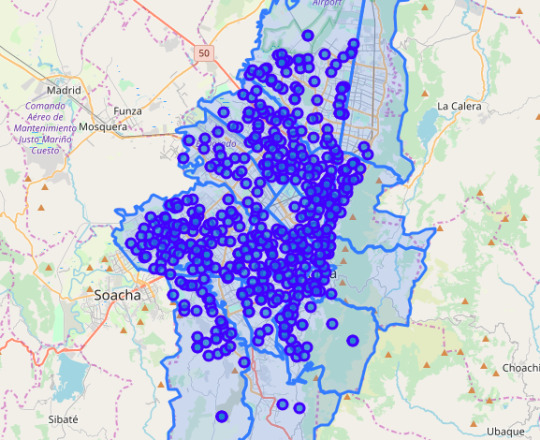
Afterwards, in order to visualize geographic distribution of the neighborhoods I created a map by using the folium Python library, as it is shown in next figure. I also added the localities boundaries, it is really important due to, the majority of local open data is grouped by localities

Figure 1: Bogota neighborhood location
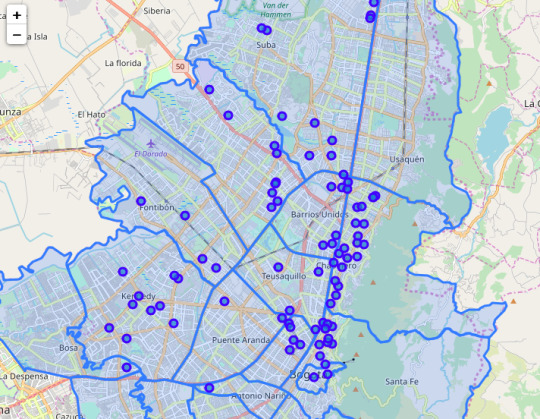
Now, the Foursquare API is used to explore the neighborhoods and segment them. Afterwards the rows where grouped by neighborhood and by taking the mean of the frequency of occurrence of each category. In particular the “Coffee shop” is used to determine the coffee shop density of each neighborhood, is is going to be the main indicator of density of coffee lovers. It was important to consider this aspect due to, the coffee experiences tends to be much more expensive than a traditional coffee shop, then it was required to find the places where there is already a stronger culture for coffee consumption. The results are shown in next figure, where It is possible to identify a big density of coffee shops in Four Localities: Santa Fé, Mártires, Chapinero and La Candelaria

Figure 2: Coffee shops density for different localities in Bogota City
Now, additional aspects are considered to select the best suitable locality. The open socioeconomic data from the Laboratorio Urbano de Bogota[5] was used for this purpose

Table 2: Main socioeconomic aspects of Bogota city localities in 2015[5]
According to these aspects, the Chapinero Locality is the best location for the coffee shop, because the total market is higher (much more people) and the quality of life is better, it means the are better conditions for expensive goods consumption.
4. Results
By means of the geospatial data, it was possible to identify the coffee shops density in Bogota city. By adding additional aspects to the model, such as general socioeconomic aspects, It was possible to identify that the most suitable location for a specialized coffee shop is the locality of Chapinero, this locality provides a high density of coffee lovers and a big market with high capacity for the consumption of these kind of products and services.
5. Conclusion
Colombian coffee production is changing its focus, now the excelso coffee and the experiences around this kind of coffee tends to be more profitable for small coffee growers. The geolocated information of a city is essential for providing a good location for placing new shops and the right conditions for the offer increases the probability to have success.
6. References
[1] Web resource, please refer to: https://www.federaciondecafeteros.org/
[2] Web resource, please refer to:https://en.wikipedia.org/wiki/Nariño_Department
[3] Web resource, please refer to:http://narino.cafedecolombia.com/en/narino/el_cafe_de_narino/por_que_es_diferente/
[4] Web resource, please refer to:http://www.saludcapital.gov.co/DPYS/Tablas%20de%20Referencia/Codificación%20de%20Barrios%20por%20localidad.pdf
[5] Web resource, please refer to:https://bogota-laburbano.opendatasoft.com/explore/dataset/poligonos-localidades/
1Nariño is a department of Colombia located in the west of the country, bordering Ecuador and the Pacific Ocean, please refer to [2]
2A description of sensorial attributes of Café de Nariño is found in [3]
0 notes
Text
My First Python script
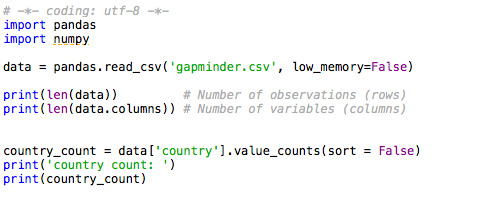
I started checking the data by using the following code:

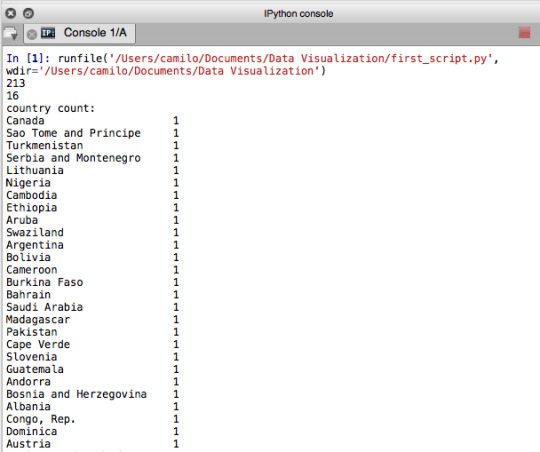
In my case, the gapminder codebook use always numeric variables, such as the lifeexpectancy, then I used the country name as a variable for showing the frecuency distribution. The result is a list with frequency “1″ for all samples showing that there is not repeated lines (as expected):

0 notes
Text
Data Visualization First Assignment
After looking through the the different codebooks, I selected the GapMinder codebook, this codebook is particularly interesting because it is possible to study different real life variables, such as the income per capita, the life expectancy, and co2emissions.
I live at a very crowded city, in theory it is easier to access to the health services, but the air pollution is very high, increasing the probability of suffering respiratory (cardiopulmonary) deseases, as it is descripted in [1] and [2]. In this scenario, I would like to answer the following question: Is there a relationship between the life expectancy and air pollution in big cities?
I will use the life expectancy (lifeexpectancy) as main indicator, and I will try to find a relationship with the cumulative CO2 emissions (co2emissions). The urbanrate could be also an important for describing how populated is a country.
[1] C. Arden Pope, III, Ph.D., Majid Ezzati, Ph.D., and Douglas W. Dockery, Sc.D. Fine-Particulate Air Pollution and Life Expectancy in the United States. The New England Journal of Medicine, 2009. Available on: http://www.nejm.org/doi/full/10.1056/nejmsa0805646#t=articleBackground
[2] Daniel Krewski, Ph.D. Evaluating the Effects of Ambient Air Pollution on Life Expectancy. The New England Journal of Medicine, 2009. Available on: http://www.nejm.org/doi/full/10.1056/NEJMe0809178
[3] Andrew W. Correia, C. Arden Pope, III, Douglas W. Dockery, Yun Wang, Majid Ezzati, and Francesca Dominici. The Effect of Air Pollution Control on Life Expectancy in the United States: An Analysis of 545 US counties for the period 2000 to 2007. The National Center for Biotechnology Information, 2014. Available on: http://www.ncbi.nlm.nih.gov/pmc/articles/PMC3521092/
1 note
·
View note