#time series of cross-sectional data..
Text
قياس أثر تكنولوجيا المعلومات والاتصالات على النمو الاقتصادى بدول إفريقيا جنوب الصحراء منذ عام 2005
قياس أثر تكنولوجيا المعلومات والاتصالات على النمو الاقتصادى بدول إفريقيا جنوب الصحراء منذ عام 2005
قياس أثر تكنولوجيا المعلومات والاتصالات على النمو الاقتصادى بدول إفريقيا جنوب الصحراء منذ عام 2005
المؤلف
جيهان عبد السلام عباس
کلية الدراسات الافريقية العليا- جامعة القاهرة
المستخلص:
تهدف هذه الدراسة الى عرض مفاهيم الاقتصاد الرقمى بالتركيز على أهم مكوناته وهو تكنولوجيا المعلومات والاتصالات ، من…

View On WordPress
#digital economy#economic growth#information and communication technology#subSaharan Africa#time series of cross-sectional data..
0 notes
Text

This third series of maps for @jayrockin‘s “Runaway to the Stars” project represent the planet their Bugferret alien species calls home, a cold, seasonless world with much of its water held up in immense ice sheets and extensive cave systems. As such, a great deal of this world’s oceanic crust is exposed to the air, concentrating what little seawater remains at the subduction trenches and other extremely old, low-lying portions of crust.
First, the planet’s plate tectonics, with the plate boundaries defined in white (for divergent boundaries), black (for convergent boundaries), and purple (for transform boundaries) and the directions of drift marked by red arrows, in Equirectangular Projection and Poles-Centered perspective.
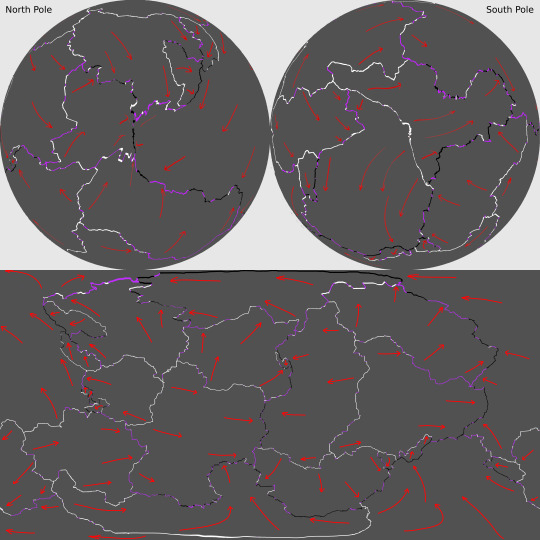
The maps below show the planet’s elevation data, first in grayscale with no color gradient applied, in Equirectangular Projection and Poles-Centered perspective;

then with the color gradient applied, also in Equirectangular Projection and Poles-Centered perspective;

and then with the color gradient once again removed but now showing the planet’s liquid water, in Equirectangular Projection only.

The second phase of this commission focused on the planet’s ice sheets and the liquid water hidden beneath it them.
First, there’s the raw elevation data for the ice in relation to “sea level” -with no contiguous ocean to define this, it is instead defined as 200 meters above the average continental shelf’s edges, correlating to Earth’s own sea level-, along with a key, in Equirectangular Projection;

then, the same data with a color gradient applied;

and again, this time also showing how many meters of ice sit atop the subglacial bodies of water;

and lastly, the thickness of the ice over land as well as water, first in grayscale;

and then with a color gradient applied.

The thickest point in Earth’s own ice sheets is 4,776 meters deep, just a fraction of the Bugferret planet’s maximum of 18,000 meters between the top of the ice sheet and the trench-sea hidden beneath it.
The map below shows the volcanic activity on this planet. Volcanoes marked in pink have erupted in the past millennium, and those marked in white have erupted in the past 300 years Looking back to the ice-cover map that also shows the subglacial water, you can see how some of those lakes are caused by recent eruptions, as are the few ice-free mountain peaks in the higher latitudes.

Lastly, the third phase of this project mapped out the cave systems, expanded tremendously both by modern Bugferret activity and previous eons of dissolution and upheaval by organisms more comparable to fungi, plants, and burrowing detritivores.
The first map below shows all of the major caverns combined into one layer, color-coded by vertical position in relation to the so-called sea level, instead of depth beneath the local surface.

I mapped out these caves in four overlapping layers, here color-coded to represent the tallness of a given chamber. The first of these layers contains those caves closest to the surface;

a bit further beneath the surface;

further down still;

and the lowest layer of all, with its shallowest caves sitting no less than 8,500 meters beneath their local surface.

All the caves shown here can be accessed from the surface, either directly or in connection to other caves, even if the connecting passages are too narrow to be visible at this resolution. Some of these connections can be fully seen or at least suggested in the cross section below, showing the vertical positions of the caverns beneath a mountain range, or a small slice thereof.

This cross section is shown again with a map that marks its location, and that also includes the ice sheets, subglacial and exposed liquid water, and combined caves.

These maps were all created in Photopea. My reddit post dedicated to this project, wherein you can see the highest resolution versions of these images, is linked here.
2022
#runaway to the stars#mapmaking#imaginary maps#worldbuilding#commission#digital painting#photopea#Bugferrets#fictional planets#elevation map#color gradients#ice maps#liquid water map#cave systems#major project#alien planet#Christopher Maida Artwork
62 notes
·
View notes
Text
This Week in Rust 534
Hello and welcome to another issue of This Week in Rust! Rust is a programming language empowering everyone to build reliable and efficient software. This is a weekly summary of its progress and community. Want something mentioned? Tag us at @ThisWeekInRust on Twitter or @ThisWeekinRust on mastodon.social, or send us a pull request. Want to get involved? We love contributions.
This Week in Rust is openly developed on GitHub and archives can be viewed at this-week-in-rust.org. If you find any errors in this week's issue, please submit a PR.
Updates from Rust Community
Official
Announcing Rust 1.76.0
This Development-cycle in Cargo: 1.77
Project/Tooling Updates
zbus 4.0 released. zbus is a pure Rust D-Bus crate. The new version brings a more ergonomic and safer API. Release: zbus4
This Month in Rust OSDev: January 2024
Rerun 0.13 - real-time kHz time series in a multimodal visualizer
egui 0.26 - Text selection in labels
Hello, Selium! Yet another streaming platform, but easier
Observations/Thoughts
Which red is your function?
Porting libyaml to Safe Rust: Some Thoughts
Design safe collection API with compile-time reference stability in Rust
Cross compiling Rust to win32
Modular: Mojo vs. Rust: is Mojo 🔥 faster than Rust 🦀 ?
Extending Rust's Effect System
Allocation-free decoding with traits and high-ranked trait bounds
Cross-Compiling Your Project in Rust
Kind: Our Rust library that provides zero-cost, type-safe identifiers
Performance Roulette: The Luck of Code Alignment
Too dangerous for C++
Building an Uptime Monitor in Rust
Box Plots at the Olympics
Rust in Production: Interview with FOSSA
Performance Pitfalls of Async Function Pointers (and Why It Might Not Matter)
Error management in Rust, and libs that support it
Finishing Turborepo's migration from Go to Rust
Rust: Reading a file line by line while being mindful of RAM usage
Why Rust? It's the safe choice
[video] Rust 1.76.0: 73 highlights in 24 minutes!
Rust Walkthroughs
Rust/C++ Interop Part 1 - Just the Basics
Rust/C++ Interop Part 2 - CMake
Speeding up data analysis with Rayon and Rust
Calling Rust FFI libraries from Go
Write a simple TCP chat server in Rust
[video] Google Oauth with GraphQL API written in Rust - part 1. Registration mutation.
Miscellaneous
The book "Asynchronous Programming in Rust" is released
January 2024 Rust Jobs Report
Chasing a bug in a SAT solver
Rust for hardware vendors
[audio] How To Secure Your Audio Code Using Rust With Chase Kanipe
[audio] Tweede Golf - Rust in Production Podcast
[video] RustConf 2023
[video] Decrusting the tracing crate
Crate of the Week
This week's crate is microflow, a robust and efficient TinyML inference engine for embedded systems.
Thanks to matteocarnelos for the self-suggestion!
Please submit your suggestions and votes for next week!
Call for Participation; projects and speakers
CFP - Projects
Always wanted to contribute to open-source projects but did not know where to start? Every week we highlight some tasks from the Rust community for you to pick and get started!
Some of these tasks may also have mentors available, visit the task page for more information.
* Hyperswitch - [FEATURE]: Setup code coverage for local tests & CI * Hyperswitch - [FEATURE]: Have get_required_value to use ValidationError in OptionExt
If you are a Rust project owner and are looking for contributors, please submit tasks here.
CFP - Speakers
Are you a new or experienced speaker looking for a place to share something cool? This section highlights events that are being planned and are accepting submissions to join their event as a speaker.
Devoxx PL 2024 | CFP closes 2024-03-01 | Krakow, Poland | Event date: 2024-06-19 - 2024-06-21
RustFest Zürich 2024 CFP closes 2024-03-31 | Zürich, Switzerland | Event date: 2024-06-19 - 2024-06-24
If you are an event organizer hoping to expand the reach of your event, please submit a link to the submission website through a PR to TWiR.
Updates from the Rust Project
466 pull requests were merged in the last week
add armv8r-none-eabihf target for the Cortex-R52
add lahfsahf and prfchw target feature
check_consts: fix duplicate errors, make importance consistent
interpret/write_discriminant: when encoding niched variant, ensure the stored value matches
large_assignments: Allow moves into functions
pattern_analysis: gather up place-relevant info
pattern_analysis: track usefulness without interior mutability
account for non-overlapping unmet trait bounds in suggestion
account for unbounded type param receiver in suggestions
add support for custom JSON targets when using build-std
add unstable -Z direct-access-external-data cmdline flag for rustc
allow restricted trait impls under #[allow_internal_unstable(min_specialization)]
always check the result of pthread_mutex_lock
avoid ICE in drop recursion check in case of invalid drop impls
avoid a collection and iteration on empty passes
avoid accessing the HIR in the happy path of coherent_trait
bail out of drop elaboration when encountering error types
build DebugInfo for async closures
check that the ABI of the instance we are inlining is correct
clean inlined type alias with correct param-env
continue to borrowck even if there were previous errors
coverage: split out counter increment sites from BCB node/edge counters
create try_new function for ThinBox
deduplicate tcx.instance_mir(instance) calls in try_instance_mir
don't expect early-bound region to be local when reporting errors in RPITIT well-formedness
don't skip coercions for types with errors
emit a diagnostic for invalid target options
emit more specific diagnostics when enums fail to cast with as
encode coroutine_for_closure for foreign crates
exhaustiveness: prefer "0..MAX not covered" to "_ not covered"
fix ICE for deref coercions with type errors
fix ErrorGuaranteed unsoundness with stash/steal
fix cycle error when a static and a promoted are mutually recursive
fix more ty::Error ICEs in MIR passes
for E0223, suggest associated functions that are similar to the path
for a rigid projection, recursively look at the self type's item bounds to fix the associated_type_bounds feature
gracefully handle non-WF alias in assemble_alias_bound_candidates_recur
harmonize AsyncFn implementations, make async closures conditionally impl Fn* traits
hide impls if trait bound is proven from env
hir: make sure all HirIds have corresponding HIR Nodes
improve 'generic param from outer item' error for Self and inside static/const items
improve normalization of Pointee::Metadata
improve pretty printing for associated items in trait objects
introduce enter_forall to supercede instantiate_binder_with_placeholders
lowering unnamed fields and anonymous adt
make min_exhaustive_patterns match exhaustive_patterns better
make it so that async-fn-in-trait is compatible with a concrete future in implementation
make privacy visitor use types more (instead of HIR)
make traits / trait methods detected by the dead code lint
mark "unused binding" suggestion as maybe incorrect
match lowering: consistently lower bindings deepest-first
merge impl_polarity and impl_trait_ref queries
more internal emit diagnostics cleanups
move path implementations into sys
normalize type outlives obligations in NLL for new solver
print image input file and checksum in CI only
print kind of coroutine closure
properly handle async block and async fn in if exprs without else
provide more suggestions on invalid equality where bounds
record coroutine kind in coroutine generics
remove some unchecked_claim_error_was_emitted calls
resolve: unload speculatively resolved crates before freezing cstore
rework support for async closures; allow them to return futures that borrow from the closure's captures
static mut: allow mutable reference to arbitrary types, not just slices and arrays
stop bailing out from compilation just because there were incoherent traits
suggest [tail @ ..] on [..tail] and [...tail] where tail is unresolved
suggest less bug-prone construction of Duration in docs
suggest name value cfg when only value is used for check-cfg
suggest pattern tests when modifying exhaustiveness
suggest turning if let into irrefutable let if appropriate
suppress suggestions in derive macro
take empty where bounds into account when suggesting predicates
toggle assert_unsafe_precondition in codegen instead of expansion
turn the "no saved object file in work product" ICE into a translatable fatal error
warn on references casting to bigger memory layout
unstably allow constants to refer to statics and read from immutable statics
use the same mir-opt bless targets on all platforms
enable MIR JumpThreading by default
fix mir pass ICE in the presence of other errors
miri: fix ICE with symbolic alignment check on extern static
miri: implement the mmap64 foreign item
prevent running some code if it is already in the map
A trait's local impls are trivially coherent if there are no impls
use ensure when the result of the query is not needed beyond its Resultness
implement SystemTime for UEFI
implement sys/thread for UEFI
core/time: avoid divisions in Duration::new
core: add Duration constructors
make NonZero constructors generic
reconstify Add
replace pthread RwLock with custom implementation
simd intrinsics: add simd_shuffle_generic and other missing intrinsics
cargo: test-support: remove special case for $message_type
cargo: don't add the new package to workspace.members if there is no existing workspace in Cargo.toml
cargo: enable edition migration for 2024
cargo: feat: add hint for adding members to workspace
cargo: fix confusing error messages for sparse index replaced source
cargo: fix: don't duplicate comments when editing TOML
cargo: relax a test to permit warnings to be emitted, too
rustdoc: Correctly generate path for non-local items in source code pages
bindgen: add target mappings for riscv64imac and riscv32imafc
bindgen: feat: add headers option
clippy: mem_replace_with_default No longer triggers on unused expression
clippy: similar_names: don't raise if the first character is different
clippy: to_string_trait_impl: avoid linting if the impl is a specialization
clippy: unconditional_recursion: compare by Tys instead of DefIds
clippy: don't allow derive macros to silence disallowed_macros
clippy: don't lint incompatible_msrv in test code
clippy: extend NONMINIMAL_BOOL lint
clippy: fix broken URL in Lint Configuration
clippy: fix false positive in redundant_type_annotations lint
clippy: add autofixes for unnecessary_fallible_conversions
clippy: fix: ICE when array index exceeds usize
clippy: refactor implied_bounds_in_impls lint
clippy: return Some from walk_to_expr_usage more
clippy: stop linting blocks_in_conditions on match with weird attr macro case
rust-analyzer: abstract more over ItemTreeLoc-like structs
rust-analyzer: better error message for when proc-macros have not yet been built
rust-analyzer: add "unnecessary else" diagnostic and fix
rust-analyzer: add break and return postfix keyword completions
rust-analyzer: add diagnostic with fix to replace trailing return <val>; with <val>
rust-analyzer: add incorrect case diagnostics for traits and their associated items
rust-analyzer: allow cargo check to run on only the current package
rust-analyzer: completion list suggests constructor like & builder methods first
rust-analyzer: improve support for ignored proc macros
rust-analyzer: introduce term search to rust-analyzer
rust-analyzer: create UnindexedProject notification to be sent to the client
rust-analyzer: substitute $saved_file in custom check commands
rust-analyzer: fix incorrect inlining of functions that come from MBE macros
rust-analyzer: waker_getters tracking issue from 87021 for 96992
rust-analyzer: fix macro transcriber emitting incorrect lifetime tokens
rust-analyzer: fix target layout fetching
rust-analyzer: fix tuple structs not rendering visibility in their fields
rust-analyzer: highlight rustdoc
rust-analyzer: preserve where clause when builtin derive
rust-analyzer: recover from missing argument in call expressions
rust-analyzer: remove unnecessary .as_ref() in generate getter assist
rust-analyzer: validate literals in proc-macro-srv FreeFunctions::literal_from_str
rust-analyzer: implement literal_from_str for proc macro server
rust-analyzer: implement convert to guarded return assist for let statement with type that implements std::ops::Try
Rust Compiler Performance Triage
Relatively balanced results this week, with more improvements than regressions. Some of the larger regressions are not relevant, however there was a real large regression on doc builds, that was caused by a correctness fix (rustdoc was doing the wrong thing before).
Triage done by @kobzol. Revision range: 0984becf..74c3f5a1
Summary:
(instructions:u) mean range count Regressions ❌
(primary) 2.1% [0.2%, 12.0%] 44 Regressions ❌
(secondary) 5.2% [0.2%, 20.1%] 76 Improvements ✅
(primary) -0.7% [-2.4%, -0.2%] 139 Improvements ✅
(secondary) -1.3% [-3.3%, -0.3%] 86 All ❌✅ (primary) -0.1% [-2.4%, 12.0%] 183
6 Regressions, 5 Improvements, 8 Mixed; 5 of them in rollups 53 artifact comparisons made in total
Full report here
Approved RFCs
Changes to Rust follow the Rust RFC (request for comments) process. These are the RFCs that were approved for implementation this week:
eRFC: Iterate on and stabilize libtest's programmatic output
Final Comment Period
Every week, the team announces the 'final comment period' for RFCs and key PRs which are reaching a decision. Express your opinions now.
RFCs
RFC: Rust Has Provenance
Tracking Issues & PRs
Rust
[disposition: close] Implement Future for Option<F>
[disposition: merge] Tracking Issue for min_exhaustive_patterns
[disposition: merge] Make unsafe_op_in_unsafe_fn warn-by-default starting in 2024 edition
Cargo
[disposition: merge] feat: respect rust-version when generating lockfile
New and Updated RFCs
No New or Updated RFCs were created this week.
Call for Testing
An important step for RFC implementation is for people to experiment with the implementation and give feedback, especially before stabilization. The following RFCs would benefit from user testing before moving forward:
RFC: Checking conditional compilation at compile time
Testing steps
If you are a feature implementer and would like your RFC to appear on the above list, add the new call-for-testing label to your RFC along with a comment providing testing instructions and/or guidance on which aspect(s) of the feature need testing.
Upcoming Events
Rusty Events between 2024-02-14 - 2024-03-13 💕 🦀 💕
Virtual
2024-02-15 | Virtual (Berlin, DE) | OpenTechSchool Berlin + Rust Berlin
Rust Hack and Learn | Mirror: Rust Hack n Learn
2024-02-15 | Virtual + In person (Praha, CZ) | Rust Czech Republic
Introduction and Rust in production
2024-02-19 | Virtual (Melbourne, VIC, AU)| Rust Melbourne
(Hybrid - in person & online) February 2024 Rust Melbourne Meetup - Day 1
2024-02-20 | Virtual (Melbourne, VIC, AU) | Rust Melbourne
(Hybrid - in person & online) February 2024 Rust Melbourne Meetup - Day 2
2024-02-20 | Virtual (Washington, DC, US) | Rust DC
Mid-month Rustful
2024-02-20 | Virtual | Rust for Lunch
Lunch
2024-02-21 | Virtual (Cardiff, UK) | Rust and C++ Cardiff
Rust for Rustaceans Book Club: Chapter 2 - Types
2024-02-21 | Virtual (Vancouver, BC, CA) | Vancouver Rust
Rust Study/Hack/Hang-out
2024-02-22 | Virtual (Charlottesville, NC, US) | Charlottesville Rust Meetup
Crafting Interpreters in Rust Collaboratively
2024-02-27 | Virtual (Dallas, TX, US) | Dallas Rust
Last Tuesday
2024-02-29 | Virtual (Berlin, DE) | OpenTechSchool Berlin + Rust Berlin
Rust Hack and Learn | Mirror: Rust Hack n Learn Meetup | Mirror: Berline.rs page
2024-02-29 | Virtual (Charlottesville, NC, US) | Charlottesville Rust Meetup
Surfing the Rusty Wireless Waves with the ESP32-C3 Board
2024-03-06 | Virtual (Indianapolis, IN, US) | Indy Rust
Indy.rs - with Social Distancing
2024-03-07 | Virtual (Charlottesville, NC, US) | Charlottesville Rust Meetup
Crafting Interpreters in Rust Collaboratively
2024-03-12 | Virtual (Dallas, TX, US) | Dallas Rust
Second Tuesday
2024-03-12 | Hybrid (Virtual + In-person) Munich, DE | Rust Munich
Rust Munich 2024 / 1 - hybrid
Asia
2024-02-17 | New Delhi, IN | Rust Delhi
Meetup #5
Europe
2024-02-15 | Copenhagen, DK | Copenhagen Rust Community
Rust Hacknight #2: Compilers
2024-02-15 | Praha, CZ - Virtual + In-person | Rust Czech Republic
Introduction and Rust in production
2024-02-21 | Lyon, FR | Rust Lyon
Rust Lyon Meetup #8
2024-02-22 | Aarhus, DK | Rust Aarhus
Rust and Talk at Partisia
2024-02-29 | Berlin, DE | Rust Berlin
Rust and Tell - Season start 2024
2024-03-12 | Munich, DE + Virtual | Rust Munich
Rust Munich 2024 / 1 - hybrid
North America
2024-02-15 | Boston, MA, US | Boston Rust Meetup
Back Bay Rust Lunch, Feb 15
2024-02-15 | Seattle, WA, US | Seattle Rust User Group
Seattle Rust User Group Meetup
2024-02-20 | New York, NY, US | Rust NYC
Rust NYC Monthly Mixer (Moved to Feb 20th)
2024-02-20 | San Francisco, CA, US | San Francisco Rust Study Group
Rust Hacking in Person
2024-02-21 | Boston, MA, US | Boston Rust Meetup
Evening Boston Rust Meetup at Microsoft, February 21
2024-02-22 | Mountain View, CA, US | Mountain View Rust Meetup
Rust Meetup at Hacker Dojo
2024-02-28 | Austin, TX, US | Rust ATX
Rust Lunch - Fareground
2024-03-07 | Mountain View, CA, US | Mountain View Rust Meetup
Rust Meetup at Hacker Dojo
Oceania
2024-02-19 | Melbourne, VIC, AU + Virtual | Rust Melbourne
(Hybrid - in person & online) February 2024 Rust Melbourne Meetup - Day 1
2024-02-20 | Melbourne, VIC, AU + Virtual | Rust Melbourne
(Hybrid - in person & online) February 2024 Rust Melbourne Meetup - Day 2
2024-02-27 | Canberra, ACT, AU | Canberra Rust User Group
February Meetup
2024-02-27 | Sydney, NSW, AU | Rust Sydney
🦀 spire ⚡ & Quick
2024-03-05 | Auckland, NZ | Rust AKL
Rust AKL: Introduction to Embedded Rust + The State of Rust UI
If you are running a Rust event please add it to the calendar to get it mentioned here. Please remember to add a link to the event too. Email the Rust Community Team for access.
Jobs
Please see the latest Who's Hiring thread on r/rust
Quote of the Week
For some weird reason the Elixir Discord community has a distinct lack of programmer-socks-wearing queer furries, at least compared to Rust, or even most other tech-y Discord servers I’ve seen. It caused some weird cognitive dissonance. Why do I feel vaguely strange hanging out online with all these kind, knowledgeable, friendly and compassionate techbro’s? Then I see a name I recognized from elsewhere and my hindbrain goes “oh thank gods, I know for a fact she’s actually a snow leopard in her free time”. Okay, this nitpick is firmly tongue-in-cheek, but the Rust user-base continues to be a fascinating case study in how many weirdos you can get together in one place when you very explicitly say it’s ok to be a weirdo.
– SimonHeath on the alopex Wiki's ElixirNitpicks page
Thanks to Brian Kung for the suggestion!
Please submit quotes and vote for next week!
This Week in Rust is edited by: nellshamrell, llogiq, cdmistman, ericseppanen, extrawurst, andrewpollack, U007D, kolharsam, joelmarcey, mariannegoldin, bennyvasquez.
Email list hosting is sponsored by The Rust Foundation
Discuss on r/rust
3 notes
·
View notes
Photo


Mercedes-Benz G-Class G63 AMG 6X6
A look at the key data of the G 63 AMG 6x6 makes it clear that this model's off-road world begins at a point where anything less than a vehicle with caterpillar tracks would have to capitulate. Six driven wheels, an off-road low-range ratio in the transfer case, portal axles, five differential locks which can be engaged on the move and a tyre-pressure control system which allows the pressure in the huge 37-inch tyres to be adjusted in record time while the vehicle is running – all these are features which one seeks in vain in conventional cross-country vehicles. Together, they ensure that the G 63 AMG 6x6 has driving dynamics which are more than a match for the toughest terrain. As a result, the show vehicle is able to storm up the highest sand dunes with ease while sand tracks hold no fears thanks to its unshakable directional stability. Rocky terrain is negotiated with all the agility of a mountain goat; fording a river becomes almost child's play thanks to the impressive fording capability of one metre. And anyone exploring the on-road performance is certain to be impressed by the catapult-like acceleration of this 3.85-tonne pickup. Despite its unique drive technology, the show vehicle does not actually represent a new development in terms of technology. After 34 years of G-Class production, there is such a large array of "G" parts to draw on that the G 63 AMG 6x6 uses almost exclusively series-production components under the skin. A case in point is the drive train: the AMG V8 biturbo engine with 400 kW (544 hp) and 760 newton metres of torque, the AMG SPEEDSHIFT PLUS 7G-TRONIC automatic transmission paired with the front drive system from the G 63 AMG and a rear twin drive train from the 6x6 version which has already proven its reliability in service with users such as the Australian army.
Plus the ingenious portal axles, which also have military origins, here making their debut in a civilian vehicle. The chassis is largely based on the current production configuration, the only difference being that the helical springs and dampers have been adjusted to take account of the changed characteristics of the three-axle model. For the springs, too, the engineers were able to draw on the comprehensive array of "G" parts, which includes no less than 15 different spring rates. While the front axle takes over the reinforced springs from an armoured special-protection variant, the first rear axle has been given a significantly harder spring rate and the second rear axle a softer one. This set-up, together with the rally-proven, adjustable gas-pressure shock absorbers, results in a perfect symbiosis of sporty dynamism and composed comfort, on or off the road. Visually, the G 63 AMG 6x6 pickup leaves no room for any doubt as to its true calling. The large tyres on the three axles, the huge ground clearance, the height of almost 2.30 metres and the width of some 2.10 metres as well as the clean-cut lines of the pickup immediately inspire respect. Like the G 63 AMG and G 65 AMG models before it, the super off-roader with its 5.87-metre-long body has the characteristic AMG brand face with the "twin blade" radiator grille. Other visual highlights include the use of elegant carbon fibre for the integrated LED light strips above the windscreen as well as for the large flared wheel arches while the rear load area section has a distinctive stainless-steel roll-over bar. The load area, which is lined with particularly tough and durable bamboo, can be accessed by means of a tailboard.
35 notes
·
View notes
Text
Time series vs Panel
Time series data consists of data collected over time, usually at regular intervals. Examples include data on stock prices, temperature, and sales. Time series analysis is a set of methods used to analyze time series data in order to extract meaningful statistics and other characteristics of the data. Some common techniques used in time series analysis include:
Trend analysis: This is used to identify long-term trends in the data.
Seasonality analysis: This is used to identify repeating patterns in the data, such as monthly or yearly patterns.
Autoregressive models: These are used to model the relationship between a time series and its past values.
Moving average models: These are used to smooth out short-term fluctuations in the data and to identify long-term trends.
Panel data, also known as longitudinal data or cross-sectional time-series data, consists of observations of multiple individuals over time. It can be thought of as a combination of time series data and cross-sectional data, with each individual representing a separate time series. Panel data analysis is used to analyze this type of data in order to understand the relationships between variables and how they change over time. Some common techniques used in panel data analysis include:
Fixed effects models: These are used to control for time-invariant unobserved individual characteristics.
Random effects models: These are used to model the influence of both observed and unobserved individual characteristics on the outcome of interest.
Difference-in-differences models: These are used to estimate the effect of an intervention by comparing the difference in the outcome between the treatment and control groups before and after the intervention.
2 notes
·
View notes
Text
Oh so I guess I should cross pollinate for that sweet sweet engagement, ig.
Hi I’m Sam. I host a mildly successful, but wholly non-lucrative podcast about RPGs, called RPG Bookclub.

You know how here on tumblr, it’s awesome when you’re current on a TV show because you can come on here and everyone is guessing what’s happening next and making theories and focused on just the one part we all just saw?
That rules! But video games don’t have that (besides episodic games), so you have to wait till you beat it, or risk spoilers, and talking about the games is a much less easy process until everyone involved has beaten it.
…unless?
Enter the Book Club format, where we artificially pick a stopping point each week, and just discuss 4-ish hours of a game instead of the whole thing, and make our way through a bunch of games.
We try to often play through games people don’t cover often, so if you like the games in the tags, come check us out.
We also have three supporter only sub-series: One where we play the Trails series, every game, in chronological order, called Bookclub no Kiseki. But that's a lot to play each week, so we take some time in the middle to play the Tales of... Series, which are much easier to digest. And the last one, the JRPG Canon, which is more of a review/analysis of the opening section of a bunch of games, and not actually playing them to completion.
If you’d like to check us out, We’re on Apple Podcasts, YouTube, Spotify, Stitcher, and all the other podcatchers that pull their data from one of these three.
You can also find us online at www.rpgbook.club for links to our discord and all that.
Thanks!
#rpgbookclub#podcast#jrpg#jrpg games#persona 3#persona 2#rogue galaxy#Sailor Moon Another Story#legend of dragoon#xenogears#final fantasy x#final fantasy xiii#final fantasy vii#dragon quest v#lost odyssey#cosmic star heroine#dot hack GU#halo#septerra core#anachronox#parasite Eve#deltarune#undertale#lunar the silver star#Chrono trigger#Chrono cross#danganronpa#Phoenix Wright#ys#legend of heroes
5 notes
·
View notes
Link
0 notes
Text
Understanding Advanced Economic Theories: A Master’s Level Guide
When studying economics at the master’s level, students are often required to delve deeper into advanced theories and concepts. For those grappling with the complexities of econometric models, it's common to seek econometrics Homework Help to navigate through assignments that challenge one's grasp of theoretical principles. In this blog, we will present an example of a theoretical question related to econometrics, along with an expert’s answer to showcase how such problems are tackled at the master’s level.
Question:
Discuss the implications of heteroscedasticity in econometric models and the methods used to detect and address it. Explain the theoretical foundation of why heteroscedasticity poses a problem and the corrective actions that can be implemented to ensure the reliability of the model.
Answer:
Introduction to Heteroscedasticity
Heteroscedasticity is a fundamental issue in econometric models, particularly in cross-sectional and time series data. At its core, heteroscedasticity refers to the circumstance where the variance of the errors (or residuals) is not constant across observations. This violates one of the key assumptions of the classical linear regression model, which states that the errors should have a constant variance, a condition known as homoscedasticity.
The presence of heteroscedasticity can lead to inefficiencies in ordinary least squares (OLS) estimators, causing biased standard errors and, consequently, unreliable statistical inferences. Even though the OLS estimators remain unbiased in the presence of heteroscedasticity, their variance estimations become incorrect, making hypothesis testing invalid. This is because the estimated standard errors may be too large or too small, resulting in misleading conclusions about the significance of coefficients.
Why is Heteroscedasticity a Problem?
The theoretical foundation of econometric analysis is built on certain assumptions that, when violated, undermine the reliability of the results. In the context of OLS regression, one of the assumptions under the Gauss-Markov theorem is that of homoscedasticity—meaning the variance of the error terms is constant across all levels of the independent variables. If this assumption is violated (i.e., when heteroscedasticity exists), the estimated coefficients are no longer efficient, which means that the OLS estimator does not have the smallest possible variance among all linear unbiased estimators.
In simpler terms, while the coefficient estimates may still be unbiased, they become less precise, making it harder to determine whether a variable truly has a statistically significant effect on the dependent variable. The incorrect estimation of variances also affects the construction of confidence intervals and hypothesis tests, leading to distorted t-statistics and F-statistics. As a result, one could either incorrectly reject a true null hypothesis (Type I error) or fail to reject a false null hypothesis (Type II error).
Detection of Heteroscedasticity
There are several methods that econometricians use to detect the presence of heteroscedasticity in a regression model:
Graphical Methods:
One of the simplest ways to detect heteroscedasticity is through graphical analysis. A common approach is to plot the residuals against the fitted values (or one of the independent variables). If the residuals exhibit a clear pattern, such as a funnel shape (i.e., the spread of the residuals increases or decreases as the fitted values increase), this suggests that heteroscedasticity may be present.
Breusch-Pagan Test:
This is a formal statistical test used to detect heteroscedasticity. The Breusch-Pagan test examines whether the squared residuals from an OLS regression are correlated with the explanatory variables. If the test statistic is significant, then we reject the null hypothesis of homoscedasticity in favor of heteroscedasticity.
White Test:
The White test is another method to detect heteroscedasticity. Unlike the Breusch-Pagan test, the White test does not require the assumption of a specific form of heteroscedasticity. Instead, it tests for any type of heteroscedasticity by examining whether the variance of the residuals can be explained by the independent variables.
Addressing Heteroscedasticity
Once heteroscedasticity is detected, the next step is to implement corrective measures to ensure the reliability of the econometric model. Several methods can be applied:
Robust Standard Errors:
One of the most common ways to address heteroscedasticity is by using robust standard errors (also known as heteroscedasticity-consistent standard errors). This adjustment allows the standard errors to be unbiased in the presence of heteroscedasticity. By making this correction, the OLS coefficients remain the same, but the standard errors are adjusted to give valid statistical inferences.
Weighted Least Squares (WLS):
Another approach is to use weighted least squares, where the observations are weighted by the inverse of the variance of the error term. This method essentially transforms the model to satisfy the assumption of homoscedasticity, allowing for efficient estimation of coefficients. WLS is particularly useful when the structure of the heteroscedasticity is known or can be reasonably estimated.
Generalized Least Squares (GLS):
If the form of heteroscedasticity is known, GLS can be used to modify the regression equation. GLS transforms the original data so that the errors in the transformed model are homoscedastic. However, this approach requires strong assumptions about the form of heteroscedasticity, which may not always be known in practice.
Respecification of the Model:
In some cases, heteroscedasticity may indicate that the model is misspecified. For example, an important variable may have been omitted, or the functional form of the model may be incorrect. Re-specifying the model, such as using logarithmic transformations for the dependent or independent variables, can sometimes eliminate heteroscedasticity.
Conclusion
Heteroscedasticity is a common issue encountered in econometric models, particularly in empirical research involving real-world data. While its presence does not bias the coefficient estimates, it does affect the precision and reliability of the estimates, leading to incorrect inferences. Detecting heteroscedasticity using methods such as graphical analysis, the Breusch-Pagan test, or the White test is essential. Once detected, remedies such as using robust standard errors, applying weighted least squares, or respecifying the model can help address the issue, ensuring that the results of the analysis are both accurate and meaningful.
For students working through complex econometric problems, understanding these theoretical underpinnings is crucial. With the right approach and assistance from professionals offering econometrics Homework Help, tackling such theoretical challenges becomes much more manageable.
#economics#student#education#university#homework helper#economics homework helper#do my economics homework#econometrics Homework Help
0 notes
Text
5 Power-User Tips to Master Your Free DICOM 3D Viewer
Welcome to the world of medical imaging, where technology transforms the way we diagnose and treat patients.
If you're using a DICOM 3D viewer free version, you might not be tapping into its full potential.
Today, we're sharing five power-user tips that will help you become a master of your DICOM 3D viewer.
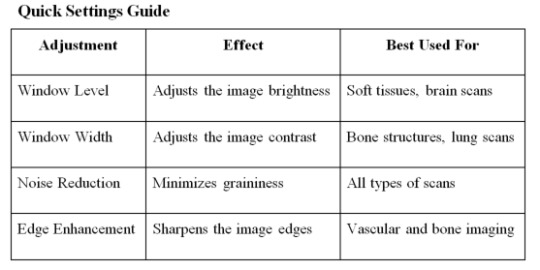
1. Optimize Image Quality
High-quality images are crucial for accurate diagnosis. Here’s how to enhance your image quality:
Adjust Window Level and Width: Tailoring these settings can dramatically improve the visibility of certain tissues.
Use Presets: Many viewers come with presets for different types of scans (e.g., brain, lung). Utilize these to save time.
Image Filters: Apply filters to reduce noise and enhance edges.
2. Customize Your Workspace
A cluttered workspace can slow you down. Customize your viewer for a more efficient workflow:
Toolbar Configuration: Add, remove, or rearrange tools based on your needs.
Multiple Monitors: Use additional screens to view different images or tools simultaneously.
Keyboard Shortcuts: Learn and use shortcuts for common actions to save time.

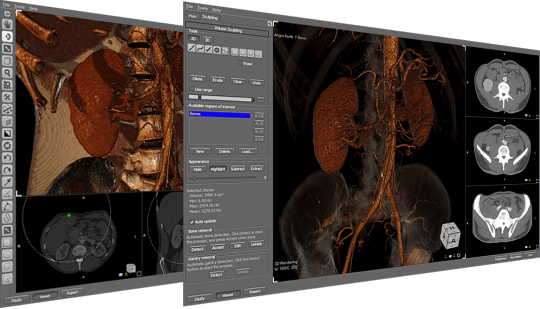
3. Utilize Advanced Tools
Your DICOM 3D viewer free might have more advanced tools than you realize. Here are some to explore:
3D Reconstruction: Turn 2D slices into 3D models for a comprehensive view.
MPR (Multi-Planar Reconstruction): View cross-sections of the body in different planes.
Volume Rendering: Visualize complex structures like blood vessels in 3D.
Fact: According to a 2022 study, using advanced tools like 3D reconstruction can improve diagnostic accuracy by up to 25%.
4. Streamline Workflow with Automation
Automation features can significantly speed up your workflow:
Batch Processing: Automatically process multiple images at once.
Macros: Record and replay a series of actions to eliminate repetitive tasks.
Integration: Ensure your viewer integrates smoothly with other software (e.g., PACS, EHR) for seamless data transfer.
Example Automation Workflow
Load Images: Import a batch of DICOM files.
Apply Presets: Automatically adjust window level and width settings.
Noise Reduction: Apply filters to all images.
Save and Export: Export processed images to PACS.

5. Leverage Community and Support
Even free viewers often have robust communities and support options. Here’s how to make the most of them:
Online Forums: Join forums and discussion groups to share tips and ask questions.
Tutorials and Webinars: Many providers offer free online resources.
User Manuals: Don't overlook the official user manual for detailed guidance.
Did you know? Participating in online forums can provide solutions to common issues 30% faster than waiting for official support.
Conclusion
Mastering your DICOM 3D viewer free doesn't require a steep learning curve. By optimizing image quality, customizing your workspace, utilizing advanced tools, streamlining workflows, and leveraging community support, you can significantly enhance your efficiency and diagnostic accuracy.
0 notes
Text
Why Gretl is the Preferred Choice for Econometrics Assignments?
If you are one of the many that are struggling with data, models, and the occasional existential crisis induced by regression analysis, this post is for you. We are here to introduce you to Gretl, a free as well as open-source software that is changing how students handle econometrics assignments. In the world of econometrics, students do often need to choose the right software for their analysis as well as assignments. With so many tools available, it can be overwhelming to make a choice. However, Gretl has become one of the popular options for many students.
This post will explain why Gretl is the most preferred choice over other software like R. We will delve into its features, advantages, as well as the support available to help you understand why Gretl stands out in the field of econometrics. Whether you are new to econometrics or looking for a reliable tool to streamline your work, Gretl offers a user-friendly as well as powerful solution.

User-Friendly Interface Makes Gretl Assignments Easy
One of the ways through which student find Gretl preferable is that it comes with a simple user interface. Whereas R needs the user to write code which could pose as a problem to many users, freshers and experienced, Gretl on the other hand is easy to use and has a simple interface. This aspect enables students to concentrate on understanding the contents of econometric courses without worrying about the coding and syntax.
Gretl includes wide array of features and methos that can be applied in econometrics. This involves linear regression (OLS, GLS), Time series analysis (ARIMA, VAR, GARCH), Limited dependent variable models (logit, probit, tobit), Panel data analysis, Nonparametric methods etc. This is attributed to the fact that Gretl offers users numerous methods, and thus can be termed to be the most convenient tool for econometric analysis and solving their assignments effectively.
Example: Basic Regression Analysis in Gretl
Performing a basic regression analysis in Gretl is straightforward. Here’s how you can
do it:
Open Gretl: Start the software and load your dataset. Gretl supports various data formats, including CSV, Excel, and Stata files.
Load Dataset: Go to File -> Open data -> User file, and select your dataset.
Run Regression: Navigate to Model > Ordinary Least Squares. In the window that appears, select your dependent variable and independent variables.
Interpret Results: Click OK to run the regression. The output will display the regression results, including coefficients, standard errors, and p-values.
Built-In Econometric Functions
Gretl comes with a plethora of pre-built econometric functions, which makes performing complex analyses more manageable. Whether you are dealing with time-series data, panel data, or cross-sectional data, Gretl has built-in functions to support your analysis.
Example: Time-Series Analysis in Gretl
For instance, performing a time-series analysis in Gretl involves the following steps:
Data Preparation: Load your time-series data.
Set Data Structure: Go to Data -> Dataset structure -> Time series.
Analysis: Choose Model -> Time series -> select the appropriate model (e.g., ARIMA).
Run and Interpret: Run the model and interpret the results.
Need Extra Help? Gretl Homework Assistance
Struggling with your econometrics Assignment? We understand the complexity, which is the reason why we provide specialized Gretl Homework Help to students in the USA, UK, Australia, and beyond.
How to Use Gretl for Assignments
To effectively leverage the Gretl for your econometrics assignments, follow these steps:
Download and Install Gretl: Start by visiting the official Gretl website as well as downloading the software that matches your operating system.
Familiarize Yourself with the Interface: Spend some time exploring Gretl's menus as well as options to become comfortable navigating its user-friendly interface. Visit few websites or community sites where people discuss about the use of software and watch videos on youtube to learn the basics.
Load Your Data: Import your dataset into Gretl, ensuring it is formatted correctly for the analysis.
Perform the Analysis: Utilize Gretl’s econometric functions to analyse your data. The software’s menus as well as wizards make this process intuitive and straightforward. Take help from our Gretl experts or watch youtube videos to learn the steps to perform various analysis.
Interpret the Results: Carefully interpret the results generated by Gretl, by paying attention to coefficients, p-values, R-squared values, as well as other relevant statistics. Report the results and interpret it based on the research question of the assignment. Seek assistance from experts in writing your gretl report in the correct format.
Seek Help if Needed: If you encounter any challenges or need further assistance, do not hesitate to utilize our Gretl assignment help services. We provide step by step solutions that includes accurate interpretation, gretl outputs, software steps followed to get the desired results for a smoother learning experience.
Our Services
We offer comprehensive support tailored to your econometrics needs:
Assignment Solutions: Gretl is a tool that is often used to analyse and interpret data; furthermore, it is crucial to provide step-by-step solutions for econometry problems.
Data Analysis and Visualization: Help with data cleaning, preprocessing, and plotting in Gretl for the analysis of your data and extraction of insights from it.
Model Building and Interpretation: Instructions on the choice of adequate econometric models, or the procedures for estimating parameters, as well as to avoid misinterpretation of the results received.
Coding Assistance: Helping identify and solve errors as well as improving hansl or Python scripts used to conduct your econometric analysis.
Why Choose Us?
Econometrics Expertise: We have expert econometricians in our team along with data analysts completed in working on Gretl.
Customized Approach: Contingent upon your requirements and learning profile, we provide suitable solutions toward your desired help.
Fast Turnaround: Our promise is to provide quality solutions to research scholars and students, enhancing compliance to their course schedule and assignments.
Whether you are a first-time user of Gretl or you are planning on seeking higher levels of help and support, our services will be of tremendous help in making you have the best understanding and mastery of econometrics necessary for you to excel.
Recommended Resources and Textbooks
To further aid your learning, here are some highly recommended textbooks and resources:
"Using Econometrics: A Practical Guide" by A.H. Studenmund: This book provides practical insights and examples that can be implemented in Gretl.
"Introductory Econometrics: A Modern Approach" by Jeffrey M. Wooldridge: Another excellent resource that offers a modern take on econometric analysis.
Gretl Documentation and User Guides: Available on the official Gretl website, these guides provide detailed instructions and examples.
0 notes
Text
Raw Data to Forecasts Assignment Help Guide to Time Series Analysis in Econometrics
Have you ever thought how the economists make prediction on stock market trends, define the pace of economic growth, or assess the effects of changes in the policy over the period? The secret weapon is time series analysis, and it may be the oldest tool in the entire kit. This refined technique helps the analyst has a means to explore inside the complex structure and change of database as they occur, and this is a foresight thing.
One of the most important and widely accepted paradigms in economics is knowledge of time series data. It is an essential commodity to have as it provides a way to understand how the different economic factors vary with time, and therefore is important to any person planning to understand the rise and fall of economic activities. Through time series data, economists can dissect various patterns about trends, seasons and cyclic flows.
Hence, are likely to have clearer vision of past, now and even the emerging economic perspectives in the future. Yes, it is exactly like working with a time machine, because it allows us to watch not only how variables affect each other in the present, but also observe them over time. This skill empowers economists with foresight into the future market trends besides ascertaining the impacts of different policy measures that have been implemented in the economy to make sound decisions.

What is Time Series Analysis?
Census analysis resembles consumer behaviour studies in its exclusive focus on quantitative data aggregated and collected continuously over intervals of time that may range from daily to annually or over longer time periods. While cross sectional data provides different kind of information at different subject within the then, but time series data provides multi kind of information of similar subject in different periods of time. This aspect of time is important because it records change over time which is useful for dynamic fields such as economics.
This is part of the time series data for the above two reasons it is easier to used components of time series data in purchasing rather than using absolute level of data Sources of Time Series Data Time series data can be collected in the following ways:
Components of Time Series Data
Time series data is typically composed of three main components:
Trend: This is giving the long-term movement in the data. Trends specify whether the information can be escalating, diminishing or be fairly stable over some period. For example, an increase in the stock prices could be indicative of an upward trend in the business’ health such as an improvement in the economic indicators.
Seasonality: It contains patterns that recur after certain unspecified regular intervals like, monthly or quarterly. Seasonality reveals that certain inventory sales or product usage will fluctuate throughout time due to factors such as the holiday season, summer, or winter.
Residuals: Additional also called as noise, residuals represent the fluctuations in data not related with the trend or seasonality. They signify the variability of the time series and may be the result of any number of occurrences or occasional changes.
Key Takeaway
Applied to data, time series analysis is not only for the sake of retrospective; it is a means of modelling the future as well. Through the identifying and quantifying of components of a time series, one is in a position to forecast in an informed manner regarding trends and behavior of the series in the future. It proves tremendously helpful in the planning, decision-making, and strategic development processes spanning through different segments of the economy.
Popular Time Series Models
ARMA Model
Overview: The ARIMA model is a time series forecasting model which is widely used and is a more general model as compared to the moving average method. It combines three components: Auto Regressive (AR), then the differenced or integrated series is denoted by (I) and finally, the Moving Average (MA). The AR component include co-efficient of the variable lagged over time, the I component involves transforming the data into a stationary form and the MA component involve the error term being able to be modeled as a weighted sum of error terms of past time periods.
Example: If planning to employ the ARIMA in modeling the growth rates of the GDP then we would begin by determining if the GDP contains a unit root. If not, we differentiate the data until it becomes stationary as it under the integrated part. Then, we check the order of differenced series by using the correlogram for auto correlogram and partial correlogram. Last, we use the obtained ARIMA model to forecast future GDP growth rates after applying stationarity on the time series data.
GARCH Model
Overview: The GARCH (Generalized Autoregressive Conditional Heteroskedasticity) model is intended for the time series data that characterizes financial observations, the volatility of which varies within time intervals. POG extends the ARCH model by making variance at one time depend on variance at the previous time, enabling a more complex specification of heteroskedasticity.
Example: Using GARCH, we start by first examining the use of stock returns by looking at the existence of volatility clustering, where there are high and low volatility phases. Thus, in the next step, we estimate the GARCH model with the time varying variance or volatility. This model aids in the prediction of future volatility which is important in risk assessment or pricing of options.
Seasonal Decomposition
Overview: Seasonal decomposition breaks a time series into the constituent parts that make up the data: trend, seasonality, and random effect. This way of data presentation helps analysts look deeper into the data and identify some patterns, which would be easier to represent and predict in a model.
Example: Consequently, applying the decomposition of time series by removing trend, seasonal, and irregular components, we utilize the unemployment rate data obtained for each month during the period from 1994 to 2015. The trend factor represents long-term trends in unemployment, changes for the period are shown, the seasonal factor reflects seasonal variations, while the remaining fluctuations are considered as stochastic. This process of decomposition is beneficial in unravelling individual components influencing the relative unemployment rates.
Applications in Economics
Financial Markets: It is equally used in the forecast of stock prices, interest rates, and even exchange rates through time series analysis.
Macroeconomics: Using time series approach in predicting the economic future by predicting the Growth in GDP, Inflation rates and Unemployment rates.
Policy Analysis: Since time series data heavily involves the use of time in its analysis, it is useful for adopting when analyzing the temporal effect of various economic policies.
Tools and Software for Time Series Analysis: Some of the commonly used and available software and tools which can be used for carrying out the time series analysis includes; `R’, Python and its several libraries like pandas, statsmodels and scikit-learn and ‘Stata’ and Eviews among others.
Example: Forecasting GDP Growth Rates Using ARIMA
Data Collection: Obtain the quarterly GDP growth rate data, preferably from the FRED, the Federal Reserve Economic Database that offers standard and reliable data.
Data Preparation: You should also use graphical techniques as a way of increasing the understanding about the variables more, and this may entail things like plotting with a view of identifying any seasonal patterns or even making transformations such as taking log or making differences.
Model Selection: to determine the ACF and and PACF of the original series to identify the parameters for the AR and MA models respectively beforehand then estimate some trial ARIMA models and rank and select them using the measures of AIC / BIC.
Model Evaluation: Check for residual auto correlation through the Ljung- Box statistic, and for a desirable measure of a good model, compare the out of sample forecasting using the training sample and the test sample data on the basis of the forecast errors displayed.
Forecasting: Look into the past and determine the current Gross Domestic Product (GDP) and provide for the future projections of the GDP, including the growth rates and plot the relative points as well as the confidence intervals.
Econometrics homework Help resources for Students
With our econometrics homework help, we offer the students who are taking courses in econ a support service following macroeconomics and micro economics concepts suitably merged with advanced econometric approaches. We seek to enhance the students’ capability to comprehend econometric methodologies, and apply the knowledge required to model various aspects of the economy.
Our services encompass a broad range of econometric applications:
Consumer Preferences and Choices: Through econometric model-based approaches, we help students decipher consumers’ behavior, choice patterns, and decision-making technics. Through methods like discrete choice models or regression analysis, the students shall be in a special position to weigh certain trends concerning the consumer behavior.
Estimating Production Functions: They also embrace approximating production functions to establish the correlation between factors of production such as labor and capital and outputs in three industry classes in order to support learners. It shall be deemed essential towards the assessment of productivity and efficiencies within firms.
Market Studies: We help students perform accurate market polls using econometric tools for collecting and analyzing data. This consistency relates with markets prospects, prices and elasticity, and structures in each economy, which is vital for business planning and economic policy making in an economy.
Tax Policy Impact Studies: In our capacity, we are also able to assess the different effects that different tax policies may have on the overall economy. By applying econometric models, the students are able to identify forces that control the relationship between taxation and certain variables such as consumption expenditure, investment, and growth rate of the economy.
Specifically, to help the students in their time series help, we employ various scientific tools and programs often used in econometrics, such as R languages, Python, Stata, and EViews. Our expert tutors are familiar with these tools and explain them to the student in a stage-by-stage manner so that they can appreciate the concepts and how these tools can be of help in various scenarios. So, regardless of whether you need help with the basic concepts of econometric theory or would like to take advantage of our experts’ profound knowledge to apply econometric models to actual datasets in order to solve various problems, we are here to help students in their econometrics assignment help, improve their analytical skills and grades in econometrics.
0 notes
Text
Unraveling the Mysteries of Econometrics: Bridging Economics and Statistics

Econometrics, the amalgamation of economics, mathematics, and statistics, serves as a powerful toolset for analyzing and understanding economic phenomena. By applying statistical methods to economic data, econometricians uncover relationships, test hypotheses, and make informed predictions about economic behavior and outcomes. In this comprehensive guide, we embark on a journey to demystify econometrics, exploring its foundations, techniques, and real-world applications.
Understanding Econometrics
At its core, econometrics aims to quantify economic relationships and phenomena using mathematical and statistical models. These models help economists and policymakers understand the complex interplay between various economic variables and make informed decisions based on empirical evidence. Econometric analysis typically involves the following steps:
Formulating a Hypothesis: Econometricians start by formulating hypotheses about the relationships between economic variables. These hypotheses are often based on economic theory or empirical observations.
Data Collection: Econometric analysis relies on data—historical, cross-sectional, or time-series—that capture the relevant economic variables of interest. Data collection methods vary depending on the research question and the availability of data sources.
Model Specification: Econometricians select an appropriate statistical model to represent the hypothesized relationships between variables. This step involves choosing the functional form of the model and specifying the variables to be included.
Estimation: Using statistical techniques such as ordinary least squares (OLS) regression, econometricians estimate the parameters of the chosen model based on the available data. The goal is to find the best-fitting model that explains the variation in the dependent variable.
Hypothesis Testing: Econometric models often involve testing hypotheses about the significance of individual parameters, the overall fit of the model, or the validity of assumptions. Hypothesis tests help assess the reliability of the estimated relationships.
Interpretation and Inference: Once the model is estimated and tested, econometricians interpret the results and draw conclusions about the economic relationships under investigation. This step involves assessing the economic significance of the estimated coefficients and the robustness of the findings.
Key Concepts in Econometrics
To navigate the intricacies of econometric analysis, it is essential to grasp key concepts and techniques:
Endogeneity: Endogeneity arises when an explanatory variable in a model is correlated with the error term, leading to biased estimates. Econometricians use various methods such as instrumental variables and control functions to address endogeneity.
Multicollinearity: Multicollinearity occurs when two or more independent variables in a regression model are highly correlated with each other. It can lead to imprecise estimates and inflated standard errors. Techniques like variance inflation factor (VIF) help diagnose and mitigate multicollinearity.
Heteroscedasticity: Heteroscedasticity refers to the unequal variance of errors across observations in a regression model. Econometricians employ robust standard errors or weighted least squares to account for heteroscedasticity and obtain unbiased estimates.
Autocorrelation: Autocorrelation, or serial correlation, occurs when errors in a time-series model are correlated with each other. Techniques such as autoregressive models or Newey-West standard errors are used to address autocorrelation in econometric analysis.
Real-World Applications
Econometrics finds myriad applications across various fields within economics and beyond:
Macroeconomic Policy Analysis: Econometric models are used to assess the impact of monetary and fiscal policies on key macroeconomic variables such as inflation, unemployment, and GDP growth. Policymakers rely on econometric forecasts to design and evaluate policy interventions.
Financial Markets: Econometric techniques play a crucial role in asset pricing, risk management, and portfolio optimization. Econometric models help investors and financial institutions make informed decisions in volatile and uncertain markets.
Labor Economics: Econometric analysis is used to study labor market dynamics, wage determination, and the effects of labor market policies. Researchers analyze large-scale survey data to understand trends in employment, wages, and workforce participation.
Health Economics: Econometrics is applied in health economics to analyze healthcare utilization, assess the effectiveness of healthcare interventions, and evaluate healthcare policy reforms. Researchers use econometric methods to estimate demand for healthcare services and quantify the impact of factors such as insurance coverage on health outcomes.
Challenges and Future Directions
Despite its utility, econometrics faces several challenges, including data limitations, model misspecification, and the assumption of linearity and stability. Moreover, the increasing complexity of economic systems and the proliferation of big data pose new challenges and opportunities for econometric research.
Future developments in econometrics are likely to focus on addressing these challenges through advances in computational methods, machine learning techniques, and the integration of alternative data sources. Additionally, interdisciplinary collaboration between economists, statisticians, and computer scientists will continue to drive innovation in econometric theory and practice.
Conclusion
Econometrics serves as a bridge between economics and statistics, enabling researchers and practitioners to analyze economic data, test hypotheses, and derive meaningful insights about economic phenomena. By leveraging statistical methods and econometric techniques, economists gain a deeper understanding of the complex dynamics that shape our economies and societies. As the field continues to evolve, econometrics will remain an indispensable tool for informing policy decisions, guiding investment strategies, and advancing our understanding of the world around us.
0 notes
Text
Metode Regresi Panel Dan Penjelasannya
Metode regresi data panel adalah penggabungan antara data cross section dengan data time series yang mana unit cross section yang sama akan diukur di waktu yang berbeda dan tentunya akan punya observasi yang jauh lebih banyak dibandingkan dengan data cross section dan data time series saja. Selengkapnya bisa dilihat pada :https://amarstatistika.com/2021/11/15/metode-regresi-panel-dan-penjelasannya/
0 notes
Text
Moving Beyond Basics: Intermediate Machine Learning Concepts Explained
Introduction:
So you’ve dipped your toes into the vast ocean of machine learning and have a basic understanding of algorithms and models. Now, it’s time to take the next step and delve deeper into intermediate concepts that will enhance your understanding and capabilities. In this intermediate machine learning course, we’ll explore some essential concepts that will elevate your skills and broaden your horizons in the fascinating world of machine learning.
Understanding Feature Engineering:
Feature engineering is the process of selecting and transforming variables to improve model performance. In this section, we’ll delve into techniques such as one-hot encoding, feature scaling, and dimensionality reduction. You’ll learn how to preprocess and manipulate data effectively to extract meaningful features for your models.
Exploring Advanced Algorithms:
Beyond linear regression and decision trees, there exists a plethora of advanced algorithms waiting to be explored. We’ll delve into ensemble methods like random forests and gradient boosting, as well as support vector machines and neural networks. Understanding these algorithms will enable you to choose the right tool for the job and optimize model performance.
Dive into Model Evaluation:
Model evaluation is crucial for assessing the performance and generalization capabilities of machine learning models. We’ll discuss metrics such as accuracy, precision, recall, and F1-score, and explore techniques like cross-validation and grid search for hyperparameter tuning. You’ll gain insights into how to effectively evaluate and fine-tune your models for optimal results.
Handling Imbalanced Data:
Imbalanced datasets, where one class is significantly more prevalent than others, pose challenges for machine learning models. We’ll explore techniques such as oversampling, undersampling, and synthetic data generation to address class imbalance effectively. Understanding these techniques will help improve model performance on skewed datasets.
Introduction to Natural Language Processing (NLP):
Natural Language Processing (NLP) is a rapidly evolving field that deals with the interaction between computers and human languages. We’ll cover fundamental NLP tasks such as text preprocessing, sentiment analysis, and named entity recognition. You’ll gain insights into how machine learning can be applied to analyze and understand human language.
Unraveling Time Series Analysis:
Time series data, where observations are recorded over time, is ubiquitous in various domains such as finance, weather forecasting, and sales forecasting. We’ll delve into time series analysis techniques such as decomposition, smoothing, and forecasting models like ARIMA and LSTM. Understanding time series analysis will enable you to make predictions and derive valuable insights from temporal data.
Leveraging Unsupervised Learning:
While supervised learning deals with labeled data, unsupervised learning explores patterns and structures in unlabeled data. We’ll explore clustering algorithms like K-means and hierarchical clustering, as well as dimensionality reduction techniques like PCA and t-SNE. Understanding unsupervised learning will broaden your toolkit for exploring and analyzing unstructured data.
Introduction to Reinforcement Learning:
Reinforcement Learning is a branch of machine learning where an agent learns to make decisions by interacting with an environment to maximize cumulative rewards. We’ll cover basic concepts such as Markov Decision Processes (MDPs), Q-learning, and Deep Q Networks (DQN). Understanding reinforcement learning will open up opportunities to build intelligent systems capable of autonomous decision-making.
Ethics and Bias in Machine Learning:
As machine learning becomes increasingly pervasive in society, it’s essential to address ethical considerations and biases inherent in algorithms. We’ll discuss topics such as fairness, transparency, and accountability in machine learning models. Understanding the ethical implications of machine learning will empower you to develop responsible and socially conscious applications.
Conclusion:
Congratulations on completing this intermediate machine learning course! By mastering these concepts, you’ve taken significant strides towards becoming a proficient machine learning practitioner. Remember to keep exploring, experimenting, and staying updated with the latest advancements in this dynamic field. With dedication and perseverance, the possibilities in machine learning are limitless. Keep learning and innovating!
0 notes
Text
Test Bank For Introductory Econometrics A Modern Approach 7th Edition By Jeffrey M. Wooldridge

Test Bank For Introductory Econometrics A Modern Approach 7th Edition By Jeffrey M. Wooldridge
Table of Contents
1. The Nature of Econometrics and Economic Data.
Part I: REGRESSION ANALYSIS WITH CROSS-SECTIONAL DATA.
2. The Simple Regression Model.
3. Multiple Regression Analysis: Estimation.
4. Multiple Regression Analysis: Inference.
5. Multiple Regression Analysis: OLS Asymptotics.
6. Multiple Regression Analysis: Further Issues.
7. Multiple Regression Analysis with Qualitative Information.
8. Heteroskedasticity.
9. More on Specification and Data Problems.
Part II: REGRESSION ANALYSIS WITH TIME SERIES DATA.
10. Basic Regression Analysis with Time Series Data.
11. Further Issues in Using OLS with Time Series Data.
12. Serial Correlation and Heteroskedasticity in Time Series Regressions.
Part III: ADVANCED TOPICS.
13. Pooling Cross Sections Across Time: Simple Panel Data Methods.
14. Advanced Panel Data Methods.
15. Instrumental Variables Estimation and Two Stage Least Squares.
16. Simultaneous Equations Models.
17. Limited Dependent Variable Models and Sample Selection Corrections.
18. Advanced Time Series Topics.
19. Carrying Out an Empirical Project.
Math Refresher A: Basic Mathematical Tools.
Math Refresher B: Fundamentals of Probability.
Math Refresher C: Fundamentals of Mathematical Statistics.
Math Refresher D: Summary of Matrix Algebra.
Math Refresher E: The Linear Regression Model in Matrix Form.
Answers to Exploring Further Chapter Exercises.
Statistical Tables.
References.
Glossary.
Index.
Read the full article
0 notes
Last Seen Blogs

etaursaeminoris
veniamin

ashfornothing
AshForNothing

hopiuyou
Untitled

stressed-stranger
A Stranger

thinlinesbrightsigns
devour your insecurities