#p500
Explore tagged Tumblr posts
Visit Tumblr Blog
Explore Tumblr blogs with no restrictions, modern design and the best experience.
Last Seen Tumblr Blogs


Fun Fact
Tumblr has been providing a Korean-language service since 2013.
Text


[Tater x Frite] "In every universe..." 🥔🥔
#angela giarratana#amanda lehan canto#smosh#smgifs#amangela#spud hut#tatum my beloved#send help we're shipping potatoes#cant wait for the next episode#fritater#p500#tater#frite
542 notes
·
View notes
Text

this was supposed to be some quick practice to figure out what I want to get better at drawing I've been staring at this for song long my eyes have glazed a full 360 degrees torment neverending until now.
#pokemon#p100#p200#p300#p400#p500#p600#p700#p800#p900#p1000#drawtag#this was truly a humbling experience#time to spend another month dead silent
3 notes
·
View notes
Text
Friday Night Shots - Pre-Order Extravaganza!
Friday Night Shots - Pre-Order Extravaganza! @gmtgames @garphillgames @compassgamesllc @djackthompson @trevormbenjamin
Welcome back! Belly up to the bar and let me get you a drink of some kind. Doesn’t have to be booze. It’s Friday again. The week has kind of flown by, though that could be because it feels like I have a million things to do before my month-long vacation starts after next Friday. So I’m sitting here sipping my whiskey and Diet Pepsi, getting ready for dinner, and thinking. What am I…

View On WordPress
#401 Games#Alderac#Avalon Hill#Bezier Games#Boardgame Bliss#CMON#Compass Games#David Thompson#Gamefound#Garphill Games#GMT Games#kickstarter#Marvel Legendary#P500#Resist!#Smash Up#Smash Up: Excellent Movies Dudes#The General#Trevor Benjamin#Western Front Ace
0 notes
Text

49 notes
·
View notes
Text
i am having the worst luck today and it’s not even 10 am yet
#i got some salad for lunch and a matcha drink#at lawson before class#it amounts to about P160#i gave P500 to the cashier#and i didnt really look at the change i got#i just put it in my wallet and then left the store#the moment i walked out#my bus arrived so i ran to catch it#and then when i got on#i only just realized then#that the cashier gave me the wrong change 😭😭#they only gave me P100#when there were supposed to be P300 bills 😭😭😭#i was standing in the bus too because every seat was taken#so it was a bit crowded#THEN MY SHARK PLUSHIE KEYCHAIN FUCKING FELL#and i had to pick it up holding my matcha drink#my laptop case#while holding onto something cause the bus was moving#(+ also my shoulder bag for school which was heavy as hell)#i didnt get to say thank u to the lady who pointed it out#because i was too stressed about the P200 that lawson owes me#and then a seat opened up because someone was getting off at a stop#i got to sit next to that same lady but i think i brushed my sandals on her shoes while trying to sit down#BIT I WASNT ABLE TO SAY SORRY TOO CAUSE OF THE FUCKING P200#AND THEN ! my prof announced that we were asynch today as in we dont have class n i didnt need to run to catch the fckng bus in d first plac#uni diaries#grey txt#jesus christ i hope this day gets better cause its only 8am
3 notes
·
View notes
Text
Thank you school for asking me to pay additional things on top of my tuition. I hope you go to hell.
#antihibikase.txt#guys casually asking for P300 as if my allowance per week isn't just P500.#i hope you guys go to hell
2 notes
·
View notes
Text

Perception: Half of Americans believed that the stock market is falling this year. Those who watch Fox News believe it is tanking.
Reality: The S&P 500 is up 11% in 2024 thus far as America experiences a bull market with few precedents.
[Robert Scott Horton]
* * * *
In the history book These Truths, by Jill Lepore, are the following paragraphs about the first, highly successful political campaign managers, Campaigns, Inc., aka The Lie Factory, founded in 1933. They never lost a campaign. Republicans have mastered their campaign strategy rules:
'Every campaign needs a theme. Keep it simple. Rhyming is good. Never explain anything. "The more you have to explain, the more difficult it is to win support." Say the same thing over and over again. "We assume we have to get a voter's attention 7 times to make a sale". Subtlety is your enemy. "Words that lean on your mind are no good. They must dent it." Simplify, simplify, simplify. "A wall goes up when you try to make Mr. And Mrs. Average American Citizen work or think."
Make it personal. Candidates are easier to sell than issues. If your position doesn't have an opponent, invent one. Pretend that you are the voice of the people. You can't wage a defensive campaign and win. Never shy from controversy; instead win the controversy. "The average American doesn't want to be educated, he doesn't want to improve his mind; he doesn't want to work, consciously, at being a good citizen. But there are 2 ways you can interest him in a campaign, and only 2 that we have ever found successful." You can put on a fight ("He likes a good battle with no punches pulled"), or you can put on a show ("He likes the movies, he likes mysteries; he likes fireworks and parades). "So, if you can't fight, PUT ON A SHOW! If you put on a good show, Mr. And Mrs. America will turn out to see it.'
4 notes
·
View notes
Text
Nice historical volatility chart
This is a helpful annotated chart of yearly S&P 500 volatility. I bookmarked it back in 2014, so it only covers the years from 1929 to 2014.

S&P 500 calendar year realized volatility from 1929-2014 $SPY $SPX $VIX
— via Ro_Patel on StockTwits, October 09, 2014
The y-axis is S&P Calendar Year Realized Volatility as a percentage. The x-axis is time in years. I hope it is possible to enlarge the image by clicking on it! The red bars represent the 10 years with highest volatility. The green bars represent the 10 years with the lowest volatility. I am guessing that the blue bars are all other years.
I wondered why the chart was tagged with $SPY $SPX and $VIX. Both StockTwits and Twitter used to denote stock symbols with a dollar sign instead of a hash tag.
The first two were easy. SPY is an ETF that is backed by actual shares of stock in the companies that are included in Standard & Poor's 500 index. SPX is driven by the price of the S&P 500 Index itself. SPX isn't tradeable per se, but there are SPX futures and various SPX options.
Volatility and the fear indicator
Volatility is the standard deviation of a stock, stock index, or other security's annualized returns over a time period; essentially, the rate at which the security or index price increases or decreases. ‘Actual’ (historical) volatility measures the variability of known prices.
What is $VIX
VIX is called the fear indicator because it is used to infer a quantitative metric of market risk, fear, and stress. It is defined as the 30-day expected volatility of the S&P 500 stock index, using Chicago Board Options Exchange (CBOE) listed S&P 500 options data. VIX is a measure of implied volatility (forward-looking) not historical. Values over 30 are considered high, while 20 is more typical. There's no upper bound on VIX.
The VIX isn't tradeable, which is why I am amused that its CBOE landing page (URL above) has "tradeable" in the URL! Instead, there are VIX futures, call and put options for trading.
The VIX was introduced by CBOE in 1993. I think that's why this chart doesn't have VIX on the y-axis (only alluding to it with $VIX) as an historical time series. It wouldn't be possible to impute historical values, especially not to 1929 but not even prior to 1993, because VIX is calculated by aggregating weighted prices of a constantly changing portfolio of S&P 500 calls and puts over a range of strike prices.
StockTwits
StockTwits seems mostly moribund to me, since about 2015. The name is a little strange, but it is a great idea: A social network for investor/speculators. The realtime, Twitter-like functionality, and user interface, are well-designed and fun. I think StockTwits was founded by Howard Lindzon who is nice, and maybe Fred Wilson the AVC guy ("A Venture Capitalist"?). EDIT: I just checked. It is still active but not exactly a huge startup venture.
Now that Amazon.com has retired Alexa, I can't find website metrics as easily. I'm mildly curious about StockTwits. I wish I could average unique annual page views per year, and then do a 3-line time series graph of unique daily views during 2012 (when it was really active), 2015, and last year.
5 notes
·
View notes
Text
“Whisper Number”

#aapl#breaking news#drmicrocap#google#nasdasq composite#news#s&p500 index#search.yahoo.com#tumblr#yahoo#sports illustrated si#youtube
15K notes
·
View notes
Text
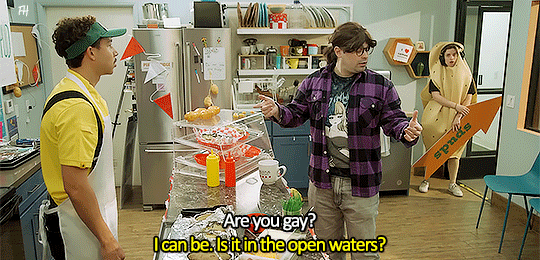

Tater asking the important question...
#angela giarratana#chanse mccrary#amanda lehan canto#damien haas#smosh#spud hut#augustus st cloud#jerry spruce#smgifs#tatum my beloved#amangela#damangela#p500#tater
565 notes
·
View notes
Text


You have to let him get through it...
#shayne topp#courtney miller#spencer agnew#angela giarratana#shourtney#smosh#reading reddit stories live#smosh live#smgifs#p500
620 notes
·
View notes
Text


i love these two together in recent vids
#angela giarratana#shayne topp#smosh#smosh pit#smosh games#bit city#two truths and a lie#shayngela#smgifs#p500
551 notes
·
View notes
Text
“Whisper Number
#aapl#breaking news#drmicrocap#google.com#nasdasq composite#news#s&p500 index#tumblr.com#yahoo.com#youtube.com
12K notes
·
View notes
Text
雰囲気でS&P500を買ってませんか?──その中身と魅力を徹底解説
はじめに こんにちは、Burdonです。資産運用を進める中で、「S&P500」という言葉を何度も耳にしている方は多いと思います。私自身も長期投資の柱としてS&P500を活用していますが、最近、あるやりとりがきっかけで、その内容について改めて整理し直す機会がありました。 今回はその内容を、初心者の方でも理解できるよう、自分の言葉で噛み砕いてまとめてみたいと思います。自分の資産を預けるインデックス、その中身を知っておくことは投資家としての第一歩です。 S&P500の成り立ちと歴史 S&P500の「S&P」とは、「Standard &…
0 notes
Link
#Bitcoin#cryptocurrency#FederalReserve#MarketVolatility#S&P500#StockMarket#tariffs#TechnicalAnalysis
0 notes
Text


Our First Time Playing Resident Evil 8 (Part 1)
585 notes
·
View notes