#give me a hidden markov model any day of the week)
Explore tagged Tumblr posts
Visit Tumblr Blog
Explore Tumblr blogs with no restrictions, modern design and the best experience.
Last Seen Tumblr Blogs


Fun Fact
12.7% of mobile users access Tumblr.
Note
Would Fibonacci's spiral be a manifestation of the spiral?
Propaganda: besida it being a literal spiral, I FUCKING HATE IT WHY IS IT EVERYWHERE, THERE IS NO ESCAPE FROM IT SOMEBODY SAVE ME BEFORE IT'S TOO LATE
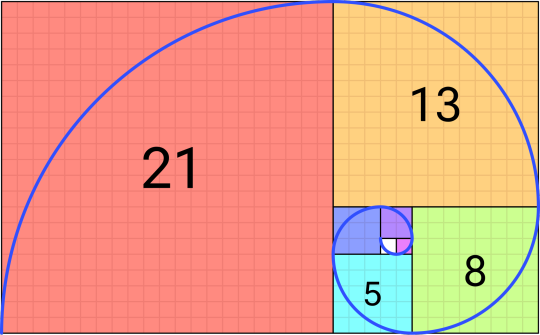
This is not exactly the same as, but approximates the Golden Spiral and becomes closer and closer to being identical as it approaches infinity.
#bloody infinity#dotcha just love maths?#(I do actually like maths#but when it starts going on about “and as you approach infinity” or imaginary numbers#I just want to go back to some good old probability.#give me a hidden markov model any day of the week)#fibonacci spiral#golden spiral#the magnus archives#tma#polls#manifestation polls#the spiral
41 notes
·
View notes
Text
You Should Study Econometrics If You Want To Be A Good Trader

When I was at school, I had no idea that some subjects apparently aren’t difficult—like econometrics—and could be so useful in my trading career. However, I did not even know until the age of twenty that I wanted to become a trader!
More than likely, it is not just me because, even twenty years ago, my teachers ignored the fact that econometrics was so deeply used in financial institutions to make financial forecasts.
First of all, you might be wondering what I am talking about.
What exactly is Econometrics?
In a nutshell, economists develop econometrics models using mathematics to explain the recurring relationship between one or more economic variables. For example, research can connect the amount that individuals spend on consumer goods to disposable income and can expect consumption to increase as disposable income increases.
Central bankers need to know the likely impact of changes in official interest rates on inflation and the growth rate of the economy.
Politicians need to know if an increase in taxes would lead to an increase in unemployment.
So, why is this useful for a finance enthusiast?
A very naïve question could be, what if I could use this same framework to model the relationship between gold and Euro or USD, or between S&P 500 volatility and oil prices? Would it be useful to help me make money? Ultimately, this is what we really care about when comes to trading.
Years ago, most university lecturers would tell you that this is not possible, creating a big frown on the face of the poor, soon-to-be trader-student, because the same math that is used by economists to deal with taxes and disposable income, when used with financial data, cannot do its magic anymore.
Financial time series have different characteristics from the traditional macroeconomic quantities, like GDP or salaries. This is why under the classic econometrician eye, they are pure randomness, and hence outside any possibility of study.
Nowadays, things have changed quite a bit. Financial econometrics, which is the study of financial time series, is a subject of its own in many universities, And everyone knows that it is deeply used in any bank to make investment decisions.
Why do people only use technical or fundamental analysis to make financial forecasts? And why do you receive invites from your broker every week to join a free webinar on how to use a new fancy indicator? Why does no one invite us to download an eBook on volatility forecasting using a regime-switching Markov chain? Do they work less than Bollinger bands? No, they work much better. But, most of the time, these subjects are very hard to understand—unless your marks in econometrics during your postgraduate studies have been very good.
Time series analysis is the branch of econometrics that is most useful for traders when making volatility predictions. However, we still cannot know what the price of a certain stock will be in a week—but if you know how to do it, feel free to mail me at any time!
Currently, no other instrument is so powerful for understanding a change in variability in the stock market than financial econometrics-based models like fractionally integrated moving averages or a regime-switching arch. If you are now thinking that is much too difficult, it is because you thought that making money in the financial market was so easy that it could be learned in two days.

If a doctor studies for ten years to become a brain surgeon, why someone should be able to make accurate financial forecasts after just one eBook, a free indicator, and a weekend of study? Time series analysis, as I’ve already said, is probably the most popular tool used in financial institutions when it comes to making volatility predictions. The degree of complexity you’ll be dealing with if you want to follow this path ranges from finance-degree-level math to serious-headache-level math.
The good news is that even simple models like GJR, which I teach to third-year undergraduate students at the university, is already much better than most volatility forecasting instruments that every trader uses every day. If you want to have an idea of how much volatility will be in the stock market next week, looking at very simple models, like garch or gjr, will give you a more accurate forecast than using a popular instrument like vix index. It sounds incredible, I know, but it is true.
Who is so interested in volatility?
Firstly, options traders, who are mainly volatility traders. Secondly, asset managers who can wait for the calm after the storm to buy more stocks for their clients.
One of the reasons why such instruments are so powerful is probably because they are not well known, so they can spot market inefficiencies that are still hidden for the average investor.
If everyone knew that next week the market would be very volatile, people would react by buying volatility derivatives or selling stocks, making it not volatile anymore! Finance is full of these paradoxes. The only thing that I still believe in is that to make money, it is essential to have an edge, to know something that other people don’t know. And using something that people don’t use because of its complexity gives you a remuneration for your effort. Additionally, it gives you the possibility of trading in some way based on other people’s ignorance. I don’t want to be mean, but they could have studied more.
References:
Peculiarities of Volatilities by Ernest Chan at QuantCon 2016 The econometrics of financial markets. Cambell W.Lo Mackinlay Asset volatility and prediction. Tailor
#forex trading#econometrics#financial econometrics#macroeconomic#economists#forextrader#forex traders#fx traders#londontradinginstitute#london trading institute
0 notes