#and then 99% ish between 2-9 inclusive
Text
#also reblog this for sample size idk#i think the majority of the data (67% ish) should be within 1 standard deviations of the mean#which we can't calculate here because it depends on sample size and probability but let's say between 4 and 7#and then 99% ish between 2-9 inclusive
67 notes
·
View notes
Text
DISNEY PIXAR MOVIE MADNESS! (now, with math)
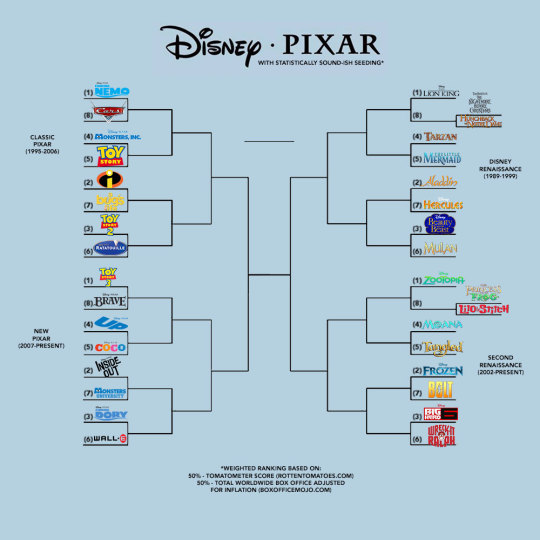
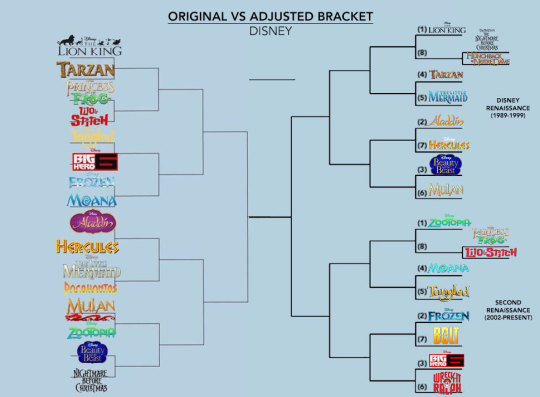
On March 21, in the height of March Madness, Twitter user @yeeitsanthonyy unleashed their own viral bracket buster upon an unsuspecting interwebs. Under the title “DISNEY PIXAR MOVIE MADNESS!” they set up a tournament-style, single-elimination competition between 32 films from both studios, spanning from “The Little Mermaid” to “Coco.” Deceptively simple, devised to determine one champion from two brands enjoying long runs of success.
As a Disney employee and superfan of both studios, the bracket rocked me to my core. It’s a brilliant idea that rightfully set Disney fandom ablaze. But I couldn’t help but notice the lack of explanation behind each film’s place in the bracket. The seeming subjectivity of the ordering. And most notably, a couple of glaring omissions. Much like the NCAA basketball tournaments are seeded, there had to be a statistical way to rank these films. One driven by metrics to ensure the correct films make the tournament; one that gives each studios’ substantively better performing and critically lauded works a fairer path toward total glory.
I started work immediately on using data to make a better version of this bracket.
Above: the original bracket Tweeted by @yeeitsanthonyy.
Methodology
The construct of the original bracket is straightforward and compelling: Disney films fill out one side, Pixar films fill the other. I wanted to maintain this setup, since it ultimately matches up the top Disney and Pixar films in everyone’s bracket for an overall winner. But the reasoning behind which films were selected for the tournament needed to be more transparent.
Using the original bracket’s “The Little Mermaid” (1989) and “Coco” (2017) as start and end points, Walt Disney and Pixar Animation Studios have combined to make 49 films during the time frame it represents. Disney made 30 of those movies, Pixar made 19. That’s more films apiece than there’s room for in each side of the bracket, so we have to omit a few intentionally. But to be objective about which ones, I wanted to consider every film from both studios during this time period for the tournament.
With room for 16 films on each side of the bracket, 14 Disney films from the time period wouldn’t make the tournament, but only 3 Pixar films would miss the cut. That’s a problem – it’s unfair that it’s easier for Pixar movies to make the field. There needs to be a little more parity added to the tournament for Disney films that would be on the “bubble” quality-wise for making it in, but still have a lot of potential for making a Cinderella-type run (see what I did there?) through the bracket.
Speaking of quality, how do we rank these films? The original bracket doesn’t appear to factor in seeding, and that’s my biggest critique. In the NCAA tournament, teams are ranked #1 through #16 in each region. Across the four regions, a #1 team should be roughly the same caliber as the other three #1 teams in the tournament, the #2 teams should match up with the other #2s, and so forth.
Without any qualifications provided for why each movie is placed in its particular position on the bracket, the original gives the appearance of being entirely subjective, possibly based on the original poster’s personal preferences. My goal is to address this.
The Model
We need to rank these movies to set a bracket. Where can we find some data to build an overall metric of quality upon? The internet has made it easier to quantify a movie’s critical reception – particularly a website called RottenTomatoes.com, which popularized the “Tomatometer,” gauging the percentage of movie critics’ positive reaction to a film. It’s not really a statement of a film’s overall quality; for example, it considers a 2.5 out of 4-star review as “fresh,” indicating the critic had a positive response – not exactly glowing. But it’s a highly marketable figure, essentially an update of Siskel and Ebert’s “two thumbs up” with more data points, and it gives us a metric that at least attempts to characterize popular critical response.
The other obvious metric is the movie’s bottom line: how well did it do at the box office? That’s a challenging question, because the answer has changed over the period the bracket represents. Increasingly, it’s not good enough for a movie to just do well in the United States. Global box office has become hugely important to studios; a project’s appeal to worldwide audiences is a huge calculation in slating new releases. And there’s some major winners and losers on global box office among the 49 films under consideration.
But box office numbers can be deceiving. “The Little Mermaid” was a watershed film that marked the start of the original Disney renaissance. But it only made $211 million in 1989, when ticket prices were lower and theatrical distribution wasn’t as wide globally. By comparison, “Zootopia” (2016) cracked just over $1 billion globally. It’s weird to think “The Little Mermaid” would have been a financial disappointment by contemporary standards, so we have to factor inflation into our evaluation.
I did this by looking up the total global box office for each film on BoxOfficeMojo.com, which has a searchable database of box office information. Then, I divided it by the average ticket price for each film’s year of release, yielding a figure I called “admissions” – theoretically, the number of people who saw it in theatres. Since the population of our fine planet keeps growing, it’s not really fair to penalize older movies that fewer people would have had a chance to see. So ultimately, we need to grade box office performance on a something like a curve.
Overall, I used a weighted score to evaluate the 49 movies under consideration. 50% of that score is determined by a movie’s Tomatometer percentage. I took each movie’s Tomatometer and multiplied it by 0.5; the product is a decimal between 0 and 0.5. (“Finding Nemo,” with a 99% Tomatometer, gets a .495 out of .5 score. “Brother Bear,” the lowest Tomatometer of all films in contention at 38%, gets a .19 score.)
Then, I evaluated box office performance to determine the other 50% of the score. I used the “admissions” figure described earlier — again, the idea is to reward movies that were the strongest performers, but not overly penalize ones that didn’t have a great box office (especially if they were still critically loved). I sorted the films by most admissions to least and assigned a perfect score of 0.5 to the film with the highest figure. Then I subtracted .005 from that score for every position a film fell down the list – enough that high performers are rewarded, but keeping a relative balance in place with critical reception, so that movies need decent scores on both to make the tournament. (“Finding Nemo,” with the highest admissions figure on the list, gets the perfect 0.5 score. “Mulan,” the median entry, gets a .365, and the film with the lowest admission, “Winnie the Pooh,” gets a .26 score.)
Add those two scores together, and we’ve got an overall weighted score between 0 and 1. Now, sort the films by those scores, and we’ve got ourselves a statistically sound-ish list!
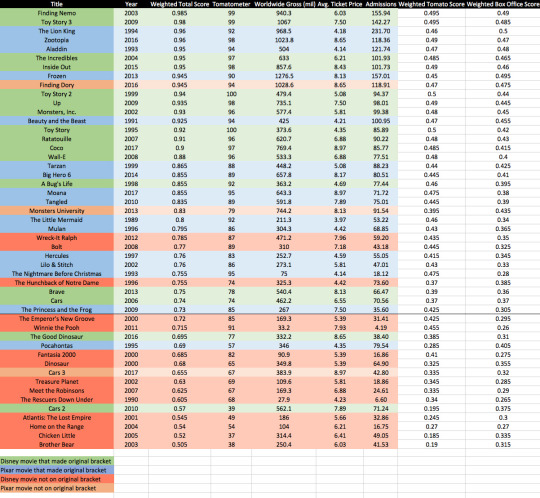
And here’s that list!
I use “sound-ish” because this model almost certainly has flaws. I could have used the “Top Critics” Tomatometer score that filters out all but the most well-known writers, which could have caused variation. As far as admissions, I have no way of knowing how close my theoretical figure is to actual; it’s just the best I can do with the available data. And also, there’s no accounting for the “favorite” factor, that feeling where regardless of critical or box office performance, you just love one movie more than another. And make no mistake – you should love what you love! Data-wise though, it’s just really hard to account for movies that became “cult” favorites, since there’s not really a good way to quantify that performance-wise. For example, you could take social media likes or conversation into consideration, but that might put certain movies (particularly older ones) at a disparate disadvantage.
One other thing: I’m standing firm on the inclusion of only Walt Disney and Pixar Animation Studios films, none of their subsidiaries. That means no “Planes,” and as some called out as a miss on the original bracket, no “A Goofy Movie,” either. Rest assured, if I included them in consideration, when the numbers are crunched, none of them make the tournament.
Bracketology
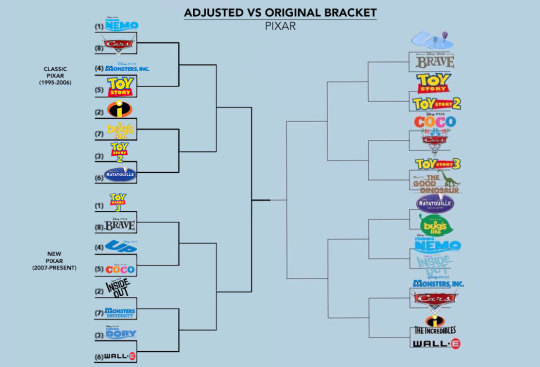
A look at the results of this model suggests the original bracket had a few key snubs. Most notably, it left “Finding Dory” out of the Pixar bracket. The #9 weighted scorer, its credentials are sterling with a 94% Tomatometer and over $1 billion in global box office. Also snubbed was “Monsters University,” a little further down the weighted list but a certain shoo-in at #25. Much further down the list, “The Good Dinosaur” (#37) and “Cars 2” (#45), which made the original bracket, objectively don’t belong in the field.
There’s also misses on the Disney side of the bracket. “Wreck-It Ralph” (#26) is omitted from the original bracket, and people forget this but “Bolt” (#27) actually performed comparably strongly on Tomatometer and box office. But right after this, we get to the problem described earlier: there’s a need for some more parity on the Disney bracket. With only three Pixar movies missing the field, we owe it to a few more Disney movies to have a shot at a tournament run. “Hercules” (#28), “Lilo & Stitch” (#29), “The Nightmare Before Christmas” (#30), “The Hunchback of Notre Dame” (#31), and “The Princess and the Frog” (#34) are separated by 0.03 points on our weighted scale. They’re all legitimate bubble contenders.
The NCAA basketball tournament solves for this and makes things more exciting with a “First Four,” where the four lowest-ranked automatic and at-large qualifiers face a one-game play-in against each other to make the official 64-team bracket. That’s how we’re going to solve for this, too: we’re going to expand the tournament field from 32 to 34 movies, with one extra round for those four bubble films to claim the last two spots on the bracket proper.
Probably my adjusted’s biggest snub among movies that made the original: “Pocahontas” is out of the tournament with its #38 weighted ranking. Despite a solid $346 million box office, its 57% Tomatometer is among the lowest in the field; it actually drops it below “The Emperor’s New Groove” and “Winnie the Pooh” as far as movies not making the tournament. (It’s okay, just imagine them all playing in a really fun consolation bracket somewhere.)
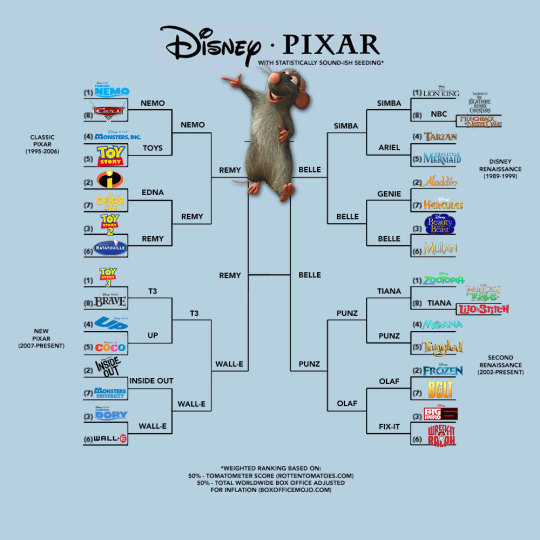
Seeding
As mentioned in the methodology, the bracket should be seeded so that quantifiably better movies earn a little bit easier of a run through the bracket (assuming they’re winners in your heart, too). I subdivided the Disney and Pixar sides of the bracket into a two regions of eight movies apiece, so we’ll have four sets of #1 through #8 seeds. The idea is that each numerical seed is of roughly equal quality to the movies in other regions with the same seeds. The #1 seeds in each region are pretty impeccable – and immediately lent themselves to the idea of organizing the regions by older and new entries from both studios.
“Finding Nemo” tops the Classic Pixar Region, while “Toy Story 3” tops the New Pixar Region. “The Lion King” tops the Disney Renaissance Region, while “Zootopia” might be a slight surprise as the top of the Second Renaissance Region, but the credentials are definitely there.
In the first round, #1 seeds face off against #8 seeds; that winner plays the victor of the matchup between #3 and #4 – technically, the easiest path through the field to the Disney or Pixar final round. The #2 seeds get #7 seeds, facing off against the winner of the #3 and #6 seeds. If the top two seeds win out, the final on each side of the bracket matches #1 against #2.
That means “Nemo” gets “Cars” in Classic Pixar, where my favorite opening round matchup puts #3 “Toy Story 2” against #6 “Ratatouille” – the Little Chef could be poised to cook up a nice run in many brackets. In New Pixar, TS3 gets “Brave,” while #6 “Wall-E” could certainly clean up against #3 “Finding Dory.”
Now, checking out the Disney side of the bracket. The two play-in rounds are for the #8 seed, meaning “Lion King” gets the winner between “Nightmare” and “Hunchback” in the Disney Renaissance, while “Zootopia” gets the winner of “Lilo & Stitch” and “Princess and the Frog” in Second Renaissance. (Just to get out ahead of this: “Lilo & Stitch” isn’t part of the actual Second Disney Renaissance; it falls in that weird shadow time between the two, but being released on the 2000s side of the millennium line, I decided to lump it in with the movies in the newer half of the bracket.)
In Disney Renaissance, “The Little Mermaid” is ready to go where the winners go, despite being a #5 seed. In Second Renaissance, I think “Zootopia” might be the most vulnerable of the #1 seeds in the tournament for an early exit, especially considering the crash course it faces with either with #4 “Moana” or #5 “Tangled” in the second round.
Conclusions
What exactly have I wrought with this? A painstakingly calculated, statistically semi-sound bracket that perhaps more accurately reflects the respective pop culture and financial impact of recent Disney and Pixar films, setting up an exceptionally silly, imaginary tournament slightly more equitably. Yet at the end of the day, reiterating a potential shortcoming of this model and all of the math behind it, you love what you love.
I posted my adjusted bracket and hundreds of social media likes and responses rolled in, with comments ranging from “The hero we needed!” to “This is a work of Evil.” But a few people noted that, even with corrected seeding, they still came up with the same final four and eventual winner as the original bracket. If your favorite Disney and Pixar movies were already on both brackets, there’s a very good chance you were faced with the same eventual final picks anyway. You just arrived at them in a somewhat different manner.
So, a closing thanks to @yeeitsanthonyy for their blindingly bright idea that sparked cheerful, passionate participation and conversation across the Disney fandom. I recognize it most importantly as an attempt at creating joy, and there’s objectively nothing to critique about that. But to those craving logic and order in our increasingly chaotic world, I hope you rest just a bit easier tonight.
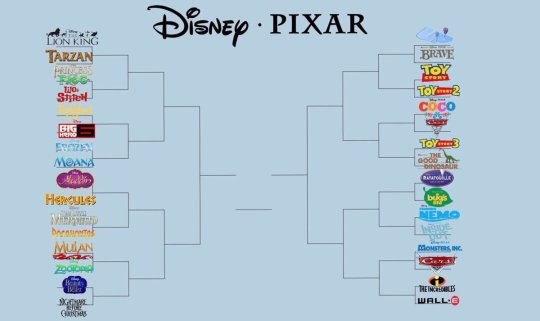
And finally, my bracket, in case you were curious.
7 notes
·
View notes
Last Seen Blogs

bitcointalks
Aksh Joshi

royalenfields
Royal Enfield Motorcycles

gold1968-blog-blog
Unbetitelt

73916
Sem título

aubiesquire
*gently holds blorbos*