#Supermetrics Review
Explore tagged Tumblr posts
Photo

Supermetrics: A New and Simple Reporting Automation Tool for Excel
A perfect reporting automation tool for marketers that create insightful reports in Excel spreadsheets is right here. Supermetrics for Excel will make reporting and analysis of marketing campaigns as easy as ABC! With this tool, you can effortlessly get all the marketing data in one place while saving a great amount of time. It provides transparency and insights which are really to be appreciated. With Supermetrics, marketing reporting in Excel has become very easier. You can pull data from numerous sources, assemble advanced dashboards, and set up automatic data refresh and emailing. Moving ahead in this review article with the idea of what Supermetrics for Excel is, let’s learn about why Excel, unique features of Supermetrics, pricing, how you can build dashboards with it, brief information about how to get started and its pros-cons.
#Supermetrics for Excel#Marketing Metrics Analysis#supermetrics review#Reporting Automation Tool#seo tool#web analytics#Supermetrics Excel Tool#seo#seogdk
1 note
·
View note
Text
Supermetrics Review — An Overview of Supermetrics for Google Data Studio and BigQuery. Start Free Trial Today

Presently, businesses thrive on data and with digital marketing at the forefront of all promotional activities, businesses are more data-driven than ever before. Those working in the Sales and Marketing Department would know what this means. So, if you have been spending sleepless nights preparing reports to exhibit your department’s achievements to the stakeholders, then here’s some relief. This Supermetrics review post will provide you detailed information about each and everything about this business analytics software.

Supermetrics, a convenient and easy to use reporting automation tool is a one-stop solution for all your data procurement, visualization, and reporting needs. Through its eight products (including Supermetrics data grabber for Excel and Supermetrics Functions) it helps businesses of all sizes to gain access to data from various platforms.
These products can be classified into two categories — data procurement tools and data manipulation tools. However, in this article, our core focus would be on Supermetrics for Google Sheets, Supermetrics for Google data studio and Supermetrics for BigQuery, which again connects Google data studio and various other tools to Google BigQuery and aids visualization.
What does Supermetrics do?
Primarily, the goal of all Supermetrics tools is to facilitate the procurement and processing of digital marketing reports through easy integrations. These tools allow digital marketers and businesses to pull out data from almost any platform that they wish to. In fact, if Supermetrics does not have a data connector that pulls out data from your desired platform, then they even go to the extent of creating one for you. This allows you to compile all the data that you need from various sources and create a report that highlights your efforts.

So, you can pull out data connected to PPC campaigns, keyword research and everything else in between. The best part is that you can use tools like Supermetrics for Google Sheets to automatically pull in data and share it in no time. Also, the recipient does not have to download and install any additional tools to be able to access the data that you share.
Supermetrics offers several tools that make it easier to create and integrate digital marketing reports. That makes it hassle-free to pull out reports and quickly take your client through the digital marketing campaign and its success. Let us now dive into the various products offered by Supermetrics and understand how it helps create and manage digital marketing reports.

Supermetrics for Google Data Studio

Google Data Studio is a data visualization tool that allows you to use various data sources and lets you create fully customizable reports. However, like all good things, Google data studio also has its limitations, and this is the very gap that Supermetrics and its tools help bridge. To begin with, Supermetrics for Google Data Studio helps automate data collection from various platforms. So, if you advertise on social media platforms and other online marketing platforms, then you know how much time it takes to collect data and then turn it into a report. Even worse, if you are required to create an interactive report that can show date-wise data through visualization.
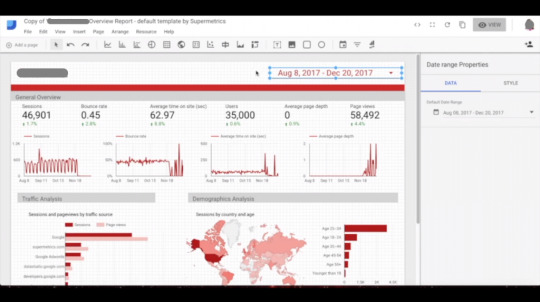
This is the very pain point that forces digital marketers to turn to Google Studio. However, that does not resolve the problem entirely because Google Data Studio offers a limited number of connectors. Well, that’s just the tip of the iceberg and there are just so many other features that are missing — a reason why Supermetrics for Google Studio was created. Let us now look into the various shortcomings of Google Data Studio and how Supermetrics can make things easier.
Report Delivery Automation
Supermetrics tools help transform the way in which Google Data Studio can be used. So, once you integrate Supermetrics in your Google Sheets and begin linking your accounts to it, pulling out reports straight into your Google Sheets becomes a whole lot easier. That eliminates the need to copy, paste and format lengthy CSV files. In fact, with just a click, you can also format the data for Google Data Studio.

This saves you from hours of tedious data compilation, data cleaning, and aggregation. That allows you to focus on the more important aspects of your business, such as client meetings, skill upgradation, etc… Another striking feature of Supermetrics is that you can set up triggers to re-run the reports and based on the schedule that you set, Supermetrics will continue to pull out fresh data and refresh the existing one with the most updated version.
Simplifies Data Collection
By using this reporting software, you can skim through data based on date ranges and platforms. So that allows you to pull out data from all campaigns across AdWords, Instagram, Facebook, etc… and calculate cost per conversion by platforms or as an aggregated report. This ability to collect data from multiple sources without copy-pasting or coding, makes these Supermetrics tools stand out. Nonetheless, if you know a certain amount of VBA coding, you can further manipulate the existing code.
Google Data Studio templates are quite average
The choice of Google data studio template largely depends on the purpose of the report and your target audience. So, before you choose one, you need to be doubly sure that it is going to serve the purpose. Coming to Google data studio, its existing templates are okay but nothing great.

If you are new to digital marketing, then Google’s data studio templates such as Performance Dashboard by Aro Digital, Canonicalized and Google Merchandise eCommerce dashboard could be of use. It might also work out for Freelance Digital Marketers with less than 5 clients. However, if you are a pro running a midsize or a large digital marketing firm, you would want something better. As you may have used more advanced BI tools, you are likely to find the existing data studio templates quite primitive.
So, if you are a seasoned digital marketing pro then you would crave for something that’s more advanced and professional. Now that’s precisely when you must consider using Supermetrics for Google data studio — a Supermetrics product that solves the problem by providing several advanced data studio templates that you can use. Also, Supermetrics classifies these Google data studio templates into various categories, which makes it a whole lot easier for the user to choose from. This includes hundreds of Google data studio templates classified under SEO, PPC, Analytics and Social Media.
Pricing of Supermetrics for Google Data Studio
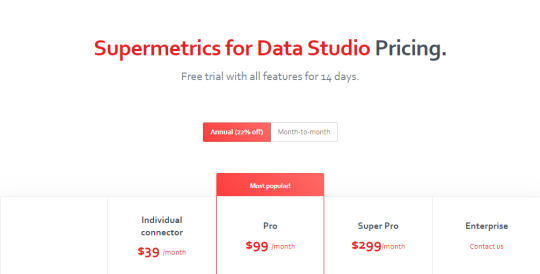
Supermetrics for Google Data Studio offers four different pricing plans, out of which 3 are priced and 1 is customizable. The most basic plan offered is the Individual Connector Plan, which allows access to one data source of your choice and is priced at $39 per month on annual plans. The second plan is the Pro Plan, which is priced at $99 per month, while the Super Pro Plan is priced at $299 per month respectively on its annual plans. However, each plan has its own set of limitations and for businesses that have special requirements, there’s the fully customizable Enterprise Plan.
All the four plans offered by Supermetrics for Google Data Studio offers you the ability to create free unlimited reports. However, when it comes to customer support, the premium support options are only available to those on the Enterprise Plan. Subscribers to all other plans would have to adjust with the Email and Forum Support.
Supermetrics for BigQuery
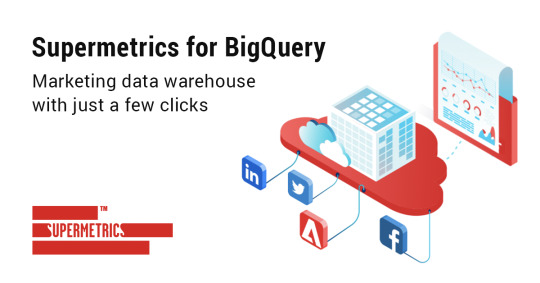
The most recent product rolled out by Supermetrics is a product called ‘Supermetrics for BigQuery’ that’s designed to connect Google BigQuery and Google data studio. Since BigQuery does not come with a visualization tool, Supermetrics for BigQuery was designed to fill in that void by letting you connect to Google Data Studio, Google Sheets and to other tools. This allows easy access to data from Google BigQuery, which makes it a whole lot easier to gather all the data from non-Google digital marketing platforms in the BigQuery data warehouse. You may then use it as a source in Google Data Studio, Google Sheets, etc….
Pricing Plans for Supermetrics for BigQuery
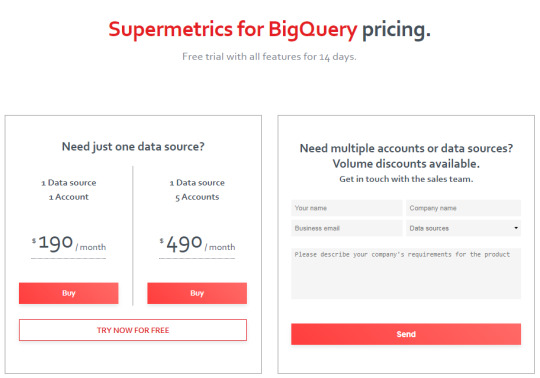
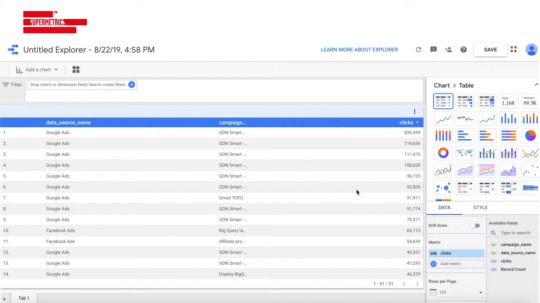
Supermetrics offers 2 plans for this product, based on the number of accounts and data sources. However, if you have very specific requirements or need to make use of multiple data sources, then you could always drop in an email to the sales team of Supermetrics and work that out.
Since the pricing pattern of Supermetrics for BigQuery charges on the basis of accounts, it could turn out to be more expensive for larger digital marketing agencies, as compared to other tools like Stitch. Presently, Supermetrics for BigQuery charges $190 per month for one account and $490 per month for 5 accounts.
Supermetrics for Google Sheets

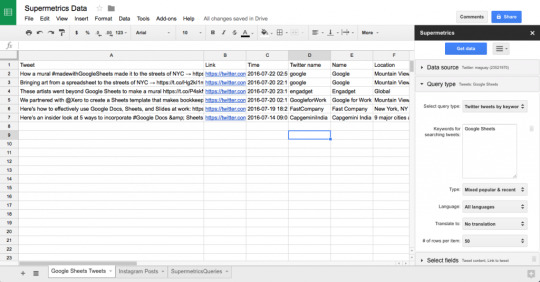
Supermetrics for Google Sheets is by far the most popular Supermetrics product, which is used by thousands of digital marketers to break down complex data. As Supermetrics allows Google Sheets to connect with various platforms and extract data from those sources, you can have all the numbers in one place. Plus, you can do all of this without importing or copy-pasting from CSV files, which consumes a lot of time. Some even outsource it, which leads to an increase in the overheads — something that you can easily eliminate by automating the task through this reasonably priced Supermetrics product. Some features that we really like about this product is the automatic refreshing and ready-made templates. That allows you to pull out the most recent data from your campaigns and quickly present them in a professional manner.
Pricing of Supermetrics for Google Sheets
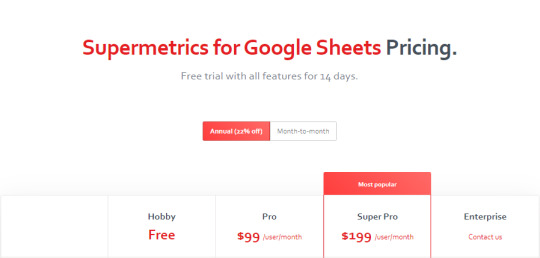
Supermetrics for Google Sheets is one of the top-rated plugins in the Chrome Store and while you can use it for free, your source would be limited to Google Analytics only. Besides the free option, you may choose from three other pricing plans that are custom designed for businesses of various sizes. The Pro plan costs around $99 per month for a single user and allows the user to schedule weekly and monthly refresh. The Super Pro plan costs $199 per month for a single user and allows daily, weekly, and monthly refresh. However, the Enterprise Plan, which is the most advanced, can be used by multiple users and is highly customizable. It allows hourly, daily, weekly and monthly refresh. For the Enterprise Plan’s pricing details, you need to drop in an email to Supermetrics’ Sales team.
After the gigantic success of Supermetrics Data Grabber for Excel and Supermetrics Functions, there’s barely any digital marketer who isn’t using this tool to create digital marketing reports. So, if you have recently started in-house marketing, then you must subscribe to this tool as it can help you reduce your overheads, besides getting prompt and timely insights into your digital marketing and SEO campaigns. On average, an employee working for a small digital marketing agency or a small business saves up 30 hours which is otherwise lost in copy-pasting CSV files, which in turn translates to higher profits. Also, if you are a digital marketer, you can use these tools to make impressive digital marketing reports and easily share them with your clients.

Originally Published On: SaasTrac
About The Author SaasTrac is one of the trusted places where users can find reviews on different Saas Products, Software, and Platforms. Our major goal is to let users know the detailed and the most helpful information possible about every product — the good, the bad, and the ugly in the SaaS space.
0 notes
Photo

New Post has been published on http://simplemlmsponsoring.com/attraction-marketing-formula/copywriting/revisiting-2018-do-what-your-heart-feels-is-right/
Revisiting 2018 – Do What Your Heart Feels is Right
Last day of the year is always special. It’s the last time I sat down to write in 2018. It is also an excellent time to reflect upon things that happened this year and make plans for the year to come.
It’s been a while since I composed a yearly review, but here I am, documenting some of the moments of 2018 that I would like to remember forever. In the first week of December 17, We redesigned ShoutMeLoud and got a new logo and did some great work there. Sharat inked himself with ShoutMeLoud logo which is remarkable:
I started 2018 just after one of the most amazing trips to Antarctica, and for the first time, Delhi winter didn’t feel as freezing as it usually does. Now, unlike other years, 2018 was different.
It was a lot of introspection and self-learning for me. I had to fight a lot of my inner demons which I knew existed for years but never dared to face them.
It was more like trash piling up in one corner of the room that I knew was there, but I never took action.
The first half of the year unearthed many of them, and I realized that I had to accept them before I could fight them.
When I look back, I feel I could have done better in the first half of the year. The only thing I could do was to surrender myself to the whole experience and acknowledge my achievements, realize my mistakes and use the learnings to make better decisions in the future.
2018 was the year when I made the most mistakes, which also makes it the year of great learnings.
I will try to put down my experience below so that you can learn from my mistakes and have a better year ahead.
Also, when I grow old, it would be nice to look back at this phase and smile.
Ok then, here we go:
January and February 2018
Last few months of 2017 were super exciting. I achieved things I never thought I would on personal as well as the financial front.
I kept thinking of early retirement as it felt like I had achieved most of my goals.
I stopped growing for a bit and my perspective changed from being a student of life to someone who thought he knew it all.
I had, unknowingly, started surrounding myself with people who were nice to me, rather than those who were honest in my face. Instead of taking actions, my impulse to seek recognition started increasing.
For me, it was a tough one to digest as I never thought I could be such a person. But it was happening!
The first two months of the year were the toughest and also the slowest for me.
Day-dreaming and running away from accountability, I was making my future difficult.
Sometimes it gets hard to see things when you are in the middle of it all. Don’t you agree?
I was almost in the midst of a mid-life crisis, figuring out what to do next.
It was not productive but the questions I was going through paved the way for time to come.
Me and Sharat did a road trip to Chandigarh to meet Chatty who is a smart young chap and was working on a few projects with us.
March 2018
March started with great pace, and the first significant thing that I did was a trip to Hong Kong with my team.
It was a conference that we attended it as an official media partner.
We also tested a lot of new stuff like:
Podcasts Twitter chat
Podcasts and videos are going to one of the prime targets for 2019.
I also met Gary Illyes, Abhishek, Honey Singh and Fernando at different venues and events in the month of March:
April and May 2018
These two months were pretty busy with managing my finances and restructuring the company.
By the end of April, I moved away from managing the finances of my company which turned out to be a great decision. I also moved my whole blogging business to the newly formed company rather than managing under my name, something that paved the way for better structuring in the times to come.
This is the time when I shared my intention with my team of stepping down from the role of CEO of ShoutDreams and bringing someone knowledgeable to run the company so that I could focus on things that I like.
I could feel the pressure of increasing demand for growing the company and keeping up with writing content.
Honestly, running day-to-day operations was becoming a challenge. I had never felt so much pressure. Even though I knew the right thing to do, I was not sure what to do.
I could feel it in my heart that I was not enjoying what I was doing and that my business and life required some major changes.
The question I kept asking myself repeatedly were:
Do I really need to do this? Do I really need to build the company? What’s next for ShoutMeLoud?
On the one hand, I knew it was an important thing to do considering the way we do business online was shifting. On the other hand, I felt I was getting too business-oriented and was losing my freedom.
I could feel the requirement of having more key players on my team. Maybe a content guy, a video editor, a graphics guy, maybe an app developer. However, I was not enjoying the part where I had to spend time hiring and letting go of people.
The pressure of running the company was taking a toll on my overall performance. Moreover, I was not sure what I wanted from my life anymore. I had not yet confronted my inner demons and was trying to ignore them as much as I could.
To add to my troubles, Shallu (my wife) met with an accident and hurt her back in April 2018. She was bed-ridden for 3 whole months. When this happened, for the first time in many, many, years, I was really scared. Seeing someone you love in pain is heart-wrenching. I’m sure you can resonate with that.
I was struggling with everything. It was not the best place to be, but I can’t deny the importance of that phase in my career.
I realized I should be spending more time working. Honestly, I was starting to enjoy work again, and I knew it was time to make some changes. I rented a space in co-working office called Regus and worked from there for a month.
It was a boring place to be, but I was still happy as I was breaking out of procrastination and getting work done.
I worked from this space for almost a month. I discontinued with it later because it was becoming too corporate – more like a 9-5 job!
One highlight of April was addressing the audience at MindmineSummit.
June 2018
June is usually an action-packed month for me. In June 2018, I traveled to Helsinki to attend the SummerJam by SEMRUSH. SummerJam is a private event by SEMRUSH where they invite some of the best minds from the SEO and marketing industry.
It was great connecting with like-minded people in Helsinki. Here are some pictures from the event.
I also met Victoria, former affiliate manager of SEMRUSH, who currently works with Supermetrics.
If you don’t remember her, here is the video we did together last year about affiliate marketing for businesses.
youtube
Another highilght was this “Blogging birthday cake” sent by my friend, which made my day:
July 2018 – Half cooked Europe trip
After the Summer Jam, I planned to travel to Europe for a month with my family. It was one of our dream trips. From Helsinki, we went to Amsterdam and Prague. The plan was to travel to more places.
However, on the 9th day when I was in Prague, one of my key team member shared his intention of saying goodbye. I already felt I wasn’t doing justice to my role and this news couldn’t have come at a worse time.
We abandoned the rest of the trip and returned to India. I realized how important it was for me to resolve the burning question of the future of the company – putting up the system in place, ensuring everyone gets proper growth and credit for their work. I wish I could have done this more pro-actively a few years back, but as I said, I was no one to complain about how my life was unfolding. More on this later.
August
Half of the year was gone, and I could feel the pressure of not doing anything significant.
It doesn’t matter how well one is doing financially or growing if the ❤ is not in sync with the mind. It’s struggle.
👆🏻was my state of mind, and the first thing I did was change my office space. I found a nice place near my home called Instaoffice where I rented a spot.
It was a dream office and I enjoyed being there from day one.
Instead of planning, I started getting things done.
But I had accumulated a lot of questions in the past few months, and the answers were nowhere to be found. The worst decision one can take is not taking any decision, and I was doing exactly that.
As it is, I was not feeling super pumped up about much I was doing. Existential crisis along with mid-life crisis, it was a pretty awkward place to be in.
In the past 12 months, I lost two key players from my team, and I was failing to put up system and process. I was facing a new issue every day.
At the stage I was, it was not easy for me to open up to anyone and tell them what I was going through. I was feeling lonely, but I didn’t let anything affect my day-to-day activities. It felt like depression but I’m glad it wasn’t.
I was losing the whole perspective of my journey. I was unsure of what would happen next.
But life always has something to offer.
One gets help when he/she least expects, and this is what happened in August.
I opened up to a few close people and told them what I was going through.
“Are you enjoying what you are doing?”
A friend asked me this simple question, and straight away I knew the answer – No!
I was doing a lot of things that I wasn’t enjoying.
For example, working 9-6 thinking that working more was a solution.
Waiting for weekends to live life!
I was trying to live a perfect life which was not me. I was living someone else’s life.
I was not able to write regularly, because my heart was not in sync and nothing makes me better than journaling.
We discussed things, and after a lot of questions and introspection over the new few days, I realized I was doing the exact opposite of what my heart said.
Working 9-6 was not me, and there I was, forcing myself to work more thinking that was the solution.
Rather than looking at my problems with the lens of solving it, I was harsh on myself.
I was being cornered by my ego. I was not ready to accept my shortcomings.
Instead of keeping my blogging journey fun, being thankful for whatever I have, I was focused more on the things that I wasn’t able to accomplish.
Throughout, I knew I don’t enjoy doing some of those things and rather than asking “How” to solve it, I was looking at “Why” I couldn’t do it.
This is where I started following the mantra“Do what, heart says”.
I accepted the situation, and started to take it easy from there.
I started accepting that I’m good with some things and not so good at other things.
Believe it or not, this mere acceptance changed everything for me.
Working more was not a solution and sometimes taking a step back or slowing down is the best thing to do.
I needed a change. A significant shift in my mindset, and I needed to be at a new place.
What do I really want to do?
From here on, I started making every decision based on the question above.
That one simple thing (“Do what your heart says”) changed the course for the rest of my year and probably my life.
It drastically changed everything!
September – The African Safari and Brighton SEO
I had planned my trip to Kenya a long time ago and even though I had to move major mountains in my business, I didn’t cancel this 9-day trip.
Why?
Because I badly needed a change and deep down I always wanted to experience the Great African Safari.
On the 1st of September, I flew to Nairobi, Kenya, and something was waiting for me.
A new beginning!
Kenya reminded me of India 20 years back. Everything was so raw, natural and pure.
The next few days were full of African adventures.
“The Game Drive”, as they call it, had us travel in the jungle on a safari.
Being in the arms of nature was such an enchanting experience. It reminded me of this famous quote which was part of my social media bio for years:
Every morning in Africa, a gazelle wakes up. It knows it must run faster than the fastest lion or it will be killed. Every morning a lion wakes up. It knows it must outrun the slowest gazelle or it will starve to death. It doesn’t matter whether you are a lion or a gazelle: when the sun comes up, you’d better be running.
For days, I completely forgot who I’m. Something was happening to me. I don’t have words to explain those changes. After months of self-loathing, I was truly free!
This is the same time I started practicing Yoga, and I made a commitment to wake up before sunrise. This was another landmark decision of 2018 for me as it positively impacted my health and overall awareness. I would take this moment to thank Rohit for being my Yoga guru.
At the end of the month, I attended the BrightonSEO. It was the 2nd event for me of the year, and I realized how much I enjoyed attending such events.
Apart from learnings, such events are the best place to meet people who walk the same path as me.
October: DMSS Bali and Lasik eye surgery
After returning from the Brighton SEO, I went straight to Bali to attend DMSS. I was particularly excited about the mastermind which was one of its kind and my first ever. DMSS Bali turned out to be more than a digital marketing event. I have written a detailed experience here.
I met so many amazing people and discovered a lot of stuff about running and managing a remote company. I realized how silly I was by trying to fix things which were not even broken. Another key learning is to surround ourselves with people who are on a similar boat.
Andrea also took me for my first ever surfing experience, and I absolutely loved it.
Lasik Eye surgery
Another highlight of the year was letting go of my eye-glasses. It’s been more 20 years that I have been wearing glasses, and finally, I got the lasik eye surgery done.
so happy that the surgery was successful and now I’m writing this without having anything between my screen and eyes. A huge thanks to Dr. Dariel Mathur.
November: The Change
By November, I was in the doer mode. I was making quick decisions, and my year-long procrastination attitude was long gone.
To make better decisions in life, we need information. If you don’t have the right information, you will end up trying too many times before giving up or keep trying. DMSS Bali has given me the information which I needed to make better decisions, and I realized it was time for me to step up the game.
My experiment with “surrender to the life” had begun again and from the “why is it..
Read more: shoutmeloud.com
1 note
·
View note
Text
Why You’re Failing at List Lion
youtube
It's never been even more trendy. If you are refraining from doing it however, opportunities are your competitors actually are. Yes, this is everything about the advantages of affiliate advertising and marketing.
Regardless of whether you have a really good concept of what affiliate advertising is about however have not yet looked at releasing a partner course for your business or becoming an affiliate marketer on your own-- this write-up is for you.
Affiliate advertising is built around 3 primary events-- publishers (= affiliates), List Lion Review marketers (= organization), as well as customers. In this message, I'll stroll you through the primary perks of associate advertising and marketing apiece perspective. Allow's start, shall our company?
partner advertising version being composed of associate, consumers, as well as seller
Associate advertising and marketing perks for associates
As an individual interested about ending up being an affiliate marketing expert, you have actually most likely heard some hesitations regarding whether affiliate marketing costs the effort. Depending on to Statista, partner advertising and marketing spending in the U.S. alone is actually anticipated to get to $8.2 billion by 2022. Around the world, it was actually estimated in the Awin Record that marketers committed $13 billion in associate advertising and marketing in 2017.
Below are actually the leading perks of affiliate advertising coming from the viewpoint of affiliates, which will definitely expose the reasons you need to become a partner marketing expert.
Not a Supermetrics partner? Come to be one
Get 20% repeating payments apiece registration purchase you draw us.
Visit here
No or even little bit of experience required
There are no details requirements or even abilities you should have to start in affiliate marketing. Associate marketing professionals use different hats-- you can easily earn compensations with content marketing, paid marketing, social networks, as well as e-mail advertising and marketing. Appears horrifying, yet do certainly not panic. Through starting in partner advertising and marketing, you'll receive an opportunity to learn through carrying out given that being an associate just about means managing your personal small company.
Reduced entry barricade
The majority of partner systems are actually easy to sign up for: filler in the form as well as receive auto-approved. If a companion disregards this phrase, they get ended without a probability to always keep any kind of reoccuring earnings.
supermetrics partner plan terms prohibiting making use of top quality conditions
No or low risks included
For a significantly low volume of initiative, you may get a good bargain of revenue with affiliate courses. To be mindful of the very most usual pitfalls, chief over to our write-up regarding the top 10 partner advertising and marketing oversights.
Grow your observing
While expanding the company's customer bottom is actually how you gain percentages, you may also profit from partner marketing by expanding your own observing Especially if you're a web content marketing expert. Different associate offers might aid load your posts with sensible instances.
Affiliate advertising and marketing is actually performance-based
Terrific headlines: affiliate marketing is actually consistently a performance-based model, no strands associated. This implies there are actually no entrance fees, authorized deals pushing you to deliver a particular amount of purchases every month, or a percentage hat. Primarily, you obtain the percentage only if the good action (hit or conversion) has actually taken area.
There is actually constantly a specific danger for novice partner marketers to fail to make any kind of payments whilst investing their funds into advertising tasks. To stay clear of the issue, beginning through deciding on the best partner program for your specific niche.
1 note
·
View note
Text
List Lion Affiliate Marketing Explained in Fewer than 140 Characters
youtube
It is actually never ever been List Lion actually even more cool and trendy. Possibilities are your competitors actually are actually if you are certainly not performing it yet. Yes, this is actually all concerning the perks of associate advertising and marketing.
Regardless of whether you have an excellent tip of what associate advertising and marketing concerns however haven't but looked at releasing an associate system for your business or ending up being an affiliate online marketer on your own-- this write-up is for you.
Partner marketing is actually built around 3 major parties-- publishers (= partners), marketers (= organization), and consumers. In this particular blog post, I'll walk you by means of the main perks of affiliate advertising and marketing from each standpoint. Let's start, shall our company?
partner marketing design containing partner, clients, and merchant
Partner marketing benefits for partners
As an individual curious about ending up being a partner online marketer, you've probably heard some questions regarding whether partner advertising costs the attempt. According to Statista, partner advertising and marketing investing in the U.S. alone is expected to get to $8.2 billion by 2022. Globally, it was actually determined in the Awin Report that marketers invested $Thirteen billion in associate advertising and marketing in 2017.
Below are actually the top advantages of associate advertising from the perspective of associates, which will certainly uncover the explanations why you must come to be an associate online marketer.
Not a Supermetrics partner? Turn into one
Get 20% repeating payments apiece subscription sale you bring our company.
Go here
No or little bit of competence demanded
There are actually no certain criteria or skill-sets you should have to begin in affiliate marketing. Associate marketing professionals wear different hats-- you may gain compensations via web content advertising, spent marketing, social networking sites, and also e-mail advertising. Seems distressing, however carry out not panic. By starting in affiliate advertising and marketing, you'll get an odds to know through carrying out given that being actually an affiliate virtually suggests running your own small company.
Low entry barrier
Most associate courses are actually very easy to enroll in: stuffing in the document and also get auto-approved. It is actually strongly essential to review via and allow the terms and also disorders of the plan as it certainly contains some important guidelines and stipulations. In our Supermetrics partner course, it is strictly restricted to press on our branded keyword phrases. They receive ended without a possibility to maintain any persisting income if a companion overlooks this phrase.
supermetrics partner program conditions forbidding using branded phrases
No or even reduced dangers entailed
For a substantially reduced quantity of initiative, you can earn a great bargain of profit with partner plans. To be mindful of the very most popular pitfalls, head over to our short article concerning the best 10 affiliate marketing errors.
Develop your observing
While growing the brand's client bottom is actually how you make compensations, you may additionally take advantage of partner advertising by increasing your own adhering to Specifically if you are actually a web content marketing professional. Various associate deals may aid load your posts with efficient examples.
Affiliate marketing is performance-based
Fantastic headlines: affiliate advertising and marketing is always a performance-based design, no strings associated. This means there are no entry charges, authorized deals forcing you to supply a particular lot of sales monthly, or a compensation limit. Generally, you receive the payment simply if the beneficial activity (click or conversion) has taken spot.
There is actually regularly a particular risk for newbie associate online marketers to stop working to get any percentages whilst committing their funds into advertising and marketing activities. To avoid the problem, start through picking the appropriate affiliate course for your niche.
1 note
·
View note
Text
Supermetrics: the easiest way to move your marketing data

Based on your marketing data needs, I can confirm that Supermetrics is the most cost effective way you will be able to find anywhere on the internet. It is easy to get started and you can use their free trial to see if this suits your needs. As i have mentioned throughout my journey. There are alot of blogs, videos or articles availble which will tell you that they are do wonders and that they are the best you can ever find. Well that is far from the truth and most of them are just a way to sell!. I am only promoting or reviewing products on which I am sure that they will be beneficial for you and your business. Today I will talk to you about Supermetrics and how this can help you with your growing business!

What is Supermetrics?
Supermetrics is a business analytics software that puts all your metrics and performance indicators in a unified, very accessible location. This was initially designed to help simplify the access to their Google Analytics data. It has evolved to become a full-blown reporting platform which is created just for you! Supermetrics works with various analytics engines and tools. The software has become an ideal platform to gather data and insights as well as to help devise and implement web analytics, social media, and online marketing. This results in being an excellent tool for you to have in your business. The Supermetrics flagship product: The Supermetrics for Google Drive enables businesses to no only run queries, but also refresh their data with just a push of a button. This results in effortlessly sharing reports and dashboards with other team members. Supermetrics Data Grabber delivers an Excel-based report automation application that can easily connect with a number of leading data sources.
Which are the Features?
- Data Analytics - Business Intelligence - Data Mining - Data Visualization & Presentation - Search Engine Marketing (SEM) - Adwords - Report Scheduling and Automation
The Benefits.
With Supermetrics for Google Drive, you can automate reporting processes in your Google Docs and Sheets. This means you can import all your metrics from a number of data sources like Google Analytics, Facebook, YouTube, Twitter and Google Webmaster Tools and have all your data transformed into spreadsheets and documents. If you need to look at the most recent figures, not to worry! The module lets you refresh your data with just one simple click. Furthermore, the option to update your data automatically on a daily basis has never been so easy! Thanks to its user-friendly interface, accessing the data you need is a breeze. Supermetrics Data Grabber gives you the distinctive edge to easily and quickly generate Excel reports based on data. Where does this data come from you may ask? Besides getting the data from Google Analytics, AdWords and Facebook, you also get it from Bing Ads, Twitter and YouTube. There is alot of potential with this program! You don’t need to install anything or embed a script. In the past, we needed to embed a script or do something very complicated which would more likely result in error. Thanks to Supermetrics, it became a super speedy way which saves hours of work. Each and every week you have more time to do something else!
Supermetrics Excel Explained through Video!
Please feel free to visit the youtube channel of Supermetrics by clicking HERE. Within their channel, every single action you can do is explained in step by step guides! For a full review of all the features, please go to their youtube channel directly for step by step guides. https://youtu.be/54iA5OjOC9c Go ahead and sign up for their free trial by clicking the banner below

Read the full article
#excel#google#GoogleDrive#Googlesheets#howtodomarketingdata#howtomakemoney#marketingdata#moveyourmarketingdata#Supermetrics
0 notes
Text
9 Customized Reporting Instruments For Your Advertising Workforce
New Post has been published on http://tiptopreview.com/9-custom-reporting-tools-for-your-marketing-team/
9 Customized Reporting Instruments For Your Advertising Workforce

On the subject of creating reviews on your information, generally a pre-built dashboard, desk, or template will do the trick. However what occurs when your present instrument doesn’t have a pre-built report that meets your wants or consists of the metrics and dimensions you need to use?
Nicely, that’s when a customized reporting instrument is useful.
What are customized reporting instruments?
Customized reporting instruments present the power to create personalised and distinctive (or personalized) reviews on your information. Along with deciding on the info you’ll show in your report, you may as well customise a report’s metrics, dimensions, look, and extra.

There are a selection of customized reporting instruments accessible right this moment together with choices that include different perks like no obligatory coding, straightforward set up, completely different pricing plans, help, and integrations (e.g. for information evaluation and one-click sharing).
Many customized reporting instruments, like HubSpot, typically include pre-built templates and dashboards as nicely for situations by which you don’t want or need to customise your report.
Listed here are 9 customized reporting instruments to assist get you began.
Customized Reporting Instruments
HubSpot Advertising Analytics Software program
Demand Sage
Cyfe
Supermetrics
Domo
Pricey Lucy
Analytics Amplifier
Final Knowledge Export
Google Analytics
1. HubSpot Marketing Analytics Software

Source
HubSpot helps entrepreneurs floor a mix of buyer insights and information to higher perceive what’s working and what’s not amongst target market members. All of those insights and reviews can be found at your fingertips — alongside your CRM — with out SQL.
The customized report builder provides entry to all your information in a single location with out the necessity for spreadsheets. Use the customized builder to arrange all your enterprise information together with contact, firm, deal, marketing electronic mail, touchdown web page, and weblog engagement information.
Different Distinctive Options:
Use customized objects to seize your distinctive enterprise information, create new segments, construct customized reviews, campaigns, and workflows.
Construct customized, shareable dashboards to see all your metrics on one display with a no-code, drag-and-drop editor.
Report on information that’s distinctive to what you are promoting similar to product utilization or stock information.
Use behavioral occasions to trace customized interactions which can be distinctive to what you are promoting and point out when a buyer is able to take the following step within the purchaser’s journey (then set off or schedule the following touchpoint for after that occasion is accomplished).
Join each buyer interplay to a contact in your database and the related income generated by utilizing the income attribution reporting function.
Monitor the effectiveness of your marketing and gross sales efforts inside the account primarily based marketing (ABM) dashboard after which alter your playbook accordingly to achieve your highest-value accounts.
2. Demand Sage

Source
With Demand Sage, simply transfer your HubSpot reporting and analytics information into Google Sheets. The instrument provides customized and automatic — with automated information sync and pre-built dashboards and templates — reviews.
Different Distinctive Options:
Get very particular along with your information by creating reviews which can be record-level.
View your information any means you’d like utilizing Demand Sage’s no-code analytics and desk builder.
Set up the free Demand Sage add-on, click on “Start” within the add-ons menu, and instantly start creating customized reviews.
Integrate Demand Sage with your HubSpot CRM and Marketing Software.
three. Cyfe
Source
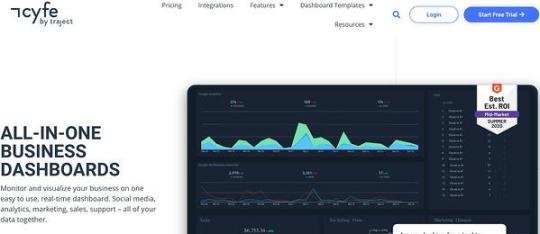
Cyfe is a instrument for making fully-customized enterprise dashboards to observe, show, and analyze your information. The instrument is described as an all-in-one dashboard as a result of you possibly can monitor all of your organization’s information together with (however not restricted to) gross sales, net analytics, social media, and help.
Different Distinctive Options:
Create benchmarks to measure your progress in opposition to what you are promoting goals. Then, obtain alerts from Cyfe when particular benchmarks are met (through electronic mail or SMS).
Customise all elements of your report together with the area title, background, emblem, and colours.
View information from a number of sources (e.g. Google, Fb, Mailchimp) by tapping into Cyfe’s app ecosystem of 1,500+ apps.
Customise dashboards with information out of your SQL database.
Integrate Cyfe with your HubSpot CRM, Marketing Software, and Sales Software.
four. Supermetrics
Source
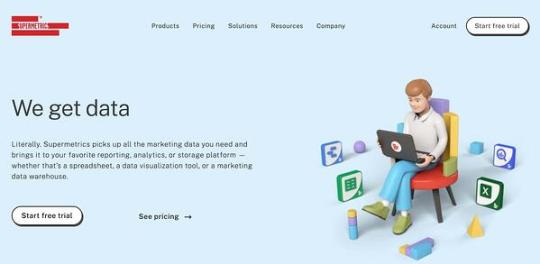
With SuperMetrics, you possibly can simply transfer your marketing and gross sales information into Google Sheets, Microsoft Excel, Google Knowledge Studio, BigQuery, API, Snowflake, and Uploader. When you convey your information into any of those merchandise, totally customise your reviews with the Supermetrics templates.
Different Distinctive Options:
5. Domo
Source
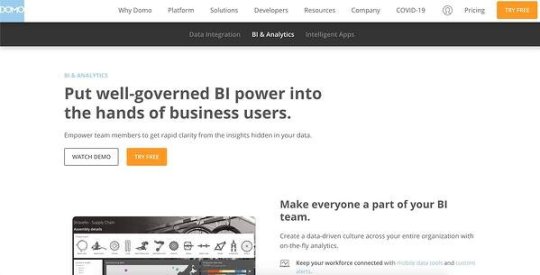
Domo is a enterprise cloud that permits you to simply combine and visualize your information in addition to use (or create) clever apps to tailor reviews in a means that makes them useful to your workforce.
Your interactive and customizable reviews are up to date in real-time. Based mostly on the kind of information you convey into Domo, the instrument will advocate sure visualizations it thinks are best-suited to show your info.
Different Distinctive Options:
Customise your reviews by annotating charts, including governance instruments on your workforce, and refining the info factors which can be most vital to you.
Convey all your marketing and gross sales information collectively to create insights and motion plans primarily based on the real-time info in your dashboards.
Decide how the varied elements of your dashboard work together with customized hyperlinks/ filters.
Integrate Domo with your HubSpot CRM.
6. Dear Lucy

Source
Pricey Lucy is a dashboard for B2B gross sales. Select the metrics that matter most to your workforce and produce them right into a single dashboard to show your information. In your dashboard, present pipeline-based or activity-based forecasts so you realize what to anticipate in relation to the targets you set.
Different Distinctive Options:
Customise your complete dashboard with the drag-and-drop editor to indicate the metrics and information you care about most.
Use the purple and inexperienced gentle function to be notified when your workforce is on course or is falling behind so you may make obligatory changes.
Outline distinctive targets for issues like actions, income, provide base, and hit charge to match your efficiency versus targets.
Customise the way in which you filter your information on your reviews (e.g. by buyer sort) so it’s tailor-made to your workforce and targets.
Integrate Dear Lucy with your HubSpot CRM, Marketing Software, and Sales Software.
7. Analytics Amplifier
Source
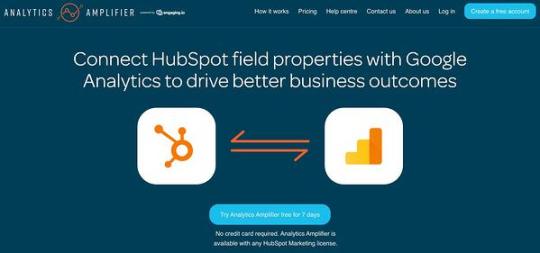
Convey your HubSpot contact information into Google Analytics with ease utilizing Analytics Amplifier. Add HubSpot subject properties or customized behaviors (e.g. lifecycle stage, offers received, electronic mail unsubscribes) to Google Analytics for viewing. This instrument is supposed that will help you optimize what you are promoting paths and drive enterprise intelligence by providing entry to information about your contacts in Google Analytics.
Different Distinctive Options:
View your HubSpot object-level information metrics together with lifecycle set, offers received, persona set, lead rating, variety of related offers, lead standing, electronic mail unsubscribes, and NPS ranking.
Create and generate wealthy, customized reviews in Google Analytics utilizing contact information from HubSpot to know how your contacts and prospects work together and have interaction with what you are promoting.
Use insights derived out of your reviews that will help you attain individuals who seem like members of your target market.
Integrate Analytics Amplifier with your HubSpot CRM, Marketing Software, and CMS.
eight. Ultimate Data Export
Source
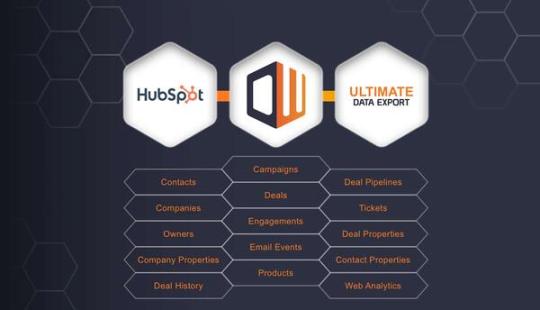
Final Knowledge Export, by Datawarehouse.io, permits you to export all your information — similar to contacts, offers, net analytics, tickets, and emails — to Excel. You can even again up your information in addition to restore, question, sync, combine, analyze, and share it. This instrument is right for customers who need to transfer information out of HubSpot and right into a platform of selection, all at a low price.
Different Distinctive Options:
Export all information out of your HubSpot system (e.g. contacts, corporations, offers/ deal historical past, net analytics, house owners, campaigns, engagements, emails, merchandise, tickets, types, pipelines, and extra) and consider it in a customized report in Excel.
Connect with enterprise intelligence instruments like Tabelau and PowerBI for deep insights into your information.
Integrate Ultimate Data Export with your HubSpot CRM, Marketing Software, and Sales Software.
9. Google Analytics
Source
Google Analytics has a customized report function that permits you to select the scale (e.g. metropolis) and metrics (e.g. web page views) on your report in addition to resolve how that information will likely be displayed. In the event you’re a Google/ Google Analytics consumer, or use a reporting instrument with a Google Analytics integration, customized reviews are simply accessible to you.
Different Distinctive Options:
Export and share customized reviews in seconds.
Select from a listing of distinctive dimensions and metrics on your customized reviews.
Create classes to arrange your customized reviews into teams for simple entry.
Use the Customized Tables function to again up your customized reviews should you’re an Analytics 360 consumer.
There are numerous customized reporting instruments accessible right this moment which have the ability that will help you uncover useful insights and analyze all your enterprise’s information. So, whereas making an attempt to find out the best choice on your workforce, take into consideration which forms of information you need to dive deeper into, the place you need to conduct reporting and evaluation, and the way you need to share and distribute that info.

Source link


0 notes
Link
Dataslayer is the best alternative to supermetrics having a lot of useful features and is available at quite an affordable price than Supermetrics. If your PPC report contains key performance indicators, then take some time to review your report using a free PPC reporting tool. Dataslayer is one of the finest PPC Reporting tool & alternatives to supermetrics due to its versatility in the world of digital marketing.
0 notes
Video
Supermetrics Data Studio Templates Review | Does It Really Work? Find out here: https://youtu.be/IVGOGVTum6Q via @YouTube #supermetricsdatastudiotemplates
0 notes
Text
Here’s How to Automate Google Analytics Reporting with Google Sheets – SEO NYC & Digital Marketing
If the requirement to decrease the period allocated to website stats was actually experienced by you’ve, cutting a large part of the information out -collecting horse function, you’re absolutely buying method that is fresh to automate your initiatives. For individuals who utilize Googleanalytics, you will find effective resources which allow the Statistics APIs to be queried by you and also to develop automated reviews in Shine having a one time startup that is preliminary. (Supermetrics Information Grabber has become the best known device of the type.)
Have you been frightened of Workplace permits, but love Push discussing choices? Subsequently you’ll be happy to understand a totally free add-on is for Google Linens that may do all of the work that is filthy for you, making just the innovative load of arranging information in individual dashboards to you .
I was assisted by this device a great deal in enhancing and automating my reporting actions over the last couple of months.
I’m likely to clarify within several actions utilize its fundamental capabilities to be able to conserve some valuable working-time and just how to do the installation.
Installment
Record into Google Push using the consideration you utilize for Googleanalytics.
Check out this site and click the “Free” switch. (You’ll be redirected to Google Linens.)
Permit the add-on and also the typical permissions is likely to be mounted.
Completed. You’ll have the ability to access your brand device that is new in the “Add- label within the selection.

Generate your first statement
Let’s start benefiting from information. Pressing on new statement that is “Create, the easy software of the add-on opens.
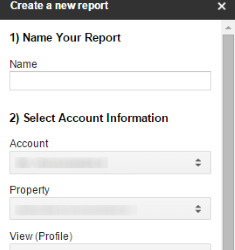
The shape is self-explanatory and extremely simple. Merely name-your statement, select your Statistics account, and set measurements and the measurements you wish to check. Don’t fear if it appears restricted; within the next action, you’ll have the ability to modify all you need (e.g., day amounts and filters). Within this fundamental instance, simply select Periods within the “Metrics” area.
Click “Create report” and also the following stand may appear:
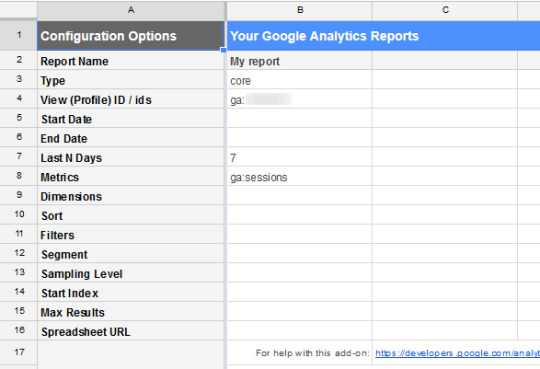
(In some time, we’ll observe how to make use of and enhance it, since it’s the primary of the Google Linens Stats add on.) For-now, just click in the – label: The device may query the Statistics APIs to obtain a pop-up for, along with the information you requested may let you know when the demand was effective. In a brand new linen, you’ll begin to see the real statement, which in this instance exhibits the amount of periods authorized inside the standard time array (the final seven days).

Wish while sustaining another one for assessment reasons to produce a fresh statement? Merely put in a fresh line by sticking the aged one and burning, subsequently changing the ideals wherever required. (The reviews is likely to be produced in two individual sheets). This really is even more quickly than utilizing the GUI each time and hitting new report”!
Enhance your statement
Time for you to return to the “Report linen that is Configuration”. There are lots of more areas compared to types contained in the GUI while you noticed before. Every area, obviously, stuffed or could be modified personally.
A number of them may need a reason of the format that is necessary. A look at the reason is taken by Let’s.
Watch (account) IDs
Below, the Statistics watch you wish to question can be specified by you. That “IDs” is very deceptive: you are able to select just one watch below. If you want to discover more or two sights, subsequently you’ll have to include new posts. To locate your watch identification, simply make use of the GUI of the add on; or visit Statistics and press on “Administration,” followed closely by “View settings.”
Start and finish times
You are able to possibly create times personally (it’s okay if you want to gather information inside a particular period variety) or utilize comparable times with formulations like nowadays and recently. Let’s state you wish to produce a “last-week-vs.-this-week” statement. As recommended in this good Google’s walkthrough, a stylish method to automate measurements would be to produce two posts (i.e., reviews) called, for instance, “this week” and “last week” using the formulations established such as this:

Format — mm/dd/yyyy or comparable times
Last N times
Depart it empty if you are using End-Date grounds and the Start-Date.
Measurements and measurements
Here-you may inform the add on which information you wish to get from Googleanalytics. You are able to set as much as 10 measurements and 7 measurements for every report out. If you want support with discovering legitimate mixtures between measurements and measurements, check out this site.
Format — ga:sessions, ga:users... and ga:nation, ga:bounces...
Kind
This area enables you to alter how one’s report’s platforms are structured. You are able to select:
Just how to team information (by concern);
which purchase (ascending or descending) to utilize.
A good example can make this better. Assume you published ga:periods within the “Metrics” field and ga:pagePath, ga:country within the “Dimensions” area: the statement will highlight, for every site, the listing of nations which produced one or more program, ordered alphabetically.

Now assume you wish to team these details by country (quite simply you wish to understand, for every nation, the listing of websites which produced one or more program): you merely have to create ga:country within the “Sort” area.
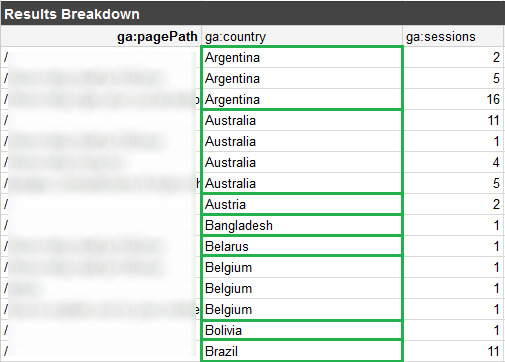
Lastly, let’s state you wish to enhance this desk, displaying periods in order, for every nation. Merely include -ga:periods and also the minus indication is going to do the miracle.
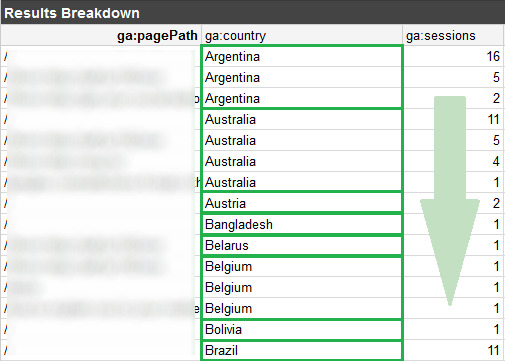
Format — ga:country, -ga:sessions...
Filters
the same instance is continued using by Let’s and state you wish to limit information creation to some specific (e.g. Croatia). This is exactly what the “Filters” area can be used for: load it using the coaching ga:country==Italy and that’s it. While you observe, I utilized the owner == to query the Statistics API using the correct format. To be able to discover which providers you should use to filtration measurements and measurements precisely, observe this checklist. Obviously you may also mix filters using the OR and AND providers, symbolized respectively like a comma (,) along with a semi colon (;).
Format — ga:country==Italy; ga:medium==organic...
Section
The add on permits sections to be even applied by you for your statement. You are able to possibly produce a fresh powerful section onthefly or remember sections currently described in Googleanalytics. I’m unfamiliar with powerful sections – never attempted them truthfully – therefore I’ll simply explain this manual for individuals who wish to have a further consider this subject. To make use of a current section you’ve to understand its identification: the simplest way to locate it’s through Google’s APIs Traveler, that’ll provide you with every aspect concerning the sections occur your Statistics users.
Sample Degree
When you have to cope with a lot of information (significantly more than 500k periods inside the selected period variety) your Statistics reviews will probably be tried. By using this area is much like modifying the testing slider within the typical Googleanalytics cell: depart it empty when the sample dimension pays your requirements, create QUICKER (slider towards the remaining) to get a quicker question having a smaller sample, HIGHER_PRECISION (slider towards the right) to get a slower question having a bigger sample. If you like additional information, listed here is Google’s standard doc about how sample works.
Begin catalog and max outcomes
As Bing reviews, “The Statistics Primary Reporting API returns no more than 10,000 lines per request.” The standard price for your area “Max Outcomes,” nevertheless, is 1000: which means that, if you like to get more information (i.e. Lines), you’ll have to designate the specified quantity below. Let’s state then your complete outcomes of your question surpass 10,000, and also you wish to observe also the lines that exceed that restriction: The area “Start Index” is available in useful because it enables you to pick the strip (i.e., catalog) that to begin exhibiting the information.
A genuine-existence instance
What with you now’s a tangible use-case of the Stats, I do want to share add on. Sometime before I chose to enhance among my SEO reviews that were regular developing a home-upgrading dash in Google Linens. I’d to determine just how to gather instantly the next KPIs:
Natural periods by month and by gadget class;
Natural brings by month and by gadget class;
Periods that are natural Vs. all periods by month.
A short caution before discovering the dash: I utilized mounted times here to shop historic information and also in order to identify the regular pattern of my company, but obviously you could find more worth in utilizing comparable times based on your personal reasons. It’s your decision.
Let’s have a look in the statement setup linen.
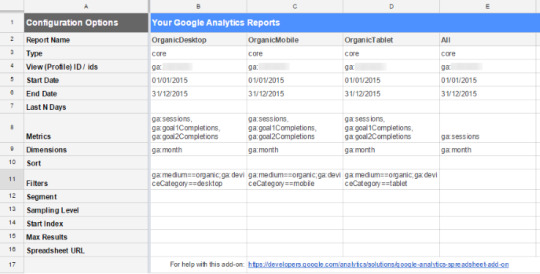
The following the very first three inquiries have now been put up.
Start-Date and End-Date (01/01/2015 and 12/31/2015): What I want this is actually the entire year. I’ll choose month later like a measurement in order to investigate the regular pattern, and I’ll produce a completely new statement once the new year starts (merely duplicate-sticking the aged one and altering the times). In this way I will usually make reference to the reviews that are past to find out yr-over- trends. Doesn’t issue when the current-year isn’t over however: potential weeks update themselves when it’s period and can get zero outcomes. Be cautious: in sample issues Choosing this type of broad period variety may result. To lessen or prevent them you can separate your question by 12 – one-per month – subsequently aggregate figures in another page.
Measurements and Measurements (ga:sessions, ga:goal1Completions, ga:goal2Completions and ga:month): the required measurements inform Google I do want to separate the necessary measurements of my reviews by month. To be able to make use of the full goalXXCompletions you clearly need to substitute XX together with your goal’s identification (it is simple to think it is in Googleanalytics).
Kind (ga:month): this is the way I’d like information to become proven, “grouped” by month. It just assists me within the initial business of information, this task isn’t essential to produce the dash, while you might find.
Filters (ga:medium==organic;ga:deviceCategory==desktop/mobile/tablet): in this way, the inquiries can get just natural leads to reaction, divided by gadget. Why don’t you merely creating one question with deviceCategory established like a measurement? Since – you’ll observe – formulations within the dash could be more complicated, since I’d need to remember information from additional linens with a few kind of research centered on two requirements (month and gadget).
Because it simply requires Stats for that general sessions, the next question is extremely fundamental.
For research, this is a screenshot of the very first statement, which exhibits the amount of the pc traffic that is natural by the associated objective completions and also month.

Establishing the SEO dash
Since the information exists, the enjoyable component is jumped towards by let’s: creating a good dash which provides an instantaneous summary of the KPIs I do want to emphasize. Only an issue of measurements and capabilities. A brand new page opens.
Natural periods
(click the picture to get a greater watch.)
the deltas and also the strip here are quite simple measurements on the basis of the lines above’s result. What’s worth taking a look at is mobile B5. The method is spread within the desk within ” “Mobile” the “Desktop and lines.
=VLOOKUP(B, OrganicDesktop!$A:$D, 2, FALSE)
The VLOOKUP reads the required selection of the “OrganicDesktop” linen searching for the worthiness of the mobile B2 (the amount of the month, in this instance, 1) and returning the related price within the next line of the desk (the amount of periods).
Why guide the worthiness to find not and having a mobile straight using the quantity? It’s a well known technique which below enables me to pull the method implementing it to every mobile of the strip, because of the “dynamic” mention of the the row 2 (where I published the amounts of the weeks).
The lines “Tablet” and “Mobile” are filled with, changing the recommended sheet within the same manner.
The piechart about the right simply shows the sum total natural periods that are typical by gadget. To obtain the percentage worth of the pc traffic, for instance, I utilized this quite simple formula:
=SUM($B5:$M5)/SUM($B:$M)
Natural prospects
The dashboard’s 2nd part is actually a duplicate of the one. The only real distinction is the fact that the tissues of the lines “Desktop,” “Mobile” and “Tablet” summarize two VLOOKUPs, since I have need to record below the sum total quantity of prospects (objective 1 completions + objective 2 completions).
This is actually the method of the mobile B33:
=VLOOKUP(B, OrganicDesktop!$A:$D, 3, FALSE)+VLOOKUP(B, OrganicDesktop!$A:$D, 4, FALSE)
Natural periods vs. all periods
Lastly, an extremely one that is easy. The strip “Free traffic” utilizes ideals in the strip “Total” of the “Organic sessions” desk, as the strip “All traffic” looks for ideals within the “All” linen via a VLOOKUP formula:
=VLOOKUP(B, All!$A:$B, 2, FALSE)
Summary
This dash is just a fundamental instance of that which you may do using the aid of the Googleanalytics add on for Google Linens. Once you know just how to get information precisely in the Statistics APIs, you’re liberated to arrange them while you like in a brand new linen (or in a brand new document, using the IMPORTRANGE purpose), to be able to put up an entirely automated and home-upgrading cell based on your requirements.
One thing: Remember, you may also plan reviews to revise them instantly without pressing on just one switch.
Check out Add-ons gt &; Googleanalytics within the selection above to locate the thing you need.

Would you make use of a procedure that is comparable? I’d enjoy viewing your ideas below within the remarks.
Subscribe to The Moz Top, a semimonthly mailer upgrading you on top five best bits of SEO information, guidelines, and radical links discovered from the Moz group. Think as your unique digest of material of it you don’t have time for you to search for but wish to study!
from Shgmpm Affordable SEO Agency http://www.shgmpm.com/heres-how-to-automate-google-analytics-reporting-with-google-sheets-seo-nyc-digital-marketing/
0 notes
Text
Supermetrics Review: Easy SEO, PPC, and Social Media Reporting
Last updated on March 26, 2020 at 02:36 pm
If you are in the digital marketing industry, you would know how crucial data is. Everything that we do online produces data that we can use to develop strategies, improve processes, know our customers better, and define the success and failure of our campaigns.
Needless to say, you need data to further grow your business.
With the continuous improvement in technology, we marketers are blessed to have all the tools that we need to gather data whether its for SEO, advertisements or social media. We have Google Analytics, Google Ads, Facebook Ads, YouTube analytics, you name it.
However, with all these data lying around, one common problem marketers have is how they put all of these data together. Jumping from one platform to another takes a lot of time. It’s messy, confusing, and inefficient.
Luckily for us marketers, there is a tool that allows us to compile all of our data into one place. I’m talking about Supermetrics. I’ve had the pleasure of using Supermetrics and use it to create reports for my clients and I could say that it comes in really handy.
Just a quick note, if you want to try out Supermetrics before I get into this review, you could do so by going into this link and get a 14-day free trial. The free trial allows you to use one product and choose one integration to help you get a hold of things.
Supermetrics: The #1 Add-on for SEO, PPC, and Social Reporting
Supermetrics is a tool that is used by thousands of marketers worldwide. It helps marketers collect all the data that they need and put it all in one place for easy and fast reporting. Whether you are an agency, a business owner, or an in-house marketer, Supermetrics will allow you to save time, organize your data better, and create visually appealing reports.
Supermetrics offer 6 product options that you can choose from depending on your needs and processes:
Supermetrics for Google Sheets
Supermetrics for Google Data Studio
Supermetrics for Excel
Supermetrics for BigQuery
Supermetrics Uploader
Supermetrics API
How Does Supermetrics Work?
Supermetrics is an add-on which means you connect it to the reporting platform that you choose whether it’s Google Data Studio, Google Sheets, or Excel, and Supermetrics will integrate your data from wherever your data is.
You can integrate more than 50 major data sources through Supermetrics such as Google Analytics, Google Search Console, Facebook Ads, Twitter Ads, Linkedin Ads, Moz, SEMRush, and many more.
Using Google Data Studio with Supermetrics
The product that I am currently using is Supermetrics for Google Data Studio. Google Data Studio is a free tool by Google that allows users to create dashboards with data from other Google products but with Supermetrics, you could blend in so much more data into one dashboard.
Supermetrics was easy to set up. You don’t really have to create an account. Once you purchase a product or sign up for a free trial, it will redirect you to your Google Data Studio account.
Select create a new report, search for Supermetrics in the data search bar, and all Supermetrics connector that can be integrated to Google Data Studio will appear.
In this sample, I am creating a report for a paid ads campaign. I integrated data from Google Ads + Analytics, Facebook Ads, Twitter Ads, Bing, and Linkedin. Now if you’re wondering what’s the difference of using Google Data Studio without Supermetrics, from the data need, I could only pull up Google Ads + Analytics.
Wide Variety of Data Options
I was really impressed with the number of data that I could choose from. There are tons of metrics that allow me to provide more granular data in my report. This was quite intimidating at first and was a little confusing but once I was able to get a hang of it, I was able to look for the data that I need faster.
Blending Data
This is where Supermetrics really shines. I was able to integrate data from Google Ads, Facebook, Twitter, Bing, and Linkedin into one report. This saved me lots of time rather than going to one platform to another and collecting data manually. Through Google Data Studio I could even compare the numbers from each platform to give me a large-scale perspective on where I could improve my campaign further.
Multiple Accounts
Using Supermetrics also allows you to connect multiple accounts. I personally have two Google Analytics accounts and I don’t have to pay extra if I want to connect both of them.
Free Templates
Supermetrics have a gallery of templates for Google Data Studio that you can use. I find this really useful when I need quick reports. All I have to do is make a copy of one of their templates and change the data source to my account. Here’s a link to their Google Data Studio template gallery.
Supermetrics for Google Data Studio Pricing
Supermetrics offers three packages for Google Data Studio:
Individual Connector ($39/month)
Unlimited reports
1 account user
3 accounts per data source
1 data source
Pro ($99/month)
Unlimited reports
3 users
20 accounts per data source
Access to all Supermetrics data sources
Cross-platform data blending
Super Pro ($299/month)
Unlimited reports
5 users
100 accounts per data source
Includes all Supermetrics data sources plus Adobe analytics, Adform, Criteo, Google Ad Manager, Google Campaign, Google Display & 360, Hubspot, Snapchat Marketing, Salesforce, Searchmetrics, etc.
Cross-platform data blending
Supermetrics have different pricing options for each product. To view the packages for Google Sheets, Excel, BigQuery, Supermetrics Uploader, and Supermetrics API, check out the full Supermetrics Pricing Page.
Final Verdict
All in all, I would say Supermetrics is a marketers best friend. As a digital marketing agency, we spend hours on creating reports for our clients and Supermetrics really helped us reduce the hours we spent. If you are also working on an agency, I highly recommend Supermetrics because it really makes reporting more efficient. As for business owners or in-house marketers, I would recommend Supermetrics if you are running campaigns on multiple platforms so you could easily review your data and realign your business strategies.
Supermetrics Review: Easy SEO, PPC, and Social Media Reporting was originally posted by Video And Blog Marketing
0 notes
Text
Supermetrics Review: Easy SEO, PPC, and Social Media Reporting https://t.co/obq07ufv4M https://t.co/0BoC27xUJ7
Blogging Informer and Sophia Borel share new tweet with the following content:
Supermetrics Review: Easy SEO, PPC, and Social Media Reporting https://t.co/obq07ufv4M pic.twitter.com/0BoC27xUJ7
— Sophia Nguyễn (@shophiaborel) March 26, 2020
This following article is published on March 26, 2020 at 06:21PM Please be noted that the following article is available on Sophia Borel's Blogger. Content credit: find more on Twitter
0 notes
Text
10 Biggest PPC Changes in My (almost) Decade In The Industry
As I was trying to force myself to say “Microsoft Advertising” instead of “Bing Ads” on client calls recently, I got to thinking about all of the changes that have happened in this industry since I got started in 2010. There have been quite a few, but some stick out in my memory, either because of how large of an impact a change had or because of some small irritation I felt about a change.
Here are the top 10 changes that have stood out to me since in my, almost, decade working in the PPC industry.
1. Transition of Yahoo ads to Microsoft (October 2010)
When I started, the big three search engines each had their own advertising platform. There was a lot of shift before this (and continues to be) in the relationship between Yahoo and Microsoft advertising, but in early 2010 Microsoft announced it would be setting up a joint venture to sell its adCenter advertising on both Yahoo and Bing. The transition of all Yahoo advertising to adCenter was complete in October 2010, which meant that the majority of my first tasks in the PPC world was preparing clients for the transition from 3 to 2 search advertising platforms.
2. Microsoft Loses Yahoo Exclusivity (2015) and then Gets it Back (2019)
Look, most relationships are complicated and the one between Microsoft and Yahoo is no different. In early 2015, the partnership between the two was modified so Yahoo could serve up to 49% of the ads with their Yahoo Gemini system or any 3rd party they wanted to use. This meant the creation of Yahoo Gemini accounts for the majority of our clients.
As of this year, Microsoft and Yahoo made a new deal where Microsoft Ads will be the exclusive search advertising platform for Yahoo and other Verizon Media properties. This led to close monitoring in our clients’ accounts to see how the expected increase in Microsoft Ads traffic changed performance and reviewing our Oath (formerly Gemini) campaigns to see if anything needed to be transitioned.
3. Google Enhanced Campaigns (2013)
I will always remember that Enhanced Campaigns were officially announced by Google on a Wednesday. Why, you ask? Well I had just finished training AdWords 101 and 201 classes which always ran on Monday and Tuesday. Since much of what I had taught would be changing, I threw together some quick slides and stole some time from the Google Analytics 101 class to review the updates. Did my students have any idea why I was making such a big deal out of this, probably not. Did the GA students who were not signed up for the AW class care, also unlikely.
What I will also remember about this announcement are the very strong opinions from myself and other PPCers, specifically around Google taking away the ability to run mobile-only campaigns. This change effectively made mobile a must-do for advertisers and tablets were bundled together with desktops. Luckily, advertisers were eventually given back control of targeting devices separately in Google. For now.
4. Google Releases Remarketing to all Advertisers (2010)
In my opinion, Remarketing is one of the most important pieces of online advertising. The ability to show ads to people who had previously visited your website as the browse the content network (I do not miss that name) was game changing. Obviously remarketing has become much more advanced in the last nine years, from simplification of tagging to dynamic ads, and will continue to evolve.
I cannot imagine a world without people complaining of being stalked by a company’s ads online.
5. Google Launches Google Shopping Ads (2012)
Froogle was launched in 2002 as an e-commerce comparison tool that used Google’s web crawler to index product data from vendor websites. After a series of name changes, it was rebranded in 2012 as Google Shopping and changed to a pay-to-play model where all free product listings were removed and merchants would have to pay to list their products on Google.
There were concerns from small businesses that they wouldn’t be able to compete with larger merchants on the new platform. My experience though in working with e-commerce clients, including small businesses, is that results are overall really good, especially compared to search ads. These ad formats tend to have lower CPCs and better conversion rates when compared to text ads on the SERP. Shopping Ads have become an integral part of every successful e-commerce advertising strategy.
6. LinkedIn Launches Sponsored Updates (2013)
While search platforms are great for B2C businesses, they can be hit or miss for B2B. While advertising on LinkedIn started back in 2005, Sponsored Updates were launched in 2013 and are still on of the most popular ad formats today. Organizations with company pages could now pay to promote their content to specified LinkedIn users. It took another three years for conversion tracking to come to LinkedIn’s campaign manager, but today it tends to be one of the top spend ad platforms for my B2B clients.
7. Facebook Introduces Lookalike Audiences (2013)
Facebook Ads was launched in 2007 with all ads relegated to the far right hand side of the newsfeed. Six years later they released my favorite feature, Lookalike Audiences. Lookalike Audiences let advertisers target people who have similar characteristics to a chosen source audience. This allows for a relatively easy expansion of reach for advertisers. Let’s face it, Facebook knows a lot about you. That’s why I think their Lookalike Audiences have been so effective for my clients and are typically where most of my Facebook advertising dollars are spent.
8. Bing Ads Editor Available On Mac (2016)
Is this the change that had the largest impact on the industry, no. Is this the change that had the largest impact on my life, yes. I became a Mac lover in 2010 when I got my first post-grad job. It was sleek, it was beautiful, but it was non Bing Ads Editor compatible. At my first company, we all had to connect to the remote desktop of the single office PC if we wanted to use the Editor (and yell out loud to ask if anyone was using it so we didn’t kick them off). I held onto my pink Dell laptop for 12 years for the sole purpose of using the Editor. Finally, in June 2016 my dreams came true and Microsoft released a version of BAE for Mac.
9. The Day I Discovered Supermetrics (October 18, 2016)
I had been manually updating projection data for the first six years of my working life. When I got assigned to a client who had 30 different account projection spreadsheets they wanted updated daily, I thought “There has to be a better way to do this.” A quick Google search led me to Supermetrics and my life was forever changed. Being able to create a report once that automatically updates the data daily has saved hours of work time a week.
10. Google Ads Interface Update (2018)
I’m including this in my top 10 changes because I can admit when I am wrong. I don’t typically like change, which is a perfect quality for working with the Internet, so when I started seeing the option to try out the new interface in my Google Ads accounts I took one look and switched right back to the original. I hated it. They took away my beloved dimensions tab and I didn’t like the visual look of it. I didn’t end up switching to the new interface until I was forced to. Now… I can’t even remember what the old interface looked like and I’ve fallen in love with the reporting section that has saved me a lot of time conducting analyses in the interface.
What are some of the biggest changes in the PPC Industry that stand out to you? Let us know in the comments below!
If you’d like to keep journeying on the path down memory lane, check out:
The Evolution of Facebook Ads Over the Years
The Evolution of Google AdWords Over the Years
from http://bit.ly/2mCSiku
0 notes
Link
Dataslayer is the best alternative to supermetrics having a lot of useful features and is available at quite an affordable price than Supermetrics. If your PPC report contains key performance indicators, then take some time to review your report using a free PPC reporting tool. You can even update the functions to get the real-time data and automate reports of all your campaigns for online marketing.
#supermetrics free alternative#supermetrics alternative free#supermetrics alternative#is supermetrics free#how to use dataslayer#dataslayer chrome#dataslayer#data slayer#best supermetrics alternative#alternative to supermetrics#PPC reporting tool#free PPC reporting tool
0 notes
Text
25 Ways Google Drive Can Help Power Your WordPress Business
Google Drive has saved my life (professionally, at least) on any number of occasions. I know that some people are wary of services like Google Drive or iCloud for fear of being locked into a single company’s ecosystem (or walled garden, as they’re usually referred to), but there are a lot of benefits to using Google Drive if you’re running a WordPress business. We use it here at Elegant Themes, and it makes putting things into your hands so much easier.
What is Google Drive?
First off, let’s establish what Google Drive is. Google, the omnipresent power that it is, has created a suite of tools that when put together are called Drive. Included in the (default) suite are
Docs
Sheets
Slides
Forms
Drawings
My Maps
Sites
Pixlr Editor
If that’s not enough for you, just hit Connect More Apps and you are taken to the Chrome/Drive app store where you can integrate as many of hundreds (if not thousands) of first- and third-party tools as you want.
In addition to the apps you have, Drive also functions as a, well, drive. You get a certain amount of cloud storage for free with Drive, and you can upgrade that for a monthly price. With that, you can sync between any number of computers and the cloud to always keep your files up to date. In this way, it works pretty much just like Dropbox.
In many ways, using Google Drive as a primary tool for your WordPress business isn’t so much about the power of the tools themselves, but the flexibility and efficiency that you’re able to achieve with your workflow. The entire suite of tools works together so seamlessly (and with other apps like Slack and Trello and even WordPress itself) that taking advantage of these feature will no doubt increase your company or team’s efficiency. Which will then (hopefully) increase revenue.
So…with all that said, now that we have a foundation of what the platform is, let’s jump into how you can use it to drive your WP business to the next level.
1. Real-Time Collaboration
The biggest selling point of Google Drive in almost all respects is the inclusion of real-time collaboration. You and your team can be in the same document at the same time, making real-time edits. While this may not sound like an out-of-this-world, blow-your-mind feature, it absolutely is. As a member of a team who works a world apart from one another, being able to get on a Google Hangout and work on a post, meeting agenda, or planning document is invaluable.
If your WordPress business specifically relies on content via articles and posts, Google Drive can really speed up your editorial process if done correctly. Instead of sending drafts back and forth between writers and editors, you can be in the same document at the same time, making real-time edits. Even if you use the Submit for Review and Pending status in the WordPress dashboard, being able to work together prevents back-and-forth messages like these:
Editor: Hey, yesterday’s article needs a fix. I set it back to a draft for you.
Writer (half an hour later): Okay, I submitted it to pending again.
Editor: I set it back to a draft one more time because of this other thing.
And so on and so forth. That probably looks familiar to a few of you. Taking advantage of the real-time editing instead of using it for simple document sharing will really power up your business. Especially if all your writers’ permissions are set to “Suggest Edits” instead of editing outright.
2. Live Chat
In addition to the real-time collaboration aspect of Drive, each document has a live chat option if you have more than one person in the doc (or sheet or slide) at a time. You just need to click the chat icon next to the document participants. As people come in and out, they are added to/removed from the chat. I realize that many of you (us included) use Slack or something similar for your team communication, but that shouldn’t keep you from using the integrated chat.
Reason being, it’s more efficient. Keeping Slack open in another tab or as a separate program means you’re always going back and forth. You’re getting separate notifications. And you have to divert your attention from the work you’re doing. If you’re using the chat option, you can toss pertinent links, commentary, and everything right there in the document. And you can search it later and keep the whole conversation in context — which is perfect when you need to go back to a previous project and instead of having to go through thousands of messages archived months and months ago in Slack, you can simply look at the chat archives here.
But what about comments? you may be thinking. And comments are great for anything that is a one-off that may need a single reply and can then be resolved. But if you’re dealing with a discussion, comments are not your friend. Plus, you may get emails about every single comment message, and trying to search through them for to track a single conversation is simply unbearable, even with the comment-thread feature (beside the open chat button).
3. Hangouts
In much the same way that live chat is used, you can do the same thing with Hangouts. Hangouts does have a chat in the window it opens (which is great for meetings, but not so much when collaborating in real time in a document), but you can keep the call open in the background while you work. Again, it’s not any different than another VOIP service or call (Skype, or even Slack calls); however, since it’s integrated into Drive, anyone who’s involved already is just a click away from a video/voice call to collaborate on any given document or project. It’s a quality-of-life inclusion that you can’t fully appreciate until you’ve used it, I think.
4. Slack Integration (Among Others)
Now, I’ve said a lot of stuff that may come across as Slack is great, but…, and knocking the service. That’s not what I mean. So let me say this: Slack is great, but… (haha) Google Drive makes it even better. Really. You can install it to any Slack workspace you want from their app store.
There’s no way all of these features don’t enhance your WordPress business. Sure, they don’t directly tie to WP itself, but they make creating content for WordPress sites much more pleasant. I can’t count the times that I have personally been working on a post, only to receive a Slack notification of a comment, revision, or invitation to edit that was time sensitive far quicker than the automated emails came through (if they came at all, in a few cases).
The same integration is available for Trello and Basecamp and any number of other project management and team communications suites. Google Drive is such a pervasive and ubiquitous tool that you should absolutely take the time to (or have your admin) integrate whatever apps are available to link Drive into your service.
5. Using Google Sheets as a Team Dashboards
Admittedly, I am pretty wary of spreadsheets. They’re functional, but they’re not sexy. Apps…now they’re sexy. When it’s possible to use an app or program to do something that someone suggests a spreadsheet for, I opt for the separate app. But honestly, sometimes having a separate app just isn’t possible. And if you’re trying to keep everything within the same ecosystem (Google Drive in this case), keeping your data in a spreadsheet just makes sense.
Luckily, there’s an addon for Google Drive called Supermetrics. It really supercharges what you can do with Google Sheets, and so that even people like me can get them to perform adequately.
Basically, you can set up an entire analytics and monitoring suite for your business using Drive (and even bringing in Google Analytics, too). It lets you have have an at-a-glance rundown of what is going on with your site, SEO, the blog, social channels, and anything else you need to import and look at. This kind of dashboard for your team is not a replacement for a suite for tracking services or their built-in tools, but it works amazingly well for aggregation, analysis, and pinning down improvement areas (not to mention highlighting successes).
6. Sync with Google Photos
Since Google Drive has file storage as a primary foundation of the service, I’d be remiss if I didn’t show you one of the more useful connections to WordPress regarding that. In addition to being able to export backups and large media files from plugins like UpdraftPlus or services like Zencastr, the official Jetpack plugin supports Google Photos media library imports. Again, powering up your WordPress business is about efficiency. Keeping your photos in one place (for free and with unlimited space) and then being able to import them into your WP media library is invaluable.
If you run a WP business, you are probably on the go a lot. You may not even use the same computer or device day by day. Cloud storage is your friend, especially when you don’t know where and when your next hard drive will be coming from. You may work from public computers (raise your hand if you’ve lost something important because you forgot to back it up before your session ended). Plus, how many times have you been told “Sure, you can use my computer. Just don’t download anything at all.”? (That’s a rarity these days, but it still happens.) You might even have to put in whole days of working on your smartphone.
Regardless of why you’d need to keep pics in Google Photos, you should be. And honestly, probably are regardless. So linking the service to WordPress and then being able to import your Google Photos directly into your media library will increase efficiency just enough that you will wonder why you’ve downloaded/uploaded/Recycle Binned images for so long.
Note: Currently you aren’t able to access/import Google Photos from your wp-admin of self-hosted Jetpack-enabled sites. You will need to import those photos from your site at WordPress.com in order to see them on your self-hosted site.
7. Dictate Documents Like a Boss
I sometimes imagine what it would be like to sit back in my office chair (feet up on the desk) and dictate important emails and notes to my personal assistant. I would use cool phrases like “next line” and “new paragraph” as I rattled off a symphony of the english language. Well, with Google Doc’s voice typing functionality, this dream has become reality (kind of). I don’t really sit back in my chair, I have to click a button to start dictating my text, and I have to check the final draft for grammar just to be safe. But at least I still get to use some cool phrases even though I have to say “new line” instead of “next line”. And I find that it is really useful for things other than drafting emails. It is also a convenient way to record notes during client meetings without having to interrupt the flow of conversation with typing. And I sometimes use it to record blocks of text from images or screenshots of content that I need to add to my website.
8. Store and Embed Videos
If you are looking to host your large media files (like Videos) outside of WordPress, Google Drive will allow you to link to those files within your WordPress site. Also, Drive makes it easy to embed videos directly on your website.
Once the video has been uploaded to Drive, open the video in a new window.
Now all you need to do is open the file in a separate window. Open settings again and click the “Embed item” link in the menu.
Copy the embed html code and paste it on your webpage.
9. Google Slides for Webinars (and other presentations)
Webinars are a popular way to educate customers about your product, grow your email list, and, in the end, make more money. But a lot of the webinars I’ve seen have pretty horrible presentations, mostly due to the design of the slides. Google Slides can help ease the pain of designing a template for your webinar slides. And you can just launch the presentation and deliver your webinar straight from Google Drive. Once done, you can easily share your slides with your audience for reference.
You can also easily add Google Slides presentations to your WordPress website.
10. Use Google Forms for things like Contact Forms, Client Questionnaires, and Surveys
Any online business will need a reliable method for collecting and storing important information from their customers. Google Forms offers a convenient platform for creating forms for many different use cases. You can easily embed a Google form to your WordPress website and all the results can be accessed from Google Drive.
A WordPress business could use google forms for many different use cases, including contact Forms or Client Questionnaires for on-boarding.
Google Forms can be a simple yet powerful solution for surveying your visitors for market feedback, employers for happiness levels, customers for reasons they jumped ship. You can even use a survey to improve your website experience. Whatever the reason, you can easily embed a google form on your site or send users to the designated form page on your Drive.
If you want to use another software like Typeform, don’t forget that you can easily create a zap to store all those entries neatly in a Google Sheets spreadsheet.
11. Integrate Docusign with Google Docs
Running a WP business usually means most (if not all) of your meetings take place online. That means contracts, and other important documents, need to be signed electronically. DocuSign is a popular e-signature online service that works with Google Drive. All you need is to get the extension from the chrome web store and you can easily send/share your documents right from Google Drive (or Gmail) and then automatically store them securely in your Drive. Unless of course, you enjoy using a printer, scanner, or fax machine (they do still exist).
DocHub also has another popular extension for editing and signing PDF Documents and Word Documents straight from Gmail.
12. Google Drive File Stream
I don’t know about you, but I like keeping files in the cloud because I hate overloading my hard drive with files which I know are full of things I don’t need anymore and I don’t have time to sort through. But I also like the convenience of being able to search through my files (or cluttered mess) on my computer. The Google Drive File Stream application seems to have provided a way to have my cake (or cloud) and eat (or search) it too. This may seem like a small convenience, but don’t underestimate the annoyance of an overloaded hard drive when running a business.
The Drive File Stream is available with their Business plan and is a step up from their Backup and Sync application which is free for personal plans.
13. Backup Your WordPress Site on Google Drive
There are a ton of solutions/plugins out there for backing up your WordPress website. But, not all of them are free, and those that are tend to store your backups on your server (which can crash). Google Drive does provide a good amount of free storage space (15GB) which can be used to store your backups to a remote location, accessible from anywhere.
You can Create a Drive Backup of your WordPress Website through the use of a WordPress backup plugin like UpdraftPlus – for FREE.
14. Import Blog Posts from Google Docs to WordPress
If you have ever tried to copy content from Google Docs into a WordPress blog post, you may have noticed that things don’t always transfer cleanly. The html gets some additional formatting that you don’t really want. But there are ways to merge the the two effectively. Wordable offers a premium service that allows your to import posts and pages directly from Google Docs with a click of a button (see review here).
There is also free solutions including the WordPress.com to Google Docs Chrome extension and the Mammoth .docx converter plugin.
15. Embed Google Calendars in WordPress
I realize that Google Calendar is not technically Google Drive (all these apps blend together in my mind after a while), but I thought it worth mentioning considering the popularity of calendars for WordPress and and WordPress business.
No one wants the headache of managing one calendar for your website and another on Google. Thanksfully, adding a Google calendar to your website is pretty simply. Once you customize the calendar within Google Calendar, you can generate an embed code that can be pasted anywhere on your WordPress site. The code is an iFrame which simply means what you see on the website is actually hosted on Google. So styling the calendar will challenging using CSS in WordPress. So if you need more control over the calendar design, you can use a plugin like Simple Calendar.
16. Showcase Google Calendar Events on WordPress with A Plugin
Instead of settling for a Google Calendar embed code, there are WordPress calendar plugins that integrate with Google Calendar to open new doors for customization and display options. Simple Calendar and WP Google Calendar Manager will do the trick. Both make it easy to add Google Calendar events to WordPress
17. Integrating Google Sheets and WordPress
If you are familiar with Google Sheets, you know how easy it is to convert your spreadsheet data into a beautiful chart or graph. It is pretty “mathi-magical” stuff. And there are ways to display these beautiful illustrations of data directly on your WordPress site. You could opt for a WordPress plugin like the Inline Google Spreadsheet Viewer which can turn your Google Sheets data into dynamic spreadsheet, charts, and tables and insert them anywhere on your website (learn how).
Alternatively, you can publish a spreadsheet (or chart) to the web directly from Google Sheets to get an embed code you can paste to your webpage.
18. Use Google Slides to Create Images for WordPress
Not all businesses are lucky to have a skilled graphic designer on hand to create those custom images needed for their website. That’s why there are many options available to bridge the gap between businessman and photo editor for your WordPress images. Google Slides is one of those options.
The great thing about Google Slides is there are wonderful free templates/themes out there that will jumpstart the process of designing your own images from scratch.
All you need to do is design a slide and download it in JPEG or PNG format.
19. Google Meet for Video Conferencing
Google is constantly evolving their communication products. This includes Google Hangouts. Now, Google Hangouts is branching out to include Hangouts Chat to create a more Slack-like experience for your business. And Google Meet (or Hangouts Meet) is becoming a prize fighter in the video conferencing industshery.
So if you have access to G Suite, you may find Google Meet to be just what you need. For $5 a month, you can host up to 25 video callers with some other useful features similar to most of those video conferencing software giants out there. The G Suite Enterprise edition allows you to connect with up to 50 people.
See if Google Meet is the right fit for your business videoconferencing.
20. Search and Access Docs from Email
This one has been around for a while, but if you live on Google Docs the way I do, it is a valuable resource. When composing your many emails from Gmail, you can insert Google Drive files directly from the email interface. Just click the Google Drive icon at the bottom.
Then you can search through all your folders and insert your file either as a link or an attachment.
21. Take Advantage of the Specialized Linking System in Google Docs
Google has some helpful features to help you link to different areas (headers) of your Google Doc. This is a great time saver for combing through large docs containing weekly meeting notes on certain projects. The only think you have to do is make sure you organize your doc with proper headings. Google will take care of the rest. Google has a built it Document Outline display that will turn those headers into a clickable table of contents on the left of your doc. Simply click the view tab and select “Show document outline”.
But sometimes it’s just easier to create another doc instead of having all your info in one long page. Google makes it easy to create links to other documents to speed up the process of accessing related info. It also helps you organize a network of related content.
Just create a link and start typing the name of the doc or folder in the link box. Your documents will start to appear below for easy access.
22. Revision Tracking
When multiple people are working on the same Google Doc, you need to be able to know who made certain changes and when those changes are made. This is crucial for any project manager. Google Docs has the ability to show these revisions based on user and time. Simply click the File tab and select Version history > See version history.
Now you can view all revisions in a left sidebar and click the revision you wish to view.
Now you can work together revisions in a snap.
This revision tracking is also available in Google Sheets, Slides, and Forms as well.
23. Use Google Drawings to Sketch Wireframes and Design Infographics
Google Drawings has an intuitive UI for creating all kinds of helpful illustrations easily. Sure, it doesn’t pack the same punch as Illustrator or Sketch, but it can be useful for sketching wireframe and designing infographics.
Wireframes are useful for sketching out a blueprint of your website before it reaches the design phase. It can save your WordPress Web Design business a lot of time. So if you are looking to save money, Google Drawings can definitely do the trick. It offers all the shapes and text elements you need to create and align your wireframe.
If you want to up the scale of professionalism for your wireframes, there a many free wireframe templates available. A quick google search of Google Wireframe templates should get what you need.
And if you need an infographic to display on your website, Google Drawings can be a simple solution. Your infographic may not go viral or win awards, but it can boost your website with extremely helpful illustrations. And, because you can create charts and graphs based on actual data in a Google Sheet, you can speed up the process of design by inserting those charts created automatically.
24. Connect Google Drive Apps with Other Apps with Zapier
Zapier is a popular online software that allows you to share data between more than a thousand apps you use everyday. And yes, you guessed it. There are a lot of connections (or zaps) you can create with Google Apps. You can even create zaps to connect Google Drive with WordPress to create backups of your posts on a Google text file or log WordPress posts to a Google Sheets spreadsheet. And that is just a few examples. You can even connect different Google apps together and create Google Calendar events from a new Google Sheets spreadsheet row (or Google Form entry).
This kind of integration can automate tasks for your business and save you time and money.
25. Security
Security tends to be a luxury we take for granted until, of course, we don’t have it. Google does seem to take security seriously, building their core security infrastructure into all of their services. Plus, there are ways to make your account more secure with things like 2-step verification.
Google Cloud Storage also seems to have a security model that your WordPress business can trust. I’m not saying it going to be the best fit for your company, but it may be a smart solution for Google fans.
Drive Off Into the Sunset
Chances are that you already use Google Drive in some way for your WordPress business. That’s great, and you probably have seen how much it can help. Hopefully, though, we’ve hit on some ways that you and your team can really get more out of the service. Not everything will work for every one, but as we’ve implemented a lot of these around here at ET, we’ve definitely noticed a difference in how much more work we get done and how much nicer it is to get that work done.
How do you use Google Drive to power your WordPress company? Let us know in the comments!
Article featured image by Andrew Rybalko / shutterstock.com
The post 25 Ways Google Drive Can Help Power Your WordPress Business appeared first on Elegant Themes Blog.
from Elegant Themes Blog https://ift.tt/2KF49FK via SiliconWebDesign
0 notes