#NOAA ENSO
Explore tagged Tumblr posts
Visit Tumblr Blog
Explore Tumblr blogs with no restrictions, modern design and the best experience.
Last Seen Tumblr Blogs


Fun Fact
Mobile US users spent an average of 115.8 minutes on Tumblr app monthly.
Text
"Untangling the winter 2023-24 precipitation forecast ball of yarn. #Meow" - NOAA Climate.gov
One of the best opening lines to any scientific article ever: "#ClimateScientists are basically cats. "
"This week's ENSO Blog features the work of two @NCAR_Science scientists as they untangle a messy knot of string that is El Niño and how much influence it had on this year's winter precipitation model prediction versus other potential climate drivers. Meow!" --- NOAA Climate.gov

#NOAA Climate.gov#El Nino affecting hurricanes#Tropical Pacific Trends#ENSO Blog#NOAA ENSO#El Nino Southern Oscillation
0 notes
Text

La Niña Is Here
After seven months of waiting, La Niña—the cooler sister of El Niño—finally showed up in the eastern Pacific Ocean in early December 2024. La Niña may not stick around long, though. According to NOAA, the Pacific may return to neutral conditions in spring 2025.
Part of the El Niño-Southern Oscillation (ENSO) cycle, La Niña appears when energized easterly trade winds intensify the upwelling of cooler water from the depths of the eastern tropical Pacific, causing a large-scale cooling of surface waters in the eastern and central Pacific Ocean near the equator. The stronger-than-usual trade winds also push the warm equatorial surface waters westward toward Asia and Australia. This dramatic cooling of the ocean’s surface layers affects the atmosphere by modifying the moisture content across the Pacific.
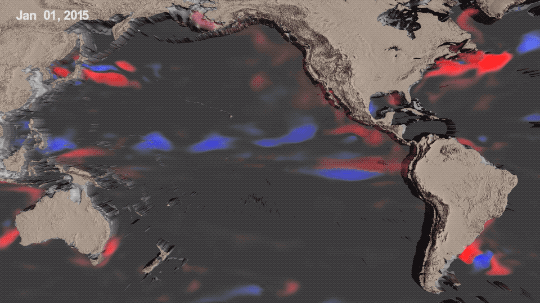
In a report published on January 9, 2025, the NOAA Climate Prediction Center confirmed that La Niña conditions were present. They measured sea surface temperatures 0.7 degrees Celsius (1.3 degrees Fahrenheit) below average in an area of the tropical Pacific, from 170° to 120° West longitude, known as the Niño 3.4 region.
The signature of La Niña is also visible in the central and eastern Pacific Ocean as areas of lower-than-average water levels. That’s because cooler water contracts, lowering sea levels. (Conversely, warmer water expands, raising them.) The map above depicts sea surface height anomalies across the central and eastern Pacific Ocean as observed on January 13, 2025. Shades of blue indicate sea levels that were lower than average, while shades of red indicate areas where the ocean stood higher than normal. Normal sea level conditions appear in white.
Data for the map were acquired by the Sentinel-6 Michael Freilich satellite and processed by scientists at NASA’s Jet Propulsion Laboratory (JPL). Note that signals related to seasonal cycles and long-term trends have been removed to highlight sea level anomalies associated with ENSO and other short-term natural phenomena.
“Although La Niña is here, it’s not a particularly strong one,” said Josh Willis, an oceanographer and Sentinel-6 Michael Freilich project scientist at JPL. Willis noted that during an especially strong La Niña in 2010-2011, temperatures in the tropical Pacific were about 1.6°C (2.9°F) below average in January 2011, compared to just 0.7°C (1.3°F) below average in January 2025. NOAA forecasts that this La Niña will remain weak and is unlikely to reach -1°C below average—the threshold at which La Niña is considered moderate in strength. Neutral conditions were expected to return in the meteorological spring, between March and May.
La Niña’s coupling with the atmosphere and ocean alters global atmospheric circulation and can cause shifts in the path of mid-latitude jet streams in ways that intensify rainfall in some regions and bring drought to others. In the western Pacific, rainfall can increase over Indonesia and Australia. Clouds and rainfall become more sporadic over the central and eastern Pacific Ocean, which can lead to dry conditions in Brazil, Argentina, and other parts of South America and wetter conditions over Central America. In North America, cooler and stormier conditions often set in across the Pacific Northwest, while weather typically becomes warmer and drier across the southern United States and northern Mexico.
ENSO adds a natural source of year-to-year variability in global temperatures. Because such a wide swath of the Pacific is cold, La Niña tends to keep a lid on the average global surface temperature. But even the cool water in the Pacific does not completely offset long-term warming trends; some of the hottest years on record have coincided with La Niña, such as in 2010 and 2020.
NASA Earth Observatory image by Lauren Dauphin, using modified Copernicus Sentinel data (2025) processed by the European Space Agency and further processed by Josh Willis, and Kevin Marlis/NASA/JPL-Caltech. Story by Emily Cassidy.
1 note
·
View note
Text
fun fact ! noaa runs a mailing list for enso (el niño southern oscillation) news
0 notes
Text
NOAA Confirms a Weak and 'Unusual' La Niña by Spring | Daily Reports Online
An “unusual” La Niña event has been confirmed, bringing cooler atmospheric and oceanic conditions in the tropical Pacific. Despite expectations for its arrival last year, the phenomenon has emerged later and is forecast to be weaker and shorter in duration. The event, part of the El Niño-Southern Oscillation (ENSO) cycle, is known for influencing global weather patterns. Effects such as wetter…
0 notes
Text
'Unusual' and weak La Niña finally here, NOAA confirms
Officials have announced that an “unusual” La Niña weather pattern (that was supposed to start last summer) is finally underway. However, it is expected to be weaker and shorter than usual. La Niña is the cold phase of a natural climate pattern called the El Niño Southern Oscillation (ENSO) cycle, which is a pattern of atmospheric and sea temperature changes in the tropical Pacific Ocean that…
0 notes
Text
'Variable' and weak La Niña ending, NOAA confirms
Officials have announced that a “different” La Niña weather pattern (expected to begin next summer) has begun. However, it is expected to be weaker and shorter than before. La Niña is the coldest part of a natural weather pattern known as the The Child The Southern Oscillation (ENSO), a pattern of changes in air and ocean temperatures in the tropical Pacific Ocean that affects the weather and…
0 notes
Text
Is Long Term Electricity Best in Toledo?
New Post has been published on https://www.ohenergyratings.com/blog/is-long-term-electricity-best-in-toledo/
Is Long Term Electricity Best in Toledo?
Can Toledo Save On Electricity?
Is now the best time to lock in long term Toledo electric rates? Find out how weather and natural gas storage amounts may add up to energy savings for you.
Our country has hit a five-year high for natural gas storage. Also, NOAA weather predictions suggest that temperatures may be above normal for a third of the country this winter. This could mean we may see cheap electricity rates in the spring. However, we have to keep in mind that we’re facing winter weather patterns that can include long cold snaps and heavy snowfall. So consumers may be wondering if now the right time to shop for long term electricity in Toledo.
Will Natural Gas Prices Rise?
The EIA reports that current natural gas storage is above the five year average. And with a third of the US maybe having warmer than normal for the next few months, natural gas used to fuel energy demand may be lower than normal. As a result, natural gas prices could stay low.
However, while forecasters predict a weak La Niña, there’s a chance it might not happen at all. ENSO-neutral winters tends to bring colder air to the north. This means a higher likelihood of snow along the Ohio River valley. While it may not be a bitter cold, snow cover means cold temperatures could last longer than normal.
We also have to keep the polar vortex in mind. Forecasts suggest it could stretch and cause a few chilly nights after the holidays. But, there is also a chance for much longer cold snaps to force homes to crank up the heat in the next months. As you can guess, this could mean more energy demand and the potential for higher prices and rates.
Long Term Or Short Term Electricity?
Short term fixed rate plans (6-12 months) are a great option if you plan to move in 2025. Especially if you shop plans from electric suppliers that don’t charge early termination fees. On top of that, if the natural gas supply stays high through to the spring, then cheap rates may follow into summer.
For example, the APG&E TrueSimple 6 plan charges 6.56 cents per kilowatt-hour (kWh). If you use 1000 kWh of electricity per month, this means a supply charge of about $65.60 per month. Compare this to the 8.25 cents per kWh that Toledo Edison charges. If you stuck with PTC rates, you would pay a supply charge of $82.50 per month for 1000 kWh of energy.
On the other hand, long term fixed rate plans (14 months or more) are a great option if you want more time with stable and predictable pricing. Locking in a great rate today means avoiding any price spikes that could come around if the natural gas in storage supply shrinks this winter.
For example; shopping around might lead you to the Energy Harbor Safe Harbor Value 14 plan. This plan charges 7.89 cents per kWh, which means paying $78.90 on supply charges per month. Not only is this about $4 cheaper than current Toledo Edison rates, but Energy Harbor offers some of the best customer service according to our readers.
Should Toledo Customers Shop Now?
Right now, signs point to a possibly warmer than average winter. If plenty of natural gas stays in storage it could lead to cheaper priced electricity. Sure, there’s a chance for a change in the weather. But right now, shopping for a cheaper Toledo electric rate could save you money for the holidays.
You can always start your shopping right here at https://www.ohenergyratings.com. You can also count on us for the news and tips that could affect your bills.
0 notes
Text
Scientists Unveil Breakthrough in Predicting El Niño Years in Advance

The latest research shows that scientists have developed the capacity to forecast the occurrence of the next El Niño two years and three months in advance. This is a great improvement on the prior methods of accurately predicting a given climate for the period of six to twelve months away due to utilization of thousands of years’ worth of climate data. El Niño-Southern Oscillation (ENSO) overview The ENSO cycle refers to the periodic warming (El Niño) and cooling (La Niña) of the sea surface in the eastern central and tropical Pacific Ocean. El Niño events bring warmer-than-average sea surface temperatures, while La Niña events bring cooler-than-average temperatures. These cycles influence global weather patterns, affecting everything from rainfall distribution to temperatures worldwide. ENSO is one of the demographic and climate change-robust cycles that affect the climate of various regions by controlling hurricanes, precipitation, and temperatures. Jon Sullivan, Public domain, via Wikimedia Commons Advances in Prediction Models Conventionally, NOAA has forecasted ENSO events through different climate models; however, these could only give predictions of up to six to twelve months ahead. Published in the Geophysical Research Letters on June 16 the new study shows that the ENSO events can be forecasted with a decent degree of accuracy more than two years in advance, especially after the strong El Niño events. Research Methodology Nathan Lenssen, a climatologist of the Colorado School of Mines, and a project scientist of the National Center for Atmospheric Research motivated the research team that employed ten accurate models. These models incorporated information that ranged from hundreds to thousands of years, in areas such as sea level, air temperature and rainfall to calculate the climatic condition and the ENSO events. To verify the reliability of the created models, the team decided to input a particular historical period, for instance, January of the year 2000, and try to predict the climate for three years ahead. They then compared the model predictions with actual records of the instances from 1901 to 2009. It was found out that ENSO can be best predicted after a strong El Niño year like in the year 1997 and particularly in the year 2016. Implications for Emergency Planning and Resource Management Speaking on the usefulness of the ENSO predictions, Emily Becker, a climate scientist at the University of Miami, was of the view regarding the specific utility of long lead ENSO forecasts in planning for emergencies and a variety of other related applications. Longer lead times give governments and organizations the window they need to work and plan for draughts, floods and other activities of climate. For instance, if the climatic conditions can be predicted to be dry, it is possible for the state governments to formulate and put into practice the conserved or stored water policies before the conditions actually materialize. Future of Long-Term ENSO Forecasts Those longer term climate forecasts that have not been rolled out by centers involved in climate forecast have been forecasted by Lenssen and his team into discussions with intergovernmental organizations to identify whether it is possible to make such climate forecasts and if so when. The appraisal and broad foundation of this study make it an improved hub for subsequent advancements in the climate forecaster that might revolutionize societies’ readiness for the major climate occurrences. That scientists are already able to forecast El Niño more than two years in advance is considered a major achievement in climatology. This development does not only significantly expand the knowledge of ENSO but also has practical outcomes to lessen the consequences of climatic anomalies. While discussions on utilizing long-term ENSO forecasts are still ongoing, the positive impacts, especially on the enhancement of global climate preparedness and readiness, are astronomical. Read the full article
0 notes
Text
2024 Texas Hurricane Season Predictions
2024 Texas Hurricane Season Predictions
Predictions Show a Very Active Hurricane Season
Texans well know about the damaging high winds and flash flooding from tropical storms. This year's TX hurricane predictions show a very active season. Learn why this season could be one of the toughest.
Apart from hot summers, one thing Texans know all too well about is hurricane season. Flooded streets, damaged roofs, and your Texas electricity is out. Towns hit hard in the past like Rockport, Port Arthur, Houston and others shudder when skies darken over the Gulf of Mexico. This season's hurricane predictions look like it could be another tough one.
Officially, the Atlantic hurricane season begins on June 1 and runs through the end of November. But due to the potential for global economic disruptions from these powerful storm systems, everyone wants to know how to prepare well in advance.
AccuWeather's March 27 forecast warns of an "explosive season" where forecasters may even run out of names.
Tropical Storm Risk (TSR), which makes forecasts in December, released their updated prediction on April 8.
Colorado State University researchers released their annual hurricane forecast on April 8, also.
NOAA's Climate Prediction Center (CPC) usually releases forecasts in late May.
Given this past year's record warm temperatures and a La Niña expected to emerge in the Pacific Ocean, these weather services now expect "a very active" hurricane season ahead.
Are Hurricane Predictions Accurate?
Bear in mind that storm predictions are based on the probability for the environment to spin up tropical storms. So, predicted storm numbers are not iron-clad. But while some year's predict too many; in the past 30 years, we're seeing predictions fall short. For example, the 2023 hurricane season forecast only 13 tropical storms. But due exceptional warm sea surface temperatures, there were 20 and it became the fourth most active season on record. Dire-sounding, true but of the 20 tropical storms that formed, only three made landfall in North America. Several stayed at sea and disipated as they wandered north.
However, there have been more extremely active hurricane seasons since 1995 than there has been since 1900. And two of the most active seasons occurred in 2005 with 28 storms and 2020 with 30 -- eleven of which made landfall in the US causing $37 billion in damage.
With all that in mind, the 23 tropical storms predicted this year is twice as many tropical storms that occur during a statistically "normal" season. And this makes the consensus for the potential number of storms compelling. As we'll see, conditions going into the 2024 season have more in common with 2020 than last year.
Why So Many Storms?
Tropical storm systems need three things to spin up:
LOTS of calm, warm water. Sea surface temperatures (SSTs) at least 80°F (26.5°C) to a depth of about 150 feet.
Dry, thirsty air. When a firm, dry trade wind blows across warm sea water (at about 11 mph), it has an easy time evaporating that water and taking on its heat. As this warm, humid air begins to move upwards and organize, it can quickly develop into a moist and unstable atmosphere that supports sustained shower and thunderstorm activity.
A nice, calm upper atmosphere. Tropical storms like winds that move horizontally and spiral up in nice, stacked layers (stack of pancakes). Vertical winds that cut or shear across that horizontal structure can tear it apart. Wind shearing happens everywhere but as long as it's about 23 mph from the ocean surface all the way up to around 60,000 feet, the tropical storm will be fine.
The ENSO (El Niño/Southern Oscillation) also plays a role. To be clear, El Niño, ENSO Neutral, and La Niña don’t prevent or cause hurricanes. Rather, it is an ocean-atmosphere system at the equator in the Pacific Ocean that can shift atmosphere's circulation (called the "Walker Circulation"). El Niños usually produce wind shears in the Atlantic that blow apart tropical storms or shift them to the middle of Atlantic (as we saw in 2023). ENSO Neutral and La Niñas, however, shift those wind-shear patterns far to the east, leaving a nice, calm upper atmosphere over the Atlantic where tropical storms develop.
Current Conditions
This past February saw record global temperatures, especially in the Atlantic Ocean. Currently, sea surface temperatures remain warm. In fact, there's a band of 80°F (26.5°C) water stretching all way from west Africa to the west coast of Cuba. All three hurricane predictions cite warmer than normal SSTs as a reason for more storms. And given NOAA's temperature predictions for the summer, it looks like much of the US Atlantic coast will stay like bathwater. That may sound like good news for beach goers (and sharks) but it's also perfect for building tropical storms.
There is a lot of dry air coming off the African west coast. Actually, too much right now. The Saharan Air Layer (SAL) lies about 5,000 and 20,000 feet up in the sky that transports plumes of dry, dust-laden air from west Africa to as far west as Texas. It usually forms in the late spring/early summer when hot dry winds blow across the Sahara desert and move over the Atlantic Ocean. As result the SAL can impede tropical storm formation:
Big dust plumes can warm the atmosphere but block sunlight from warming the ocean surface below. That reduces evaporation.
The dry air can create down drafts or sinking air. These can interfere with moist air rising and organizing into low pressure systems.
SAL winds are strong enough to carry dust. So, their winds can also produce vertical wind shears that blow out storm formation.
Although the SAL begins in the spring it don't blow all summer long. All the same, in both 2022 and 2023, the SAL helped keep a lid on storm formation for about 2 months. The pattern peaks in June and fades in early August. Each plume usually last 3 to 5 days. But once the SAL pattern ends, a warm ocean can spin up a storm in only a few days, if not hours.
All three hurricane predictions also cite the weakening El Niño. This shows that sea surface temperatures in the middle of the Pacific Ocean at the equator are getting cooler. NOAA predicts that they expect ENSO Neutral conditions between April and June. Already, cooler water temperatures as deep as 200 feet are being detected in the eastern Pacific. So change is coming.
While ENSO Neutral means there's no giant mass of warm or cold water in the Pacific affecting the atmosphere, it allows other atmospheric conditions to exert a bigger influence on hurricane seasons. From 2016 through 2020, summer time ENSO Neutral conditions produced some of the most active hurricane seasons on record. In fact, some of the biggest and deadliest storms to hit the US occurred during ENSO Neutral conditions: Hurricane Harvey (2017), Hurricanes Katrina and Rita (2005), and Tropical Storm Alison (2001).
NOAA predicts 70% to 80% chance for La Niña will emerge in August. Again, all three hurricane predictions suggest a La Niña can produce conditions that spawn the most tropical storms will most likely align. And in many ways, this suggests similarities to the 2020 season.
Hurricane season 2020 also began with above average sea surface temperatures in the Atlantic. Trade winds were weak across most of the Atlantic. ENSO Neutral was firmly in place and would slowly turn into La Niña by autumn; so there was little wind shear. Some tropical storms first formed at a liesurely pace from mid-May to June. But in mid-July, storm systems began forming in bursts. The most occured in September. At one point there were five named storms spinning in the Atlantic. All told, 2020 saw 30 tropical storms. Eleven struck the US; six of them were hurricanes.
So August and September could be dangerously busy.

Learn what's driving hurricane predictions this summer and what you need to know to stay safe.
Predictions for a Hurricane Hitting the US in 2024
Because hurricanes are creatures of heat, water, and wind they are reliably unpredictable. Once they spin up we can only guess where they probably will go. After all, these storm systems form in an area that stretches from the west coast of Africa all the way to the western shore of the Gulf of Mexico. That said, given the number and potential strength of the storms forecast and the things that sustain their formation, it's logical to anticipate a few coming ashore. But, predicting just how many with any accuracy is a dicey gamble.
While weather services do their best to tease details out of the hundred or so years of record keeping, most won't forecast the number and locations of landfalls.
NOAA predictions usually don't predict landfalls.
CSU also does not predict the number of landfalls but estimates probability. For example, this year, they estimate a 62% chance for a storm making landfall somewhere along the the entire (Atlantic) US coastline.
Accuweather forecast that the US will see 4-6 direct impacts.
TSR says 4.6 tropical storms or hurricanes will come ashore.
One other important thing to remember here is that electricity prices in Texas could surge if tropical storms shut down off-shore natural gas production in the Gulf of Mexico. Some natural gas platforms are located more than 100 miles from shore.
Tropical Storms - What Are the Biggest Dangers?
Tropical storms and hurricanes can unlease three dangerous events: storm surges, high winds, and flooding.
Coastal residents face the greatest danger from storm surges. Because of increasingly higher tides, storm surges are now more likely to cause flooding in any coastal city, including those in major bays and estuaries. Texas and other Gulf coast states have seen past storm surges as high a 10 to 24 feet deep that move inland for miles. So residents living on the coast will face a good chance of needing to evacuate at some point this summer.
Because water and heat fuel these storms, they lose power once they move inland. That doesn't mean they're any less dangerous. For those who live further inland, high winds, tornados, and flooding are all potential dangers. Weakened cyclones can turn into slow moving storm systems that dump enormous amounts of rain as they go. This makes flash flooding more likely and extremely dangerous in areas like central and west Texas.
How You Can Prepare for the 2024 Texas Hurricane Season
Texas Electricity Ratings is a Houston company. We've all been through the high winds, rain, and electricity outages from some very tough hurricanes. These powerful storms can affect any part of Texas so we want everyone to stay safe. Find out now what you can do to keep your family safe when the power goes out well before the first big storm comes.
Make a plan so your family knows for what to do when a dangerous storm comes your way.
Make a Hurricane Emergency Checklist to help you keep track of how to prepare and what supplies you'll need if you choose to shelter in place.
Build your hurricane disaster kit. Make sure every person and pet in your home has everything they need to get through a disaster.
Gather essential stuff for your Grab-N-Go bag. Each person (and pet) should have their own in case you need to leave your home and evacuate to stay safe.
Review and understand Texas evacuation routes ahead of time. Make arrangements well ahead of time where you’ll go to in the event of an evacuation order.
0 notes
Text
am i ever glad that i decided to try indoor stratification this year. the boy is NOT letting us have a properly cold winter, and much of the established plant life in the region could be damaged. i really hope noaa/nws is right about going to enso-neutral conditions this spring...
1 note
·
View note
Text
0 notes
Text
Rare 'triple-dip' La Niña is over
In February and early March the sea surface temperature in eastern parts of the Pacific Ocean have been rising and now Australia’s Bureau of Meteorology (BOM) and the National Oceanographic Atmospheric Administration (NOAA) in the US have declared ENSO has being “neutral”, so neither La Niña or El Niño. #Rare #tripledip #Niña
View On WordPress
0 notes
Text
Why Isn’t Every Year the Warmest Year on Record?
This just in: 2022 effectively tied for the fifth warmest year since 1880, when our record starts. Here at NASA, we work with our partners at NOAA to track temperatures across Earth’s entire surface, to keep a global record of how our planet is changing.
Overall, Earth is getting hotter.
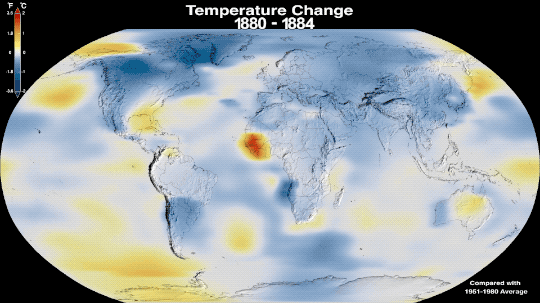
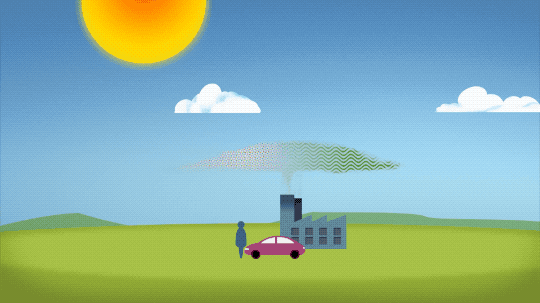
The warming comes directly from human activities – specifically, the release of greenhouse gases like carbon dioxide from burning fossil fuels. We started burning fossil fuels in earnest during the Industrial Revolution. Activities like driving cars and operating factories continue to release greenhouse gases into our atmosphere, where they trap heat in the atmosphere.
So…if we’re causing Earth to warm, why isn’t every year the hottest year on record?
As 2022 shows, the current global warming isn’t uniform. Every single year isn’t necessarily warmer than every previous year, but it is generally warmer than most of the preceding years. There’s a warming trend.
Earth is a really complex system, with various climate patterns, solar activity, and events like volcanic eruptions that can tip things slightly warmer or cooler.
Climate Patterns
While 2021 and 2022 continued a global trend of warming, they were both a little cooler than 2020, largely because of a natural phenomenon known as La Niña.
La Niña is one third of a climate phenomenon called El Niño Southern Oscillation, also known as ENSO, which can have significant effects around the globe. During La Niña years, ocean temperatures in the central and eastern Pacific Ocean cool off slightly. La Niña’s twin, El Niño brings warmer temperatures to the central and eastern Pacific. Neutral years bring ocean temperatures in the region closer to the average.
El Niño and La Niña affect more than ocean temperatures – they can bring changes to rainfall patterns, hurricane frequency, and global average temperature.
We’ve been in a La Niña mode the last three, which has slightly cooled global temperatures. That’s one big reason 2021 and 2022 were cooler than 2020 – which was an El Niño year.
Overall warming is still happening. Current El Niño years are warmer than previous El Niño years, and the same goes for La Niña years. In fact, enough overall warming has occurred that most current La Niña years are warmer than most previous El Niño years. This year was the warmest La Niña year on record.

Solar Activity
Our Sun cycles through periods of more and less activity, on a schedule of about every 11 years. Here on Earth, we might receive slightly less energy — heat — from the Sun during quieter periods and slightly more during active periods.
At NASA, we work with NOAA to track the solar cycle. We kicked off a new one – Solar Cycle 25 – after solar minimum in December 2019. Since then, solar activity has been slightly ramping up.
Because we closely track solar activity, we know that over the past several decades, solar activity hasn't been on the rise, while greenhouse gases have. More importantly, the "fingerprints" we see on the climate, including temperature changes in the upper atmosphere, don't fit the what we'd expect from solar-caused warming. Rather they look like what we expect from increased greenhouse warming, verifying a prediction made decades ago by NASA.
Volcanic Eruptions
Throughout history, volcanoes have driven major shifts in Earth’s climate. Large eruptions can release water vapor — a greenhouse gas like carbon dioxide — which traps additional warmth within our atmosphere.
On the flip side, eruptions that loft lots of ash and soot into the atmosphere can temporarily cool the climate slightly, by reflecting some sunlight back into space.
Like solar activity, we can monitor volcanic eruptions and tease out their effect on variations in our global temperature.
At the End of the Day, It’s Us
Our satellites, airborne missions, and measurements from the ground give us a comprehensive picture of what’s happening on Earth every day. We also have computer models that can skillfully recreate Earth’s climate.
By combining the two, we can see what would happen to global temperature if all the changes were caused by natural forces, like volcanic eruptions or ENSO. By looking at the fingerprints each of these climate drivers leave in our models, it’s perfectly clear: The current global warming we’re experiencing is caused by humans.
For more information about climate change, visit climate.nasa.gov.
Make sure to follow us on Tumblr for your regular dose of space!
3K notes
·
View notes
Video
youtube
Seasonal Climate Forecast and Verification updated
The TL:DNR version: [Too long: did not read]
NOAA is predicting El Nino this summer, but Climate Prediction Center disagrees and thinks we will stay in ENSO-neutral conditions through the spring and summer.
May: Below-average temps especially SE Oregon, near or slightly above average precip (except Hood River Basin).
June: Near-average temps, near to below average precipitation statewide
July: Near to slightly above average temperatures, but below average precipitation statewide (20% - 50% of average statewide, except for the Oregon coast).
1 note
·
View note
Text
https://www.wrightonthemarket.com/post/cause-and-effect-of-el-ni%C3%B1o-and-la-ni%C3%B1a-episodes
Cause and Effect of El Niño and La Niña Episodes
ENSO Explanation
written May 2020
The US Government’s National Atmospheric and Oceanic Administration (NOAA) issues El Nino/Southern Oscillation (ENSO) report the second Thursday of every month. ENSO is a recurring climate pattern involving changes in the temperature of equatorial waters in the central and eastern Pacific Ocean. This oscillating warming and cooling pattern, referred to as the ENSO cycle, directly affects rainfall distribution around the world. El Niño and La Niña are the extreme phases of the ENSO cycle; between these two phases is a third phase called ENSO-neutral.
ENSO affects Australian weather more so than any other crop area of the world and the Aussie government devotes much of its resources to track and report ENSO information twice a month.
I track ENSO reports. The following is the monthly summary from NOAA from August 2018 and my corresponding analysis of the same set of facts. I have found NOAA monthly reports are the most reliable 30 to 60 day forecast tool for world weather.
Predicting weather with accuracy is the key to predicting grain prices.
For more than 500 years, the world knew when millions of dead anchovies washed-up on the beaches of Ecuador and Peru, the world's weather was about to change, but no one knew why. The search for the "Holy Grail" of weather forecasting was to figure out why those anchovies died.
Fifty or so years ago, we learned the anchovies died due to a rapid change of the temperature of the Pacific water west of Peru. Research efforts then focused on what caused the water temperature to change and, more importantly, how to predict weather as a result of the temperature change.
The science of monitoring and evaluation of the wind direction and the temperature of the wind and surface water of the Equatorial Pacific and Indian Oceans is called EL NIÑO/SOUTHERN OSCILLATION (ENSO).
0 notes
Link
The latest ENSO outlook from NOAA’s Climate Prediction Center was released this week. They are now predicting that the current lengthy La Niña is likely to end by early spring and move through a neutral period in late spring and early summer before transitioning to El Niño later in summer
0 notes