#Japan ASTER Science Team
Explore tagged Tumblr posts
Visit Tumblr Blog
Explore Tumblr blogs with no restrictions, modern design and the best experience.
Last Seen Tumblr Blogs


Fun Fact
US Tumblr user growth rate is estimated to slow down to 4.1%.
Text
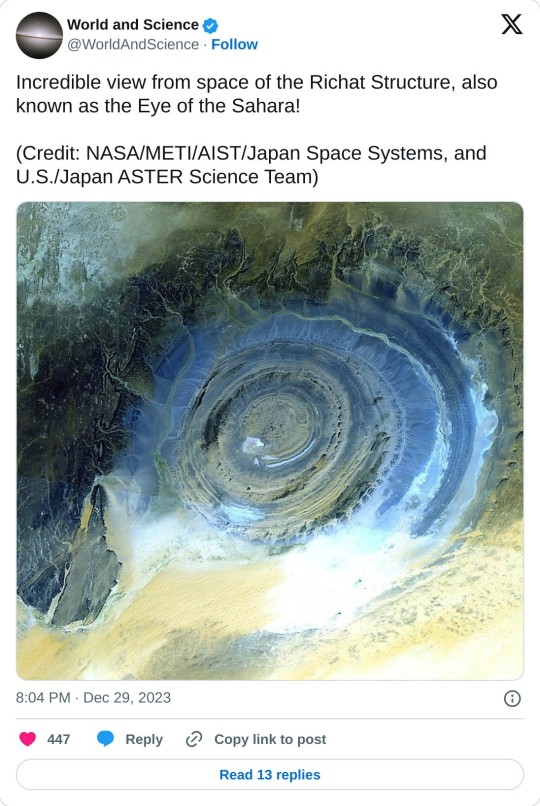
#Eye of the Sahara!#NASA#METI#AIST#Japan Space Systems#U.S#Japan ASTER Science Team#Richat Structure
3 notes
·
View notes
Text
Summary of the Fifty-Second U.S.Japan ASTER Science Team Meeting
Michael Abrams, NASA/Jet Propulsion Laboratory/California Institute of Technology, [email protected] Yasushi Yamaguchi, Nagoya University/Japan Science and Technology Agency, [email protected] Introduction The Advanced Spaceborne Thermal Emission and Reflection Radiometer (ASTER) Science Team (ST) organized a three-day workshop that took place September 11–13, 2023, at the offices of Japan Space Systems (JSS) in Tokyo. Over 40 people from […] from NASA https://ift.tt/o8lR3YW
0 notes
Text
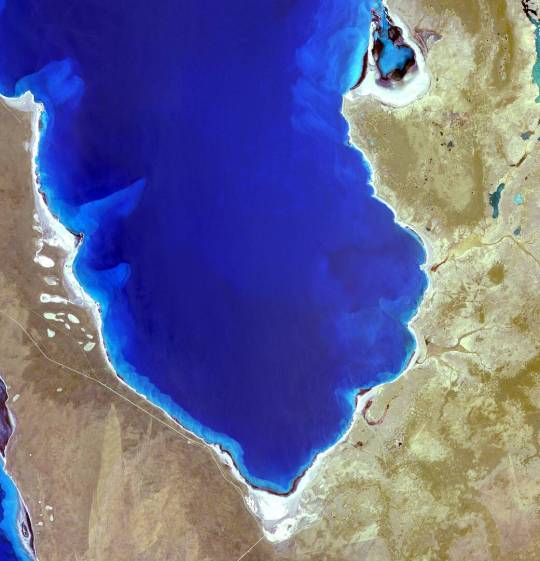
Terra Observes Shark Bay, Australia: Hamelin Pool Marine Nature Reserve image acquired December 30, 2010. Hamelin Pool Marine Nature Reserve, seen here in an image from the Advanced Spaceborne Thermal Emission and Reflection Radiometer (ASTER) on the Terra spacecraft on Dec. 30, 2010, is a special site. Located in the Shark Bay World Heritage Site in Western Australia, it is one of the very few places in the world where we can find living stromatolites—the first living examples of structures built by cyanobacteria. Photosynthetic cyanobacteria are thought to have changed the course of life’s evolution on Earth by playing an important role in the oxygenation of Earth’s atmosphere roughly 2.3 billion years ago. Also, NASA and other federal agencies monitor levels of cyanobacteria, as toxic levels of the blue-green algae can have negative effects on health.
ASTER is one of five Earth-observing instruments launched Dec. 18, 1999, on Terra. With its 14 spectral bands from the visible to the thermal infrared wavelength region and its high spatial resolution of 15 to 90 meters (about 50 to 300 feet), ASTER images Earth to map and monitor the changing surface of our planet. The instrument was built by Japan's Ministry of Economy, Trade and Industry. A joint U.S./Japan science team handles validation and calibration of the instrument and data products. Image Credit: NASA/GSFC/METI/ERSDAC/JAROS, and U.S./Japan ASTER Science Team :: [Robert Scott Horton]
* * * *
“Humanity is deeply asleep and is walking towards the edge of a precipice that it does not see.
But an individual can realise that he is on the edge of a precipice; and if he opens his eyes to it, he would see that there is a rope above his head, and he can climb: but to reach this rope he has to jump.
When we are at the level where we imagine we can be helped as we are, no help can reach us. For something better to exist, it is necessary to change ourselves. Personal satisfaction, vanity, ignorance, these and all other things, prevent the help from reaching us.
Originally, prayer was a request for help to rise to a higher level of consciousness.”
~ Maurice Nicoll [Ian Sanders]
[via 'alive on all channels']
#from above#NASA#Robert Scott Horton#Shark Bay Australia#Alive on all Channels#Maurice Nicoll#Ian Sanders#quotes#higher consciousness
6 notes
·
View notes
Text
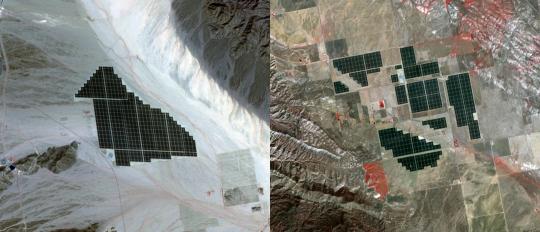
California Solar Farms
On February 15, 2015 the Desert Sunlight solar project in California’s Mojave Desert became operational. The 550-megawatt plant generates enough electricity to power 160,000 average homes. Covering an area of 16 km2, the 8.8 million cadmium telluride photovoltaic modules take advantage of the more than 300 days of sunshine. Desert Sunlight joins the similar-sized Topaz Solar Farm in San Luis Obispo County, CA, that became operational in June, 2014. The Desert Sunlight image (left) was acquired March 12, 2015 and is located at 33.8 degrees north, 115.4 degrees west; the Topaz image (right) was acquired September 11, 2014 and is located at 35.4 degrees north, 120.1 degrees west. Each image covers an area of 10.5 x 12 km.
Please give credit for these images to: NASA/METI/AIST/Japan Space Systems, and U.S./Japan ASTER Science Team
http://asterweb.jpl.nasa.gov/gallery/images/split/desert-march12-2015_topaz-11sept2014.jpg California Solar Farms - ASTER Image Gallery
0 notes
Video
Terra's view of Teshekpuk Lake, Alaska by NASA on The Commons Via Flickr: Teshekpuk Lake is on Alaska North Slope, within the National Petroleum Reserve. Up to 90,000 geese nest in this area in the summertime, and up to 46,000 caribou use the area for both calving and migration. The Advanced Spaceborne Thermal Emission and Reflection Radiometer (ASTER) on NASA’s Terra satellite took this picture on August 15, 2000. In this image, green indicates vegetation and blue indicates water. Some bodies of water also appear in off-white or yellowish, probably due to different amounts of sediment in the water and/or the sun angle. The Beaufort Sea is at the top of the scene, while Teshekpuk Lake is at lower left. The land here is a lacy, lake-dotted expanse of tundra. The large image covers an area of 58.7 by 89.9 kilometers, and is centered near 70.4 degrees North latitude, 153 degrees West longitude. NASA Media Usage Guidelines Credit: NASA/GSFC/METI/ERSDAC/JAROS, and U.S./Japan ASTER Science Team Image Number: PIA01909 Date Acquired: August 15, 2000
0 notes
Link
Sediment from Canada’s Mackenzie River empties into the Beaufort Sea in milky swirls in this 2017 satellite image. Scientists are studying how river discharge drives carbon dioxide emissions in this part of the Arctic Ocean.NASA Earth Observatory image by Jesse Allen using Landsat data from USGS Runoff from one of North America’s largest rivers is driving intense carbon dioxide emissions in the Arctic Ocean. When it comes to influencing climate change, the world’s smallest ocean punches above its weight. It’s been estimated that the cold waters of the Arctic absorb as much as 180 million metric tons of carbon per year – more than three times what New York City emits annually – making it one of Earth’s critical carbon sinks. But recent findings show that thawing permafrost and carbon-rich runoff from Canada’s Mackenzie River trigger part of the Arctic Ocean to release more carbon dioxide (CO2) than it absorbs. The study, published earlier this year, explores how scientists are using state-of-the-art computer modeling to study rivers such as the Mackenzie, which flows into a region of the Arctic Ocean called the Beaufort Sea. Like many parts of the Arctic, the Mackenzie River and its delta have faced significantly warmer temperatures in recent years across all seasons, leading to more melting and thawing of waterways and landscapes. In this marshy corner of Canada’s Northwest Territories, the continent’s second largest river system ends a thousand-mile journey that begins near Alberta. Along the way, the river acts as a conveyor belt for mineral nutrients as well as organic and inorganic matter. That material drains into the Beaufort Sea as a soup of dissolved carbon and sediment. Some of the carbon is eventually released, or outgassed, into the atmosphere by natural processes. Scientists have thought of the southeastern Beaufort Sea as a weak-to-moderate CO2 sink, meaning it absorbs more of the greenhouse gas than it releases. But there has been great uncertainty due to a lack of data from the remote region. To fill that void, the study team adapted a global ocean biogeochemical model called ECCO-Darwin, which was developed at NASA’s Jet Propulsion Laboratory in Southern California and the Massachusetts Institute of Technology in Cambridge. The model assimilates nearly all available ocean observations collected for more than two decades by sea- and satellite-based instruments (sea level observations from the Jason-series altimeters, for example, and ocean-bottom pressure from the GRACE and GRACE Follow-On missions). Like a conveyer belt of carbon, the Mackenzie River, seen here in 2007 from NASA’s Terra satellite, drains an area of almost 700,000 square miles (1.8 million square kilometers) on its journey north to the Arctic Ocean. Some of the carbon originates from thawing permafrost and peatlands.NASA/GSFC/METI/ERSDAC/JAROS, and U.S./Japan ASTER Science Team The scientists used the model to simulate the discharge of fresh water and the elements and compounds it carries – including carbon, nitrogen, and silica – across nearly 20 years (from 2000 to 2019). The researchers, from France, the U.S., and Canada, found that the river discharge was triggering such intense outgassing in the southeastern Beaufort Sea that it tipped the carbon balance, leading to a net CO2 release of 0.13 million metric tons per year – roughly equivalent to the annual emissions from 28,000 gasoline-powered cars. The release of CO2 into the atmosphere varied between seasons, being more pronounced in warmer months, when river discharge was high and there was less sea ice to cover and trap the gas. Ground Zero for Climate Change Scientists have for decades studied how carbon cycles between the open ocean and atmosphere, a process called air-sea CO2 flux. However, the observational record is sparse along the coastal fringes of the Arctic, where the terrain, sea ice, and long polar nights can make long-term monitoring and experiments challenging. “With our model, we are trying to explore the real contribution of the coastal peripheries and rivers to the Arctic carbon cycle,” said lead author Clément Bertin, a scientist at Littoral Environnement et Sociétés in France. Such insights are critical because about half of the area of the Arctic Ocean is composed of coastal waters, where land meets sea in a complex embrace. And while the study focused on a particular corner of the Arctic Ocean, it can help tell a larger story of environmental change unfolding in the region. Since the 1970s, the Arctic has warmed at least three times faster than anywhere else on Earth, transforming its waters and ecosystems, the scientists said. Some of these changes promote more CO2 outgassing in the region, while others lead to more CO2 being absorbed. For example, with Arctic lands thawing and more snow and ice melting, rivers are flowing more briskly and flushing more organic matter from permafrost and peatlands into the ocean. On the other hand, microscopic phytoplankton floating near the ocean surface are increasingly taking advantage of shrinking sea ice to bloom in the newfound open water and sunlight. These plantlike marine organisms capture and draw down atmospheric CO2during photosynthesis. The ECCO-Darwin model is being used to study these blooms and the ties between ice and life in the Arctic. Scientists are tracking these large and seemingly small changes in the Arctic and beyond because our ocean waters remain a critical buffer against a changing climate, sequestering as much as 48% of the carbon produced by burning fossil fuels. News Media Contacts Andrew Wang / Jane J. LeeJet Propulsion Laboratory, Pasadena, Calif.626-379-6874 / [email protected] / [email protected] Written by Sally Younger 2023-185 Share Details Last Updated Dec 21, 2023 Related TermsClimate ChangeCarbon CycleEarthGreenhouse GasesJet Propulsion LaboratoryOceans Explore More 5 min read NASA’s Tech Demo Streams First Video From Deep Space via Laser Article 3 days ago 4 min read Armstrong Flight Research Center: A Year in Review Article 7 days ago 6 min read NASA’s NEOWISE Celebrates 10 Years, Plans End of Mission Article 1 week ago
0 notes