#How to Use Ichimoku for Profit
Explore tagged Tumblr posts
Visit Tumblr Blog
Explore Tumblr blogs with no restrictions, modern design and the best experience.
Last Seen Tumblr Blogs


Fun Fact
Tumblr Inc. has $15.1M in annual revenue.
Video
youtube
Ichimoku Scalping Demystified Your Path to Profitability! 2023 Live
#Ichimoku Trading#Ichimoku Strategy Explained#Ichimoku Indicator Tutorial#Best Ichimoku Scalping Techniques#How to Use Ichimoku for Profit#Ichimoku Kinko Hyo Explained#Ichimoku Live Analysis 2023#Mastering Ichimoku for Beginners#Ichimoku Trading Tips#Scalping with Ichimoku Strategies
0 notes
Text
AlphaSharks – Six Setups Using Ichimoku Kinko Hyo The AlphaSharks course, Six Setups Using Ichimoku Kinko Hyo, is designed to teach traders how to leverage the Ichimoku cloud system to identify profitable trade setups. This course covers six specific strategies for trading stocks, options, and other financial instruments using the Ichimoku Kinko Hyo method, focusing on its powerful trend-following capabilities and unique visualization of market momentum. Key Concepts Covered Introduction to Ichimoku Kinko Hyo The course begins with a comprehensive explanation of the Ichimoku system, including the five key components: Tenkan-sen, Kijun-sen, Senkou Span A, Senkou Span B, and the Chikou Span. Six Trade Setups Detailed exploration of six high-probability trade setups that traders can implement using the Ichimoku Kinko Hyo indicator to maximize profits in trending markets. Cloud Analysis In-depth analysis of the Ichimoku cloud (Kumo) and its role in predicting support and resistance levels, as well as its use in determining market sentiment (bullish vs. bearish). Course Structure 1. Tenkan-Kijun Crossover Strategy Teaches how to use the crossover between the Tenkan-sen (conversion line) and Kijun-sen (base line) to identify bullish or bearish momentum and enter trades. 2. Kumo Breakout Setup Focuses on trading breakouts when price breaks above or below the Kumo (cloud), signaling strong trend reversals or continuations. 3. Chikou Span Confirmation Setup Demonstrates how the Chikou Span (lagging line) can be used to confirm trade entries based on historical price data. 4. Cloud Support and Resistance Strategy Uses the upper and lower boundaries of the cloud to establish potential support and resistance levels for placing entries, exits, and stop-loss orders. 5. Kijun Bounce Setup This strategy teaches traders to identify when price action bounces off the Kijun-sen, providing opportunities to trade trend continuations. 6. Senkou Span A & B Crossover Instructs on using the crossover of Senkou Span A and B to gauge long-term market trends and position trades accordingly. Benefits of the Course Improved Market Timing The Ichimoku system helps traders time entries and exits more precisely by visualizing market trends, support, and resistance levels. Multiple Trade Setups Offering six distinct strategies ensures that traders can adapt to various market conditions, from trending to ranging markets. Comprehensive Cloud Analysis The course helps traders master the art of cloud interpretation, enhancing their ability to gauge future price movements and spot high-probability setups. Who Is This Course For? Technical Traders Ideal for traders who rely on technical analysis to make informed trading decisions and are interested in incorporating a more advanced tool like Ichimoku Kinko Hyo. Trend-Following Traders This course is highly suitable for traders looking to improve their trend-following strategies and capitalize on both strong upward and downward price movements. Intermediate to Advanced Traders While beginners may find value in this course, it is best suited for those with prior experience in technical analysis and chart reading. Conclusion The AlphaSharks – Six Setups Using Ichimoku Kinko Hyo course is an essential guide for traders aiming to master the powerful Ichimoku cloud system. With six distinct setups, traders will gain a strong understanding of how to apply this indicator to various market conditions, enhancing both their trend-following capabilities and overall trading performance.
0 notes
Text
15 Lesser-Known Trading Strategies: Discovering Hidden Gems

In the dynamic world of trading, success often hinges on mastering well-known strategies like trend following or breakout trading. However, beyond these mainstream tactics lie lesser-known trading strategies that can offer unique insights and opportunities for astute traders. These strategies, often overlooked or underutilized, provide alternative approaches to navigating the complexities of financial markets. In this exploration, we delve into several of these hidden gems, shedding light on their principles, applications, and potential benefits for traders seeking to diversify their trading toolkit.
Exploring Lesser-Known Trading Strategies:
Halloween Effect: Dive into the seasonal trading pattern known as the “Halloween Effect” or “Sell in May and Go Away,” which suggests that stock markets tend to underperform from May to October. This phenomenon intrigues investors as they seek to understand its historical relevance and potential implications for modern trading strategies. Learn more about the Halloween Effect here.
Forex Signals: For traders navigating the forex market, deciphering and interpreting forex signals is crucial for making informed decisions. These signals, often derived from technical indicators or fundamental analysis, provide insights into potential market movements. Understanding how to interpret and utilize forex signals can significantly enhance trading precision and strategy development. Explore more about forex signals here.
Spot Trading: Spot trading is a fundamental aspect of trading cryptocurrencies and commodities. It involves buying or selling assets for immediate delivery or settlement, as opposed to futures or options contracts. Beginners often find spot trading attractive due to its simplicity and direct exposure to market prices. Discover the basics of spot trading and how it fits into your trading strategy here.
Crypto Trading: Paper trading in cryptocurrency markets allows traders to practice without risking real money. This simulation helps traders refine their strategies, test new ideas, and gain confidence before executing trades with actual funds. It’s an essential tool for both newcomers and experienced traders looking to adapt to the unique dynamics of the crypto market. Learn more about the benefits and strategies of paper trading in crypto here.
Crypto Signals: Deciphering crypto trading signals involves interpreting data points and indicators to forecast market movements. These signals can come from technical analysis tools, algorithmic models, or fundamental analysis of market trends. Understanding how to evaluate and use crypto trading signals empowers traders to make timely and profitable decisions in volatile cryptocurrency markets. Explore strategies for interpreting crypto signals here.
Three White Soldiers: The three white soldiers pattern is a bullish candlestick formation indicating a strong reversal from a downtrend to an uptrend. Recognizing and understanding this pattern can help traders identify potential buying opportunities in the market. Explore how to spot and utilize the three white soldiers pattern in your trading strategy here.
Ichimoku Cloud Strategy: The Ichimoku cloud strategy is a comprehensive technical analysis tool that provides insights into support and resistance levels, momentum, and trend direction. Traders use the Ichimoku cloud to gauge the strength of market trends and make informed trading decisions. Mastering this strategy involves understanding its components and interpreting its signals effectively. Dive deeper into the Ichimoku cloud strategy here.
Mean Reversion Strategy: Mean reversion is a trading strategy based on the concept that prices tend to return to their historical average over time. Traders using mean reversion look for opportunities to enter trades when prices deviate significantly from their average levels, expecting them to revert. This strategy requires understanding market cycles, identifying overbought or oversold conditions, and timing entries and exits effectively. Explore how to implement mean reversion strategy in crypto trading here.
Stock Pattern Recognition: Pattern recognition in stock trading involves identifying repetitive formations or trends in price charts that indicate potential future price movements. Traders use pattern recognition to predict market direction, manage risk, and optimize entry and exit points. Mastering stock pattern recognition requires familiarity with various chart patterns and their implications for trading strategies. Learn about different stock patterns and their applications here.
Cup and Handle Pattern: The cup and handle pattern is a bullish continuation pattern that signals a potential upward trend continuation after a temporary consolidation phase. Recognizing and interpreting this pattern helps traders identify buying opportunities and anticipate price movements in stocks or other assets. Dive into the details of the cup and handle pattern and how to incorporate it into your trading strategy here.
Bollinger Bands Strategy: Bollinger Bands are a popular technical analysis tool used by traders to measure volatility and identify overbought or oversold conditions in the market. The strategy involves using Bollinger Bands in conjunction with other indicators to confirm signals and make informed trading decisions. Understanding how to effectively use Bollinger Bands can enhance trading accuracy and risk management. Explore strategies for mastering Bollinger Bands here.
Golden Cross Pattern: The golden cross pattern occurs when a short-term moving average crosses above a long-term moving average, indicating a potential uptrend in the market. This pattern is widely watched by traders as a bullish signal, suggesting a shift in market sentiment towards buying pressure. Learn more about the golden cross pattern and its implications for trading strategies here.
Swing Trading Indicators: Swing traders rely on technical indicators to identify short-term price momentum and potential reversal points in the market. These indicators help traders time their entries and exits based on market trends and price patterns. Mastering the top indicators for swing trading involves understanding their signals, strengths, and limitations in different market conditions. Explore essential indicators for successful swing trading here.
Pivot Points: Pivot points are mathematical calculations used by traders to identify potential support and resistance levels in the market. These levels are derived from the previous day’s trading data and help traders gauge market sentiment and make trading decisions. Understanding how to calculate and interpret pivot points is essential for traders seeking to optimize entry and exit points in various trading scenarios. Dive into strategies for mastering pivot points here.
Stochastic Oscillator: The stochastic oscillator is a momentum indicator that compares a security’s closing price to its price range over a specific period. Traders use the stochastic oscillator to identify overbought or oversold conditions and potential trend reversals in the market. Mastering the stochastic oscillator involves understanding its calculations, interpreting signals, and integrating it into trading strategies effectively. Explore comprehensive strategies for using the stochastic oscillator here.
In conclusion, while traditional trading strategies remain essential, exploring lesser-known approaches can provide traders with a competitive edge. From seasonal anomalies like the Halloween Effect to specialized techniques in cryptocurrency trading, each strategy offers unique insights and opportunities for growth. By expanding their knowledge and embracing these hidden gems, traders can diversify their strategies, mitigate risks, and potentially enhance their overall trading performance.

To learn more about trading, visit tacracked.ai.
1 note
·
View note
Text
Leveraging Technical Indicators for Profitable Forex Signals
Welcome to the world of Forex Signals! If you're new to this, Forex Signals are essentially trade ideas, indicating currency pairs to trade, and the time to buy or sell them. It's a great way to make a profit, or at least that's what they tell us! But with so many technical indicators out there, how do you make sense of all these signals? That's where this blog comes in. We'll be exploring the importance of technical indicators in forex trading and how they can be leveraged for profitable forex signals. So, grab your coffee and let's dive in!

Understanding Technical Indicators
Technical indicators are mathematical calculations applied to a forex pair's historical pricing data. These calculations can analyze past and current market conditions to provide traders with insights and help them make informed trading decisions. Technical indicators come in different types such as moving averages, oscillators, and volatility indicators, among others. Technical indicators play an indispensable role in forex trading, especially in the analysis of market trends and forecasting potential price movements.
By using technical indicators, traders can identify potential entry and exit points for trades. They can also better manage the risk of their trades by placing orders based on technical indicators' signals. In other words, technical indicators can help traders maximize their profits while minimizing their losses. However, it's important to remember that technical indicators have limitations. Traders should not solely rely on technical indicators for trading decisions. It's also crucial to keep up with market news and events to ensure that they consider both fundamental and technical analysis.
In summary, technical indicators play a crucial role in forex trading. They help traders analyze the market and make informed decisions. However, traders should remember that they are not a magical tool. Proper analysis and risk-management should be considered before making any trading decision.
Technical Analysis and Forex Trading
Technical analysis is a method of studying charts and historical data to forecast future price movements. By analyzing the charts, traders aim to identify market trends and patterns that can provide an edge in trading. This form of analysis is especially relevant in Forex trading, where the currency market is highly volatile and affected by multiple factors. One of the major advantages of using technical analysis in Forex trading is its ability to identify entry and exit points. Technical indicators such as Moving Averages, Relative Strength Index (RSI), Bollinger Bands, Fibonacci Retracement Levels, and Ichimoku Clouds can all help traders determine when to enter or exit a trade.
These indicators can also identify overbought and oversold conditions in the market, which can provide an insight into possible market reversals. To use technical indicators effectively, traders need to develop an understanding of market trends and identify key chart patterns. Technical analysis can help traders identify trends and patterns that are not visible on the price chart. However, it is important to note that technical analysis has its own limitations, and it is important to use it in conjunction with fundamental analysis.
In summary, technical analysis provides traders with a valuable tool to analyze the Forex market and identify profitable trade opportunities. By understanding basic principles of technical analysis, using key technical indicators, and staying up to date with market trends and news, traders can potentially increase their chances of success in Forex trading.

Top Technical Indicators for Forex Trading
So, you're interested in trading forex using technical indicators, huh? Let's dive into the top technical indicators for forex trading! First on the list are Moving Averages. These indicators are used to track the average price of a currency for a certain period of time. Traders use this to determine the overall trend of the market. Next up is the Relative Strength Index (RSI). This indicator shows whether a currency is overbought or oversold. Basically, it helps traders determine when to enter or exit a trade.
Another popular technical indicator is Bollinger Bands. These bands are used to measure volatility in the market. When the bands are close together, it indicates a period of low volatility, while a wider distance between bands shows high volatility. Fibonacci Retracement Levels are also widely used among traders. These levels are calculated by identifying a high and low point on a chart and then plotting retracement levels between them. This helps traders determine potential areas of support and resistance.
Finally, we have Ichimoku Clouds. This indicator is made up of multiple lines that help traders identify key levels of support and resistance. It also gives an overall view of the market trend and momentum. Now that you know the top technical indicators for forex trading, it's important to use them correctly. Remember to use multiple indicators for confirmation and keep up to date with market news and events. And most importantly, have a trading strategy and keep track of your trades and learning progress. Good luck out there!
Using Technical Indicators in Forex Trading
When it comes to using technical indicators in forex trading, it's crucial to understand that they are not the be-all and end-all. While they can provide valuable insights into market trends and potential entry and exit points, they are not foolproof. To correctly use technical indicators, it's important to have a well-thought-out trading strategy that takes into account not only technical analysis but also fundamental factors and current market conditions.
Additionally, understanding market trends is key. Technical indicators can only provide signals based on past data, so it's important to consider current market conditions and the potential impact of news and events. It's also important to recognize the limitations of technical indicators. They can provide false signals, especially in choppy markets, and can lag behind in fast-moving markets. It's essential to use them in conjunction with other indicators and analysis tools to confirm signals and avoid relying solely on technical indicators.
In short, technical indicators are a valuable tool in forex trading, but they should not be used in isolation. By crafting a well-informed strategy and staying up to date on market trends and conditions, traders can use technical indicators to their advantage whilst avoiding potential pitfalls.
Tips for Successful Forex Trading Using Technical Indicators
So, you’ve understood the importance of technical indicators in forex trading? Excellent! However, that’s just the beginning. To be a successful trader, you’ll have to go beyond the basics. Here are some tips that can help you make the most out of technical indicators. First and foremost, have a trading strategy in place. Without a plan, you’ll be like a rudderless ship, drifting away in the sea of uncertainty. While using technical indicators is a great way to get started in forex trading, it’s also important to use multiple indicators for confirmation.
Remember, no indicator can give you 100% accurate signals, so it’s best not to rely on just one. Keep yourself updated with the latest market news and events. They can have a huge impact on your trades. For instance, if there’s an unexpected announcement by a central bank, it could lead to a change in market sentiment, which could, in turn, lead to changes in forex prices. Lastly, keep a journal to document your trades and learn from them. It’s a great way to see where you went right (and wrong) and make improvements.
Plus, it also helps you stay disciplined and avoid making impulsive decisions. Remember, learning to use technical indicators is one thing, but mastering them is a whole different ball game. By following these tips, you can significantly improve your chances of success. Good luck!
Conclusion
So, there you have it - a breakdown of how to leverage technical indicators for profitable forex signals. To sum up: technical indicators are an essential tool for any serious forex trader, helping to identify trends, entry and exit points, and overall market sentiment. By understanding the basic principles of technical analysis and knowing which indicators to use and how to read them, you can make more informed trading decisions and increase your profitability.
Of course, all the theory in the world won't get you anywhere without putting it into practice. So, our final word of advice is to get out there and start trading! Keep a journal to document your trades and use it to track your progress and learning. Stay up to date with market news and events, and don't be afraid to experiment with different strategies and indicator combinations. By doing all these, you will increase your chances of trading success. Remember, there's no substitute for experience.
#forex#forex trading#forexnews#money#investment#currency#crypto#forexmoney#broker#stock market#forexmentor#forex online trading#forexbroker#forexmarket#forexstrategy#forextips
0 notes
Text
Discover the Best MT4 Indicators for Maximum Profits!
Mt4 Indicators
MT4 indicators are an essential tool in the toolbox of forex traders. These technical analysis tools help traders to identify trends, potential breakouts, and other market dynamics that can inform their trading decisions. MT4 indicators are available in various forms and can be customized to suit different trading styles.
The purpose of this article is to provide a comprehensive guide on MT4 indicators, exploring their types, customization options, and tips for effective use. By understanding the fundamentals of these tools, traders can enhance their decision-making process and maximize their trading potential.
Additionally, we will discuss how MT4 indicators fit into the broader context of forex trading strategies and how they can complement other analytical tools such as price action analysis or fundamental analysis.
Understanding the Purpose of MT4 Indicators
The purpose of MT4 indicators is to provide traders with a visual representation of market data in the forex industry. These technical tools serve as an aid for traders in making informed trading decisions by analyzing price and trend movements. They are designed to be contextually relevant, meaning that they are specific to the trader's preferred currency pairs, time frames, and trading strategies.
MT4 indicators offer a range of benefits for traders such as identifying potential entry and exit points, highlighting market trends, and providing signals for technical analysis. By using these tools, traders can develop strategies based on real-time data which can increase their chances of success in the forex market.
Furthermore, MT4 indicators allow traders to conduct thorough analysis without having to spend hours manually scanning through charts and graphs.
Overall, understanding the purpose of MT4 indicators is crucial for any trader looking to succeed in the highly competitive world of forex trading.
Exploring the Different Types of MT4 Indicators
Various categories of tools are available on MT4 that help traders to analyze the market and make better decisions. Among these tools, MT4 indicators play a crucial role in identifying market trends, predicting future price movements and providing signals for entry and exit points.
There are different types of MT4 indicators, each designed to serve a specific purpose. Exploring these different types of indicators can help traders to choose the ones that best fit their trading style and strategy.
One type of MT4 indicator is trend indicators, which shows the direction and strength of a market trend. These include moving averages, MACD (Moving Average Convergence Divergence), and Ichimoku Kinko Hyo.
Another type is support and resistance indicators that identify key levels where prices are likely to find support or resistance. Examples include pivot points, Fibonacci retracement levels, and Bollinger Bands.
Other types of MT4 indicators include volatility indicators such as Average True Range (ATR) and Relative Strength Index (RSI), momentum oscillators like Stochastic Oscillator and Williams Percent Range (WPR), as well as volume-based indicators like On-Balance Volume (OBV).
By understanding the different types of MT4 indicators available, traders can use them effectively to improve their trading performance by making informed decisions based on accurate analysis of market trends.
Customizing MT4 Indicators to Suit Your Trading Style
Customizing MT4 indicators can significantly enhance a trader's ability to analyze the market and make informed decisions that align with their unique trading style. The standard settings on an MT4 indicator might not always match the preferences of every individual trader, which is why customizing them becomes crucial.
For instance, traders may want to adjust the parameters of certain indicators such as moving averages or stochastic oscillators to better capture price movements in specific timeframes. This customization process allows traders to tailor their analysis to their trading style and preferences.
Forex traders who use MT4 indicators can also customize them by adding or removing features based on their needs. Some traders prefer simple tools while others may need more complex ones depending on their experience level and strategy.
Customization presents an opportunity for traders to integrate multiple indicators into one chart, which offers a comprehensive view of market trends and price movements. By selecting the right combination of indicators, traders can develop a trading system that suits their unique style and helps them identify potential entry and exit points in the market.
Ultimately, customizing MT4 indicators allows forex traders to optimize their analysis techniques and achieve better trading outcomes over time.
Tips for Using MT4 Indicators Effectively
To effectively utilize MT4 indicators, traders should consider the specific market conditions and timeframe in which they are trading. It is important to understand that different indicators work better in different market conditions.
For example, trend-following indicators like moving averages are more effective in trending markets, while oscillators like Relative Strength Index (RSI) perform well in range-bound markets. Therefore, it is essential for traders to identify the prevailing market conditions before using any indicator.
Moreover, traders must also use MT4 indicators alongside other technical analysis tools like price action analysis or support and resistance levels to gain a comprehensive view of the market. Additionally, it is crucial to avoid over-reliance on indicators as they can provide false signals or delay entry/exit points.
Lastly, utilizing the best MT4 indicators requires proper installation and configuration; hence it's advisable to download MT4 indicators from reputable sources and seek guidance from experienced traders or brokers.
By following these tips for using MT4 indicators effectively, traders can enhance their trading strategies and improve their chances of success in the forex market.
Maximizing Your Trading Potential with MT4 Indicators
By exploring the features and capabilities of MT4 indicators, traders can unlock their full potential and achieve greater success in their forex trading endeavors. One of the best ways to maximize your trading potential using MT4 Indicators is by identifying the best ones that suit your strategy.
There are countless MT4 indicators available on various platforms, but not all of them will work for you. Some of the best MT4 indicators include support and resistance indicators, trend indicators, and momentum indicators.
Support and resistance indicators can help traders identify key levels where prices may bounce or break through, while trend indicators provide insights into market direction and momentum. Momentum indicators can also be useful in determining whether a trend is likely to continue or reverse.
By utilizing these different types of MT4 indicators effectively, traders can make more informed decisions about when to enter or exit trades, potentially leading to greater profits in the long run.
Conclusion
MT4 indicators are a crucial tool in the arsenal of any forex trader. They provide valuable insights into market trends, price movements, and potential trade opportunities. By utilizing MT4 indicators effectively, traders can make informed decisions based on accurate data analysis.
There are various types of MT4 indicators available that cater to different trading styles and strategies. These include trend-following indicators, momentum indicators, volatility indicators, and volume indicators. Traders can customize these indicators to suit their unique needs by adjusting parameters such as timeframes or periods.
To use MT4 indicators effectively, traders should have a thorough understanding of their purpose and how they work. It is also essential to use them in conjunction with other technical analysis tools for more comprehensive market analysis. Additionally, it is crucial to avoid over-reliance on these tools as they are not infallible.
In conclusion, MT4 indicators are an indispensable resource for forex traders seeking to gain an edge in the markets. By utilizing them effectively alongside other technical analysis tools and adhering to sound trading principles, traders can maximize their potential for success in this dynamic industry.
Author Box: I am a highly regarded trader, author, and coach with a proven track record of over 16 years of experience in trading financial markets. Throughout my extensive career, I have dedicated myself to the development and refinement of forex trading strategies and MT4 indicators, establishing myself as a leading figure in the field. Visit: https://free-forex-indicators.com/category/mt4-indicators/
#mt4 indicators#indicators mt4#indicators for mt4#best mt4 indicators#mt4 best indicators#forex indicators for mt4#best indicators mt4#forex indicators mt4#best indicators for mt4#forex mt4 indicators
1 note
·
View note
Text
BinBot Pro Review: Profitable Auto Trading or a Scam?

Reviews for automated trading systems like BinBot Pro are the most sought after.
This is because auto trading is the newest trend in the world of trading.
Many traders are confused about how auto trading work or are skeptical about it.
But we are here to the rescue!
In this review, we will go through the features of BinBot Pro to see how it works, how well it delivers on its promises and most importantly, you can know if it is a scam or not.
Binbot Pro Review
Automated trading systems like BinBot Pro allow auto trading with the help of trading algorithms.
The trader has to set some rules such as risk levels, entry and exit stipulations, and leverage and the rest will be done by the auto trader.
The traders can then relax and not worry about monitoring their positions.
This has made trading robots very popular and in demand.
As a result, the market is now flooded with tons of trading robots.
As a trader who’s looking for a reliable robot, it might become difficult to choose one.
Our Review on BinBot Pro will clear that doubt for you.
Let’s start.
BinBot Pro Review: What is BinBot Pro? BinBot Pro Review - Binoption High Capital Risk Is Involved In Financial Trading
BinBot Pro is a Binary Options Robot that offers automated trading to its users.
It was established in the year 2016 and has been offering an automated trading service since then.
There are multiple robots available for that trades on your behalf.
You can also customize them to match your requirements.
Each trading robot follows a different strategy and you can choose the one that you think will work the best for you.
BinBot Pro has partnered with BinaryCent which is an online broker.
You carry out transactions like deposits and withdrawals through this broker.
We will discuss more this broker later in the review.
Trading robots have been popping up left and right due to the increased demand for automated trading.
Unfortunately, not all trading robots have proven to be effective.
They enter and disappear from the market without anyone noticing.
This proves that you cannot expect to provide poor service and survive in the market.
BinBot Pro has been going strong ever since it was released in 2016.
It has gained popularity among traders quickly and has become one of the best-automated trading systems currently.
In 2016, they won the award for the best binary robot.
Why choose BinBot Pro? BinBot Pro offers certain features that you cannot overlook.
Let’s see the reasons as to why you should choose BinBot Pro as your preferred choice of the trading robot.
Offers profitable auto-trading Even new traders can make large profits Easy registration process Returns as high as 90% Demo account offered Award-winning automated trading Robots have a profit rate up to 300% Provides services to many countries around the globe Major forex pairs as binary options Popular Crypto assets A minimum deposit fee of $250 Manual customization of trading robots Fast and reliable platform Dedicated customer support BinBot Pro Live Trading Video, Results and Withdrawal BinBot Pro Sign-up and Login BinBot Pro Login Signup - Binoption The account creation process is quick and hassle-free.
The process is described below:
Step 1 Click on the ‘Registration’ button below to start your registration process.
Step 2 Step 3 Step 4 To log in into your account, just use your provided email address and password.
CLICK FOR REGISTRATION High Capital Risk Is Involved In Financial Trading
BinBot Pro Broker- BinaryCent BinaryCent BinBot Pro Broker - Binoption BinBot Pro currently only offers one broker to deal with: BinaryCent.
BinaryCent is an online trading platform which was founded in the year 2016.
It is managed by Cent Project Ltd., which is a subsidiary of Finance Group Corp.
The company is based in Vanuatu where their head office is located in Transpacific Haus, Lini Highway, Vanuatu.
BinaryCent is regulated by the Vanuatu Financial Services Commission (VFSC).
BinaryCent guaranteed withdrawals processing within 1 hour.
BinaryCent’s focus lies on small traders and hence their minimum deposit and investment are very low.
You need to deposit a minimum of $250 to start trading and the minimum trade investment is only $0.1.
This is one of the lowest we have seen and is beneficial for small and new traders.
You get leverage up to 1:100 on trading assets.
BinaryCent offers binary options along with forex and CFDs in their trading portfolio.
Recently they have added cryptocurrencies such as Bitcoin, Litecoin, Ethereum, Zcash, Monero, BCH, Dash, PrimeCoin, Reddcoin, and many others.
BinaryCent offers customer support through live web chat or through the telephone.
BinaryCent has its proprietary trading platform for trading.
The platform is web-based which means you don’t have to download separate software for trading.
The platform is user-friendly and trade execution happens without any delay.
They also offer mobile trading on the iOS and Android.
They have the same features and functionalities as the web-platform.
There are three different types of trading accounts on BinaryCent; Bronze, silver, and gold. Silver and gold accounts offer extra benefits and bonuses to traders.
Speaking of bonuses, traders get rewarded with bonuses for the deposit they make.
Depending on the type of account they choose to create, they get rewarded with 20%-100% bonus.
All these features make BinaryCent a great choice to be BinBot Pro’s broker.
VISIT BINARYCENT BROKER High Capital Risk Is Involved In Financial Trading
BinBot Pro Top Robots - Created By Users BinBot Pro Top Performing Robots - Binoption BinBot Pro ranks robots on the basis of profits they generate for traders.
Here are some of the top performing robots for BinBot Pro:
RSIMA Cross Robot This is the top robot with a profit of over 300%.
The strategy used in this robot involves matching the RSI with the moving average cross indicator.
The robot buys or sells when it matches with the RSI overbought or oversold signal.
The signal is maintained until an opposite signal is received.
The minimum deposit for this robot is $3000 and its algorithm level is at 5 points.
xProfit Robot Ichimoku Crypto V2 Robot Rising East v1.2 Robot HP Cycles Robot Strong ADX v.2 Robot Strong US v2 Robot Bolly Band Bounce Robot RVI and MA Robot Bladerunner Robot CHOOSE YOUR TRADING ROBOT High Capital Risk Is Involved In Financial Trading
BinBot Pro Settings and Trading Platform BinBot Pro’s auto trading platform is available on the web.
You don’t need any separate software for trading which is convenient for many traders.
The whole auto-trading is revolved around following a trading robot which is available from the list of robots.
The platform displays the top 10 performing robots based on the profit level they generate.
Note that you can either copy the robot directly by letting it do all the trading for you or you can customize the robot to suit your needs.
You can also create a robot from scratch if you have the necessary trading experience.
Let’s take a look at the process of robot creation.
Robot Creation: BinBot Pro Settings Robot Creation - Binoption On the left side of the trading platform, there is a ‘create my robot’ button. Click on it to start the robot creation process. STEP 1 Choose a name for your robot. You can give it any name you desire but by adding a relevant name, you can easily remember its strategy and even others can benefit from it. STEP 2 STEP 3 STEP 4 STEP 5 BinBot Pro Indicators: BinBot Pro Settings Trading Indicators - Binoption There are 6 different types of indicators available in BinBot Pro: ADM Index: ADM stands for Average Directional Movement. It is an indicator that indicates the trend strength. It can determine when the price of an asset will trend strongly. This strength indication can be bi-directional, i.e. both upwards and downwards.
Commodity Chanel Index (CCI): Momentum Indicator: RSI Indicator: RVI Indicator: AROON: BinBot Pro Demo Trading BinBot Pro offers demo auto-trading before you invest.
You can demo run the top 10 trading robots and see which suits your needs the best.
The demo runs for a robot runs exactly for one minute.
The initial fund offered is $1000 and at the end of the one-minute demo, the final balance is displayed.
In our extensive testing, the demo tests always ended in profits and never seemed to face any loss which seemed suspecting to us.
When we traded on our real accounts, on an average, the robot won us 8/10 trades.
This is normal as no robot can guarantee a 100% win rate.
Their demo robot winning all trades may just be a marketing gimmick.
Also, the demo market conditions are obviously different than the real market conditions.
BinBot Pro Cryptocurrency Trading BinBot Pro offers exclusive crypto trading to its traders.
Although binary trading is not allowed in the U.S, you can trade forex-crypto assets from any country in the world through BinBot Pro.
You can trade popular cryptos such as BTC, ETH, Litecoin, Dash, and much more.
BinBot Pro even offers deposits and withdrawals using Bitcoins and altcoins.
This makes the transactions fast and secure.
The BinBot Pro crypto software claims to have income returns of 700% or higher.
According to statistics, on a daily basis, their robots win 32390 trades, 1765 new clients join their website, they pay profits of $86003, and a customer earns $3836 in profits on an average.
Approximately, 25000 clients have had profitable trades with BinBot Pro.
The current offer of BinBot Pro offers 100% sign up bonus to their clients for Cryptocurrency trading.
START TRADING CRYPTOCURRENCY High Capital Risk Is Involved In Financial Trading
BinBot Pro Mobile Trading Currently, there is no mobile app for BinBot Pro.
However, BinaryCent offers mobile trading.
So you can perform transactions on the mobile app.
However, for trading, you have to use the web platform.
BinBot Pro Asset Index BinBot mainly offers the major forex pairs along with few crypto-forex pairs.
Here is a list of the assets BinBot Pro offers in its portfolio:
Forex Pairs: EUR/AUD EUR/USD GBP/USD USD/CHF EUR/JPY USD/CAD AUD/USD EUR/GBP Crypto-Forex Pairs: BTC/USD LTC/USD ETH/USD BCH/USD BinBot Pro Minimum Deposit The minimum deposit on BinaryCent is $250 but for some regions, it is $500.
BinBot Pro redirects you to BinaryCent during the withdrawal and deposit process.
BinaryCent offers multiple transaction methods such as Credit card (Visa, MasterCard), wire transfer, WebMoney, Skrill, Neteller, Crypto wallets to accept cryptocurrencies.
The deposit process is quick and is process instantly.
BinBot Pro Withdrawal BinBot Pro offers multiple withdrawal methods such as Bitcoin, credit cards, Neteller, Skrill, and Perfect Money.
They charge a 5% transfer fee on credit card transactions.
BinBot Pro guarantees withdrawal processing within 1 hour.
The time it takes for you to receive this payment takes 2-7 business days.
Is BinBot Pro Scam or Legit? BinBot Pro Scam - Binoption BinBot Pro has been around 2016 and has a very good success rate of over 90%.
It has multiple trading robots and offers a regulated broker to trade with.
These reasons along with positive customer reviews make it a legit broker.
However, there has been a couple of complaints regarding this platform.
The thing with automated trading is, you are depending on algorithms and machines to do the trading for you.
This cannot ensure success every time, unlike popular beliefs.
Although not with complete certainty, we would like to say this platform is legal and you can use it for profitable trading.
BinBot Pro Cons Though it has many unique features for traders but it has also some drawbacks and they are –
Demo account lasts only one minute Demo trading results seemed suspecting to us Offers only one broker for trading Minimum deposits for top robots are high Conclusion BinBot Pro stands out from the rest of the auto trading by providing multiple robots that have a high success rate, multiple indicators offering vast technical analysis, and a convenient robot creation process both novice and experienced traders benefit from the profitable auto trading BinBot Pro offers.
However, there are a few things they could work on to improve further.
Their website feels lackluster to use.
They need to partner with more brokers to cater to more traders.
In conclusion, BinBot Pro is an excellent auto-trading robot that delivers what it claims to do
1 note
·
View note
Photo

The Best Ichimoku Trading Strategy [for Quick Profits in 2019] [INFOGRAPHIC]
Learn how to trade Ichimoku and Ichimoku cloud using technical indicator trading strategies. Ichimoku is a Japanese charting method that was developed in 1969 by Ichimoku Kinkou Hyo. With this momentum indicator you will discover reliable support and resistance levels to determine market strength. There are several different components to Ichimoku trading, Tenkan-Sen line, the Kijun-Sen line, the Chio Span, and the Senkou spans. Learn how to quickly glance and understand basic interpretations of these lines for steady, consistent trading. Learn more in the guide.
Source: ichimoku
4 notes
·
View notes
Text
Guide to Risk Management in Gunbot

«GunBot is a trading application that uses different strategies to buy and sell crypto coins continuous and automatically 24hr/365 days of the year at any of the 113 exchanges. GunBot comes pre-packed, so mainly it will trade for you without the need of being glued 24hr to your trading desk». GunBot doesn’t have sentiments, it doesn’t fear, panic or express extreme happiness so it doesn’t make human errors, it’s based on algorithmic trading, which means its able to make decisions based on your specific strategy configured in the bot leading to a better ROI (return of investment).
Guide to Risk Management in Gunbot
Risk management is really important from any economic activity especially with a high volatility market like trading crypto coins and token in regulated exchanges. Risk management in Gunbot, the triple R In the world of economics, risk management refers to forecasting the risk associated with your investment. You need to analyze that risk in advance and take precautionary steps to reduce (curb) the risk How to handle your asset’s portfolio is as critical as how you handle your loans or mortgage. This is especially important in crypto due to the high volatility of markets. It’s just mathematically impossible you will win all trades but the most important rule is you win more trades than you lose with a positive "Risk vs Return Ratio" so, in the end, you are overall, in the long run, earning money. From a trading bot perspective, it is about when to enter and exit the market and how to forecast the market for better entries and exits. Another key part is to plan your exit from a bad trade either via stop loss or DCA in the crypto market. Specifically related to Gunbot: Risk : means how much you want to risk in each trade and how much it will cost when trying to exit from a bad trade. Considering this you should check your entry and RR (return ratio) As a general rule of thumb, never invest more than 1% from your wallet the first trade. Return : where your profit expectations are or when to take profit and close the trade, honestly leave that to GunBot, never manually trade the cryptocoins the bot is trading, unless you are really advanced user, and specially the first time you trade with GunBot set a really short profit, like 0.25% to 0.5% gain from your entry. Ratio: It is the overall risk vs reward of your trade strategy. If you plan to exit a good trade at 1% gain and exit from a bad trade at 3% loss, you will need 3 profitable trades just to cover 1 loss. To put it simply, your strategy will need to maintain approx 4w/1L ratio to make profit (80% success rate). If you plan your strategy to exit at 4% profit and 2% loss (for example), then you will have generate a positive Risk v Reward Ratio. "Make sure you plan your trade strategies carefully to keep in mind the 3R's" How much could be my trading_limit my first test trade to minimize my Risk? «Never put more money on an exchange than you can afford to loose.» My recommendation is the minimum possible in exchange plus 0.0001 to 0.0005 Bitcoin (convert to USDT / ETH if BTC is not your main base, in the case of Binance you can gather more info for each base here . In Bitcoin, the minimum trade amount will be 0.001 so we will set as TRADING_LIMIT in our Gunbot strategy as 0.00125 you will configure your Min-vol to sell and Min volume to buy like the picture below. Go to settings page - Strategy configurator - your strategy and set the values accordingly.

Risk Management in Gunbot There are several risk management strategies: STOP_LIMIT: if the price is going down Gunbot will stop_limit your position and sell your cryptocoins at lost recovering part of your base from that trade, you can select specific % after coin loose it’s value in the market to trigger stop_limit, you can select that specific % based in local/daily or monthly support of that coin, so you can calculate from your entry where you should sell at lost and wait for next re-entry. This can be set up in override or per strategy, I recommend per override in each of your pairs so it’s not a fixed % for all coins linked to that strategie. Go to your Dashboard - settings - Trading Pairs add an override :

Click Add and save. When the price hits that exact % down from your averaged entry point it will sell at lost. you can check immediately at what price you sell at lost in dashboard.

To configure per strategy : Go to your Dashboard - settings - Strategies - Misc change your Stop Limit value to your desired % down.

DOUBLE_UP: This is a Gunbot feature that allows averaging the price of your entry, that’s a really powerful technique but make sure you have enough funds to do it properly, so for a wallet of 0.015 BTC you should keep at least 75% to average in one pair if our TRADING_LIMIT is 0.00125. To configure DOUBLE_UP: Go to dashboard - settings - your_strategy - Dollar Cost Avg.

Toggle the button Double Up Enabled and Configure your DU Cap, that means how much BASE i will invest when my DCA triggers, it can be a 1:1, 1:0.5, 1:03 ratio, here you can decide based on what was your bought price and local support, daily support, etc. Usually ratio 1:1 means you double the investment in that coin, so if you started with 0.00125 and the coin dropped 5% you will re-invest again 0,0011875 the first time, second time you will re-invest another 0.00225625, and if you do a third DCA you will reinvest 0.00428688 meaning that three DCAs starting at 0.00125 you will invest a total of 0.00898063 and as well means that the coin dropped 14.5 % from your price. Configure your DU Cap Count (Number of times you will average the coin). Configure your DU Method from the three available (HIGHBB, RSI, Numeric). Gunbot has several methods based on different strategies: Conservative : RSI Regular DCA we should use HIGHBB Aggressive: Numeric (no matter the market state it will buy automatically when the coin drops the configured % down and the price level is hit) Recommendation is you set RSI 35% and then only will DCA if the coin is overbought in the configured PERIOD in your strategy. Reversal Trading: This is a Gunbot technique that allows your bot to sell the quote it holds in your exchange wallet and recover the base u were trading, so if the coin is dropping at a certain level you sell at lost, keeping your quote as the market is moving down your bot will rebuy at lower price keeping more quote amount that you had before and having a better entry price so when the trend changes upward you will be able to sell quicker with your configured gain setting.

Login to your dashboard page - settings - your strategy

you can get more information in our Gunbot Reversal Trading Ultimate Guide as this is a complex mechanism and maybe don’t will be advised to run it as first-time Gunbot user. What trading period you should select? For starting GunBot and your first pair i recommend a period of 15 minutes, you will have a balance between being a large period and not waiting a lot to enter in the coin. This is the default period configured in GunBot. Your GunBot will start and finish a trade based on a default gain strategy between 5 minutes and 24h per trade depending on market if it’s bullish, bearish or sideways (estimated trade time could vary with real data) and will depend as well in your GAIN settings so if you set a too high gain it’s most likely that the coin will not reach that price, so it’s better to have more small trades than 1 big trade, you can play from 0.1 % to 1.5% as startup. What trading strategy I could choose as my first time trading strategy? In Gunbot there’re several strategies from the gain based in EMAs, BB based in the Bollinger bands, MACD, Ichimoku. etc... So to recommend one to choose is quite difficult and is really personal taste and will depend on which one you’re more comfortable to work with. you can grasp more information about strategies here List of strategies in latest Gunbot version

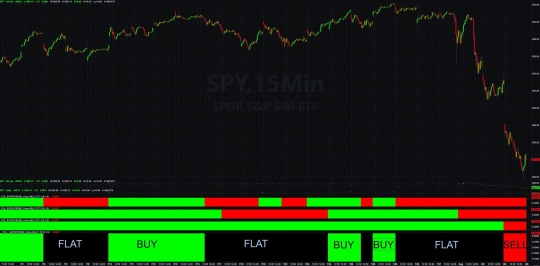
Backtest your strategy in Tradingview or Gunbot itself Tradingview: We have specific strategy scripts in the TradingView portal that you can backtest before adding that strategy in your Gunbot and see how your strategy will perform with real-time past data. You can grasp about TradingView strategies simulator here. Gunbot backtesting: Go to your dashboard - Settings - Bot section - Watch_Mode When you toggle on the watch mode your GunBot will simulate execute trades (Buy and Sell) and you can see if you strategy is good or no.

Have a good Gunbottin’! Read the full article
0 notes
Text
SuperTrend Indicator - 2020 Guide - MultiCharts & TradeStation Download
Are you searching for SuperTrend Indicator? This post if for you!The Supertrend Indicator (ST), developed by Olivier Seban, was born as a tool to optimize the exit from trade, which is a trailing stop.Today is one of the most used tools by traders.In this tutorial, we will explain what it is, how it is used, and how to calculate it. You can also download SuperTrend free versions for TradeStation, MultiCharts, MetaTrader. What exactly are you looking for?Click to scroll down Table Of Index What is SuperTrend Indicator? How do you use the ST Indicator? How is SuperTrend calculated? Download SuperTrend indicator for Free
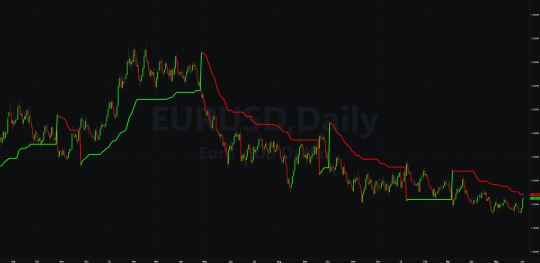
What is SuperTrend Indicator?
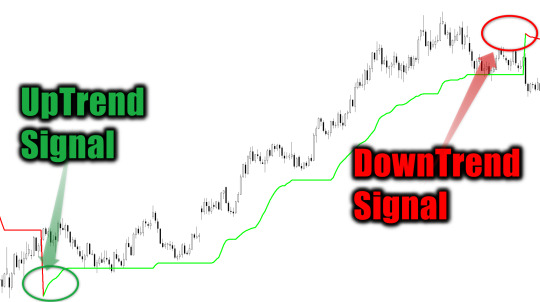
The ST Indicator ST belongs to the category of follower trend indicators. These types of indicators signal the direction of the trend and highlight the continuation or changes of direction.This indicator works well in a trending market.And very similar in his conception to Wilder’s Parabolic SAR. However, the Supertrend has the merit of positioning itself horizontally, in a sort of stand by, in moments of price laterality, avoiding getting us out of position before time.We must always remember that all trend-follower indicators have a common flaw: they warn of the change of trend AFTER the change has taken place, not PRIMA.They are all indicators that update with an inevitable delay; they are not anticipators of the trend.Let’s see the two indicators in comparison: the SuperTrend is represented with the solid line, while the Parabolic SAR with the classic green dots (up) and red dots (down)
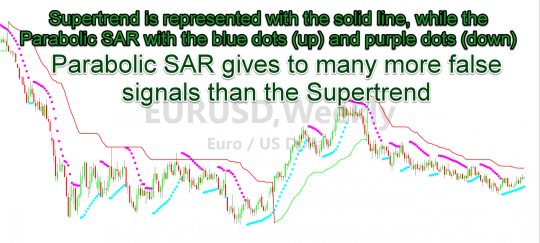
It is immediately noticeable that the continuous color change of the Parabolic SAR gives rise to many more false signals than the SuperTrendHowever, the ST has two enormous merits:1) It is straightforward to use because the identification of the trend takes into account the average volatility of the asset.2) It can be used with any timeframe and all financial instruments (shares, indexes, forex).Others do not do so and, therefore, often force them to leave the market too early.On the other hand, the SuperTrend filters many false signals, and this allows us to keep the position open for longer and increase the average profit.
A trend follower strategy to be successful must remain on the market as long as possible.The longer you stay on the market, the more trends you can take advantage of.At the same time, it also needs to come out quickly if the trade is going the wrong way.
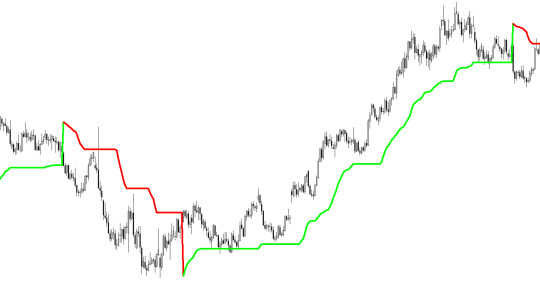
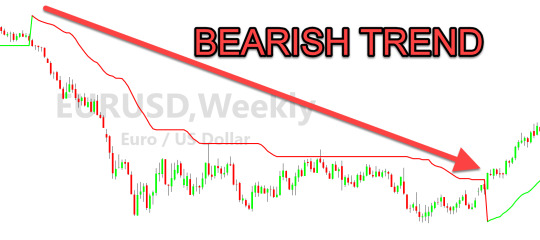
How do you use the ST Indicator?
From a graphical point of view, the Super Trend appears as a red or green line that accompanies price trends.The red line identifies periods characterized by a negative trend, while the green line indicates market periods with a positive trend.When the line is below the graph, the trend will be upward, and it will, therefore, be preferable to open long positions.When the indicator line is above the graph, the trend will be downward, and it will, therefore, be preferable to open short positions;There are 3 different ways you can use this indicator:Filter OperationsThe ST show us the current trend, remember that we do not want to go against the primary uptrend or downtrend.So if the underlying trend is upward, we will only do long trades, if downward only short trades.In this way, we filter several false “counter-trend” buy signal or sell signal.The reversal of a trend occurs when prices cross the indicator line positioned at a given level from one side to the other.This level is defined as a roof or floor, depending on whether it is above or below the price scale.
We need it as a trailing stop.The ST can be used to manage the exit from another trading strategy.This indicator will keep us in the extended position until the indicator remains green or short until the indicator remains red.We'll get out as soon as the color changes.SuperTrend Trading StrategyWe could use a Supertrend Trading Strategy to find buy or sell signal.We open a long position at the change of color from red to green (buy signal is generated).Vice-Versa we can opening a short trade when green become red (sell signal is generated).Positions will close the next time the indicator changes color.Theoretically, we can always stay in the market – stop & reverse strategy – moving from long to short all the time.
With this technique, there will be no shortage of false signals, especially in phases of prolonged laterality.It will, therefore, be of fundamental importance to close the position in stop-loss if the market does not go in the desired direction.We prefer to suggest that you do not use it alone but integrate it into your trading systems with the use of other tools.Even if the ST is a very valid indicator, it is better to use it in combination with at least one other.We can use it together with the CCI, Momentum, ADX, RSI. Two SuperTrend Indicators - The Double StrategyThere is also the possibility to take advantage of ST not in combination with another technical indicator, but by combining two ST indicators.We can then apply the same indicator to the graph but with two different settings, one fast and one slow.In this case, when the fast curve crosses from bottom to top the slow curve, we have a long signal.When the fast curve returns below the slow curve, it is time to close the operation. We practically expect both curves to have the same color.

Which Timeframe to use for SuperTrend IndicatorAt first, we said that the SuperTrend has the advantage of being able to be used in every timeframe.In general, however, on intraday trading timeframes it loses its effectiveness, there is no single rule, it is advisable to make a few attempts on the financial instrument we intend to trade.Although it should always be remembered that the real trend exists only on long time frames, so from the daily up.

SuperTrend Indicator MultiTimeFrameAlways to limit false signals, we have built a SuperTrend Multi Time Frame indicator.You can find the article and indicator to download for free at this link.
How is ST Indicator calculated?
The ST is calculated based on a coefficient that is applied to the average volatility of the period considered.The Super Trend indicator is calculated using the Average True Range (ATR).The Average True Range is an indicator that calculates the average range of the last X seats and measures volatility.Once volatility is identified, the Super Trend is calculated by applying to the latter a volatility multiplier and a coefficient relative to the observation period over which volatility is calculated.It must always be borne in mind that the higher the weight of volatility, the wider the range of tolerance before a reversal of trend occurs.The SuperTrend Indicator Formula:Upper=(high+low)2+ (Multiplier∗ATR)Lower=(high+low)2− (Multiplier∗ATR)
Download Super Trend Indicator for Free
This is our custom Super Trend indicator coded in EasyLanguage for TradeStation and MultiCharts. You can download it for free.Download SuperTrend MultiCharts Indicator for FreeDownload SuperTrend TradeStation Indicator for Free
Conclusions
Is the ST Indicator a great indicator?The ST is, indeed, a great indicator.However, we always remember that when long sides are formed, the Supertrend generates many false signals, but it is still the biggest flaw of all the trending indicator.
Q&A
Can I use the ST for intraday trading? It is certainly possible to use it but we do not like it as a trading system because in the market the ongoing trend exists are on high timeframes. A correct ST trading strategy should be based on daily timeframes or higher.Is it the best trending indicator? For us it is the best trending indicator. The Super Trend Indicator is the one that provides fewer false signals, compared to parabolic sar for example Editors' Recommendations:SuperTrend Multi Time Frame IndicatorHow to AutoTrade DivergencesSuperTrend for TradeStation and MultiChartsHOW TO USE THE MOVING AVERAGES TO IDENTIFY THE TRENDCMO Indicator | Chande Momentum Oscillator | TutorialEasyLanguage TutorialFree EasyLanguage IndicatorEasyLanguage & PowerLanguage Tutorial - Time and DateIchimoku Indicator | Ichimoku Kinko Hyo | TutorialHow to read a Price Chart - Bar Chart - CandleStick - Kagi - Heikin AshiMoving Average: All about Moving Averages || 2020 TutorialThe Vortex Indicator || TutorialHow to Use the TradeStation Backtest to Analyze an InstrumentGraphic Technical Analysis - How to read a stock market chartsTutorial - Using EasyLanguage to Export Data From TradeStation to ExcelWhat is the Dow Theory in technical analysisYou can learn more about this indicator, reading these resources:Wikipedia Please insert your name and your email address. We will send you the Indicator for free !!! Your Information is safe with us. We respect your privacy! We will never share your data with anyone else who might. Please check your Junk E-mail folder Free Indicator for Multicharts Free Indicator for TradeStation Do you want to learn EasyLanguage & PowerLanguage for TradeStation and MultiCharts? Start here:EasyLanguage & PowerLanguage Master Tutorial A lot of free Indicators in EasyLanguage & PowerLanguage for TradeStation and MultiCharts: TradeStation and MultiCharts Indicators

Are you looking for a NinjaTrader SuperTrend? You can find it in the NinjaTrader Forum. Read the full article
0 notes
Video
tumblr
SIMPLE and PROFITABLE Forex Scalping Strategy - In this video you will learn SIMPLE and PROFITABLE Forex Scalping Strategy - Ichimoku Kinkō Hyō which you can easily use in your everyday trading from M1 to D1 and beyond. You will observe how price is moving precisely from one target to another making you money like you wouldn't imagine was possible. Live trading with me will open your eyes like it did to many already. Risk warning: Trading foreign exchange and futures on margin carries a high level of risk, and may not be suitable for all investors. The high degree of leverage can work against you, as well as to your advantage. Before deciding to invest in foreign exchange or futures, you should carefully consider your investment objectives, level of experience, and risk appetite. The possibility exists that you could sustain a loss of some or all of your initial investment and therefore, you should not invest money that you cannot afford to lose. You should be aware of all the risks associated with foreign exchange and futures trading, and consult with an independent financial advisor if you have any doubts. https://video.forexreview.top/simple-and-profitable-forex-scalping-strategy-1_79f60fec3.html by
0 notes
Text
Better Business With Ninjatrader

The Ninjatrader indicator happens to rank among the most widely known of all dynamic industry standards for the management of trade and other purposes for order entry. This amazing indicator was chiefly designed with the specific aim of catering for the requirements and needs of clients with for purposes of trade. Keep in mind that ATM (Advanced Trade Management) technology was the main reason why Ninjatrader has managed to excel in the wide field that encompasses the management of trade. To this end, the indicator under review helps to secure open arrangements of clients. Should you have any kind of queries with regards to wherever and tips on how to utilize ichimoku ninjatrader, you possibly can e-mail us with our internet site. It makes use of an approach that is predefined. It also helps to prevent losses and to enhance the overall profit that is made by the owner. It is amazing that all these achievements come about as a result of systems which are semi-automated working together to work in unison. These systems tend to change depending on the particular requirements of the clientele. For instance, you can rely on Ninjatrader for the enrollment of order, for stops and even on auto break even pauses among others. In the same way, these indicators will help you as a client to get a key solution that is uninterrupted. This key will have the competence that is required of automated strategies in the state of the art levels. A sequential way will be formulated so as to be able to meet the unique needs of client. This will start with the wide development of a plan and the construction of the same. After this happens, optimization will take place before testing is done using live imitation models. Then they will be installing live through some account or other. The efficiency and effectiveness of trade cannot be over emphasized. This is the main reason why people would generally tend to rely on Ninjatrader. Most of the potent features will be added to help in supporting clients at each and every phase of trade. Eventually, this will enhance your opportunities for trade whilst you are in the market. Moreover, Ninjatrader is acclaimed at the international level for making trading to be much more beneficial and easier. With this amazing indicator, you will only need to click a button to place or modify an order. This is done using ATM technology which has helped to semi- automate how trade is managed at a higher level than is expected. The indicator under question is also useful when it comes to conducting technical research. This is also the case with trade in the real time while making use of very sophisticated chart windows. A couple of the benefits you will receive will include very fast entry of order, scaling and exiting and modification and entry of orders on single clicks.
0 notes
Text
? LIVE Recorded: Gold trade with $20,000 profit in 2 days!
New Post has been published on https://hititem.kr/%f0%9f%94%b4-live-recorded-gold-trade-with-20000-profit-in-2-days/
? LIVE Recorded: Gold trade with $20,000 profit in 2 days!

Hey, everyone. That is Kei and i just started to file this GOLD forex chart are living. At present is on June 4th of 2019 and looking at some trade chance on this Gold chart. Now, as soon as I look at this chart, i noticed there’s a descending channel line and the rate broke upwards like three days in the past, and its been particularly robust bullish pattern after that and it continues going upwards. After the top and shoulder chart sample here, it went downwards, then it created W backside like chart sample, and it went straight up and the price even broke Ichimoku cloud and continues its bullish momentum.Sorry I forgot to say this but that is daily chart of Gold by the way. So i will seem for a purchase chance as I see this atmosphere. Presently the price looks right at these earlier shoulders stage so it probably resisted here and in all probability goes backwards. Nonetheless, Stochastics indicates now not fairly a just right sign, looks love it doesnt resonate with this atmosphere in daily chart of Gold. Here, it appeared divergence however right now, it gold crossed on the grounds that the price spiked excessive and thats something we can’t predict from this stochastics indicator. Lets seem at 1H chart now. Okay this is 1H chart of GOLD on 4th of June in 2019. And what do we see right here? Its been uptrend on account that may just thirtieth and has been renewing the larger price when you consider that then except the day gone by. The price used to be above Ichimoku cloud, and above relocating typical so folks who purchased at this diminish places, there were no factors to take profit unless today. The stochastics shows its been overbought due to the fact that could thirtieth and displaying inexperienced, which means above 70% for the reason that then, so i will see that this indicator will not be working on this parameter environment.But look whats happening at present. The environment transformed, correct? Absolutely. You will see that the momentum change as the rate doesnt damage latest absolute best anymore and its been making a range at present. The Bollinger Band is squeezing and charging its energy for the following transfer, and Stochastic goes down, so the purchase vigour is presently stopped and the market is watching for a path to interrupt both upwards or downwards. Nonetheless, as we noticed on a every day chart previous, the big principal development continues to be bullish, and for those who appear at the contemporary candle sticks, it indicates pin bar pointing downwards, proper? Which means theres some barrier here that price doesnt wish to go further down. All right, lets appear at 5min chart now.Good enough, this is the 5min chart of GOLD at present on the 4th of June. So, after the robust bullish trend, today it shows a entire variety as you’ll find. The rate goes up and down but latest price action indicates that theres a organization floor right here, like a powerful aid, right here, so let me place purchase, keep on. And location the discontinue loss proper after the order as at all times.. Correct now, the discontinue loss is about 35 or 36 pips down from the place I bought, slightly below the latest lowest. Very well, let me proceed to provide an explanation for whats happening right here. So after the steady bullish pattern until the day before today, today it simply stopped the trend in these days and began to create a variety.Whilst you look at the chart, you should detect these sort of differences seeing that when the momentum alterations, theres consistently a exchange chance. So, I positioned buy right here on the grounds that of, 3 factors. First, the large predominant tend in every day chart is on bullish so i’m looking for some place to buy. And secondly, the present rate level is moderately diminish a part of todays range so my first goal can be right here, making danger, reward ratio to be 1 to love 3, so its a just right cut price sale to me.Also the third cause is the stochastics on account that when you see it, it resonates the fee moves in this 5min chart, like when its gold crossed, it goes up and when its useless crossed, it goes down. So I see that the Stochastics is working on this atmosphere and now, the present rate is beneath 30% level because it suggests in crimson color and its simply gold crossed, so i am anticipating the rate to head up to the fundamental goal. Currently, its about eleven:00pm in Japan and The recoding was once stopped by hook or by crook as i have been just speaking to myself previous. However in any case, looks like i am getting confident outcome now and see whats gonna happen right here. Let me go to a toilet and do some stuff as maintain recoding this video. Wow, did you simply see what happened?? The price spiked up and got here back down. That is undoubtedly by means of some style of important news so i will check it later but for now, let me move the stop loss to fairly above the entry degree.The purpose is on account that every time this sort of surprising movement happens, the fee might spike on either course. So Its at all times trustworthy to comfy the account on this style of situation. You realize, I continually keep one factor in mind, its to not win but not to lose is way more principal seeing that then that you can appear for another chance however when you die, thats it for the sport, correct? Appears like its hitting the SL, yea, it did. Its adequate, i will appear for yet another chance to buy.Its about 1 and a half of hour later from the earlier recording. That is additionally 5min chart but after the cost hit my stop loss, seem how the cost kept going down and marked the recent lowest now. Once I seem at this chart, i spotted one thing, its the price motion. Like if you look at the cost motion earlier than and after the spike, to me, its exclusive. You understand how its distinct? Well, earlier than I give an explanation for, let me situation purchase right here and situation stop loss slightly below the prior lowest, which is about 20 pips beneath my entry. And the first goal stands out as the contemporary very best which is at this stage, so danger reward ratio will be 1 to three, which is a good game to play.Ok, back to the fee action. So you know how the rate motion is extraordinary before and after the spike? Well, when the price was going upwards, it took time. But when it goes backwards to the present rate degree, it didnt take so much time, it got here straight go into reverse. And at any time when the action takes much less time, each time the the cost strikes faster like this, theres a larger hazard that the cost will go to the reverse direction, in this case, going upwards. Ive obvious plenty of chart patterns like that in many forex pairs so thats one of the vital potentialities. Additionally, one other superb factor to look at is the divergence. You see how its developing divergence, where fee goes scale down lows and Stochastic shows cut down highs? That is called divergence and its one of the most signals of trend reverse. So along with the current fee stage thats hitting the latest low, I believe its a exceptional risk to buy here. Now sick let the time go via and see what its going to be. About 1 hour handed from the prior recording and i see some revenue walking.Now its like 1:30am middle of the night in Japan so i will go to bed every time quickly. However the price went above 20 pips from where I placed purchase and currently running about $four,000 of profit. Now its clear that the rate was supported at the contemporary lowest, stochastics is showing divergence, so i’ll transfer the stop loss right above my position in order that I wont wake up with some dangerous feeling with loss reduce day after today, just kidding, its half joking and half actual, however and i am expecting that the fee will go up and i believe it is going to.However we by no means know, in the event you see the fee motion, theres a descending pattern line right here, so it maybe resisted an additional time here would go back down from this present cost and i will get smash even. However its adequate, if thats the case, i’ll appear for a different risk to buy or sell or anything. Hopefully i will show you some good outcomes the next day to come. Until then, have a good night time and sweet dreams! Hey, excellent morning, Ohayougozaimasu! This is at eleven:00am on the 5th of June in Japan time. This morning after I aroused from sleep, I already established with my iPhone that the revenue is running so I simply took a rapid shower, had some breakfast, determine a couple of emails, then recording this video. Like I stated, this is 1H chart of Gold on fifth of June and that is where I purchased the day gone by and currently walking about 50 or 55 pips, walking over $11,000 of revenue. As you will see that, I purchased proper on the bottom of the contemporary lowest, proper on the bottom so i will be able to say that this is a excellent alternate and the alternate was once wonderful and ultimate as risk to reward ratio can be maximized.Now all i will assume is to keep going upwards and notice whats gonna happen. Now, tonight in Japan time, we have ADP employment trade in the united statesand other some monetary information so it might have some volatility then however for now, i’m anticipating the fee to interrupt upwards because the cost remains to be over Ichimoku cloud and Bolinger Band is squeezing so appears like its charging vigor to break on either course. Lets seem at 5min chart and notice extra special cost action. Good enough, it is a 5min chart. I feel this is where I was right here on my earlier recording and do not forget I said the cost would be resisted through this descending pattern line? Absolutely it did as soon as nevertheless it broke out upwards all of the way to the recent highest stage the day past, then it wend down slightly bit like 20 or 30 pips, then the price is in a variety state now.Look at the place the up to date lowest. It suggests like double backside like chart pattern and Stochastics shows divergence. So at this stage, I still see that the pattern remains to be in a bull pattern from this 5min chart. Now its like eleven:10am in Japan and i might be going to Yokohama in these days, the place theres wonderful sea port, park, and China city, so i’ll simply depart like this considering I dont consider the market wont transfer for the duration of Asian time anyhow. I could report to you with the aid of Instagram, Twitter, or facebook even as i am outside, but for now, I have got to get equipped to go. So i’ll see you tonight! Howdy, its Kei and that i just bought back from Yokohama and got here back home.That is 5min chart however seem how the cost stored going up. Its just about like 70 pips and making $33,000 revenue so far. The cost is breaking upwards and maintains its momentum. And stochastics as soon as confirmed over bought because it indicates in green color, but after that, the price still continues going up and appears like its gold crossed simply now. I still situation my discontinue loss at the entry stage so let me transfer it to someplace cheap which is this right below the contemporary lowest which is that this place, ensuring 39 pips, about $7,800 and aim for additional revenue. At this level, threat to reward ratio already is ready 1 to 2 so its already a excellent sport, however lets see how a lot extra i will be able to prolong the revenue. As I recounted earlier, now we have some most important news that would impact the GOLD market, so i will hold paying concentration to it. Ok, 5 hours handed after the previous recording. And once more this is 5min chart of Gold on the 5th of June. Now the price came back downwards and its strong. The volatility is pretty excessive in these days.When you look on the cost action, after it made 1, 2, 3, 4, 5 waves upwards, its developing downward waves of 1, 2, 3, four, 5 waves. And the rate is near the recent lowest right here, the fee possibly supported here and would come again up this way. Let me put Fibonacci here. Yea, if I put the fibonacci retracement between the latest lowest and contemporary absolute best, the rate is right at 61.8% so i’ll move the stop loss, or now that you can name it take revenue line, i will transfer it rather beneath this sixty one.8% degree.Its 102 pips, guaranteeing $20,480 USD and goal for extra revenue. Yes, I think this is quite reasonable to situation the profit line right here because of the fibonacci retracement and help line, and yea, that is good enough for now. If the fee breaks this line downwards, that implies the entire atmosphere has modified so its adequate, i will let the revenue be taken. Howdy, right now, its 1:20am in Japan time in a nighttime and after I opened the chart, I see that the revenue was once taken whilst I was observing some Anime. So, the price was no longer supported at this help line and it simply broke downwards. So the following state of affairs probably either the fee goes up after it reaches the latest lowest, or it continues to break downwards and still continue to create a range in 1H chart. Thats something that no person is aware of and its uncontrollable as you understand. The one thing we can manipulate is where to buy or promote, the place to position discontinue loss and when to take revenue, correct? All of the different things belong to the market and its whatever unpredictable.But today, I took a profit of somewhat over $20,000 so I won the sport and its good enough. And because the history shows, I positioned the purchase at 1302.87 and placed discontinue loss 20 pips beneath if you happen to recollect. And i took revenue at 1331.Eleven so how many pips I did I get? Its about 100 pips proper? So what was the risk reward ratio of the trade? The hazard was 20 pips and i received 100 pips so it was once 1:5 ratio, correct? So i can say that it used to be a lovely exchange. Every time you try to situation orders, consistently, constantly seem for a position the place theres reasonably extra competencies.Dont position an order in a middle of the variety or just with the aid of your instinct, however keep watching for a place that you have more talents like this, then you can make profits out of this zero-sum game in an awfully stable manner. Sincerely, i’m thinking to document a video about chance reward ratio and why its more principal than profitable price, perhaps in the course of this weekend a while, so stay tuned. I will put the hyperlink on the outline beneath so that you could have simpler entry to the video. Okay, i suppose thats it for today. Its nearly like 1:30am right here and Im going to mattress soon, so i will see you on the next video! Before you go away, please press a good button should you liked this video and please subscribe for my future movies.Cheers, bye. .
0 notes
Link
The Issue With Crypto Trading
For most, crypto asset trading is an arduous, cumbersome task. There are thousands of technical indicators, all of which are different, and just as many cryptocurrencies, most of which are illiquid, garbage, and not worth your time. Not only is trading time-consuming and difficult, but most, a purported 90% of speculators, lose money at the end of the day. In fact, a study has suggested the monkeys did just as good of a job trading stocks as the average human did. Yet, there’s hope in the form of experts and services that can help you.
The thing is, while you may not have time to pore over Bitcoin charts for hours on end, trying to find the next opportunity to scalp a relatively measly 5% profit, there are services that can help you in your journey. And WhalesTrader, a newfangled cryptocurrency trading platform, is looking to offer its users “cutting edge tools to eliminate learning time and increase your profits.” Let’s take a closer look.

Meet WhalesTrader
WhalesTrader, run by chief executive Gray Spark (trader, Youtuber, and the founder of Arabfolio Capital), is a multi-faceted platform that is focused on giving its users the ability to uncover the trading practices of market whales, large cryptocurrency holders that can move the market with a few clicks.
WhalesTrader’s platform act as a layer on top of Binance, Poloniex, and HitBTC. The platform, which connects to the aforementioned exchanges’ API, can generate buy signals and mark sell signals on short-term time frames and long-term frames. The company explains that if you use its analysis and indicators, you could see $100 swell into $4,420 over the course of six months, compared to just $143 with simple Ichimoku Cloud analysis. WhalesTrader also acts as an automated analysis tool, delving into order books and capital flows to determine where best to enter and close positions, trading ranges for a crypto asset, and when to avoid trading due to manipulation by whales and trading bots/algorithms. As the website further elaborates:
“Volume profile has all the tools you are used to analyzing how the total volume, Buy & Sell trades were distributed over any period of time to identify reliable price zones and liquidity patterns, such as absorption, exhaustion, and pullbacks.”
WhalesTrader is also much more functional than many base layer exchange interfaces. It gives the ability for traders to “iceberg” their orders, distributing large entries and exits over a number of smaller orders to prevent drastic movements in price due to the lack of liquidity in certain crypto markets. And, the platform itself is built for “light speed trading”, utilizing mouse gestures, like one-click trading, to increase the speed of trading by many times.
And, to put a cherry on top, a WhalesTrader premium subscription also gives users the chance to access a VIP Telegram Channel to get signals and daily updates from a community of traders and analysts, and a chance to get direct alerts from a Telegram bot that sends out messages when a “Blackwhale is manipulating coins.”
Academy
Not only does WhalesTrader have a trading platform, but an educational portal too, fittingly dubbed “Academy”. Offered in English and Arabic, WhalesTrader will teach you how to use their platform, the fundamental concepts of cryptocurrencies and blockchain, how to purchase Bitcoin, the best risk management practices, and ways to analyze volumes and technical indicators to build solid trading strategies. Academy is offered in three stages: fish, dolphin, and whale. The importance of Academy is described by WhalesTrader:
“It’s crucial that if you are starting in cryptocurrency trading, you need to learn and build a strong base of knowledge before starting. This will help you in making your journey easy & profitable in the future.”
Indeed, starting trading without a proper strategy and in-depth knowledge of technical indicators and trends in tow is detrimental, as by then, your trades would be nothing more than gambles.
In a market such as cryptocurrency, WhalesTrader provides investors with an edge, which allows them to enter the 10% of traders that actually make sustainable profit.
Title Image Courtesy of WhalesTrader
The post WhalesTrader: How Does This Platform Help Crypto Traders? appeared first on Ethereum World News.
0 notes
Text
WhalesTrader: How Does This Platform Help Crypto Traders?
The Issue With Crypto Trading
For most, crypto asset trading is an arduous, cumbersome task. There are thousands of technical indicators, all of which are different, and just as many cryptocurrencies, most of which are illiquid, garbage, and not worth your time. Not only is trading time-consuming and difficult, but most, a purported 90% of speculators, lose money at the end of the day. In fact, a study has suggested the monkeys did just as good of a job trading stocks as the average human did. Yet, there’s hope in the form of experts and services that can help you.
The thing is, while you may not have time to pore over Bitcoin charts for hours on end, trying to find the next opportunity to scalp a relatively measly 5% profit, there are services that can help you in your journey. And WhalesTrader, a newfangled cryptocurrency trading platform, is looking to offer its users “cutting edge tools to eliminate learning time and increase your profits.” Let’s take a closer look.

Meet WhalesTrader
WhalesTrader, run by chief executive Gray Spark (trader, Youtuber, and the founder of Arabfolio Capital), is a multi-faceted platform that is focused on giving its users the ability to uncover the trading practices of market whales, large cryptocurrency holders that can move the market with a few clicks.
WhalesTrader’s platform act as a layer on top of Binance, Poloniex, and HitBTC. The platform, which connects to the aforementioned exchanges’ API, can generate buy signals and mark sell signals on short-term time frames and long-term frames. The company explains that if you use its analysis and indicators, you could see $100 swell into $4,420 over the course of six months, compared to just $143 with simple Ichimoku Cloud analysis. WhalesTrader also acts as an automated analysis tool, delving into order books and capital flows to determine where best to enter and close positions, trading ranges for a crypto asset, and when to avoid trading due to manipulation by whales and trading bots/algorithms. As the website further elaborates:
“Volume profile has all the tools you are used to analyzing how the total volume, Buy & Sell trades were distributed over any period of time to identify reliable price zones and liquidity patterns, such as absorption, exhaustion, and pullbacks.”
WhalesTrader is also much more functional than many base layer exchange interfaces. It gives the ability for traders to “iceberg” their orders, distributing large entries and exits over a number of smaller orders to prevent drastic movements in price due to the lack of liquidity in certain crypto markets. And, the platform itself is built for “light speed trading”, utilizing mouse gestures, like one-click trading, to increase the speed of trading by many times.
And, to put a cherry on top, a WhalesTrader premium subscription also gives users the chance to access a VIP Telegram Channel to get signals and daily updates from a community of traders and analysts, and a chance to get direct alerts from a Telegram bot that sends out messages when a “Blackwhale is manipulating coins.”
Academy
Not only does WhalesTrader have a trading platform, but an educational portal too, fittingly dubbed “Academy”. Offered in English and Arabic, WhalesTrader will teach you how to use their platform, the fundamental concepts of cryptocurrencies and blockchain, how to purchase Bitcoin, the best risk management practices, and ways to analyze volumes and technical indicators to build solid trading strategies. Academy is offered in three stages: fish, dolphin, and whale. The importance of Academy is described by WhalesTrader:
“It’s crucial that if you are starting in cryptocurrency trading, you need to learn and build a strong base of knowledge before starting. This will help you in making your journey easy & profitable in the future.”
Indeed, starting trading without a proper strategy and in-depth knowledge of technical indicators and trends in tow is detrimental, as by then, your trades would be nothing more than gambles.
In a market such as cryptocurrency, WhalesTrader provides investors with an edge, which allows them to enter the 10% of traders that actually make sustainable profit.
Title Image Courtesy of WhalesTrader
The post WhalesTrader: How Does This Platform Help Crypto Traders? appeared first on Ethereum World News.
[Telegram Channel | Original Article ]
0 notes
Text
Do You Know With ParamountDax You Can Trade Directly From The Chart? (ATC)
New Post has been published on https://www.bestcoinlist.com/pr/do-you-know-with-paramountdax-you-can-trade-directly-from-the-chart-atc/
Do You Know With ParamountDax You Can Trade Directly From The Chart? (ATC)
Dear traders,
ParamountDax allow you to quickly and efficiently place and manage trades directly from the chart (Advanced Trading From The Chart), where you can drag them to the match price levels on your chart.
The ATC tools are available for carrying out market orders, limiting and stopping orders and orders for multiple assets. The main difference of ATC platform capabilities by ParamountDax exchange is the opportunity to set the price level in terms of the graphical showings. Unlike traditional trading, users set the price level graphically and interactively. The ATC options are available for traders worldwide due to the improved capabilities of the charting platform.
In this article, I show you what you need to know when it comes to choosing the type and the length of the perfect Trading From the Chart and the 4 indicators ways how to use when making trading decisions.
Technical indicators and how to use them to increase your profit
Indicators are additions or overlays on the chart that provide extra information through mathematical calculations on price and volume. They also tell you where the price is likely to go next. Technical trading involves reviewing charts and making decisions based on patterns and indicators
There are 4 major types of the indicator:
Trend indicators tell you which direction the market is moving in if there is a trend at all. They’re sometimes called oscillators because they tend to move between high and low values like a wave.
Momentum indicators tell you how strong the trend is and can also tell you if a reversal is going to occur. They can be useful for picking out price tops and bottoms. Momentum indicators include Relative Strength Index (RSI), Stochastic, Average Directional Index (ADX), and Ichimoku Kinko Hyo.
Volume indicators tell you how volume is changing over time, how many units of bitcoin are being bought and sold over time. This is useful because when the price changes, the volume gives an indication of how strong the move is. Bullish moves on high volume are more likely to be maintained than those on low volume.
Volatility indicators tell you how much the price is changing in a given period. Volatility is a very important part of the market, and without it, there’s no way to make money! The price has to move for you to make a profit, right? The higher the volatility is, the faster a price is changing. It tells you nothing about direction, just the range of prices.
Understanding these indicators will allow you to do technical analysis of the market, which can help you spot trends and capitalize on potential opportunities. As you can see, indicators are a great tool for you to use, they can help gauge trade entry, the direction of the market, and overall make you more confident to trade. ParamountDax is the unique platform in the market that offers key operations directly from the Chart. We are building the highest and unique exchange for the community. We know that the Community of traders is waiting for the launch of the platform, the ParamountDax team is very active in the development of the platform. With our ATC the traders can get better trading opportunities. Stay tuned for the date of the launch!
As always, your feedback and questions are welcome
Good luck! And see you soon!
Website: https://paramountdax.io/
View MVP: https://staging.paramountdax.com
And here’s how to get involved with the ParamountDax community:
Telegram: https://t.me/joinchat/LNehJxUX9sVoZabNrnaEZA
Twitter: https://twitter.com/ParamountDax
Facebook: https://www.facebook.com/Paramountdax-2024636494500768
Bitcointalk: https://bitcointalk.org/index.php?topic=5137789.0
Reddit: https://www.reddit.com/r/ParamountDax/
0 notes