#Fishbone Diagram
Explore tagged Tumblr posts
Visit Tumblr Blog
Explore Tumblr blogs with no restrictions, modern design and the best experience.
Last Seen Tumblr Blogs


Fun Fact
Tumblr has been providing a Korean-language service since 2013.
Text
“Inspection, Verification & Audit in the Automotive Industry”
“Inspection, Verification & Audit in the Automotive Industry: Key Tools and Best Practices for Quality Assurance” 🧰 1. Introduction In the highly competitive and regulated automotive industry, maintaining the highest standards of quality control is crucial. Whether you’re ensuring components meet specific measurements, verifying that designs match product specifications, or auditing processes…
#4m#4M analysis automotive#80/20 Rule#8d#audit#Automotive manufacturing#Automotive quality control#Benchmarking#Cause & Effect Diagram#Cause & Effect Diagram (Ishikawa/Fishbone Diagram)#Cause & effect diagram automotive#Customers#Failure Modes and Effects Analysis#Fishbone Diagram#FMEA#Gage R&R#IATF 16949 compliance#Inputs#Inspection#Ishikawa diagram#ISO 9001 standards#Machine#Man#Material#Method#Mistake-Proofing#Outputs#pareto analysis#Pareto Chart#Pareto chart in quality control
0 notes
Text


#cross stitching#pattern#cross stitch pattern#CS & NW April 1997#Easter#Contest winner#grand prize winner#Designed by Sherrie Nelson#He has risen#special stitch#Serpentine stitch#long arm cross stitch#satin stitch#herringbone stitch#scotch stitch#inverted warp#feather stitch#pin stitch#couching#florentine stitch#fishbone stitch#smyrna cross stitch#diagrams included
2 notes
·
View notes
Text
#fishbone#infographics#infographictemplates#diagrams#powerpointtemplates#powerpoint business templates
0 notes
Note
As someone with a similarly-spelled last name, to people keep pronouncing it s "Bahn" vs "Bone"? On anon to not reveal too much info!
I have heard it be pronounced more dry, like "bon" sounding closer to bone which is what I'm going for and what the pun is about (herringbone/fishbone diagram), but I'm unsure of the proper pronounciation, it may vary the same way my legal name is also pronounced different by english or spanish speakers but isn't teeechnically wrong in either...
2 notes
·
View notes
Note
okay then my question is what is your aversion to talking about the discrepancies of financial backing between jimin and jungkook from the company? why do you not want to discuss how jimin is the one who primarily filmed his production diary? he said from his mouth that evan is the one who would be in charge of the camera and set things up. it's tedious to comment on jimin's production output (from a shipper no less) and to not comment on the lack of company support in comparison to jungkook's output that has full company support. it'd be interesting to hear your thoughts on jungkook's documentary knowing full well how much money the company has put into his solo career.
Hello again anon,
Thank you for asking a question this time. As to why I have nothing further to discuss on this topic, it's simple. There's literally no way for us to accurately conclude what the root cause of the supposed differences in quality between the 'documentary' projects. It should be obvious but comparisons between JPD and JKs documentary are literally impossible right now. It hasn't even been released. But mostly because much of the evidence required for such an investigation will never be available to us as the audience and not participants in the production.
Allow me to further elaborate:
The widely-accepted process for such a question is to complete what's called a Root Cause Analysis (RCA). There are dozens of ways for approaching this, and one of the points of the RCA is to denote why any particular method was applied. It's not rare that multiple methods will be utilized for the same investigation either in cases where the Risk/Impact is high enough.
Here some diagrams of common methods:
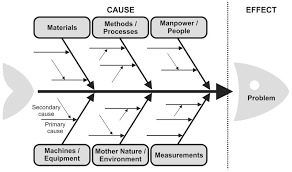


In this instance, I'd likely start with the fishbone diagram and the 6Ms because of the scale of touchpoints. But like I said in my original response to these, there is no way for us to know the details regarding the materials, methods, manpower, etc.
Theorizing is one thing if it's an enjoyable activity but I personally find no joy in fanwars, let alone in investigations that will be inconclusive by design.
So there's your reason why I have nothing to say on the topic now. Maybe I'll have some thoughts to share if I do see JKs documentary and once I'm able to watch all of the others that have already been released but who knows when that will be.
(As a sidenote, calling ppl shippers is not the insult you seem to think it is. I have an odd viewpoint when it comes to shipping spaces due to my ace/aro-ness but I'd recommend you drop that tactic as it doesn't seem to have the impact you're looking for.)
#jimin's production diary#JPD#BTS documentaries#never thought I'd be using this blog tk educate about RCA#i shoulda been clocked while I was writing this 🤣
6 notes
·
View notes
Text
Emerging Technologies - Week 1
It's the first week of class for the Spring Term, and this will be my 3rd semester. This week I learned about Gap Analysis, it is the process that companies use to evaluate the current state while also looking if they're meeting the expected outcome. If not, then the company will now identify what are the gaps or in-between issues, and what will be the best solution. More of auditing the current state to set up a good direction in the future.
Also, I have learned about the different tools, processes, templates, and reports of Gap Analysis. For the template, you have to identify what are Items being analyzed, the Current State, the Desired State, and what are the Existing Gaps. After you identify from the given template, you will now apply the six-step process for Gap Analysis. You have to be very detailed in working on these steps.
There are also six tools to use in Gap Analysis. And you can use one of each tools depending on the current situation of the business or the company.
First, we have the SWOT analysis, one of the most popular tools that is being used. This stands for Strengths, Weaknesses, Opportunities, and Threats. The second is PERT, you can use this tool if the project is complex and heavily time-dependent. Another is the Nadler-Tushman congruence model, unlike the SWOT that looks at schedules and timing, this tool focuses more on how different elements of an organization. Fishbone Diagram, this tool literally looks like a fish skeleton if you'll gonna look at the chart. Mckinsey 7-S model,it has 7 S's, structure, strategy, systems, skills, style, staff, and shared values. and Burke-Litwin Change Model, this model tackles the issue of change management identifying the 12 elements that influence an organization.
6 notes
·
View notes
Text
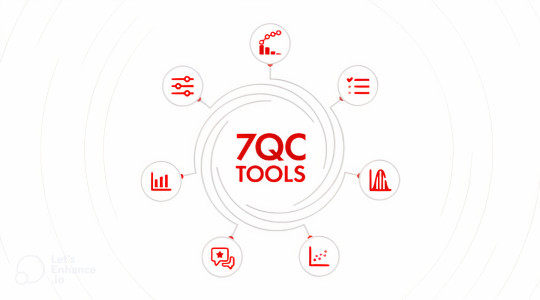
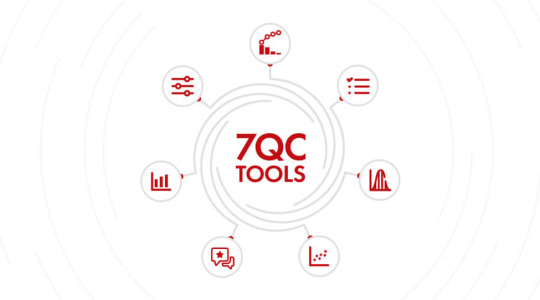
7 QUALITY CONTROL TOOLS FOR PROCESS IMPROVEMENT
“As much as 95 per cent of all quality-related problems in the factory can be solved with seven fundamental quantitative tools.”
-Kaoru Ishikawa, The inventor of Fishbone Diagram
In today’s customer-centric market, quality is an integral factor in the growth and sustainability of any business. Businesses go the extra mile to provide the best and excellent customer experience to ensure customer satisfaction. Hence, efficient quality management which has the highest impact on customer experience is one of the most essential features for any business.
Introduced by Kaoru Ishikawa, the seven basic tools of quality also known as 7QC tools are very effective in quality management and quality assurance process. So, businesses who want to ensure competitive and excellent quality of their products and services can utilize the proven 7QC tools for structuring a strategic plan for quality improvement.
LIST OF 7 QC TOOLS
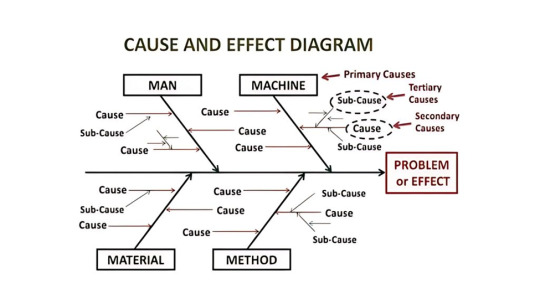
Cause and Effect Diagram
Cause and Effect Diagram also known as Fishbone Diagram helps in identifying the potential causes of an effect or a problem. In addition to sorting ideas in respective categories, it also helps in understanding the areas of opportunity through effective brainstorming. Fishbone training empowers you to identify the potential cause in the problem.
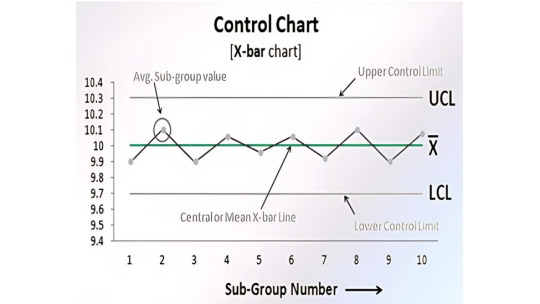
Control Chart
Control charts are used to study how the processes have changed over a period of time. Further, by comparing current data to historical control limits, one could lead to the conclusion about whether the process variation is consistent as in under control or unpredictable as in out of the control due to being affected by special causes of variation.
Pareto Chart
Pareto Chart is based on the 80/20 rule where it shows the significant factors that have the highest impact on the identified problem.
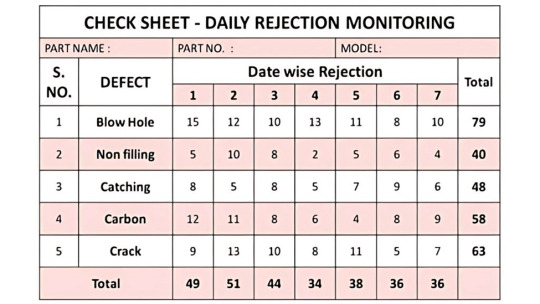
Check Sheet
Check sheet is a structured process which helps to collect and analyzing data. It is an effective tool that can be for a variety of purposes.
Histogram
Histogram is commonly used a graph that shows the data and its frequency of distribution to help users identify each different value in a set of data occurs.
Scatter Diagram
Scatter diagram shows the relationship between two important factors i.e. pairs of numerical data, one variable on each axis to demonstrate the relationship.
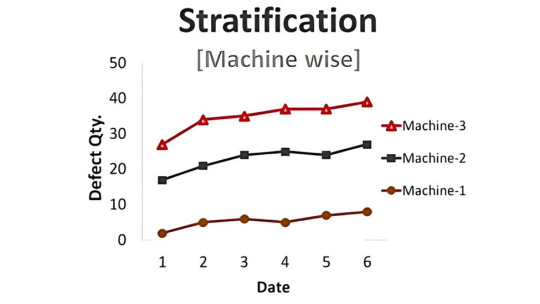
Stratification
Stratification also known as a flow chart or run chart is a technique that separates the data gathered from a variety of sources so that patterns can be seen i.e., the path an entity has taken through a defined process.
Utilizing the 7 QC tools in six sigma or quality management process helps in taking a systematic approach to identify and understand the risk, assess the risk, control fluctuation of product quality and accordingly provide solutions to avoid future defects.
WHEN SHOULD YOU USE 7 QC TOOLS?
7 QC tools can be carried out during the quality management, quality improvement process, six sigma implementation processes or even the regular PDCA cycle for the quality purpose for enhanced quality management.
In the first phase of measuring and identifying, Fishbone Diagram also known as cause and effect diagram, Pareto Chart and Control Chart can be utilized. In the next phases of assessment and analysis, Scatter Diagram, Histogram and Checklist can be carried out. The Control Chart can be utilized consistent quality improvement.
BENEFITS OF 7 QC TOOLS
The 7 QC tools are structured and fundamental instruments that help businesses improve their management and production process for achieving enhanced product quality.
From assessing and examining the production process, identification of key challenges and problems to controlling the fluctuation present in the product quality and providing solutions for prevention of defects in future, the easy to understand and implement, 7 QC tools are very effective. Some of the major business benefits of 7 QC tools are listed below.
Provides a more structured path for problem-solving and quality improvement
Easy to understand as well as implement yet extremely effective
A scientific and logical approach for problem-solving
Follows the 80/20 rule i.e. gain 80% result with 20% efforts
Improve the quality of product and services
Helps in identifying and analyzing problems during the process
Fishbone training aides in root cause analysis and problem-solving
Encourages team spirit and fosters a healthy culture
Identifies roots cause and solve it permanently
Enhance customer experience and customer satisfaction
Based on the data-driven process and customer-centric approach, 7 QC tools implementation is one of the most effective processes that too in the shortest amount of time.
4C team of certified professionals has provided 80+ implementation of 7 QC Tools and 120+ 7 QC Tools Training. By solving 200+ quality problems, 4C has empowered clients to reduce the 80% cost of poor quality. To accelerate your quality management process and reduce your cost of poor quality, contact our experts now.
#iso certification#iso certification consultants#iso consultancy#iso consultant#iso certificate online#iso certification in india
3 notes
·
View notes
Text
Lean Six Sigma in Education: A Roadmap To Better Student Outcomes
In today's evolving educational landscape, schools and institutions face mounting pressure to deliver improved student outcomes while managing limited resources. Lean Six Sigma (LSS), a methodology known for enhancing efficiency and eliminating waste, offers a transformative approach to education. By adopting LSS principles, schools can streamline operations, improve instructional quality, and boost student performance.
LSS is built on the DMAIC framework: Define, Measure, Analyze, Improve, and Control. In the Define phase, schools identify key improvement areas like curriculum delivery or student engagement. Measure involves gathering data such as test scores and attendance to establish baselines. In Analyze, root causes of inefficiencies are uncovered using tools like cause-and-effect diagrams and Pareto charts. Improve focuses on implementing solutions such as curriculum adjustments or process redesigns while Control ensures sustainability through regular monitoring and feedback loops.
Practical applications of Lean Six Sigma in education are widespread. It can enhance teaching by aligning lesson plans with student needs, improve support services like counseling by reducing delays, and optimize administrative functions like scheduling and resource allocation. These improvements can lead to significant benefits up to 30% increases in student satisfaction and 25% reductions in operational costs.
Tools such as Value Stream Mapping, Fishbone diagrams, 5S methodology, and Control Charts support this process by identifying inefficiencies and enabling data-driven decisions. For students, LSS promotes personalized learning, timely support, and higher academic achievement. For educators and administrators, it reduces workload, fosters collaboration, and boosts job satisfaction.
Despite its benefits, challenges such as resistance to change, limited resources, and lack of data can hinder implementation. These can be overcome by starting with small projects, securing leadership support, and fostering transparent communication.
The blog emphasizes that Lean Six Sigma is not merely a cost-cutting tactic but a comprehensive framework for building smarter, more efficient educational systems. It envisions a future where classroom learning is optimized, administrative burdens are minimized, and both educators and students thrive.
To begin this journey, educators can explore foundational books, join professional communities, practice with simulations, and pursue certifications starting from Yellow Belt to Black Belt. Lean Six Sigma equips schools with the tools and mindset needed to innovate, improve continuously, and ensure every student has the best chance to succeed.
0 notes
Text
Lean Six Sigma Green Belt is a globally recognized methodology focused on improving business processes by using data-driven techniques. This specific program emphasizes evaluating project performance metrics, making it especially relevant for professionals in Kolkata aiming to drive operational efficiency and quality improvement. The course follows the DMAIC framework – Define, Measure, Analyze, Improve, and Control – integrating Lean tools such as 5S, Kaizen, Poka-Yoke, and Value Stream Mapping to streamline processes and reduce waste.
Participants will gain deep insights into defining project objectives through tools like project charters, SIPOC diagrams, and CTQ trees. The Measure phase focuses on collecting accurate data, understanding process variations, and analyzing measurement systems using tools such as MSA and Gage R&R. It also includes calculating process capability indices like Cp, Cpk, DPMO, and PPM. In the Analyze phase, students learn to use hypothesis testing, regression analysis, Pareto charts, and fishbone diagrams to identify root causes. The Improve phase teaches Lean-based solutions like 5S, FMEA, and piloting improvem
0 notes
Text
Lean Six Sigma Training – Drive Data-Driven Improvement and Business Success
Lean Six Sigma Training is a powerful program that combines the speed and efficiency of Lean with the precision and data-driven approach of Six Sigma. Companies seeking to improve quality, reduce costs, and enhance customer satisfaction rely on Lean Six Sigma Training to build a culture of excellence.
The core of Lean Six Sigma Training lies in the DMAIC framework—Define, Measure, Analyze, Improve, and Control. Participants learn how to apply these five phases to solve process problems, identify root causes, and sustain improvements. With Lean Six Sigma Training, businesses can achieve near-zero defect rates and consistently meet customer expectations.
Professionals who complete Lean Six Sigma Training gain access to proven tools like:
Value Stream Mapping
Control Charts
Fishbone Diagrams (Ishikawa)
Pareto Analysis
Root Cause Analysis
Whether you are a quality manager, operations lead, engineer, or analyst, Lean Six Sigma Training gives you a competitive edge. This training is offered at multiple levels—Yellow Belt, Green Belt, Black Belt, and Master Black Belt—depending on your role and expertise.
Organizations that invest in Lean Six Sigma Training often report:
20-40% cost reductions
25-50% improvement in operational efficiency
Stronger compliance and risk management
Improved employee and customer satisfaction
Lean Six Sigma Training is ideal for industries like manufacturing, healthcare, IT, finance, and logistics. It empowers teams to make informed decisions using statistical tools, reduce process variability, and increase profitability.
Today, more than ever, data-driven improvement is critical to growth. That’s why Lean Six Sigma Training is no longer a luxury—it’s a strategic necessity.
#LeanSixSigma#LeanSixSigmaTraining#DMAIC#SixSigmaTools#QualityImprovement#ProcessExcellence#SixSigmaCertification#LeanMethodology#BusinessImprovement#ProblemSolving
0 notes
Text
“As much as 95 per cent of all quality-related problems in the factory can be solved with seven fundamental quantitative tools.”
-Kaoru Ishikawa, The inventor of Fishbone Diagram
In today’s customer-centric market, quality is an integral factor in the growth and sustainability of any business. Businesses go the extra mile to provide the best and excellent customer experience to ensure customer satisfaction. Hence, efficient quality management which has the highest impact on customer experience is one of the most essential features for any business.
Introduced by Kaoru Ishikawa, the seven basic tools of quality also known as 7 QC tools are very effective in quality management and quality assurance process. So, businesses who want to ensure competitive and excellent quality of their products and services can utilize the proven 7QC tools for structuring a strategic plan for quality improvement.
0 notes
Text
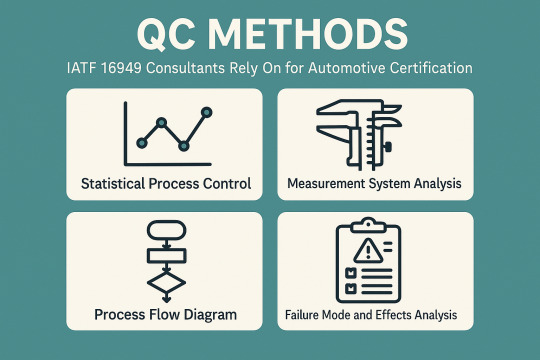
QC Methods IATF 16949 Consultants Rely On for Automotive Certification
In the competitive world of automotive manufacturing, quality is not something to strive for; it is imperative. Based on customer expectations, we must also ensure safety, reliability, and compliance with regulations. That’s where a globally recognized quality management standard designed specifically for the automotive sector comes into play in the form of IATF 16949.
IATF 16949 is more than a certification; it embodies a culture of continual improvement and process excellence. Becoming certified, though, is a labyrinth of requirements, documents, and audits. Here is where the role of IATF 16949 Consultants becomes crucial, as they help organizations navigate the process with their knowledge and clear insights.
Fundamentals of IATF 16949 in UAE
IATF 16949 is based on the fundamentals of ISO 9001, but with many automotive-specific requirements that are required for product development, production, and servicing. The main goal of IATF 16949 Certification in Abu Dhabi is to create a quality management system that promotes continual improvement, focuses on defect prevention, and reduces variation and waste in the automotive supply chain.
Main Goals of the Certification:
Maintain the quality of the products
Enhance customer satisfaction
Increase productivity in the manufacturing process
Create a culture of continual improvement
Benefits of the Certification:
Increased reliability and performance of the product
It increases the credibility in the market, and also the customers start trusting the product.
Easier access for global automotive supply chains
Lower operational costs and recall costs
As IATF 16949 Certification Consultants, your role is to ensure organizations meet the exacting standards of IATF 16949, thereby enhancing their organizational processes.
The IATF 16949 standard process can be lengthy and requires a lot of documentation, internal audits, and compliance reviews. Enter consultants to the rescue.
Benefits of Hiring a Consultant:
Quicker: It reduces the process of implementation and certification.
Quality: Prevents costly mistakes and unsuccessful audits.
Risk Mitigation: You are prepared to meet compliance and customer expectations
Widely-used QC Tools in IATF 16949
To get the correct products, organizations implement Quality Control (QC) tools. IATF 16949 Consultants in Dubai are essential to help solve problem diagnosis, process control, and decision-making.
Significant QC Tools:
Cause-and-Effect Diagram (Fishbone or Ishikawa): Assists in determining the root causes of quality and performance problems.
Collects Real-time data for analysis, check Sheet
Control Chart: Control charts are used to test process stability.
Histogram: Shows how the data is distributed to identify variability.
Pareto Chart: Emphasizes significant problems through the 80/20 rule.
Scatter Diagram: This shows the correlation between two different variables.
Process Diagram: Charting out process steps, using this step to identify; Also helps identify dead ends or redundancies
Tools Related to Advanced Quality Planning (Core Tools):
APQP (Advanced Product Quality Planning): A framework for product and process design.
PPAP (Production Part Approval Process): Verifies that a product meets the customer needs of design needs before bulk production.
Failure Mode and Effects Analysis (FMEA): Assesses potential risks in products and processes.
MSA (Measurement System Analysis): Evaluates the accuracy and precision of the measurement systems.
Statistical Process Control (SPC): Utilizes statistical techniques to monitor and control processes.
The Role of QC Tools in the Quality Systems:
Resolution: If the issue is recurring, trace back the roots and take preventive measures
Maintain Consistency: Process control
Decision-Making: Focus your actions on objective data and trends.
Continuous Improvement: This principle involves the concept of constant improvement.
Tools for Quality Control Implementation of IATF 16949
It is also worth noting that the above QC tools are not just theoretical but are embedded in the DNA of IATF 16949 Certification in Dubai.
How do QC Tools Help Compliance?
FMEA reinforces risk-based thinking, which is a fundamental requirement.
Ongoing validation and monitoring of process: Control Charts and SPC
Corrective actions based on the data based on Pareto Charts and Histograms
APQP and PPAP are structured for the planning and validation of a product.
Example Scenarios:
One of the quality suppliers identifies repetitive defects in a certain part by Pareto analysis and resolves it by Fishbone diagrams and FMEA.
MSA and SPC data are used by an organization during PPAP submission to demonstrate process capability and measurement reliability.
Consultant's Role:
Based on certain challenges, recommend tools.
Develop templates, offer training, and provide software solutions.
Tools must be used effectively and in compliance with expectations.
While the benefits are numerous, many organizations struggle with certification.
Common Obstacles:
A failure to understand the requirements.
Documentation that is incomplete or poorly maintained.
Inconsistent use of QC tools.
Resistance to change or continuous improvement at the community level.
Mistakes in using QC tools or the wrong tools used:
Tools that do audits but are not used for decision-making.
Data that has been collected but not processed or acted on.
Staff was trained never to read charts and metrics
How IATF 16949 Consultants Help in Dealing with Challenges?
Analyze requirements, discover commonalities, and factor them into incremental steps.
Educate staff on how to use the tools correctly.
Get them involved and make it real with workshops and real-world scenarios.
Develop a sense of quality across the organization.
Conclusion
The IATF 16949 is not only a badge but a testament to excellence, consistency, and customer satisfaction in the automotive industry. Expert guidance and practical tools are needed in order to reach and maintain this standard.
IATF 16949 Consultants in UAE know what has gone wrong in the past and the strategies, processes, and ways of thinking that will help a company successfully implement the standard and prepare for and respond to audits. On the other hand, QC tools are the eyes and ears of your quality management system, detecting problems and informing decisions.
Collectively, they enable automotive suppliers to raise the bar in the industry. Investing in expert consultants and embracing QC tools is not just smart—it's essential for any organization seeking sustainable growth and operational excellence.
0 notes
Text
7 QC Tools for Quality Improvement in Manufacturing & Services Industries
In our competitive business climate today, consistently providing a quality product or service is not a choice, it is necessary. Whether in the manufacturing or service industry, the task of fulfilling expectations of a customer requires tools that help you to identify the problem, analyze the data, and the process of improvement. This is where the 7 QC (Quality Control) Tools come into play.
The 7 QC Tools are simple, effective, and applicable to everyone; they are the basis for quality improvement for all industries. Let’s take a look at each of these tools and how quality can provide value to you in your work.
What Are the 7 QC Tools?
The 7 QC Tools are basic statistical tools developed by Kaoru Ishikawa, a Japanese quality expert, to improve product and service quality. They are:
Cause-and-Effect Diagram (Ishikawa or Fishbone Diagram)
Check Sheet
Control Chart
Histogram
Pareto Chart
Scatter Diagram
Flow Chart (Process Mapping)
These tools help teams in problem identification, root cause analysis, monitoring processes, and decision-making — critical to achieving Total Quality Management (TQM) and continuous improvement.
1. Cause-and-Effect Diagram (Fishbone Diagram)
Also known as the Ishikawa Diagram, this tool is used to identify the root causes of a problem by categorizing possible causes into groups such as:
Man
Machine
Method
Material
Measurement
Environment
📈 Use Case:
In a manufacturing plant, if there’s a defect in the product, the Fishbone Diagram helps break down and analyze every possible factor that could be causing it.
In a service company, it could be used to find why customer complaints have increased.
2. Check Sheet
A Check Sheet is a structured, prepared form used to collect real-time data at the location where it is generated. It's one of the simplest and most effective tools for tracking how often a problem occurs.
📈 Use Case:
In manufacturing, it might track the number of defects per shift.
In services, a call center might use it to log the types of issues customers report.
3. Control Chart
Control Charts are used to monitor process variation over time and determine whether a process is in a state of control.
It distinguishes between:
Common cause variation (normal)
Special cause variation (abnormal)
📈 Use Case:
A manufacturing process using machinery can track the consistency of product dimensions.
In services, a control chart could monitor average call handling time to ensure it stays within set limits.
4. Histogram
A Histogram is a graphical representation of data distribution. It shows how often each different value in a set of data occurs.
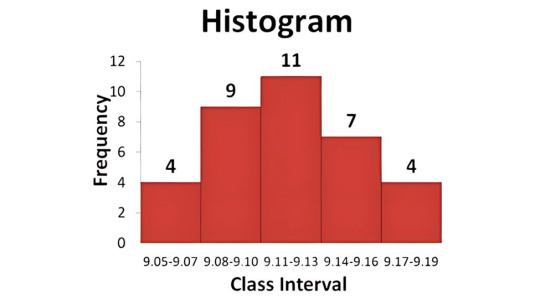
📈 Use Case:
In manufacturing, it helps identify the spread of measurement values, like length or weight.
In services, it can show customer satisfaction ratings to identify performance trends.
5. Pareto Chart
Based on the 80/20 rule, the Pareto Chart helps prioritize problems by showing which causes contribute most to an issue.
It ranks issues from most to least significant, so teams can focus on the "vital few" rather than the "trivial many."
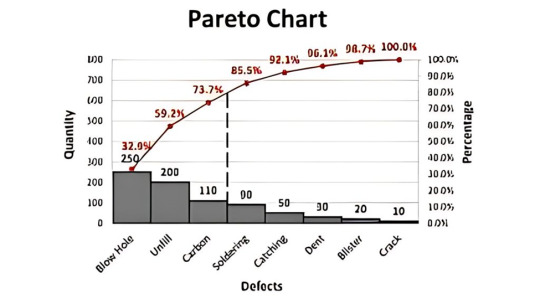
📈 Use Case:
In manufacturing, it helps identify which types of defects occur most frequently.
In services, it can identify the top reasons for customer complaints or service delays.
6. Scatter Diagram
A Scatter Diagram shows the relationship between two variables. It helps determine if a change in one factor affects another.
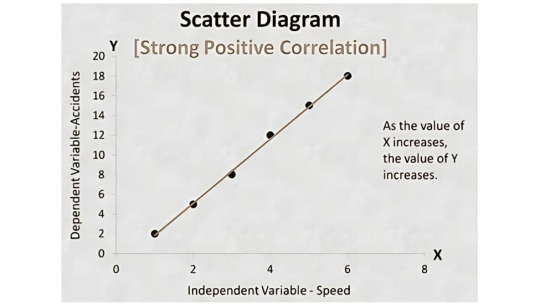
📈 Use Case:
In manufacturing, you could study the relationship between machine maintenance frequency and product quality.
In services, it might analyze how employee training hours affect customer satisfaction scores.
7. Flow Chart (Process Mapping)
A Flow Chart maps out every step in a process, helping visualize workflows and identify unnecessary steps, delays, or bottlenecks.
📈 Use Case:
In manufacturing, it can map out an assembly process to find inefficiencies.
In services, it can improve the flow of customer onboarding or complaint resolution processes.
Benefits of Using 7 QC Tools in Manufacturing
Reduces defects and rework
Increases productivity and process control
Improves product consistency
Increases the effectiveness of decision making when using data to support decisions
Improves customer satisfaction and retention
Benefits of 7 QC Tools in Services Industry
Improves service delivery time
Reduces customer complaints
Improves employee performance through better processes
Enables proactive problem-solving
Supports a culture of continuous improvement
How to Implement the 7 QC Tools in Your Organization
Step 1: Train Employees
Start with basic training on each QC tool so that employees understand when and how to use them.
Step 2: Identify Problems
Pick a real problem that affects your quality, such as high defect rates or customer dissatisfaction.
Step 3: Choose the Right Tool
Each tool has a unique function. Select based on what you want to analyze — root cause, trends, relationships, etc.
Step 4: Analyze Data
Use the tool to collect and interpret data. Look for patterns, trends, or anomalies.
Step 5: Take Action
Based on the analysis, make informed decisions and implement process improvements.
Step 6: Review & Improve
Monitor the results of your changes and keep refining your processes.
How 4C Consulting Can Help
With experience of working with over 2500+ clients and delivering more than 15,000 hours of quality training, 4C Consulting is your expert partner in implementing QC tools, ISO standards, and quality improvement frameworks.
Our consultants will:
Provide hands-on training on 7 QC Tools
Help create customized checklists, charts, and templates
Assist in integrating these tools into your Quality Management System
Support your team in problem-solving and performance tracking
Ready to improve your quality processes? 👉 Talk to our experts today for a free consultation!
#7 QC Tools#Quality improvement tools#QC tools in manufacturing#QC tools in service industry#How to use 7 QC tools#Basic quality control tools#Problem-solving tools for quality#7 QC tools implementation#Quality management tools
1 note
·
View note
Text
Conducting Effective Business Process Improvement

Business Process Improvement (BPI) is the systematic approach to helping an organization optimize its core processes for greater efficiency, effectiveness, and adaptability.
1. Understand the Current State ("As-Is")
Map Out Existing Processes
Use process mapping tools like:
SIPOC (Suppliers, Inputs, Process, Outputs, Customers)
Flowcharts
Value Stream Mapping (VSM)
Collect Data
Key metrics: Cycle time, error rates, cost per transaction, throughput
Interview stakeholders, observe workflows, review logs and KPIs
Tip: Get cross-functional input to avoid blind spots.
2. Define Clear Goals and Metrics
Use the SMART framework:
Specific – What process needs to improve?
Measurable – What metrics define success?
Achievable – Is it realistic with current resources?
Relevant – Does it align with strategic goals?
Time-bound – When should results be achieved?
Examples:
Reduce invoice processing time by 40% in 90 days
Eliminate 80% of manual handoffs in customer onboarding
3. Analyze the Root Causes
Use proven diagnostic tools:
5 Whys Analysis
Fishbone (Ishikawa) Diagram
Pareto Analysis (80/20 rule)
Process mining tools for digital workflows
Look for:
Bottlenecks
Redundancies
Manual tasks that could be automated
Communication failures
4. Design the Improved Process ("To-Be")
Use Lean, Six Sigma, and Agile Principles:
Eliminate waste (Lean: TIMWOOD – Transport, Inventory, Motion, Waiting, Overproduction, Overprocessing, Defects)
Reduce variation (Six Sigma)
Shorten feedback loops (Agile)
Redesign for:
Simplicity
Speed
Scalability
Automation where possible (e.g., RPA, workflow platforms)
Create To-Be maps, RACI charts, and updated SOPs.
5. Implement the New Process
Focus Areas:
Change Management – Train teams, communicate clearly, and manage resistance
Pilot Testing – Try improvements on a small scale before a full rollout
Project Management – Use agile sprints or phased rollouts to maintain momentum
Key Tools:
Communication plan
Training modules
Feedback loops (daily standups, weekly reviews)
6. Monitor, Optimize, and Sustain
Track KPIs:
Real-time dashboards
Weekly metrics reviews
Before vs. after comparisons
Continuous Improvement:
Encourage feedback from frontline users
Use Kaizen or PDCA cycles to keep iterating
Build a culture of accountability and excellence
7. Document and Standardize
Finalize new SOPs and documentation
Create playbooks or handbooks
Assign process owners for ongoing accountability
Tip: Use a centralized knowledge base or BPM tool to manage version control.
Bonus Tools & Frameworks
Tool/MethodUse CaseLean Six Sigma (DMAIC)Structured process improvementBusiness Process Model and Notation (BPMN)Process design and documentationKPI Tree / Metrics TreeLinking process improvements to business goalsVoice of the Customer (VoC)Ensure customer impact is central to changes
Summary Cheat Sheet
StepFocus1. Assess Current ProcessMap + Measure2. Define GoalsAlign with business impact3. Root Cause AnalysisFind what's broken4. Design Future StateLean + tech + feedback5. Implement ChangesTraining + testing + rollout6. Measure & ImproveMonitor, adapt, optimize7. Document & SustainSOPs, ownership, culture shift
0 notes
Text
The Art of Creative Problem Solving
We all have creative potential but we need to learn how to apply our creativity to succeed in our personal and professional lives. This course guides you through the steps taken to develop your creativity and critical thinking skills. We explain how to combine creativity and innovation to solve complex problems. We help you to hone your decision-making skills and develop a workplace culture in which thinking ‘out of the box’ is the norm.
What You Will Learn In This Free Course
Explain how to find the root cause of a problem
Discuss using different problem-solving models to find the best solution to any problem
Outline Tim Hurson's ‘Productive Thinking Model’ used in creative problem solving
List the problem-solving tools used to address challenging issues
Explain how to use fishbone diagrams to solve problems
Discuss ways to improve decision-making skills and make good collective decisions
Define ‘critical thinking’ and outline the characteristics of a critical thinker
Distinguish between ‘creativity’ and ‘innovation’ and compare their role in problem solving
Summarise the role of creativity and innovation in business
Define ‘group creativity’ and the application of the ‘Recognise, Anticipate and Problem-solve’ (RAP) model
Explain how to use analogies, metaphors and mind-mapping to solve problems creatively
#free course#online courses#course#online course creation#education#online#educate yourself#workout#knowledge#health and wellness#problem solving#free guide#free diploma#freeguide#positive mental attitude#actually mentally ill
0 notes
Text
Master Operational Excellence with Lean Six Sigma Green Belt + Black Belt Combo Certification

In today’s competitive business environment, organizations constantly strive for improved efficiency, quality, and customer satisfaction. This is where Lean Six Sigma certification training becomes invaluable. By integrating Lean’s focus on waste reduction with Six Sigma’s emphasis on defect minimization, professionals can drive powerful, measurable improvements in business processes. For those aiming to make a significant impact, a Lean Six Sigma Green Belt + Black Belt Combo Certification Course offers a comprehensive, accelerated path to expertise.
What Is Lean Six Sigma?
Lean Six Sigma is a proven methodology that blends two powerful process improvement techniques, Lean and Six Sigma. While Lean emphasizes eliminating waste and streamlining operations, Six Sigma focuses on reducing variability and improving quality through statistical tools and data analysis. Combined, these methods form a powerful framework for achieving operational excellence.
Why Choose a Green Belt + Black Belt Combo Course?
Traditionally, Lean Six Sigma certification are pursued in stages—starting with Yellow Belt, moving to Green Belt, and culminating in Black Belt. However, many professionals are now opting for a combo course that combines both Lean Six Sigma Green Belt certification and Lean Six Sigma Black Belt certification into one integrated training. Here’s why this is an excellent choice:
Faster Career Progression: Combining both levels accelerates your learning and positions you for leadership roles sooner.
Comprehensive Knowledge: You gain a deep understanding of Lean Six Sigma principles, tools, and techniques, from intermediate to advanced levels.
Cost-Effective: A combo course is often more economical than enrolling in each course separately.
Immediate Application: The program enables you to apply concepts from both Green and Black Belt levels in real-time, solving complex business problems more effectively.
What You’ll Learn in a Lean Six Sigma Certification Training Course
A well-structured Lean Six Sigma Certification Training Course covers both theoretical foundations and practical applications. Here's an overview of what you can expect from a Green Belt + Black Belt combo course:
Green Belt Topics:
Fundamentals of Lean and Six Sigma
DMAIC (Define, Measure, Analyze, Improve, Control) methodology
Process mapping and value stream analysis
Root cause analysis tools like 5 Whys and Fishbone Diagram
Statistical tools using Minitab or Excel
Introduction to hypothesis testing and control charts
Black Belt Topics:
Advanced data analysis techniques
Design of Experiments (DOE)
Failure Mode and Effects Analysis (FMEA)
Advanced control charts and capability analysis
Lean enterprise concepts
Change management and project leadership skills
Integration of Lean tools in Six Sigma projects
By the end of this Lean Six Sigma course, learners are expected to lead high-impact projects, mentor Green Belts, and make data-driven decisions that drive business success.
Who Should Take This Course?
This combo certification course is ideal for:
Mid-level professionals aiming for senior roles
Project managers and quality managers
Engineers and process improvement specialists
Entrepreneurs and business owners
Professionals in manufacturing, IT, healthcare, finance, and service sectors
Whether you're transitioning into a leadership role or managing enterprise-wide quality initiatives, this course will provide the tools and knowledge to drive transformation.
Key Benefits of Lean Six Sigma Training
Career Advancement: Lean Six Sigma professionals are in high demand across industries. Earning a Green Belt + Black Belt combo certification opens doors to roles such as Process Improvement Manager, Operations Director, and Quality Lead.
Higher Salary Potential: According to industry reports, certified Lean Six Sigma professionals earn significantly higher salaries than their non-certified counterparts.
Improved Organizational Performance: Your ability to lead cross-functional teams and deliver quantifiable results makes you an asset to any organization.
Globally Recognized Credential: The certification is recognized worldwide, adding credibility to your professional profile.
What Makes This Certification Course Unique?
A top-tier Lean Six Sigma certification training course goes beyond theoretical learning. It offers:
Interactive learning formats include case studies, simulations, and real-world project work.
Mentorship and support from experienced Master Black Belts.
Globally recognized certification aligned with ISO 13053 and IASSC/ASQ standards.
Flexibility with self-paced, live online, or classroom training options.
Final Thoughts
The Lean Six Sigma Green Belt + Black Belt Combo Certification Course is more than just a professional credential; it’s a transformation tool for both individuals and organizations. By mastering this powerful methodology, you gain the skills to solve critical business problems, lead with confidence, and contribute meaningfully to your organization’s growth and efficiency.
If you're ready to elevate your career and become a change leader, enrolling in a Lean Six Sigma Certification Training Course could be the smartest investment you make this year.
0 notes