#Deep Decarbonization
Explore tagged Tumblr posts
Visit Tumblr Blog
Explore Tumblr blogs with no restrictions, modern design and the best experience.
Last Seen Tumblr Blogs


Fun Fact
In 2020, 27% of US Tumblr users had an annual household income of over $100,000.
Text
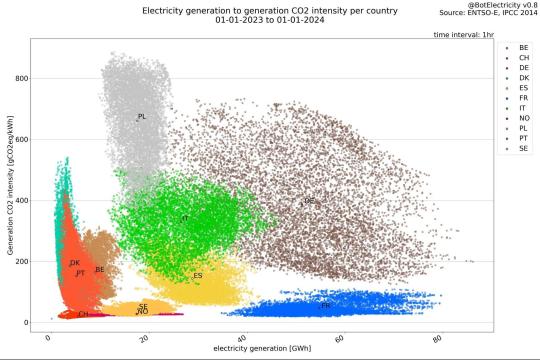
This hourly diagram of electricity production and emissions for eleven European countries over the course of 2023 is honestly fascinating.
The lowest emissions, unsurprisingly, are found in Norway (hydro), Sweden and Switzerland (hydro plus nuclear, although Switzerland has yet to abandon its “nuclear phase-out” policy), and France (nuclear). The highest are in Poland, which burns coal very heavily. And Germany varies wildly.
But we can also see, for instance, that Poland has a very narrow range in its production of electricity. So does Denmark, perhaps suprisingly ― although, contrary to what you might expect, Denmark is not among the top 10 countries in the world by share of wind power, according to OECD-IEA. We can guess that Norway’s very broad range of output variation reflects the use of its hydro plants to follow the variations in the Danish load.
Belgian output is also in a fairly narrow band, and we can likewise guess that a part of the large variation in French output is to compensate for that. German output, on the other hand, is all over the map because of variations in supply, not correlated with load.
What inferences can you draw?
#split don't emit#not a climate leader#europe#deep decarbonization#atomic power to the people#quantitative reasoning
3 notes
·
View notes
Text
It is certainly true that the Earth is vast and its natural systems are complex. One result is, in effect, a great number of feedback loops, some of them incorporating time–delays which are long compared to the human lifetime. Therefore, it may be difficult to discern the effects of actions we take now, because of the continuing effects of what has already happened. And not seeing immediate results tends to be extremely discouraging.
One thing that seems certain is that whatever is coming will be easier to meet with more energy, whether that be for cooling overheated housing, or desalting seawater to cope with a lack of rainfall, or pumping water out of low–lying areas…
Fission can provide vast amounts of energy with minimal environmental disturbance. Even as practiced now, inefficiently, its associated emissions are less than those for wind or solar, as recognized in IPCC reports ― and it efficaciously displaces the burning of fossil fuels, which wind and solar have persistently failed to do. It is also less affected by environmental conditions, such as changes in the patterns of wind and sunshine. The point is, a global transition to nuclear energy will give many benefits which are clearly tangible in the here–and–now, as well as helping to limit future climate risks.

DR ADAM LEVY ClimateAdam ROSEMARY MOSCO
34K notes
·
View notes
Note
I didn't realize carbon capture was a real thing that actually worked (outside of trees, of course!)
Hi Anon!
It is a real thing and it does work! The big caveat is that it definitely isn’t a standalone solution to climate change, but it’s a real technology that has helpful applications in mitigating the climate crisis.
A lot of carbon capture occurs at the emissions source, to capture the carbon dioxide and either pump and store it deep underground or run it through algae scrubbers or a chemical process to capture the carbon dioxide as biofuel, reusable plastic, or other materials.
The caveat here is that a lot of folks are rightfully worried that focusing too much on carbon capture will give the powers that be an excuse to drag their feet in cutting emissions and decarbonizing. Why worry about changing the status quo if a magical technology will come along to bail us out by pulling all those emissions right back out of the air?
Carbon capture also has a lot of significant limitations, such as the amount of energy required to fix a relatively small amount of carbon dioxide. This isn’t my area of expertise, but my understanding is that this technology will probably be most applicable to capture emissions for industries that will be particularly difficult to decarbonize—for example the creation of certain materials that are either exceptionally energy-intensive or inherently release carbon dioxide in their creation (like cement).
So very cool technology, but it’s not going to make a big enough impact on climate change without us also significantly reducing emissions. And it’s not going to replace planting and protecting trees, since nature’s carbon capture is still usually much more energy and resource efficient (as well as all the habitat and climate control benefits)!

165 notes
·
View notes
Text
Excerpt from this story from Anthropocene Magazine:
U.S. states can decarbonize on their own for about the same price as a federal-led effort to reduce emissions by the same amount, according to a new study. The findings underline that a “coalition of the willing” could not bring the country to net-zero emissions on its own. But they also represent a hopeful vision of how climate action in the U.S. could continue despite Trump Administration rollbacks.
The Biden Administration pursued ambitious decarbonization policies via the Inflation Reduction Act and other initiatives, while the Trump Administration has taken a very different approach to climate policy. The situation highlights the volatility of national-level climate action in the United States, even as the American public broadly supports developing alternative energy sources, and urgent action is needed to avoid locking in fossil fuels with new infrastructure.
Enter “climate federalism,” a concept that casts U.S. states as laboratories not just of democracy but of climate action. In theory, this bottom-up approach might be more effective and durable than top-down action. In the new study, researchers sketch out what it might look like in practice.
“Ultimately the most important takeaway here is that state-led action can achieve substantial emission reductions, even without federal support, but that the world looks very different from one where there is federal coordination,” says study team member Jeremiah Johnson, an environmental engineer at North Carolina State University. “This has some important implications, not just for those states that choose to participate, but also for those who don’t.”
Johnson and his colleagues identified 23 U.S. states that are most likely to pursue net-zero emissions by 2050, based on the number of climate policies currently on the books as well as their overall political leanings. They fed publicly available energy system data into a computer model to estimate the cost of decarbonization and predict the green technologies that the states would likely turn to in their efforts.
Action by this group of states could reduce U.S. greenhouse gas emissions by about 46% by 2050, the researchers report in the journal Nature Communications. The researchers then used the same model to explore what federally coordinated action to reduce national emissions by the same amount would look like.
Federal led climate action would be about 0.7% cheaper than state action, the researchers found. “We were surprised [the state-led] emissions reductions would be achieved at costs comparable to federal actions,” Johnson says. Since only about half of U.S. states were expected to pursue net-zero emissions, “we expected to see this considerably push up the costs of achieving deep decarbonization.”
However, the mix of green technologies that would be used in a state-led decarbonization effort would be different from the federally coordinated one. The state-led effort would lean heavily on green manufacturing technologies to decarbonize industry, while the federal approach would rely more on clean energy such as solar and wind power.
The net-zero states would likely rely on electrification to reduce emissions from transportation and industry, as well as direct air capture to neutralize residual emissions. They might also purchase more electricity from neighboring states, leading to the potential for “emissions leakage.” In the state-led scenario, “we observed substantial new electricity exports from the Great Plains states into the Upper Midwest while those exporting states increased fossil fuel-based use,” Johnson says. “This would undercut the efforts of net-zero states unless their policies are designed to address this.”
The state-led scenario also leaves some cost-effective mitigation opportunities on the table, such as bioenergy with carbon capture and storage in the Southeastern United States, where states are unlikely to pursue decarbonization without federal action. Still, if state-led action is the only option, this can lead to substantial progress on climate, the study shows.
7 notes
·
View notes
Text
Sustainable Aviation Fuel Market Disruptors: Who’s Leading the Clean Sky Race?

The Sustainable Aviation Fuel market is transforming the future of aviation. As the global aviation industry intensifies its transition toward net-zero emissions, SAF emerges not just as an alternative fuel-but as a cornerstone for environmental accountability, industry resilience, and long-term growth. This article provides a deep dive into the evolving SAF ecosystem, covering market dynamics, technological advances, regulatory influence, competitive landscape, and regional penetration.
Request Sample Report PDF (including TOC, Graphs & Tables): https://www.statsandresearch.com/request-sample/40533-global-sustainable-aviation-fuel-market
Explosive Sustainable Aviation Fuel Market Expansion Driven by Decarbonization Goals
The Sustainable Aviation Fuel market stood at USD 1,125 million in 2023 and is projected to soar to USD 25,367.2 million by 2031, registering a staggering CAGR of 60.8%. This exponential growth is fueled by intensifying global mandates for decarbonization and the aviation sector’s urgent need to mitigate its substantial carbon footprint.
Key stakeholders—including governments, aviation operators, and energy innovators—are investing heavily in SAF production, infrastructure, and logistics. Airlines are entering long-term offtake agreements to secure future supply, while countries integrate SAF mandates into national energy and climate frameworks.
Get up to 30%-40% Discount: https://www.statsandresearch.com/check-discount/40533-global-sustainable-aviation-fuel-market
Sustainable Aviation Fuel Market Segmentation and Emerging Trends
Fuel Types Redefining the Aviation Energy Mix
Biofuels, Synthetic Fuels, and Hydrogen-based Fuels constitute the primary SAF categories. Among these, Biofuels—especially Hydroprocessed Esters and Fatty Acids (HEFA)—lead the market due to compatibility with existing jet engines and global distribution infrastructure.
Synthetic fuels, derived from carbon capture and renewable electricity, are gaining attention for their ability to decouple aviation from fossil fuel dependency. Meanwhile, Hydrogen-based fuels, though in early stages, represent the long-term frontier of zero-emission aviation.
Hydroprocessing (HEFA): Converts fats, oils, and greases into high-performance jet fuel. Currently the dominant production route due to technological maturity.
Fischer-Tropsch Synthesis: Leverages biomass and waste gases to create long-chain hydrocarbons—highly versatile and scalable.
Alcohol-to-Jet (ATJ): Converts ethanol or isobutanol into jet-range paraffins. This method is attractive for economies with established alcohol production infrastructure.
Power-to-Liquid (PtL): Employs renewable electricity, water, and captured CO₂ to synthesize liquid hydrocarbons—a promising but capital-intensive approach.
End-User Demand: The Shift Toward Green Aviation
Commercial Aviation Takes the Lead
The Commercial Aviation segment accounts for the majority of SAF demand, driven by sustainability pledges from global carriers and international decarbonization frameworks like CORSIA (Carbon Offsetting and Reduction Scheme for International Aviation).
Cargo Airlines Embrace Sustainability
Cargo operators are increasingly switching to SAF as consumer expectations and investor pressures demand eco-responsible logistics.
Military and General Aviation Contributions
Military and General Aviation sectors are actively piloting SAF solutions to meet internal environmental objectives and increase fuel supply resilience.
Strategic Regional Markets Driving SAF Adoption
North America: Leading Through Innovation and Investment
With aggressive policy incentives, such as the U.S. Inflation Reduction Act and California's LCFS (Low Carbon Fuel Standard), North America remains the global leader in SAF production capacity. The region is home to key innovators like World Energy, Gevo, and Neste USA.
Europe: Policy-Driven Acceleration
The EU’s ReFuelEU Aviation initiative and national blending mandates are stimulating rapid SAF infrastructure deployment. Major airports are integrating SAF into fuel systems, while players like TotalEnergies and Cepsa expand production assets.
Asia-Pacific: Rapid Adoption and Local Refining Capacity
China, Japan, and Singapore are emerging as pivotal markets. Governments are subsidizing SAF projects, and regional aviation giants are initiating pilot programs to secure future supplies.
Middle East & Africa: Untapped Feedstock Potential
The availability of non-edible biomass and low-cost solar energy positions these regions as future SAF exporters, particularly through PtL technologies.
South America: Agricultural Advantage
With abundant biomass resources and growing energy export ambitions, countries like Brazil and Argentina are investing in SAF development as part of their clean energy strategies.
Competitive Landscape: Key Players Fueling Global Momentum
Several leading companies are shaping the Sustainable Aviation Fuel market through aggressive R&D, capacity scaling, and long-term airline partnerships:
Neste: Market leader with commercial-scale HEFA production and global distribution network.
World Energy: Pioneering SAF blending at key U.S. airports.
TotalEnergies: Driving European SAF initiatives with strong refinery integration.
LanzaTech: Innovating with waste gas fermentation technologies.
Gevo: Leading ATJ production from renewable alcohols.
Cepsa, SABIC, Honeywell UOP, Shell, Emerald Biofuels: Investing in diverse SAF platforms and strategic alliances.
Sustainable Aviation Fuel Market Outlook to 2031: Scaling Production and Demand
The path forward involves closing the demand-supply gap by expanding production capacity, securing feedstocks, and enhancing logistics infrastructure. Key growth levers include:
National blending mandates (e.g., 5–10% SAF mix targets by 2030)
Airline SAF procurement contracts
Carbon offset market integration
Technological scale-up of PtL and Synthetic SAF
Global SAF adoption is no longer speculative—it is essential. As aviation commits to decarbonization, Sustainable Aviation Fuel will underpin the industry's climate agenda through 2031 and beyond.
Purchase Exclusive Report: https://www.statsandresearch.com/enquire-before/40533-global-sustainable-aviation-fuel-market
Conclusion
The Sustainable Aviation Fuel market stands at a defining crossroads between innovation, regulation, and urgent climate action. With projections reaching USD 25.4 billion by 2031, this industry is not just growing—it’s redefining the aviation landscape. Regional leadership, production diversification, and multi-stakeholder collaboration will be critical in turning SAF into the jet fuel of the future.
To dominate this evolving market, stakeholders must act decisively—invest, innovate, and integrate sustainability as a core strategic imperative.
Our Services:
On-Demand Reports: https://www.statsandresearch.com/on-demand-reports
Subscription Plans: https://www.statsandresearch.com/subscription-plans
Consulting Services: https://www.statsandresearch.com/consulting-services
ESG Solutions: https://www.statsandresearch.com/esg-solutions
Contact Us:
Stats and Research
Email: [email protected]
Phone: +91 8530698844
Website: https://www.statsandresearch.com
1 note
·
View note
Text
Keir Starmer has arrived in Downing Street with his new Cabinet. So what are their first priorities? Big-ticket items include decarbonizing the electricity grid by 2030, building 1.5 million homes over five years, hitting long-missed health service waiting time targets by 2029 and hiring 6,500 teachers, 5,000 tax investigators, 3,000 fully-trained police officers and 8,500 mental health staff.
Continue Reading
6 notes
·
View notes
Text
youtube
The shipping industry is responsible for three percent of global emissions. One of its best bets to get these down is fueling their vessels with ammonia. It releases no carbon when burnt and is cheaper than other alternative fuels like methanol. The catch: building a specialized engine is extremely difficult – and there's pretty much no green ammonia production today. So can it really fix shipping's emission problem?
#PlanetA #Ammonia #Shipping
Credits:
Reporter: Kai Steinecke
Camera & Video Editor: Neven Hillebrands
Supervising Editor: Malte Rohwer-Kahlmann, Kiyo Dörrer, Joanna Gotschalk
Factcheck: Aditi Rajagopal
Thumbnail: Em Chabridon
Special thanks to Dr. Nicole Wermuth who double checked critical parts of the video and gave background information about the engine concept as well as its current weaknesses.
Read More:
Ammonia as a fuel in shipping:
https://www.emsa.europa.eu/newsroom/l...
Role of efuels in decarbonizing transport:
https://www.iea.org/reports/the-role-...
Deep dive on ammonia as a shipping fuel:
https://ieeexplore.ieee.org/stamp/sta...
The future of marine fuels:
https://maritime.lr.org/l/941163/2023...
Chapters:
00:00 Intro
00:39 Ammonia 101
01:25 How ammonia engines work
04:23 The oxides problem
07:42 False promises?
08:31 What's next for ammonia engines?
09:17 The space challenge
11:22 Green ammonia challenge
14:22 Conclusion
#DW planet a#solarpunk#shipping industry#shipping#boats#ships#fossil fuels#oil#ammonia#alternative fuels#Youtube
2 notes
·
View notes
Text
Well, that’s at least less unreasonable than I was thinking.
It appears that the idea of large–scale carbon capture for sequestration is not something that one can say much of anything sensible about at the present time.
The economics of any kind of peaking plant, on the other hand, always have to compete with part–loading a baseload–capable power plant. This is, I hasten to observe, true because we have a zero–emissions baseload power technology available and well proven. In other words, to minimize emissions of CO₂ to the atmosphere, the much–discussed “transition to renewable energy” is not the only option.
Now, in a scenario where nuclear is allowed, the relevant cost comparison may well be, not between solar plus “Terraformer” plus gas turbine and solar plus battery, but between nuclear plus “Terraformer” plus gas turbine and part–loaded nuclear. Now, we can reasonably expect any nuclear power plant of established types, built at the present time, to operate 60 years (unless shut down by political mandate), with a major refurbishment at 30 years.
Unfortunately, the question of how much a new nuclear plant costs is hard to settle. There are not enough current projects to supply meaningful data. Suppose $60 per watt installed, which is on the high end, although not the absolute highest (thus giving a generous allowance for the mid–life refurbishment and other costs). Then straight–line depreciation for 60 years gives $1 per annual watt–year. Part–loading that plant at 50% annual load factor would only double that cost. $2 per annual watt–year is somewhat higher than the figures being advanced for the carbon–capture/gas–turbine system, and which option is really preferable probably ends up being a matter of the specific situation. At $15 per watt (at the low end for current projects, but there is good reason to think that costs could be reduced substantially from there), baseload is 25¢ per annual watt–year, 50¢ at half load, and the case for the peaker is difficult to make out.
It certainly does not appear that there is an overwhelming case that can be made for using the “Terraformer” system, as compared to equipment which is already well proven in service. And for my part, I tend to view all carbon–capture schemes, and especially schemes for compensating for the intermittency of wind and solar with combustion equipment, as ways to justify not taking rapid effective steps away from fossil fuels.
when will we see the first reverse coal baron (negacoal?) who owns vast pits that armies of filthy labourers carefully stack full of carbon bricks spat out of vast capture machines sucking in CO2 from the sky
#split don't emit#deep decarbonization#carbon capture#atomic power to the people#quantitative reasoning
173 notes
·
View notes
Text

Dear Costco,
We are writing to you as Costco shares a co-branded credit card with Citibank ― and we are calling on you to break up with Citibank owing to its role in fueling the climate crisis and driving environmental racism.
Since the Paris Agreement, Citibank has been the world's largest funder of fossil fuel expansion. Climate scientists and experts, including the International Energy Agency, have made it clear that we must immediately stop investing in the buildout of new coal, oil and gas infrastructure and dramatically increase financing of renewable energy.
Citi has financed more fossil fuel expansion since 2015 than any other bank in the world, and in 2023 financed nearly twice as much fossil fuel energy as clean energy.
Citibank’s financing of fossil fuels is so egregious that, since June 10th, families, grandparents, scientists, and young people have been regularly protesting at Citi’s global headquarters in New York City, as has been reported by the New York Times and many others. 450 people have even taken the dramatic step of being arrested at these protests.
Additionally, for a company that cares about climate change, it’s critical that you take into account the carbon footprint of your banking and credit card partnerships. For years, major corporations have viewed decarbonization of their supply chains as a critical part of their work to achieve their various climate promises.However, as the Carbon Bankroll report has revealed, where a company banks and invests its money can represent a company’s single largest source of greenhouse emissions. This is because banks can use up to 90 percent of the money they hold in deposits to provide loans to companies across the economy. That means if your company has billions of dollars at Citigroup, they are almost certainly using a chunk of that money to finance new coal mines, new oil pipelines and new deep sea drilling operations
As a company that cares about sustainability and the environment, we call upon Costco to break up with Citi and find a better, cleaner, more humane credit card partner.
Sincerely, D.Dolnooryahov 5100 BG EU
and 6,987 concerned customers worldwide

1 note
·
View note
Text
I had to send a comment in response to this piece.
Listening to this segment, I was dismayed to hear no mention of the energy source which the IPCC ranks as having the lowest life-cycle global warming potential, an energy source which supplies approximately twice the fraction of world energy that wind and solar do, an energy source which is already affordable and reliable. I mean, of course, nuclear fission. It’s all very well to say that wind and solar have fallen in price, and can be made reliable with batteries and upgraded power grids, but in most places that have tried it, the price of power has soared, and there has been very little decarbonization achieved. And that is the key consideration : a climate policy which costs too much or causes too much hardship to implement, won't be implemented. So we see that Germany, despite vast investments in wind and solar, has this past month reactivated a three-gigawatt coal-fired power station. French energy-sector greenhouse-gas emissions are half those of Germany, and electricity prices in France are about half what they are in Germany, too. Nuclear energy is such an effective competitor to fossil fuels that, in the 1970s, companies such as Gulf Oil and Exxon invested heavily in nuclear technology, in order not to be left behind. Considering how fragile power grids are across much of the USA, it’s important that nuclear power plants can be located near the cities they serve, reducing the need for (and cost of) grid upgrades. With “breeder” reactors, like the one which generated the first nuclear electricity back in 1951, the uranium and thorium already mined can provide more energy than all the fossil fuels that can ever be extracted. And, to bring us back to the subject of COP28, the UAE (which has three big power reactors in operation now, and one more under construction) and 21 other countries, including the USA, have just pledged to triple nuclear power by 2050. It’s not enough, but it looks more like real progress than any number of vague “net zero” pledges. People are hardly accustomed to hearing about nuclear, and what they do hear tends to be negative. That doesn’t reflect the reality at all. And it’s that reality that we need to talk about.


4 notes
·
View notes
Text
See how Brazil is benefiting from the Industrial Deep Decarbonization Initiative

The Industrial Deep Decarbonization Initiative offers Brazil's industries a pathway for a just and equitable transition to net zero through technological innovation, capacity building and policy development.
The Initiative enables Brazil to navigate challenges in sectors such as cement, steel, aluminium and petrochemicals, while prioritizing social safety nets, community engagement and workforce reskilling.
International examples showcase successful models that balance economic growth, environmental sustainability and social fairness, this reinforces the potential impact of the Initiative on Brazil's low-carbon future.
Continue reading.
#brazil#politics#economy#climate change#environmentalism#brazilian politics#mod nise da silveira#image description in alt
6 notes
·
View notes
Text
Central banks from eight countries—Mexico, the UK, France, Netherlands, Germany, Sweden, Singapore, and China—formed the Network of Central Banks and Supervisors for Greening the Financial System (NGFS) in 2017 to investigate and coordinate a response to climate change. By the end of 2022, the NGFS had over 120 members. However, among these central banks, there were considerable differences in the strategies adopted to account for and address climate change. Most strikingly, climate change has emerged as an unusual area of divergence between the European Central Bank (ECB) and the U.S. Federal Reserve (Fed), despite their historical tendency to adopt similar policy tools, frameworks, and objectives. The Fed limited its approach to climate change to basic climate policy standards or “norms” that recognized some relevance of climate change to achieving its monetary and prudential objectives but avoided any support for decarbonization. In contrast, the ECB better appreciated that climate change raised profound challenges for achieving its central banking objectives. As a result, the ECB adopted proactive climate policy norms that, for example, put in place climate-related criteria for asset purchase programs and far-reaching supervisory interventions to ensure that financial institutions accounted for climate risk.
To understand the ECB-Fed divergence on climate policy, we develop a theoretical framework that describes how new central banking norms are created and become influential in the context of domestic and international pressures. In the initial stage of climate policy norm emergence, broad support across the EU for climate action along with persuasive think tanks, researchers, and other policy entrepreneurs helped push the ECB to endorse new climate-related norms. The founding of the NGFS and the associated cascade of climate-related norms exerted significant pressure towards climate policy convergence across many central banks. However, the deeply polarized and partisan U.S. debate on climate change, stoked by an influential domestic fossil fuel industry, led the Fed to adopt only a modest version of the foundational climate norms—a stark divergence from the proactive climate stance of the ECB.
Given the deep differences in domestic political pressures, it seems unlikely that the climate policy differences between the ECB and the Fed will soon disappear. However, given the international connectedness of central banking, we expect global policy norms to provide sustained pressure towards convergence. In this context, the ECB might scale back some proactive commitments, although it seems unlikely to entirely disavow its current forward-leaning stance. The Fed may also seek a more favorable compromise, such as assuring domestic audiences of climate policy restraint, while cooperating with international peers on less overt regulatory interventions.
Download the full paper here»
3 notes
·
View notes
Text
Why the FLNG Terminals Market Is Booming – And What’s Next
The global Floating Liquefied Natural Gas (FLNG) Terminals Market is poised for significant transformation, driven by the global transition to cleaner energy, the need for energy accessibility, and growing demand for natural gas across sectors. Valued at US$ 21.3 Bn in 2023, the market is projected to expand at a robust CAGR of 11.3% from 2024 to 2034, ultimately reaching a staggering US$ 68.9 Bn by 2034.
What Are FLNG Terminals?
FLNG terminals are offshore facilities that combine the functions of production, liquefaction, storage, and offloading of natural gas directly from deep-sea gas fields. These floating platforms bring together technologies from offshore oil & gas, marine engineering, and LNG production sectors, enabling efficient energy delivery to onshore locations without relying on traditional land-based infrastructure.
Due to their flexibility, fast deployment schedules, and cost-effectiveness, FLNG terminals are becoming increasingly popular as global energy stakeholders look for sustainable alternatives.
Decarbonization Driving Demand for FLNG
A key driver propelling the growth of FLNG terminals is the global focus on reducing carbon emissions. As countries and corporations aim to decarbonize their operations, natural gas has emerged as a “bridge fuel” — cleaner than coal and oil and widely available. The use of LNG, with its lower greenhouse gas emissions and higher efficiency, is rapidly gaining traction across industrial, residential, and transportation sectors.
Global CO₂ emissions from fossil fuels still stand at approximately 34 billion tons per year, and a transition toward gas is seen as a vital step to meet climate goals. FLNG facilities play a critical role in unlocking stranded offshore reserves and bringing LNG to regions that are shifting away from diesel or coal dependency.
Natural Gas in Transportation Sector Fuels FLNG Expansion
Another compelling growth catalyst is the adoption of LNG in the transportation sector. LNG vehicles emit significantly less NOx, SOx, and particulate matter compared to diesel-powered engines. Cities like New Delhi have recorded measurable air quality improvements after switching public transport fleets to natural gas.
The U.S. Department of Energy reported a 53% rise in hybrid electric vehicle (HEV) sales in 2023, highlighting a growing shift toward alternative fuels, including natural gas-powered mobility. As the demand for LNG-powered vehicles grows, FLNG terminals will play a pivotal role in supplying clean fuel for this transition.
Technology Advancements and STS Innovations
A defining feature of FLNG terminals is their modular and adaptable design, allowing producers to liquefy and store gas directly offshore. Once liquefied, the gas is transferred to carrier vessels via advanced Ship-to-Ship (STS) methods — including side-by-side, tandem, and parallel positioning — all using cryogenic loading arms capable of withstanding temperatures as low as -163°C (-261.4°F).
Major industry players are investing in R&D to optimize modular solutions for pretreatment, liquefaction, mooring, and transfer systems. These advancements aim to reduce operational risks, enhance safety, and cut down project costs and implementation time.
Asia Pacific Leads Global FLNG Adoption
From a regional standpoint, Asia Pacific dominated the FLNG market in 2023. Surging demand for natural gas and hybrid vehicles, along with government incentives and infrastructure expansion, is fueling growth in the region.
India, for instance, has unveiled plans to triple its network of CNG refueling stations by 2030, rising from 6,000 to over 17,700 stations. Similarly, China, Japan, and ASEAN countries are ramping up LNG imports to power their growing economies while striving for lower emissions.
Asia Pacific’s energy security strategy is also centered on diversification of supply sources, and FLNG terminals offer a flexible and scalable solution to import LNG from remote offshore fields.
Competitive Landscape and Strategic Developments
The FLNG terminals market is highly competitive and innovation-driven. Key players such as Mitsui O.S.K. Lines, Höegh LNG, Shell, Golar LNG, Excelerate Energy, ABB, and PETRONAS are actively expanding their project portfolios and strengthening their technological capabilities.
In May 2024, Mitsui O.S.K. Lines signed a long-term LNG carrier charter with JERA Co., aiming to ensure stable LNG supply in Asia. Around the same time, Höegh LNG Holdings Ltd. partnered with EGAS and Australian Industrial Energy to deploy a Floating Storage and Regasification Unit (FSRU) in Egypt, enhancing regional energy security.
These partnerships reflect a growing trend of public-private collaborations, where technology providers and energy corporations work together to deploy FLNG infrastructure in strategically important regions.
Outlook: FLNG Terminals to Anchor the Future of LNG
As the global energy market pivots toward sustainability and energy accessibility, FLNG terminals are emerging as game-changers. They not only offer a cleaner alternative to coal and oil but also unlock reserves previously considered economically unviable.
The combination of technological innovation, government support, and increasing LNG demand is setting the stage for strong market expansion. From mobility to power generation and industrial processes, floating LNG infrastructure is bridging gaps between offshore supply and onshore demand.
With a projected market size of US$ 68.9 Bn by 2034, the FLNG industry is on track to become a vital pillar of the global energy transition.
0 notes
Text
Excerpt from this story from Canary Media:
Buildings everywhere need to get off fossil fuels in order to help the world avoid climate catastrophe. Yet owners of large commercial buildings in New York City are especially feeling the pressure: The groundbreaking Local Law 97 takes effect this year, requiring buildings of more than 25,000 square feet to meet specific emissions limits, which become more stringent in 2030, or face hefty fines.
One cutting-edge retrofit project is underway at the corner of Hudson and Charlton streets in lower Manhattan. The 17-story Art Deco office building, built in 1931, is ditching its fossil-gas boiler for uber-efficient electric heat pumps that are both heaters and air conditioners. They’re key components of a system that aims to heat and cool the building more efficiently by capturing thermal energy that would otherwise be wasted.
The state is backing the demonstration project, which could serve as a model to decarbonize the more than 6,000 high-rises that punctuate New York City’s skyline. As part of the Empire Building Challenge, the New York State Energy Research and Development Authority (NYSERDA) awarded $5 million to the 345 Hudson project in 2022, which also has more than $30 million in private funding.
Project leader Benjamin Rodney estimates that once the project is complete in 2030, the building will use 25 percent less energy than a conventional design and reduce greenhouse gas pollution by 70 percent relative to 2019 levels. As the grid cleans up, he expects the figure to climb to 90 percent by 2035. The deep emissions cuts will allow the building owner, Hudson Square Properties — a joint venture of Hines, Trinity Church Wall Street, and Norges Bank Investment Management — to avoid more than $200,000 in fines annually starting in 2030.
But more importantly, it could help other building owners determine how best to eliminate emissions — a crucial task given that nearly 70 percent of the city’s carbon pollution stems from the fossil fuels used to heat and power its buildings.
12 notes
·
View notes
Text
Green Hydrogen Projects Database: Size, Share & Growth Analysis 2034

Global Green Hydrogen Projects Database : As the world accelerates its transition to clean energy, the Global Green Hydrogen Projects Database has emerged as an indispensable resource for tracking progress, investment, and innovation. This centralized, subscription-based database — offered by Global Insight Services — monitors over 1,700 green hydrogen production projects worldwide. It offers real-time updates on project status, electrolyzer technologies, funding details, and more. At a time when green hydrogen is becoming a cornerstone of decarbonization strategies, this tool helps governments, corporations, and researchers stay ahead in a fast-evolving market. With green hydrogen production ramping up globally through electrolysis powered by renewable energy, this database empowers stakeholders to make informed decisions in a sector set to redefine the global energy landscape.
Click to Request a Sample of this Report for Additional Market Insights: https://www.globalinsightservices.com/request-sample/?id=GIS24651
Market Dynamics
The green hydrogen sector is expanding rapidly due to policy momentum, falling renewable energy costs, and growing demand for sustainable alternatives to fossil fuels. Governments worldwide are announcing multi-billion-dollar funding programs to support hydrogen ecosystems, while corporations are making significant greenfield investments. However, the complexity and diversity of hydrogen projects — from ammonia production to energy storage — make market intelligence critical.
The Global Green Hydrogen Projects Database addresses this need by offering deep insights into technology trends, production capacities, and investment flows. With detailed information on electrolyzer types like PEM, alkaline, and solid oxide technologies, the platform enables benchmarking of performance and competitiveness. Furthermore, stakeholders can track strategic collaborations, joint ventures, and policy developments, making the database not just a tracking tool, but a strategic asset.
Key Players Analysis
The database profiles a wide array of stakeholders shaping the global hydrogen economy. Key hydrogen companies such as ENGIE, BP, Shell, Fortescue Future Industries, and Orlen Group are actively involved in developing and scaling green hydrogen infrastructure. These industry giants are joined by regional leaders like Adani Group, NTPC Ltd., and ScottishPower, who are driving projects in Asia and Europe.
On the manufacturing side, leading electrolyzer companies such as Nel ASA, Siemens, Plug Power, and Cummins are crucial to meeting the growing demand for efficient hydrogen production equipment. The database features over 50 electrolyzer manufacturers and captures their technology deployments across different projects, helping users compare efficiencies, costs, and deployment scales. Startups and emerging players are also gaining visibility, offering innovative solutions for a diversified market.
Regional Analysis
The green hydrogen landscape varies greatly across regions. Europe continues to lead with robust policy support, significant public funding, and ambitious decarbonization targets. The EU’s Hydrogen Bank recently allocated nearly €1 billion to 15 projects across five countries, demonstrating its commitment to large-scale adoption.
North America, especially the United States, is gaining traction through public-private partnerships and landmark funding programs like the Bipartisan Infrastructure Law. Companies like ACWA Power are expanding their U.S. portfolios, focusing on integrated clean energy solutions.
Asia-Pacific is seeing surging interest, particularly in countries like India, Australia, and Japan. National hydrogen roadmaps, ambitious capacity goals, and cross-border collaboration are accelerating regional growth.
Latin America and Africa are also emerging markets, with projects in Chile, Brazil, and South Africa gaining visibility. Supported by international cooperation, these regions aim to become future export hubs for green hydrogen and ammonia.
Recent News & Developments
The month of May 2025 alone showcased the momentum in the green hydrogen space. In Lithuania, Klaipėda State Seaport Authority secured €6 million in EU funding to build the Baltic’s first green hydrogen plant. Meanwhile, in Chile, a collaboration between GIZ and Acciona Nordex Green Hydrogen took shape under Germany’s H2Uppp initiative, supporting sustainable hydrogen and ammonia production.
In Spain, Alkeymia announced a €400 million investment to build a 25,000-ton-per-year green hydrogen plant in Caspe. Simultaneously, the European Commission awarded nearly €1 billion to 15 green hydrogen projects, underlining strong institutional support. ACWA Power also inked $500 million in deals in the U.S., further solidifying the global footprint of green hydrogen.
Browse Full Report : https://www.globalinsightservices.com/reports/hydrogen-projects-database/
Scope of the Report
The Global Green Hydrogen Projects Database goes beyond simple tracking. It provides exhaustive project-level data — including production capacity, electrolyzer technology, funding details, timelines, and end-user applications across sectors such as steel, chemicals, logistics, and power. It supports clients with monthly newsletters summarizing project approvals, investments, policy shifts, and technological innovations.
Additionally, the database enables competitive benchmarking, helping companies analyze technology efficiency and investment trends. It also covers regional adoption trends, offering a lens into where green hydrogen is gaining ground and which players are driving innovation.
Designed for utility companies, energy planners, investors, researchers, and policy analysts, the platform provides 24/7 analyst support, custom research services, and discounted consulting to help stakeholders align with the hydrogen economy’s trajectory. #greenhydrogen #cleanenergyfuture #hydrogenprojects #electrolyzertech #renewableenergy #energytransition #sustainablefuel #netzeroinitiative #hydrogeninvestment #lowcarboneconomy
Discover Additional Market Insights from Global Insight Services:
Small Modular Reactor Market : https://www.globalinsightservices.com/reports/small-modular-reactor-market-market/
Surge Arrestor Market : https://www.globalinsightservices.com/reports/surge-arrester-market-2/
Virtual Pipeline Systems Market : https://www.globalinsightservices.com/reports/virtual-pipeline-systems-market/
Green Ammonia Market : https://www.globalinsightservices.com/reports/green-ammonia-market/
Absorbent Glass Mat Battery Market : https://www.globalinsightservices.com/reports/absorbent-glass-mat-battery-market/
About Us:
Global Insight Services (GIS) is a leading multi-industry market research firm headquartered in Delaware, US. We are committed to providing our clients with highest quality data, analysis, and tools to meet all their market research needs. With GIS, you can be assured of the quality of the deliverables, robust & transparent research methodology, and superior service.
Contact Us:
Global Insight Services LLC 16192, Coastal Highway, Lewes DE 19958 E-mail: [email protected] Phone: +1–833–761–1700 Website: https://www.globalinsightservices.com/
0 notes
Text
Green Hydrogen Production Cost Analysis Report: Unveiling Costs, Trends, and Process Insights
As the global push for decarbonization accelerates, green hydrogen has emerged as a critical pillar in the transition toward a sustainable energy future. Produced through electrolysis powered by renewable energy sources like wind and solar, green hydrogen offers a clean alternative to conventional hydrogen derived from fossil fuels. To understand the economic viability of this promising fuel, a detailed Green Hydrogen Production Cost analysis is essential. This article dives deep into the cost components, industry trends, raw materials, logistics, and technological processes driving green hydrogen production across global markets.
Green Hydrogen: The Fuel of the Future
Green hydrogen is produced by splitting water (H₂O) into hydrogen (H₂) and oxygen (O₂) using electricity generated from renewable sources. Unlike grey or blue hydrogen, green hydrogen emits no greenhouse gases during production, making it a crucial enabler of net-zero targets. However, the transition to large-scale adoption hinges on lowering green hydrogen production costs through technological innovation, infrastructure development, and supply chain optimization.
Overview of the Green Hydrogen Production Cost Report
The Extensive Green Hydrogen Production Cost Analysis Report by Procurement Resource provides an in-depth evaluation of the cost structure, feasibility assessments, and industry benchmarks associated with green hydrogen. The report features:
Detailed Cost Modeling
Pre-feasibility Assessments
Raw Material Analysis
Process Economics
Utility Consumption
Logistics and Transportation Insights
Labor and Infrastructure Cost Evaluation
Market Drivers and Forecasts
This comprehensive cost report enables stakeholders to evaluate investment opportunities, optimize production strategies, and enhance decision-making.
Request a free sample: https://www.procurementresource.com/production-cost-report-store/green-hydrogen/request-sample
Raw Materials and Utilities in Green Hydrogen Production
Green hydrogen production primarily relies on:
Water: As the primary feedstock for electrolysis, high-purity deionized water is required.
Electricity: Generated from renewable sources such as wind, solar, or hydroelectric energy.
Electrolyzers: Devices such as PEM (Proton Exchange Membrane) or alkaline electrolyzers are used in the process.
The cost of electricity accounts for over 50% of the total green hydrogen production cost, making renewable energy availability and pricing critical to competitiveness.
Other utility requirements include:
Cooling water systems
Compressors and storage tanks
Control and automation systems
Maintenance and support services
Green Hydrogen Manufacturing Process
The core process for green hydrogen involves electrolysis, where water is split into hydrogen and oxygen using electricity. The two most widely used electrolysis methods include:
PEM Electrolysis: Offers high purity hydrogen, quick startup, and better load response. However, it is costlier due to the use of expensive materials like platinum and iridium.
Alkaline Electrolysis: A mature technology with lower capital expenditure but slower response times and lower hydrogen purity.
Post-electrolysis processes may include:
Drying and compression
Purification
Storage and distribution
Blending with natural gas or other fuels (in some applications)
Each of these steps adds to the final production cost and is thoroughly analyzed in the report.
Cost Model: Key Components
The cost model used in the report incorporates:
Capital Investment (CAPEX): Includes electrolyzer units, power systems, water treatment facilities, infrastructure, and storage systems.
Operational Expenses (OPEX): Electricity costs, water charges, maintenance, labor, insurance, and regulatory compliance.
Logistics Costs: Transportation of equipment and final hydrogen product.
Depreciation and Financing Costs
Land and Infrastructure Development
This granular breakdown enables stakeholders to understand where cost efficiencies can be achieved.
Industrial Trends Shaping the Market
Several industrial trends are impacting the green hydrogen production cost and scalability:
Declining Renewable Energy Costs: With solar and wind power becoming cheaper, electricity input costs are falling.
Technological Innovation: Advancements in electrolyzer efficiency and reduced costs through scale-up and automation.
Government Incentives and Carbon Pricing: Policies promoting clean hydrogen are accelerating investments and reducing payback periods.
Global Hydrogen Strategies: Countries like Germany, Japan, and India have launched national hydrogen missions aimed at increasing domestic production and export capabilities.
Labor Charges and Infrastructure Requirements
Green hydrogen facilities require skilled labor for construction, operation, and maintenance. Labor cost varies regionally, and the report provides country-wise estimates. Infrastructure development includes:
Power grid integration
Water supply and treatment
Hydrogen pipelines and storage
Export terminals (for hydrogen derivatives like ammonia)
These add significantly to the upfront and ongoing costs.
Logistics and Supply Chain Insights
Green hydrogen logistics involve challenges such as:
Storage in high-pressure tanks or cryogenic systems
Transportation via pipelines, trucks, or ships (especially when converted to ammonia or methanol)
Handling safety and regulatory compliance
The report provides cost insights into domestic and international logistics, factoring in infrastructure availability, port access, and hydrogen demand hubs.
Production Cost Analysis and Benchmarks
The report includes a detailed production cost analysis, segmented by:
Region (e.g., Europe, Asia-Pacific, Middle East, North America)
Electrolyzer technology
Scale of operation
Energy source mix
Typical production costs (as per the latest report findings) range between USD 2.50–6.00 per kg of hydrogen, depending on energy prices, location, and technology used.
Product Details and End-Use Applications
Green hydrogen serves multiple applications, including:
Fuel for fuel cell electric vehicles (FCEVs)
Feedstock for green ammonia and methanol
Steel and cement decarbonization
Power storage and grid balancing
Chemical manufacturing
As demand for clean energy accelerates, the green hydrogen market is expected to witness exponential growth, making it vital to understand production costs and operational strategies.
Role of Procurement Resource in Cost Analysis
Procurement Resource plays a pivotal role in delivering tailored cost analysis reports for industries looking to diversify into green hydrogen. Their deep expertise in cost modeling, raw material benchmarking, feasibility studies, and supply chain evaluation supports businesses in:
Strategic sourcing
Risk management
Project planning
Cost optimization
By using data-driven insights from Procurement Resource, organizations can confidently pursue hydrogen initiatives and gain a competitive edge in the green energy market.
Request a Free Sample
Gain firsthand access to our Green Hydrogen Production Cost Analysis Report by requesting a free sample today. The sample includes detailed methodology, sample cost models, process flow diagrams, and key industrial insights.
Request a free sample: https://www.procurementresource.com/production-cost-report-store/green-hydrogen/request-sample
Green hydrogen holds the key to unlocking a decarbonized future. However, widespread adoption hinges on an in-depth understanding of the green hydrogen production cost, market feasibility, and process economics. This comprehensive cost analysis report offers stakeholders the tools and knowledge needed to navigate this transformative sector confidently.
Contact Information
Company Name: Procurement Resource
Contact Person: Ashish Sharma (Sales Representative)
Email: [email protected]
Location: 30 North Gould Street, Sheridan, WY 82801, USA
Phone: UK: +44 7537171117, USA: +1 307 363 1045, Asia-Pacific (APAC): +91 8850629517
#green hydrogen#energy future#solar#industry trends#raw materials#logistics#green hydrogen production
0 notes