#Data Visualisation Services
Explore tagged Tumblr posts
Visit Tumblr Blog
Explore Tumblr blogs with no restrictions, modern design and the best experience.
Last Seen Tumblr Blogs


Fun Fact
Tumblr was acquired by Yahoo for $1.1B in 2013.
Text

At Data Visualization Services, we transform complex data into meaningful insights through advanced visualization techniques. Our solutions empower businesses to make data-driven decisions with clarity and precision.
0 notes
Text
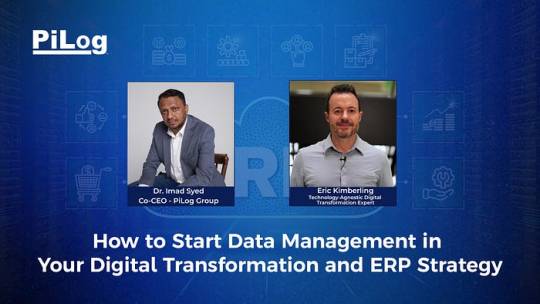
How to Optimize Data Management for a Seamless Digital Transformation and ERP Implementation?
Digital transformation and ERP (Enterprise Resource Planning) strategies have become pivotal for businesses aiming to stay competitive in today’s fast-evolving landscape. At the core of these strategies lies data management — a critical aspect that ensures accurate, reliable, and actionable insights for decision-making.
Watch this comprehensive video on starting data management in your ERP strategy for an in-depth understanding.
youtube
If you’re wondering how to start data management in your digital transformation and ERP strategy, this guide provides actionable steps to help you begin your journey effectively.
Why Data Management is Crucial in Digital Transformation
Before diving into the “how,” it’s essential to understand the “why.” Here’s why data management is indispensable:
Data as the Backbone of ERP Systems: ERP systems thrive on clean, structured, and well-organized data. Without proper data management, the efficiency of ERP systems diminishes.
Informed Decision-Making: Reliable data leads to better analytics, which fuels strategic decisions.
Cost Optimization: Effective data management reduces redundancies, eliminates errors, and cuts costs in operations.
5 Steps to Start Data Management in Your Digital Transformation Journey
1. Assess Your Current Data Landscape
Before implementing any strategy, audit your current data repositories. Identify duplicate, incomplete, or irrelevant data that might be affecting your systems.
2. Define Your Data Governance Framework
A strong governance framework ensures consistency and accountability. This includes setting rules for data collection, usage, storage, and security.
3. Choose the Right Tools and Technologies
Invest in master data management (MDM) tools that integrate seamlessly with your ERP system. These tools enable:
Centralized data storage
Automated data cleansing
Real-time data updates
4. Involve Key Stakeholders
Data management isn’t an IT-only responsibility. Include leaders from finance, operations, and supply chain departments to ensure holistic alignment.
5. Provide Continuous Training
Educate your employees about the importance of clean data and how their inputs impact larger systems like ERP. A data-driven culture begins with informed employees.
How ERP Systems and Data Management Work Hand-in-Hand
High-Impact Benefits of Starting Data Management Now
Enhanced Business Agility: With structured data, businesses can respond quickly to changes.
Improved Compliance: Regulatory requirements like GDPR and CCPA demand clean and transparent data practices.
Better Customer Experiences: When your systems are fueled by high-quality data, you deliver superior services.
Conclusion
Starting your data management journey may seem daunting, but with the right approach and resources, it can transform your digital transformation and ERP strategy into a powerful business enabler.
To gain deeper insights and actionable advice on this topic, make sure to watch this detailed video here.
Take the first step today — because the future of your business depends on how well you manage your data today!
#digital transformation#data management in erp#erp services#piloggroup#data analytics#data governance#erp solutions provider#data visualization#data visualisation#youtube#data scientist#data management solutions#datadriven#Youtube
0 notes
Text

"Enabling Growth through Digital Transformation Services"
Enabling Growth through Digital Transformation Services" focuses on the journey of organizations as they embrace digital transformation. It highlights the importance of a well-defined strategy and effective execution in driving growth and success through the adoption of digital transformation services.
#data analytics#data visualisation#digital services#testing#web security#digital transformation services
0 notes
Text
Insights in Focus: Empower Your Data with Professional Data Visualization Consulting Services
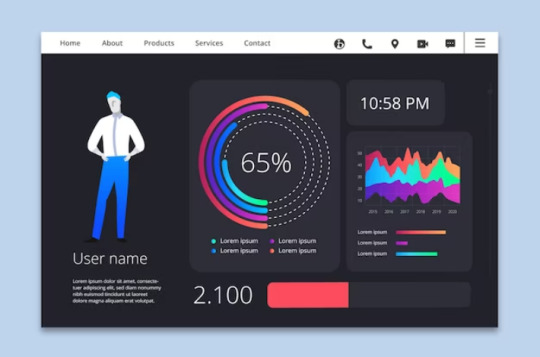
Data is a valuable asset for businesses, but its true power lies in the ability to derive meaningful insights from it. That's where data visualization consulting services come into play. In this digital age, businesses have access to an abundance of data, but understanding and effectively communicating that data can be a challenge. That's why partnering with professional data visualization consulting services can empower your business to unlock the full potential of your data, gaining valuable insights and making informed decisions.
Harnessing the expertise of data visualization consulting services allows you to transform complex data sets into visually compelling and easy-to-understand representations. This process involves using a combination of design principles, statistical techniques, and storytelling to create visually engaging dashboards, infographics, and interactive visualizations that bring your data to life.
Data visualization is not just about creating aesthetically pleasing charts and graphs; it's about telling a story with data. Skilled consultants in data visualization understand the art and science of presenting data in a way that highlights key trends, patterns, and relationships. They take into account the target audience and tailor the visualizations to suit their needs, ensuring that the message is clear and impactful.
One of the primary benefits of data visualization consulting services is the ability to gain actionable insights from complex data sets quickly. Visual representations of data enable you to spot trends, outliers, and correlations that may have gone unnoticed in raw data. With interactive visualizations, you can drill down into specific data points, explore different scenarios, and uncover valuable insights that drive informed decision-making.
Moreover, effective data visualization helps you communicate your findings and insights to stakeholders, executives, and team members in a compelling and easily understandable manner. Whether it's presenting sales performance, customer behavior, or operational metrics, data visualization consulting services help you present data-driven narratives that resonate with your audience. This enhances communication, facilitates collaboration, and enables everyone to make data-informed decisions.
Data visualization consulting services also keep up with the latest trends and technologies in the field. They have expertise in utilizing advanced tools and software for data visualization, ensuring that your visualizations are not only visually appealing but also interactive, responsive, and accessible across different devices and platforms.
By leveraging professional data visualization with power bi consulting services, you can unlock the true value of your data, gain insights that drive business growth, and effectively communicate complex information. Whether you're looking to enhance your data reporting capabilities, improve decision-making processes, or enhance customer experiences, data visualization consulting services can provide the expertise and guidance you need.
In conclusion, data visualization consulting services offer a strategic approach to transform your raw data into compelling visual narratives. By partnering with experts in data visualization, you can empower your business to make data-informed decisions, communicate insights effectively, and gain a competitive edge in the modern age. Don't let your data remain hidden and underutilized. Embrace the power of data visualization consulting services and unlock the true potential of your data-driven insights.
#Data Visualization Consulting Services#power bi data visualization#data visualization in power bi#data visualization services#data visualisation company
0 notes
Text
"The words we shared built chat GPT, the images we shared built Stable Diffusion. Generative AI is just another word for surveillance capitalism. Taking our data with dubious consent and activating it through services it sells back to us. It is a visualisation of the way we organise things, a pretty picture version of the technologies that sorted and categorised us all along.
Instead of social media feeds or bank loans or police lineups, these algorithms manifest as uncanny images, disorienting mirrors of the world rendered by a machine that has no experience of that world. If these images are unsettling because they resemble nothing like the lives they claim to represent, it's because that is precisely what automated surveillance was always doing to us."
Eryk Salvaggio, The Age of Noise, 2024
120 notes
·
View notes
Text
Hello. You might have seen this floating around on twt:

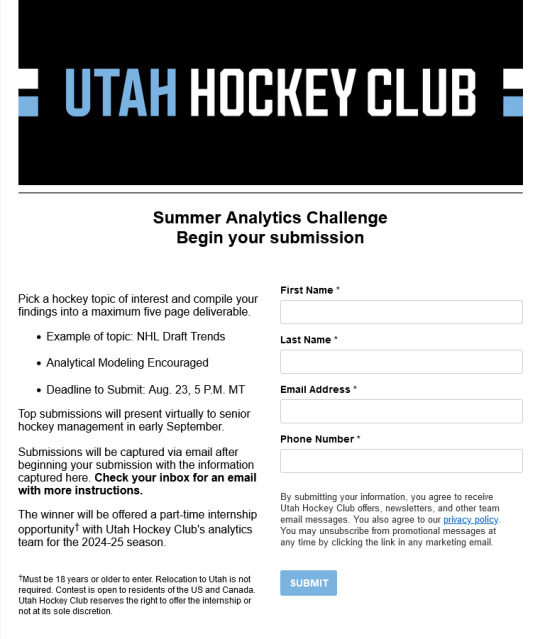
link 1 // link 2, archive link
If by any chance you or someone you know are thinking about joining in on the challenge… no one can stop you but I implore you as someone who makes art, as someone with friends in an often-exploited creative industry, as someone who lives in late stage capitalism alongside you and has seen this play out before: proceed with caution.
Read the fine print on that form. There is NO guarantee of an internship, much less a job at the end of it. I haven't gone further than this form, but if anyone reading this does, and if there's no written agreement that your work won't be used without credit to you + payment for services rendered - RUN.
This is a common corporate tactic to get free labor out of people. I'm not saying this is necessarily what’s happening; for all we know this was done as a completely innocent move to drum up some fan engagement and as a genuine search for talent for their analytics team. WHO KNOWS. But I can't ignore that I’ve seen this situation play out again and again, at every scale.
Job interviews, when they ask you how YOU think they should improve their systems, how YOU would solve their problems? When they require that you do some problem-solving for them, and it goes beyond a simple task? That’s a free consultation you’re giving them, that's free work you or someone else should be getting paid for.
When big streamers/influencers ask their fans to join in on a fan art contest to choose their new pfp/banner? That’s hundreds, possibly thousands of pieces of free art they never would’ve gotten otherwise. They could've gone to the trouble of paying someone in-house to do it, hiring someone for that position, commissioning a professional for a piece. It's free work from their dedicated fans.
In this case, Utah HC is asking fans to not only choose/provide their own dataset, but to do a complex analysis on it AND do the work of visual and verbal communication to senior management, who likely do not have a deeper grasp of the concepts and will need it simplified. The stipulation that you will present your work could be ANYTHING!! The "five page deliverable" is already bananas to me, having dipped my toe into what analytics is and how complex the fun ones are. Condensing it all is WORK. The presentation portion may include speaking time and answering questions; the groundwork for doing this effectively may include producing data visualisations, making spreadsheets, time consuming write-ups. Maths and science communication is hard. It is WORK. They are asking for free labor.
Many have already called it out, but it's still gaining traction via retweets from big accounts uncritically sharing it. I found out through the official Puckpedia account. Jack Han called it out pretty eloquently on twitter and on his substack:
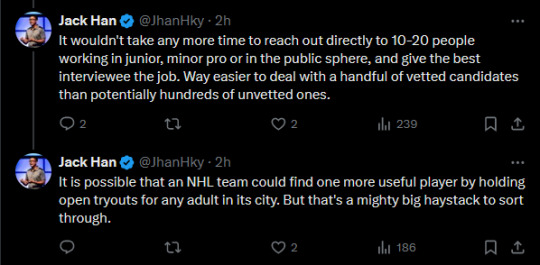
Many people aspire to work as an analyst in the NHL. Earlier today the Utah Hockey Club gave those people a glimmer of hope. Utah’s Summer Analytics Challenge is unusual in that it doesn’t provide a dataset or detailed instructions. The open-ended contests contrasts with other public (ex: Big Data Cup) or private (ex: NHL team interview) events. In those scenarios, participants are given proprietary data to clean, model and analyze, which influence direction and methodology. Meanwhile, Utah is seemingly happy with anything as long as the writeup is under five pages long. Utah’s contest also stands out in its near-total absence of legal fine print. There are no mention of intellectual property implications, which is perhaps fitting when the team is asking participants to bring their own data and analysis. [...] Open casting calls such as Utah’s analytics challenge start out as a lose-lose-lose proposition: > The employer loses because it will have to invest massive human resources to trawl/filter/evaluate/reverse-engineer the hundreds of write-ups it is sure to receive, with no guarantee that any of them will be of use > Applicants lose because the vast, vast majority of them will have nothing to show for their efforts, while a tiny minority risks having its IP stolen > Good ideas lose because they’ll be born into an environment where their parents (the applicant & the employer) have no defined relationship and won’t be in a position to grow together
link, archive link
I do try to keep things light on this blog, but this is super personal for me <3 thank u for listening
#so glad the majority of the reaction to this has been to shit on it tbqh. GET THEIR ASSES#TRYING OUT ADDING ARCHIVE LINKS WHEN I CAN !! FUCK WEBROT!!! AND FUCK THEM IF THEY TRY TO DELETE THE EVIDENCE!!!#Utah HC#Utah Hockey Club#puckposting
38 notes
·
View notes
Text
Tips for the Best Way to Learn Python from Scratch to Pro
Python, often regarded as one of the most beginner-friendly programming languages, offers an excellent entry point for those looking to embark on a coding journey. Whether you aspire to become a Python pro or simply want to add a valuable skill to your repertoire, the path to Python proficiency is well-paved. In this blog, we’ll outline a comprehensive strategy to learn Python from scratch to pro, and we’ll also touch upon how ACTE Institute can accelerate your journey with its job placement services.

1. Start with the basics:
Every journey begins with a single step. Familiarise yourself with Python’s fundamental concepts, including variables, data types, and basic operations. Online platforms like Codecademy, Coursera, and edX offer introductory Python courses for beginners.
2. Learn Control Structures:
Master Python’s control structures, such as loops and conditional statements. These are essential for writing functional code. Sites like HackerRank and LeetCode provide coding challenges to practice your skills.
3. Dive into Functions:
Understand the significance of functions in Python. Learn how to define your functions, pass arguments, and return values. Functions are the building blocks of Python programmes.
4. Explore Data Structures:
Delve into Python’s versatile data structures, including lists, dictionaries, tuples, and sets. Learn their usage and when to apply them in real-world scenarios.
5. Object-Oriented Programming (OOP):
Python is an object-oriented language. Learn OOP principles like classes and objects. Understand encapsulation, inheritance, and polymorphism.
6. Modules and Libraries:
Python’s strength lies in its extensive libraries and modules. Explore popular libraries like NumPy, Pandas, and Matplotlib for data manipulation and visualisation.
7. Web Development with Django or Flask:
If web development interests you, pick up a web framework like Django or Flask. These frameworks simplify building web applications using Python.
8. Dive into Data Science:
Python is a dominant language in the field of data science. Learn how to use libraries like SciPy and Scikit-Learn for data analysis and machine learning.
9. Real-World Projects:
Apply your knowledge by working on real-world projects. Create a portfolio showcasing your Python skills. Platforms like GitHub allow you to share your projects with potential employers.
10. Continuous learning:
Python is a dynamic language, with new features and libraries regularly introduced. Stay updated with the latest developments by following Python communities, blogs, and podcasts.

The ACTE Institute offers a structured Python training programme that covers the entire spectrum of Python learning. Here’s how they can accelerate your journey:
Comprehensive Curriculum: ACTE’s Python course includes hands-on exercises, assignments, and real-world projects. You’ll gain practical experience and a deep understanding of Python’s applications.
Experienced Instructors: Learn from certified Python experts with years of industry experience. Their guidance ensures you receive industry-relevant insights.
Job Placement Services: One of ACTE’s standout features is its job placement assistance. They have a network of recruiting clients, making it easier for you to land a Python-related job.
Flexibility: ACTE offers both online and offline Python courses, allowing you to choose the mode that suits your schedule.
The journey from Python novice to pro involves continuous learning and practical application. ACTE Institute can be your trusted partner in this journey, providing not only comprehensive Python training but also valuable job placement services. Whether you aspire to be a Python developer, data scientist, or web developer, mastering Python opens doors to diverse career opportunities. So, take that first step, start your Python journey, and let ACTE Institute guide you towards Python proficiency and a rewarding career.
I hope I answered your question successfully. If not, feel free to mention it in the comments area. I believe I still have much to learn.
If you feel that my response has been helpful, make sure to Follow me on Tumblr and give it an upvote to encourage me to upload more content about Python.
Thank you for spending your valuable time and upvotes here. Have a great day.
6 notes
·
View notes
Text
Exploring the World of Data Analytics: Opportunities and Beyond
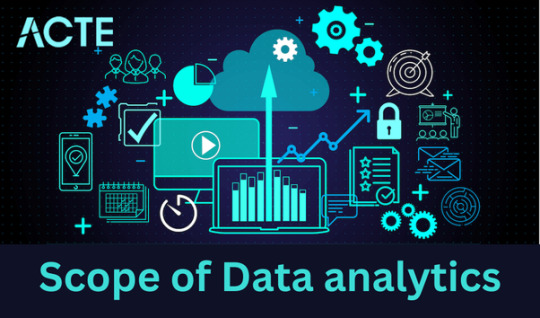
Describe data analytics. Analyzing data to find useful information, patterns, and trends is known as data analytics. Businesses adore it since it aids in their improvement. It’s similar to solving problems with data.
Why is data analysis so crucial? Consider yourself in possession of a treasure map (data) and the desire to locate the treasure (insights). Your compass is data analytics.
Why it matters is as follows: It aids in your understanding of consumer behavior, market trends, and company performance.
Efficiency: You can discover areas in which your company may save both time and money.Smart decisions: When using data, you may base decisions on facts rather than educated guesswork.
Personalization: Have you ever seen how Netflix suggests shows? That is data analysis.
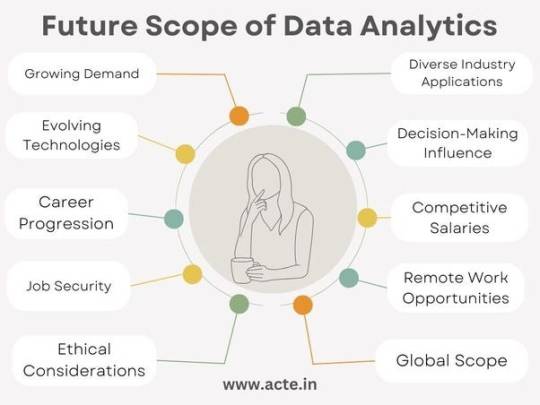
Future Scope of Data Analytics :
High Demand: Many businesses in different industries need data experts because they use data to make smart choices. So, the need for skilled data analysts is growing.
Various Job Fields: Data skills are useful everywhere, not just in one industry. You can work in finance, healthcare, e-commerce, marketing, or technology. This means you have many options for your career.
Tech Keeps Changing: The tools and methods for working with data keep getting better and different. It’s important to keep learning new things, but it also means you can become an expert in a special area.
Helping Decisions: Data people play a big role in helping businesses make important decisions. What you find in data can change how a company plans for the future.
Career Growth: Starting as a data analyst can lead to better and higher-paying jobs like data scientist or machine learning engineer.
Good Pay: Data analysts are paid well. As you get better at your job, you can earn even more.
Job Security: As long as companies use data, they’ll need people who understand it. So, you’ll have a stable job.
Work from Anywhere: You can often do data work from anywhere, giving you flexibility in where you live.
Ethical Data: Data privacy and being fair with data are important. People who can make sure data is used the right way are in demand.
Worldwide Opportunities: Data skills are needed all over the world, so you
can work in different countries if you want.
Careers in Data Analytics:
Data Analyst: The entry point They collect, clean, and analyze data.
Data Scientist: The Experts They use machine learning to solve complex puzzles.
Business Analyst: The bridge between data and business decisions
Big Data Engineer: They manage massive data sets using big data tools.
Healthcare Analyst: They use data to improve healthcare outcomes.
Marketing Analyst: Masters of measuring marketing success
Financial Analyst: They use data for financial strategies.
Sports Analyst: They play with data in the world of sports.
The Future of Data Analytics:
AI and machine learning: Think smarter, not harder. Automation will rule.
IoT Analytics: Connected devices will provide more data than ever.
Ethical Analytics: Data privacy will be a top concern.
Data Visualisation: Making data pretty and easy to understand will be big.
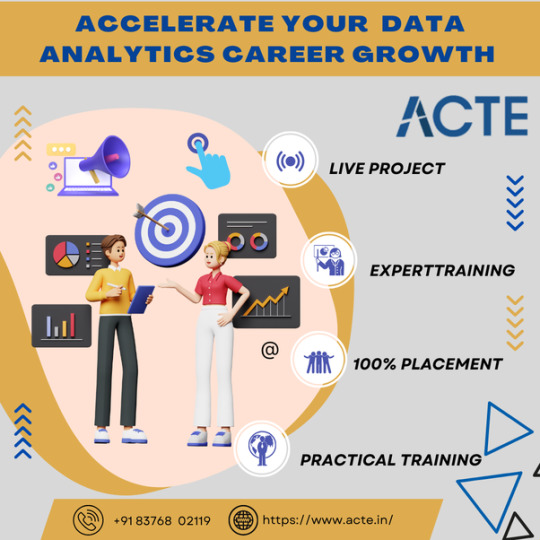
Feel free to get in touch with an ACTE institution if you want to learn more about Data Analytics because they provide certifications and possibilities for job placement. Teachers with experience can improve your learning. These services are available offline and online. Take things slowly and, if you’re interested, think about signing up for a course.
I hope I was able to effectively respond to your query. If it’s not, add it in the comments section. I still think I have a lot to learn.
Consider following me and giving this answer an upvote if you found it to be useful. This will motivate me to post more information on data analytics.
We appreciate you taking the time to read this and voting it up. Enjoy your day.
#data analytics#data analysis#data analytics course#data analyst jobs#data analyst training#data analyst certification#data analyst course
3 notes
·
View notes
Text
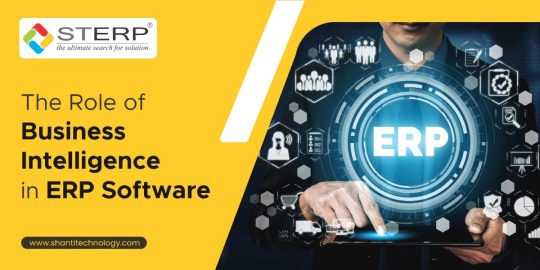
The Role of Business Intelligence in ERP Software
Enterprise Resource Planning (ERP) software providers like STERP (Shanti Technology), an excellent ERP software company in Madhya Pradesh, understand the value of Business Intelligence (BI) within this context. STERP, a leading provider of manufacturing ERP software in Indore, recognises the potential of business intelligence (BI) to turn collected data into a competitive advantage.
Business intelligence (BI) in the context of enterprise resource planning (ERP) refers to the processes involved in collecting, preparing, and analysing data from a wide variety of ERP subsystems. This suite of state-of-the-art methods and technologies produces insightful reports that may be used for strategic planning, performance monitoring, and operational optimisation.
STERP, a leading ERP software company in Madhya Pradesh and one of the top ERP solution providers in Indore understands the significance of a robust BI system for monitoring key performance indicators (KPIs), tracking trends, identifying patterns, and uncovering hidden opportunities and risks. Data analytics can be put to use in businesses for potential gains in productivity, cost savings, customer satisfaction, and innovation.
STERP, one of the most distinguished ERP software companies in Madhya Pradesh, promises cutting-edge BI tools in all of its ERP packages. By providing intuitive dashboards, customizable reports, and real-time analytics, STERP provides its customers with a bird's eye view of their operations. Let's explore the role that business intelligence plays in enterprise resource planning systems.
Data Integration and Consolidation for Informed Decision-Making:
Integrated and consolidated data is crucial for businesses like STERP, one of the most reliable ERP software providers in Madhya Pradesh, to make well-informed decisions. As an industry leader in manufacturing ERP software in Indore, STERP is well aware of the need of combining and integrating data from several sources.
The term "consolidation" refers to the process of collecting and harmonizing data from several locations. In its capacity as one of the leading ERP software firms in Madhya Pradesh and ERP solution providers in Indore, STERP facilitates the consolidation of data from disparate sources into a single repository. Data centralization ensures that all firm decision-makers and executives are using the same, reliable information.
Reporting and Analytics for Performance Monitoring:
In order to generate reports, it is necessary to construct and present organised data in an understandable and unambiguous way. STERP's ERP software makes it simple for businesses to tailor reports to their specific requirements, allowing for deeper analysis of sales, inventory, production, and finances.
By evaluating data and providing reports, STERP, a well-known manufacturing ERP software provider in Indore, aids numerous firms in gaining insight into their processes. Real-time dashboards and visualisations allow executives to identify bottlenecks, allocate resources effectively, streamline processes, and make educated strategic decisions.
Predictive Analytics and Forecasting for Strategic Planning:
Strategic decision-making at STERP, a distinct ERP software company in Madhya Pradesh, is significantly influenced by analytics and forecasting. As one of the most distinguished ERP solution providers in Indore, STERP recognises the significance of analytics and forecasting in directing business growth and strategy.
Utilising historical information, statistical algorithms, and machine learning techniques, predictive analytics allows for precise forecasting and prediction. In order to stay ahead of the competition, businesses can use predictive analytics to forecast demand, identify risks, determine the most efficient use of resources, and make other proactive decisions.
Self-Service BI and Empowering End Users:
Being one of the trusted ERP solution providers in Indore and a top manufacturing ERP software company in Indore, STERP appreciates the importance of self-service BI in empowering end users to make better, more efficient decisions.
Self-service BI allows end users to access and update data without involving IT or data analysts. To make data exploration, report preparation, and insight production accessible to users of all skill levels, STERP offers intuitive interfaces and clear tools. Users are empowered to make decisions at the moment based on accurate data without relying on IT, thanks to self-service BI.

Final Thoughts:
Business intelligence (BI) is crucial in ERP. Companies like STERP (Shanti Technology), a distinct ERP software company in Madhya Pradesh, appreciate the value of BI since it helps them to leverage data for strategic decision-making and planning. When businesses are able to consolidate and integrate their data, they are able to view the big picture of their operations, and the reporting and analytics functions give them insight into KPIs. In addition, businesses can use forecasting and predictive analytics to anticipate future trends, mitigate risks, and seize opportunities. Self-service BI provides end users with straightforward tools to access and analyse data on their own, fostering a culture of data-driven decision-making and increasing productivity.
#Manufacturing ERP software in Indore#ERP Software Company in Madhya Pradesh#ERP solution providers in Indore#ERP software Companies in Madhya Pradesh#manufacturer#ERP system#cloud ERP#ERP solutions#marketing#ERP software#engineering ERP#business#process
6 notes
·
View notes
Text
https://www.ivedatadriven.com.au/data-analytics-and-visualisation/
At IVE data driven, we know the importance of data and how data-led decisions can affect your business. So, we are dedicated to helping businesses utilise their data and impactful decisions. With our efficient data analytics services, you can rest assured of business insights and growth. From single-source data dashboards to a strategic reporting framework, our data scientists will ensure you get all the important data by removing clutter. And to ensure the best results, we take a personalised approach towards your business. So, our team will first assess your current marketing strategy and data infrastructure. So, don’t get lost in data, contact our team and stay on top of your business insights.
2 notes
·
View notes
Text
Choosing the Right Data Visualization Services: Key Features and Benefits

Introduction
In the age of big data, businesses rely on data visualization services to convert raw data into clear, insightful visuals that drive informed decision-making. Choosing the right data visualization service can significantly impact an organization's ability to analyze trends, identify patterns, and communicate insights.
1. Understanding Data Visualization Services
Data visualization services provide tools and techniques to represent complex datasets through interactive dashboards, graphs, charts, and infographics. These services help organizations:
Simplify complex data for better understanding.
Identify trends, anomalies, and correlations.
Make faster, data-driven decisions.
Improve reporting and business intelligence.
2. Key Features to Look for in Data Visualization Services
When selecting a data visualization service, businesses should consider several essential features to ensure effective and efficient data representation.
1. User-Friendly Interface
An intuitive dashboard allows users, including non-technical stakeholders, to interact with and interpret data effortlessly.
Drag-and-drop functionalities and pre-built templates enhance ease of use.
2. Customization and Flexibility
The service should offer customizable charts, color schemes, and layouts to align with business branding and reporting needs.
Businesses require scalability to handle growing data volumes and diverse data sources.
3. Integration Capabilities
It is crucial to seamlessly integrate with various data sources, including databases, cloud storage, CRM, ERP, and third-party applications (such as Google Analytics or Salesforce).
4. Real-Time Data Processing
Live data streaming enables businesses to monitor key metrics in real-time, facilitating quick decision-making and immediate action.
5. Advanced Analytics and AI-Driven Insights
Many modern data visualization services integrate machine learning (ML) and artificial intelligence (AI) to detect patterns, provide predictive analytics, and offer smart recommendations.
6. Interactive and Dynamic Dashboards
Interactive features like drill-down capabilities allow users to explore data at different levels of granularity.
Filters and search functionalities enhance user engagement.
7. Data Security and Compliance
Given the sensitivity of business data, the service should offer robust security features, including encryption, access controls, and compliance with data regulations (e.g., GDPR, HIPAA).
8. Collaboration and Sharing Tools
Team members should be able to share dashboards and reports easily via cloud-based access, scheduled reports, or embedded analytics.
3. Benefits of Choosing the Right Data Visualization Service
1. Enhanced Decision-Making
Well-structured visual reports allow businesses to make faster, data-driven decisions based on real-time insights.
2. Increased Operational Efficiency
Automating data reporting reduces manual efforts, saving time and resources for strategic tasks.
3. Improved Data Accuracy and Consistency
Data visualization tools eliminate errors associated with manual analysis and reporting, ensuring accurate insights.
4. Competitive Advantage
Businesses that leverage data visualization effectively gain a competitive edge by proactively identifying emerging trends and adapting strategies.
4. Popular Data Visualization Tools and Services
Some leading data visualization services include:
Tableau: Advanced analytics and interactive dashboards.
Microsoft Power BI: Seamless integration with Microsoft products.
Google Data Studio: Free and user-friendly for marketing analytics.
Looker: Customizable data exploration for businesses.
Conclusion
Selecting the right data visualization service is crucial for businesses looking to enhance decision-making, improve efficiency, and gain a competitive edge. Organizations can ensure that their chosen solution meets their needs by prioritizing key features such as user-friendliness, real-time processing, security, and integration capabilities.
1 note
·
View note
Text
"From Strategy to Execution: Enabling Growth through Digital Transformation Services"
"From Strategy to Execution: Enabling Growth through Digital Transformation Services" focuses on the journey of organizations as they embrace digital transformation. It highlights the importance of a well-defined strategy and effective execution in driving growth and success through the adoption of digital transformation services.
Developing a Digital Strategy: Organizations must align their business objectives with a comprehensive digital strategy. This involves identifying areas for improvement, setting clear goals, and outlining a roadmap for digital transformation. A robust strategy serves as a guiding framework for leveraging digital technologies and services to drive growth.
Embracing Technological Advancements: Digital transformation services enable organizations to leverage cutting-edge technologies that enhance efficiency, productivity, and customer experiences. This includes adopting cloud computing, implementing data analytics, harnessing artificial intelligence, and leveraging automation solutions to streamline processes and gain a competitive edge.
Enhancing Customer Experiences: Digital transformation services empower organizations to deliver personalized and seamless customer experiences across various touchpoints. By leveraging data-driven insights, organizations can understand customer preferences, tailor offerings, and optimize engagement, ultimately driving customer satisfaction and loyalty.
#data analytics#digital services#data visualisation#testing#web security#digital transformation#full services support
0 notes
Text
Price: [price_with_discount] (as of [price_update_date] - Details) [ad_1] R programming is an efficient tool for statistical analysis of data. Data science has become critical to Each field and The popularity of R is skyrocketing. Organization as large and diverse as Google, face book, Microsoft, Bank of America, Ford motor company, Mozilla, Thomas cook, The new York Times, The National weather service, Twitter and Bank, Uber, Airbnb etc. Have turned to R for reporting, analyzing and visualisations of data, This book is for students and professionals of Mathematics, statistics, Physics, Chemistry, Biology, social Science and medicine, business, engineering, software, information Technology, sales, bio Informatics, pharmacy and any one, where data needs to be analysed and represented graphically. salient features of The bookshelf;/strong best self-study material and reference guide. and Lt; teaches how to apply various statistical methods to data science. and Lt; help statistician and professional to leverage strength by combining their domain expertise with data analysis capability of R. and Lt; more than 300 solved and tested programmes provided. and Lt; a comprehensive book covering all areas of R in detail. table of content chapter 1 - Introduction; Chapter 2 - Data types operations Chapter 3 - flow control Chapter 4 - functions package; Chapter 5 - charts and graphs; Chapter 6 - connecting R to external interface; Chapter 7 - elementary statistics; Chapter 8 - tests of hypotheses Chapter 9 - Non parametric tests Chapter 10 - analysis of variance; Chapter 11 - and NBE; basic multivariate analysis; Chapter 12 - Advanced multivariate analysis; Chapter 13 - Advanced graphs. Publisher : Khanna Book Publishing; 1st edition (1 January 2018); Khanna Book Publishing Language : English Paperback : 368 pages ISBN-10 : 938617345X ISBN-13 : 978-9386173454 Item Weight : 300 g Dimensions : 20.3 x 25.4 x 4.7 cm Country of Origin : India Importer : Khanna Book Publishing Packer : Khanna Book Publishing Generic Name : Books [ad_2]
0 notes
Text
Revolutionising Data Collection with 3D Laser Scanning and Drone Surveying in Melbourne
LiDAR Solutions brings state-of-the-art technology to Melbourne, helping businesses capture precise data with ease. Our 3D laser scanning Melbourne services deliver unparalleled accuracy for projects across construction, engineering, and heritage restoration. By using advanced laser technology, we provide detailed 3D models that save time, reduce errors, and streamline planning processes.

With 3D laser scanning Melbourne, you can map intricate structures and complex environments quickly and effectively. Our team ensures every scan meets the highest standards, enabling you to visualise and measure assets with precision. Whether you’re managing a building project or preserving historical landmarks, our scanning solutions provide the reliable data you need.
In addition to ground-level solutions, LiDAR Solutions offers a comprehensive drone surveying service for aerial data collection. This service provides high-resolution imagery and mapping for land development, infrastructure projects, and environmental studies. By deploying drones equipped with cutting-edge sensors, we help you access hard-to-reach areas while ensuring safety and efficiency.
Combining 3D laser scanning Melbourne with our drone surveying service creates a complete picture of your project. This integrated approach captures both detailed ground-level measurements and expansive aerial views, delivering a holistic understanding of your site. With these insights, you can make informed decisions and improve project outcomes.
LiDAR Solutions works closely with Melbourne businesses to tailor services to specific needs. Our experienced team delivers accurate results, ensuring every project benefits from the latest technology. By choosing us, you invest in precision, efficiency, and a commitment to excellence.
Contact LiDAR Solutions today to learn how our drone surveying service and 3D laser scanning Melbourne solutions can elevate your projects. Let us provide the tools you need to innovate, save time, and achieve outstanding results.
Source
0 notes
Text
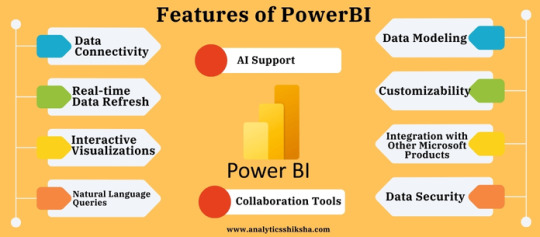
Power BI has many features to help with analyzing and visualising data in the format chosen by the user. Here are some of the key features of Power BI:
Data Connectivity: Using Power BI it is possible to connect to a wide range of data sources, including cloud services and local databases.
Real-time Data Refresh: It provides features for refreshing the data in real time.
Interactive Visualizations: The software allows users to create and share interactive and immersive reports and dashboards with multiple visualizations.
Natural Language Queries: Another capability being offered to business users is the natural language queries through which users can ask questions and get responses in form of charts and graphs.
Data Modeling: It has comprehensive data modeling capabilities that support the handling of large amounts of data and provides tools to change the data when necessary.
Customizability: Power BI provides users with a flexible option to design the layout of the dashboard or a report according to the organization needs.
Integration with Other Microsoft Products: It is well aligned with other Microsoft business apps like Microsoft Azure and Office 365 for the interoperation of data.
Data Security: Possesses strong security measures at various tiers, including the option to regulate data’s accessibility and use.
AI Support: Azure AI is integrated with Power BI to provide users with direction within data to make better decisions.
Collaboration Tools: Provides options for sharing and publishing of dashboards and reports through the Power BI service. Learn More:-https://www.analyticsshiksha.com/blog/what-is-power-bi-data-analysis-features-uses-benefits
#Natural Language Queries#Collaboration Tools#Data Security:#Microsoft Products#Data Connectivity:#Power BI#data analytics courses in delhi#data analytics courses
0 notes
Text
Procurement Data Analysis | Data Visualisation | Data Categorisation | Data Services
Optimise your purchasing decisions with PI Data Analytics. Our solutions leverage the Purchasing Index to provide real-time insights, ensuring smarter procurement strategies. Experience effective spend management through tailored data visualisation
#PIDataAnalytics#PIAnalytics#DataAnalyticsforProcurement#ProcurementDataAnalytics#ProcurementDataAnalysis#PurchasingIndex
0 notes