Don't wanna be here? Send us removal request.
Text
New York City: Data Analytics of Venues and Airbnb Postings
1. Introduction
New York City has been one of the most popular destinations for tourists from all over the world for centuries. Because NYC is a melting pot of American culture, there is always something for every style, taste and budget. With more than 40 million people visitors coming to NYC each year, it is important to do some research to decide where to stay.
NYC is also the most populated and most diverse city in the U.S. with more than 8 million residents coming from every corner of the world. Airbnb provides a new way for tourists to book their rooms in NYC while residents can make extra money by posing their spare rooms online. Airbnb becomes an increasingly popular choice for travelers rather than traditional hotels.
People can choose from entire home/apartment, private room, and shared room depending on the budget. Rooms spread over every corner of NYC, from downtown Manhattan to Rockaway Beach that people can choose where they want to stay.
This project will provide information on what to eat/see/do in each neighbourhood, and location/price/types of Airbnb postings. It will help tourists to decide which neighbourhood is the best choice to stay for their trip.
2. Data Source
Airbnb data describes the listing activity and metrics in NYC, NY for 2019 (https://www.kaggle.com/dgomonov/new-york-city-airbnb-open-data). The dataset includes information of hosts, room types, prices, location, and reviews of each posting.
Based on the location, rooms can be grouped by neighbourhoods or boroughs, then types, prices, reviews data can be analyzed through the calculation and visualization. The number of reviews and prices can be predicted by applying regression machine learning models.
The venues in each neighbourhood can be obtained using Foursquare API, which includes name, location, and category. Neighbourhoods can be clustered based on the frequency and variety of venues. The labels can be used to help cluster Airbnb rooms and predict prices and reviews.
3. Methods: Data Cleaning, Analysis and Visulization
3.1 Airbnb Data
Airbnb postings of New York City were read from a csv file and save into a dataframe 'airbnb'. It contains the information of each posting such as name, host, location, price, room type, reviews, etc. It has 48895 postings and 16 features.
To begin with, all postings with zero or null value of price, which are regarded as invalid, will be dropped off. After cleaning, 48884 postings were left for future analysis.
Postings were then divided into different neighbouhoods based on their locations and were saved into a dataframe 'neighbourhood'. The geographical coordinates of each neighbourhood can be obtained by using Google api. Along with geographical coordinates of each posting, a heatmap showing the density of Airbnb rooms in New York City can be generated by using 'folium'. The markers are names of neighbourhoods and numbers of postings. The top 20 neighbourhood with most and least postings were bar plotted and labeled by borough. The share and number of rooms in each borough were also plotted.
The maximum, minimum, average and median price and review of postings in each neighbourhood can be calculated and added into the dataframe 'neighbourhood'. The top 20 most expensive and cheapest neighbourhoods were plotted and labeled by borough. Neighbourhood price distritbution of each borough was also plotted. The distribution of all reviews was obtained and divided into four groups based on the number of reviews. The top 20 most and least reviewed neighbourhoods were plotted and labeled by borough.
Based on the price, by apply K-Means clustering unsupervised machine learning model, neighbourhoods were divided into 5 clusters. Labeled neighbourhoods were displayed on the map of New York City with different colors. Similarly, clustering was conducted on the neighbourhoods based on the reviews data and subsequently displayed on the map.
By using the data of location, room type, minimum nights, reviews and availability, regression machine learning models were applied to predict the price of a posted Airbnb room.
3.2 Foursquare Data
Nearby venues data of each neighbourhood in New York City were obtained using Foursquare API and saved as 'NY_venues.csv'. The info includes the venue's name, location, and category. The heatmap of density of venues was displayed on the map of New York City. The markers are names of neighbourhoods. In total 22077 venues were obtained with 341 different venue categories.
The frequency of each venue category in a neighbourhood was calculated. Based on the frequency data, K-Means clustering machine learning model was applied to divide neighbourhoods into different groups. Labeled neighbourhoods were displayed on the map of New York City with different colors.
The venue category was also ranked based on its frequency in each neighbourhood. A defined parameter 'Score' was introduced and used to find the most common venue categories in a given labeled neighbourhood group. Top 8 highest scored categories were plotted in different groups.
3.3 Guide and Recommendations for Tourists
The overall analysis and visualization of Airbnb data gave tourists some guide and recommendations on where to stay during their visits, and results from Foursquare data could tell tourists what to eat/see/do in the nearby neighbourhoods.
4. Results and Discussions
4.1 Airbnb - Number
There are in total 48884 postings on Airbnb in New York City. Most rooms are located in two boroughs, Manhattan and Brooklyn. More than 20000 rooms in each borough, Queens is in the middle with about 6000 rooms, the other two Bronx and Staten Island don't provide many choices (Figure 4.1.1).
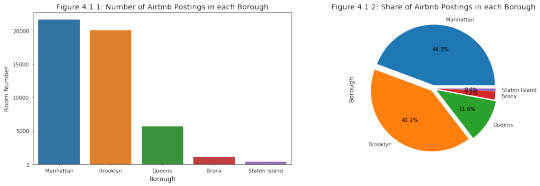
Manhattan and Brooklyn have more than 89% of all available rooms, while Staten Island and Bronx only have 3% of the rooms (Figure 4.1.2). For tourists, the most common choices of which Borough to stay is usually either Manhattan or Brooklyn.
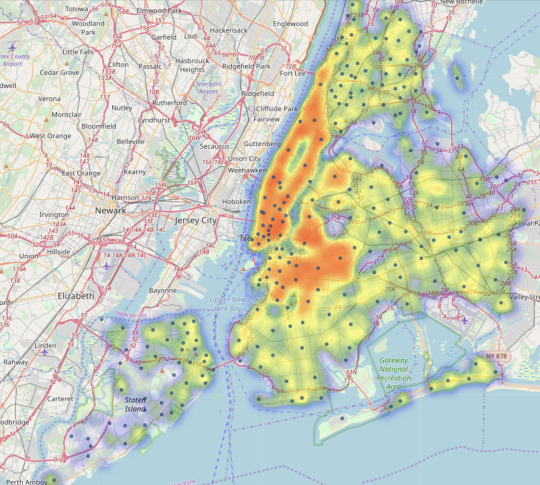
A map of New York City with neighbourhoods as markers along with a heatmap of airbnb postings was generate and shown below. Red represents the highest density of rooms and green represents low density. Manhattan and Brooklyn have the highest density of rooms comparing with the rest three boroughs. But the neighbourhoods are approximately evenly distributed across the New York City regardless of the borough.
Considering which neighbourhood has the most or least available rooms for tourists to choose, the top 20 with most and least room neighbourhoods are shown in Figure 4.1.3 and 4.1.4. Apparently, most choices are provided in neighbourhood located in Brooklyn and Manhattan.
The top 5 are Williamsburg, Bedford-Stuyvesant, Harlem, Bushwick, Upper West Side. These neighbourhoods give tourists many choices.
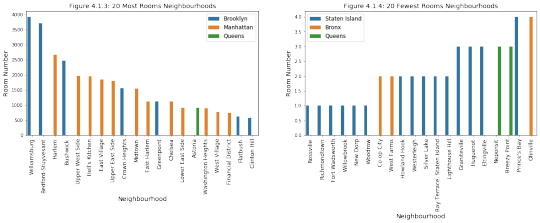
However, tourists don't have many options if they want to stay in Staten Island. Rossville, Richmondtown, Fort Wadsworth, Willowbrook, New Dorp all only have 1 posting on Airbnb.
However, the number of postings in a neighbourhood does not necessarily tell tourists if it is a great place to stay during their travel. Maybe there are many residents in that area and they want to earn some extra money by posting their rooms on Airbnb. Thus, it is important to analyze prices and reviews on the postings as discussed in the following sections.
4.2 Airbnb - Price
The average and median prices of each neighbourhood were calculated. Median price is used to illustrate the price level of a neighbourhood.
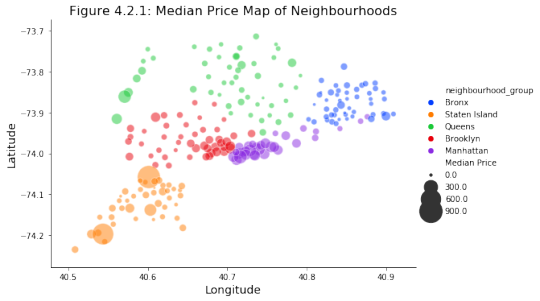
Locations of neighbourhoods and their median posting price are shown in Figure 4.2.1. Size of the marker represents the median price. Neighbourhoods in Manhattan are close to each other at high prices. Neighbourhoods in Brooklyn which are close to Manhattan are more expensive than those are far from Manhattan. Bronx has dense but cheap neighbourhoods. Neighbourhoods in Queens spread over a large area with relatively low prices. Staten Island is far from the rest four boroughs and has a wide range of prices.
A price of $400 per night was chosen as the highest price most tourists could afford during a trip to New York City. Usually, one night in hotel is between $100 and $400 depending on which area to stay.
A box plot of median price in each borough shows the price range and distribution of neighbourhoods (Figure 4.2.2). Manhattan is the most expensive borough, and Brooklyn is the second one. Even though Bronx has more neighbourhoods than Staten Island, but the price is the lowest. Queens has the moderate price as well as the middle level of rooms.
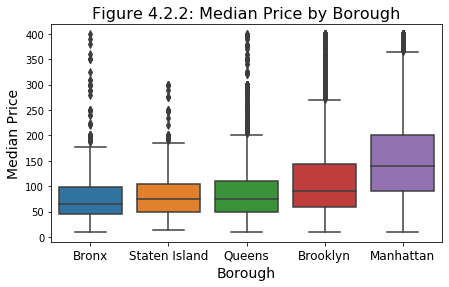
With more rooms than other boroughs, Manhattan and Brooklyn also have the widest range of price. In general, the price is proportional to the number of rooms in a neighbourhood.
The top 20 neighbourhoods with the highest or least prices are shown in Figure 4.2.3 and 4.2.4. Only neighbourhoods with more than 5 postings are considered in the plots.
Almost all most expensive neighbourhoods are in Manhattan, undoubtedly Manhattan is the heart of New York City. The top 5 are Tribeca, NoHo, Flatiron District, Midtown, West Village, which are all located in the core area of Manhattan with more than $200 per night.
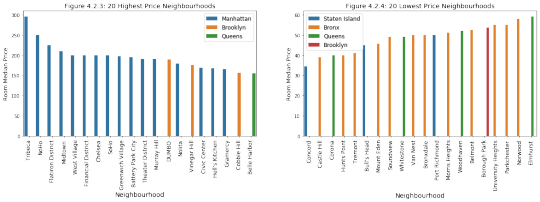
The cheapest 5 neighbourhoods are Concord, Castle Hill, Corona, Hunts Point, Tremont in Staten Island, Bronx and Queens. The prices are lower than $50 per night. Tourists with a limited budgets can choose these neighbourhoods.
Generally speaking, the price is proportional to the number of rooms in a borough. However, this does not tell tourists which a group of neighbourhoods are affordable or expensive.
Therefore, clustering of neighbourhoods with features Average Price, Standard Deviation Price, and Median Price was performed to assign a label to different neighhourhood. The box plot of the median price in each clustering labeled group is shown in Figure 4.2.5.
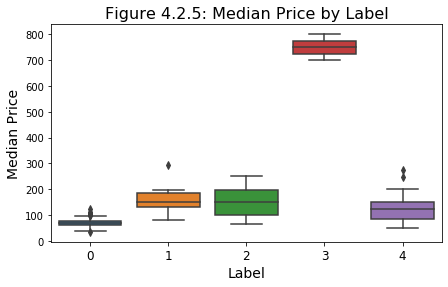
Label 3 has the highest price (more than $700) and way more than the other labels. Label 0 is the cheapest group with most prices lower than $100.
Based on the price distribution of each group, the label can be renamed by Low, Moderate, High, Very High, Extreme High.

Only 8 neighbourhoods fall in Very High and Extreme High groups which tourists may want to avoid when looking for good deals. And they can pick from the rest 3 groups depending on their budgets.
A map of New York City with price labels of neighbourhoods are shown below.
Two 'Extreme High' neighbourhoods (red) are both located in Staten Island.
Six 'Very High' neighbourhoods are in different boroughs are all close to the shoreline.
Most 'High' neighbourhoods are in Manhanttan midtown and downtown, with most major scenic spots around the corner.
'Low' neighbourhoods distribute all over the city but most of them are at suburban areas, public transportation is limited. But some of them are close to the airport, which is recommended for tourists who want to get a good deal before the flight.
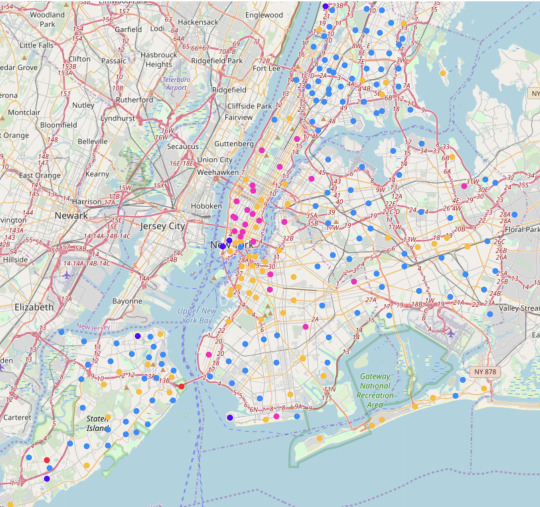
'Moderate' neighbourhoods are most recommended for tourists who want to stay near urban areas with easy access to the city and with a relative affordable price.
4.3 Airbnb - Review
The number of reviews is an important feature to evaluate the popularity of a given posting. A large number of reviews usually mean that this room has a good history and is more popular compared with other rooms in that neighbourhood.
However, there are lots of postings which don't have any review record. Probably they are newly published on the Airbnb, or more interestingly, those postings are not welcome at all by tourists.
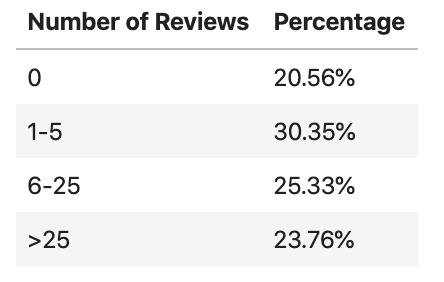
Below is a table showing the distribution of the number of reviews. The average value is 23.27 reviews with a standard deviation of 44.55. However, about 20% of postings do not have any reviews. Half postings have reviews less than 5. This half postings are not recommended due to their lack of review history.
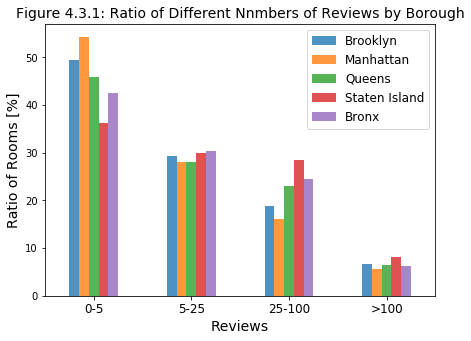
The ratio of different numbers of reviews by borough is shown in Figure 4.3.1. Even though Manhattan and Brooklyn have more postings than anywhere else, more than 50% of them are poorly reviewed. In comparison, postings in Staten Island have relatively more reviews than others. Highly reviewed postings with more than 100 reviews are only less than 10%.
Total reviews of all postings in a neighbouhood is calculated and plotted (Figure 4.3.2). It is used to describe the number of rooms as well as the reviews of those rooms. Top neighbourhoods have not only more options for tourists to choose and most previous tourists prefer staying here. On the other hand, bottom neighbourhoods mean tourists rarely chose to stay there.
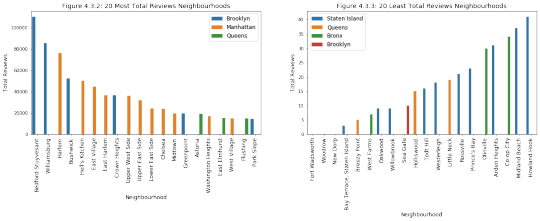
Top choices are all in Brooklyn and Manhattan, which are recommended for tourists because of their good records. Lowest neighbourhoods are poorly reviewed that tourists may want to avoid when searching for rooms.
In addition to price, reviews give tourists more information about a neighbourhood on whether it is a reliable place to stay.
Therefore, clustering of neighbourhoods with features Number of Rooms, Average Reviews, Total Reviews, and Median Reviews was performed to assign a label to different neighhourhoods.
The box plot of average reviews in each clustering labeled group is shown in Figure 4.3.4.
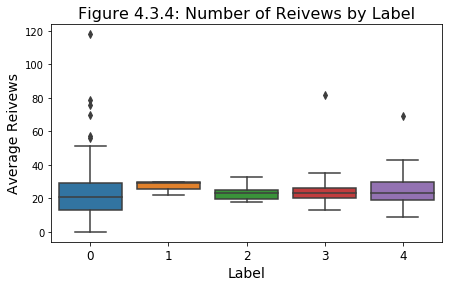
Label 0 and 4 have a wide range of average reviews. Label 1 has the most average reviews.
Based on the mean number of rooms, mean number of reviews, each group can be renamed as below. 10 neighbourhoods has a large number of rooms as well as reviews

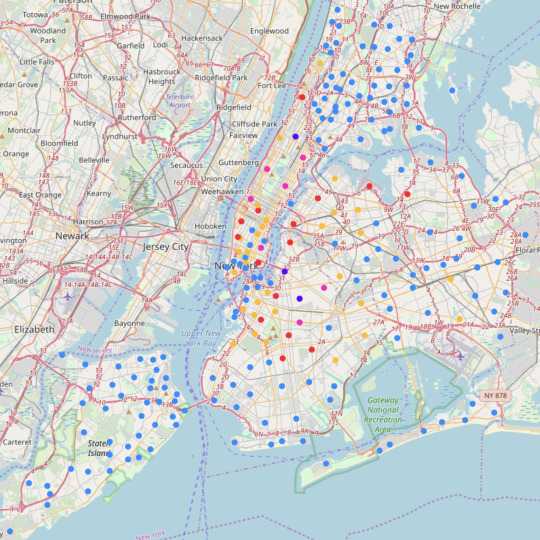
A map of New York City with review labels of neighbourhoods are shown below.
4.4 Airbnb - Price Prediction
The features of postings used for price prediction are 'latitude','longitude', 'room_type', 'minimum_nights', 'number_of_reviews', 'reviews_per_month', 'calculated_host_listings_count', and 'availability_365'.
Multiple linear regression model (LR), polynomial linear regression model (PLR) and K nearest neighbors regression model (KNR) were used for prediction. 80% of dataset was used as training data, the rest 20% was used for validation.
The R^2 scores of three models are shown below. The validation curves of LR and KNR are shown below.
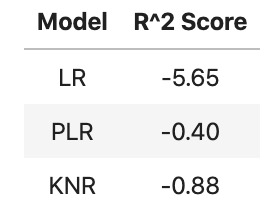

The regression models predict the trend but were not able to build a reliable price prediction model using the existing data. Because other factors like the year of the room, furniture, facilities, etc. significantly affect the results.
4.5 Foursquare - Clustering
Name, location and category of venues within 5 km of neighbourhoods were obtained using Foursquare API. A map of New York City with neighbourhoods as markers along with a heatmap of nearby venues was generated and shown below. Red represents the highest density of rooms and green represents low density. Because the number of the venue is limited as 100 by Foursquare, the heatmap has some blank areas. Manhattan and Brooklyn have the highest density of venues comparing with the rest three boroughs.
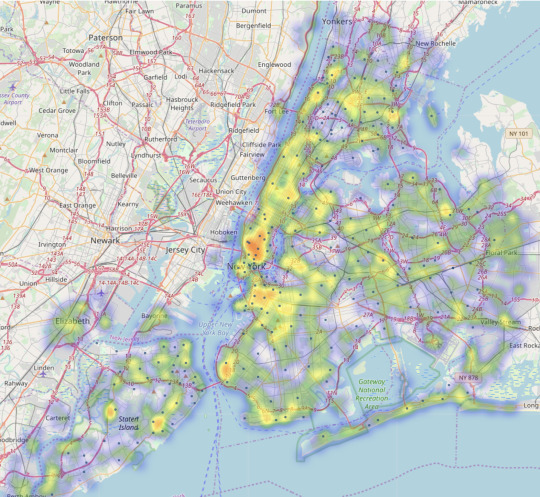
The frequency of nearby venue category was calculated for the neighbourhoods. The 1st to 15th most common categories were listed for each neighbourhood. Based on the frequency of categories, the neighbourhoods were clustered by 7 groups.
A defined parameter 'Score' was introduced and used to find the most common venue categories in a given labeled neighbourhood group. Top 8 highest scored categories were plotted in different groups.
For label 0 to 5, Pizza Place and Italian Restaurants are the two most common venues, which also indicates how much love New Yorkers have for pizza and Italian foods.
Label 0 has more bakery and grocery stores. This means this group contains neighbourhoods in residential areas without many scenic spots.
Label 1 has many venues of coffee shop, ice cream shop, bar and bakery, at the same time, it also has parks and beaches for tourists to choose. It is more like vacation areas for tourists to relax and enjoy.
Label 2 has a lot more bars, cocktail bars and breweries. Tourists who are nightlife or alcohol lovers are recommended to choose this group.
Label 3 has park as the most common venue, and it also has bookstores and theaters. Tourists can enjoy the culture of New York City in this group. Additionally, tourists can also grab some snacks from gourmet, ice cream and cheese shops.
Label 4 provides a lot of Caribbean and Latin American restaurants, which makes this group a great place to experience the culture of Mid and South America.
Label 5 is near the zoo, which also provides many delis, Italian, Mexican and bakery for tourists visiting zoo.

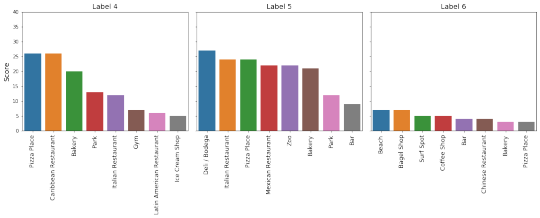
Label 6 is near the shoreline where beach and surf spots are the major venues.
Based on the most common and unique venues in each group, label 0 to 6 are renamed as below. The quantity of each labeled group was calculated and a unique color was assigned to each group to display on the map.

A map of New York City with venue labels of neighbourhoods is shown below. This map provides tourists to choose which group to stay depending on their interests in activities.
Residential groups (purple) are located at suburban areas without many scenic spots to visit.
Vacation groups (pink) are mainly at Staten Island and far away from downtown.
Bar Lovers groups (red) spread over outside the core area of New York City.
Park and Culture groups (yellow) are all located at or close to the midtown and downtown Manhattan, the heart of NYC.
Exotic groups (green) are in the southeast part, near the JFK airport.
Zoo groups are near the Bronx Zoo, which is one of the most famous zoos in the world.
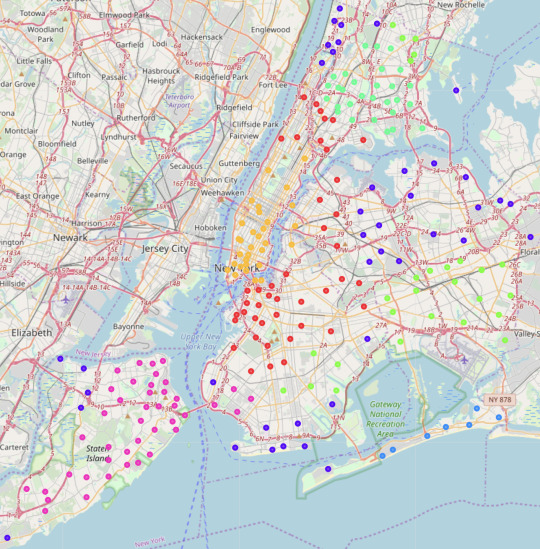
Beach groups are at the south shoreline of Jamaica Bay, which is also a famous recreation area.
5. Conclusions
Based on the results and recommendations provided by this project on the price, reviews, and number of Airbnb postings of New York City, tourists can do some research before planning their trips. Based on their budgets, tourists can choose which highly reviewed neighbourhood to stay. According to the results provided by the Foursquare data, tourists can pick which area they want to visit depending on their interests in activities.
This project provides excellent tools to help tourist enjoy their trips in New York City.
0 notes

