
Don't wanna be here? Send us removal request.
Statistics
We looked inside some of the posts by skillslash01 and here's what we found interesting.
Average Info
Notes Per Post
0
Likes Per Post
0
Reblog Per Post
0
Reply Per Post
0
Time Between Posts
1 day
Number of Posts By Type
Text
17
Last Seen Tumblr Blogs


Fun Fact
The total number of visits Tumblr.com received during January 2021 is 327 million.
Text
Top 5 Cloud Computing Books to Read For Beginners

The concept of "cloud computing" is rapidly expanding. The ability to access data from any location at any time is a huge time saver for enterprises. How organizations handle their information, programs, and services has been revolutionized by cloud computing.
It has also facilitated small enterprises' expansion and scalability to meet rising demand. This article is for you if you're interested in learning more about cloud computing and the many advantages it offers.
Cloud Computing For Dummies
If you are a total newbie to cloud computing and want to learn about it from the perspective of a beginner, this book is ideal for you. The chapters are thoughtfully structured to provide gradually increasing levels of difficulty, making it easier to absorb the various technical concepts presented.
Those who are just getting started with cloud computing will find this book to be an excellent resource. Everything you need to know to get started with cloud computing is in this straightforward and comprehensive book. New professionals and those curious about cloud computing will find this book to be an insightful resource.
Cloud Computing With Windows Server
The conveniences and advantages of cloud computing are extraordinary. On the other hand, there can be situations where you'd rather keep everything in-house, including the application and data. At this point, both Windows Server 2019 and Azure can prove useful. This book will explain why it's preferable to run your applications and data locally on Windows Server 2019, and how you may take advantage of this. Also covered in the book is the topic of employing a hybrid cloud to host your apps. With a hybrid cloud, you get the best of both worlds—public and private cloud services.
To those who prefer to keep their data and programs locally, this book is a must-have. In addition, it discusses Microsoft Azure, a cloud platform that supports the installation of Windows Server.
Microsoft Azure Fundamentals
This book introduces readers to Microsoft Azure and its core features. It teaches you the fundamentals of Azure so you can use it to realize your company's potential. Additionally, the book delves into Azure's price, deployment options, and service offerings. In addition, it discusses Azure's newest serverless features.
If you're just getting started with Azure, this book is everything you need. This guide has you covered with all you need to know about Microsoft Azure. In addition, it provides detailed descriptions of each service to aid in your decision-making.
Understanding Oracle Cloud Platform
Oracle's cloud infrastructure is the topic of this book. Readers interested in learning more about cloud computing will find this book invaluable. Oracle's cloud infrastructure is also included. There are many cloud systems available, but Oracle's is a major one. A million users or more use it monthly, and it's been utilized by over 10 million people. If you want to know why Oracle's cloud platform is so popular, this is the book to read.
Anyone interested in learning more about cloud computing and all it has to offer will find this book to be an excellent resource. The Oracle Cloud Infrastructure is also covered. It's no secret that Oracle Cloud is a frontrunner among cloud services. Over 10 million users have registered for the service, and over a million more sign up every month.
Google’s Approach to Cloud Computing
Google's philosophy on cloud computing is the subject of this book. If you're interested in learning how Google runs its operations on the cloud, this is the book for you. Also discussed are the most recent enhancements to Google Cloud. Cloud services provided by Google are among the most widely used. If you want to know how Google views the cloud, this is the book to read.
If you're interested in learning about Google's philosophy toward cloud computing, this book is for you. Also discussed are the most recent enhancements to Google Cloud. To that end, Google Cloud Platform is a highly sought-after cloud service.
Final Words
Cloud computing has various benefits. You need to be familiar with the advantages and technologies of cloud computing, as it is the future of computing. Reading these books is a great first step if you're new to the world of cloud computing and want to learn more about it. The information in these publications will make it possible for you to grasp the principles of cloud computing with relative ease.
However, if you feel that books and online resources aren't enough, and you need the support of a professional institute to help you get proper certifications, earn real-work experience while working with top AI firms, and get the opportunity to receive lucrative opportunities, Skillslash is the answer. Skillslash provides an exhaustive Data Science Course In Bangalore and Data Structures and Algorithms Courseto help you transition into the IT domain swiftly and you'll also learn about all the core concepts including cloud computing.Get in touch with the student support team to know more.
0 notes
Text
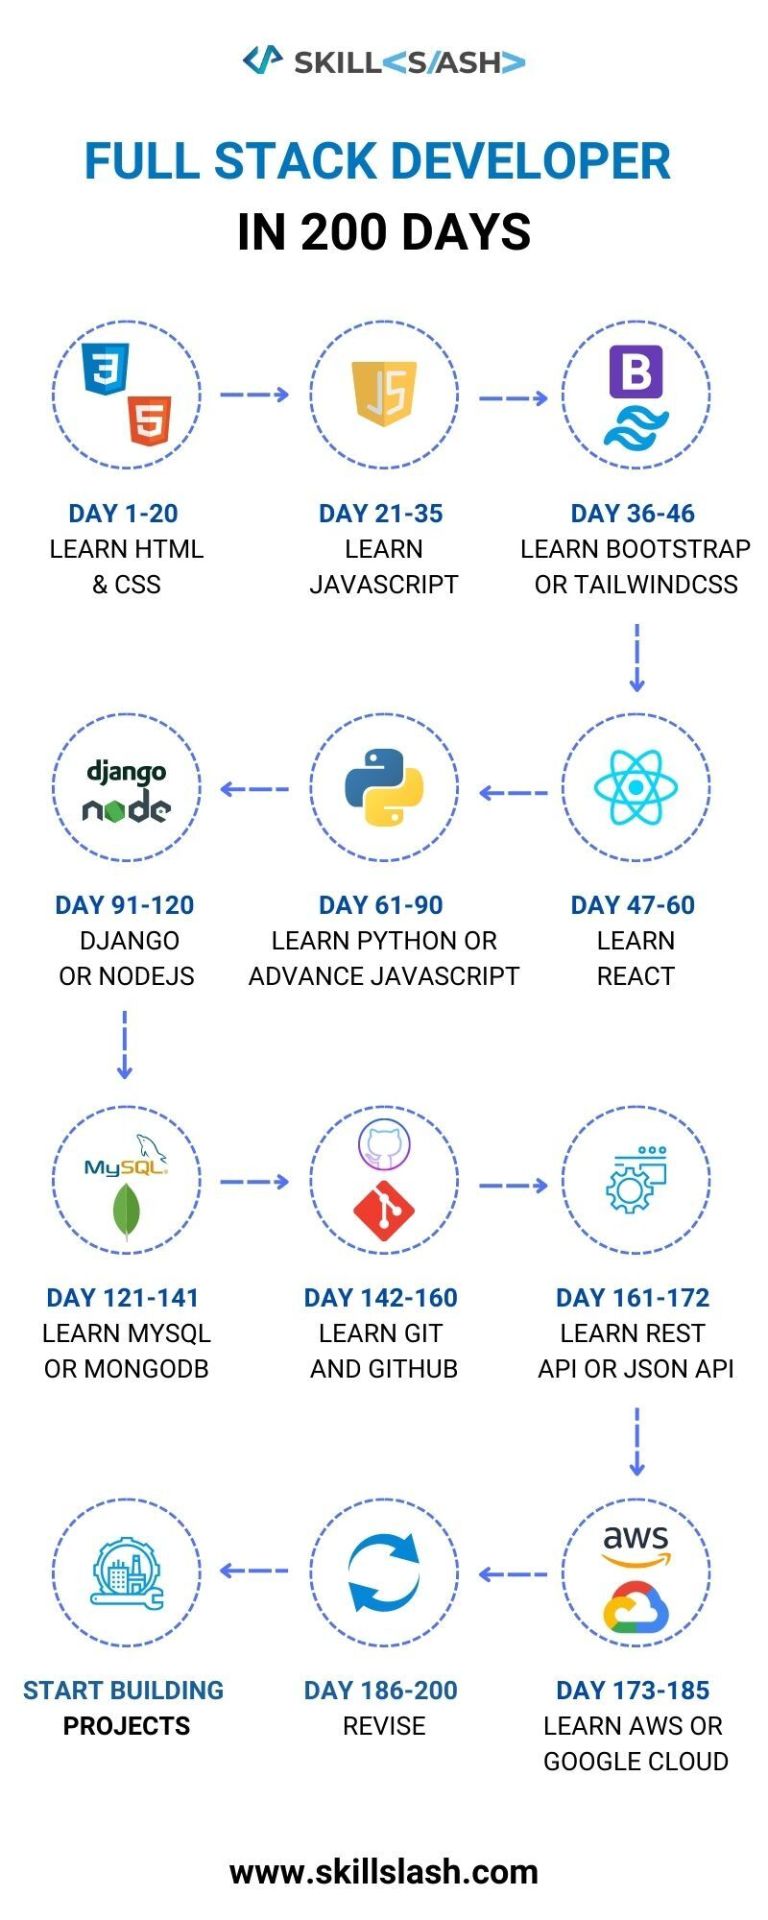
FULL STACK DEVELOPER IN 200 DAYS
0 notes
Text
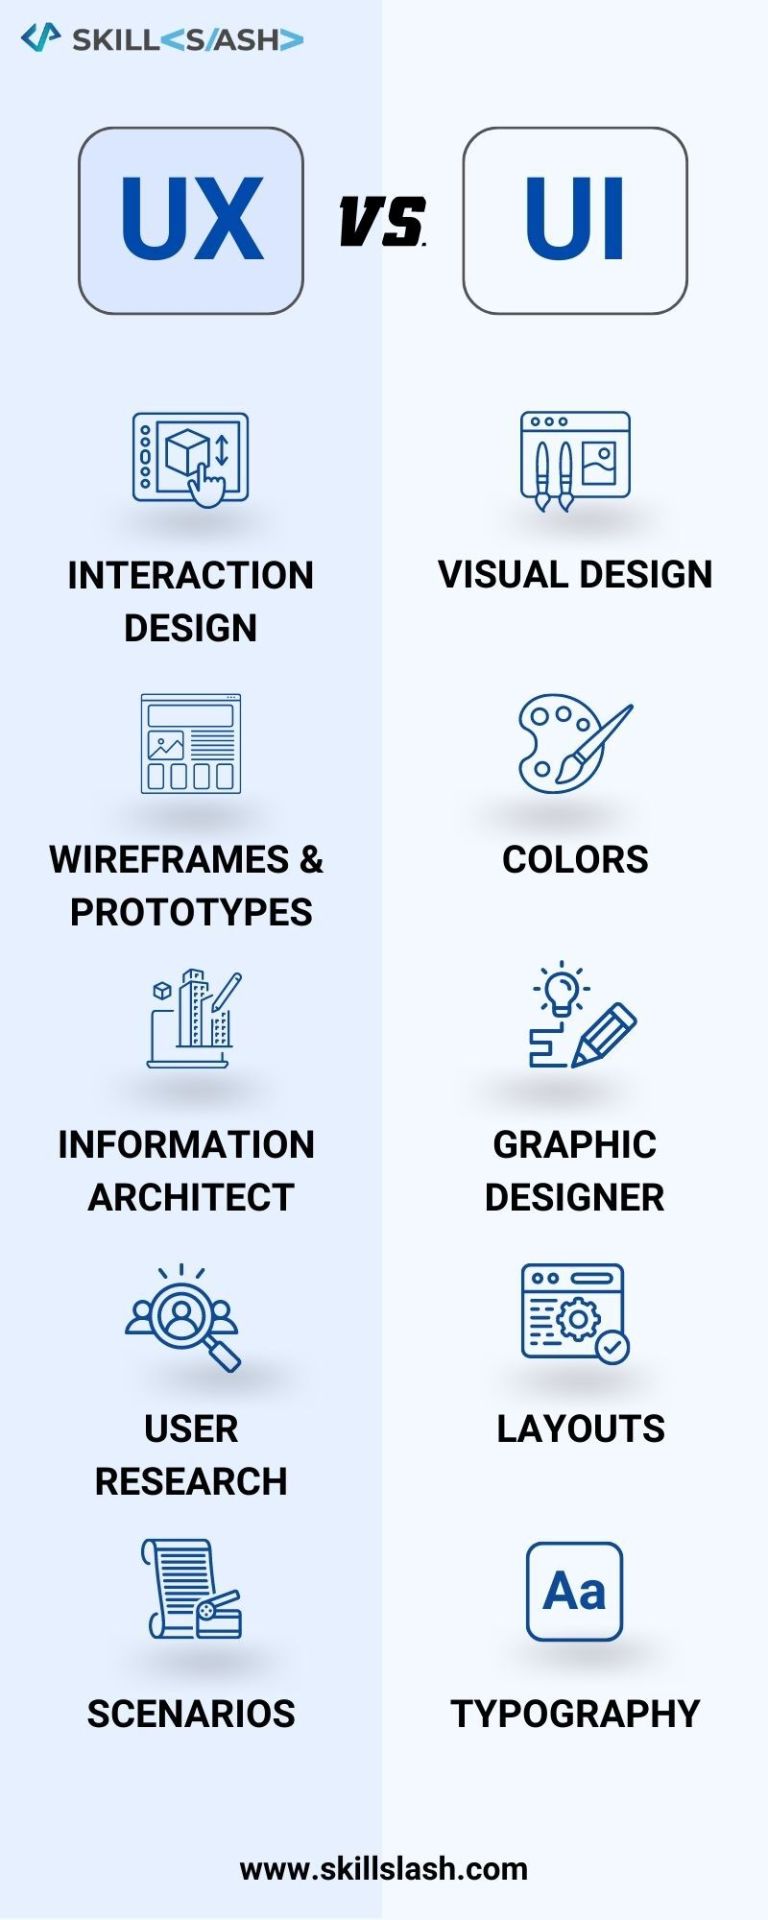
UX AND UI
0 notes
Text
WHO ARE YOU

0 notes
Text
What is Data architecture? Components, Frameworks, Characteristics & Salary
A company's data architecture describes the procedures it follows to gather, store, and manage information. It explains how data assets and management resources are structured and organized. In this case, individuals who require the data will benefit from a well-organized set of records. It includes everything needed to keep data in an organization in working order, including rules, policies, models, and standards.
The data architecture's primary function is to translate business requirements into information and technological specifications, making it the backbone of any company plan. It controls how information is handled and moved around a company.
Through this article, where we already had a short introduction to data architecture, we will now understand the components, characteristics, and frameworks of data architecture and also the salary of professionals in this domain.
Data Architecture Components
Modern data architecture consists of many parts, including:
Data Pipelines: It is an umbrella term for the activities involved in gathering data, cleaning it up, storing it, analyzing it, and transporting it. Data pipelines describe the complete process, beginning with where information is gathered and ending with how it is moved.
Cloud storage: When people talk about "the cloud," they're referring to a remote data storage facility that can only be accessed via the internet.
API’s: Through the application programming interface, a host and a requester can exchange data. The IP address is the connecting factor for the conversation. The API is capable of relaying a wide variety of data to the end user.
AI & ML models: AI/ML facilitates an automated data architecture. Data collecting, labeling, etc., can be combined with computational reasoning to yield informed choices and predictions.
Data streaming: The term "data streaming" describes the transfer of data in an uninterrupted stream from one location to another, where it must be processed for real-time analysis.
Kubernetes: It is the system for managing the loads on data center servers, networks, and storage devices.
Cloud computing: The term "cloud computing" is used to describe the method through which data is examined, stored, and managed in a remote server. The cloud handles all of the underlying hardware and software, so there's no need for you to worry about the ins and outs of your IT setup.
Real-time analytics: In real-time analytics, data is analyzed as it is being collected to get insight. Organizations can make choices based on the results of this analysis.
Frameworks
A company can choose from several preexisting frameworks to best suit its data architecture.
DAMA-DMBOK 2
The Data Management Body of Knowledge is a set of standards developed by DAMA International for use in the field of data management. The framework defines many terminologies in accordance with the standard definitions and serves as a guiding principle for data administration.
Zachman Framework for Enterprise Architecture
The Zachman Framework was developed by IBM's John Zachman in the '80s. The "data" column contains several hierarchical levels. Business-critical architectural standards, a logical data model for the enterprise, a semantic model, the databases themselves, and a physical data model are all part of these layers.
The Open Group Architecture Framework (TOGAF)
The enterprise software development community leverages the framework to create its products. During Phase C of TOGAF, the data architecture and the route plan are developed.
Data Structure Characteristics
The following are some distinguishing features of today's data architecture:
User-driven
Users can get the information they need thanks to the data architecture. A lack of dynamic data and the inability to obtain it left decision-makers in the dark in the past. In the current environment, however, decision-makers can define their requirements and access them to accomplish business objectives, all thanks to the availability of a modern data structure.
Designed around shared data
In today's architecture, data from several departments must be combined to create a unified whole. Information is consolidated into a single repository.
Automated
Delivering and updating data used to be a time-consuming process. It took months to complete the processes. These tasks can now be accomplished in a matter of hours thanks to the use of automated technology. Moreover, automated pipelines allow the user to gain access to numerous forms of data.
AI-driven
Machine learning (ML) and AI are used to fully automate the data structure (AI). Automated quality control procedures, as well as the categorization and sorting of incoming data into useful structures, are both possible thanks to the use of AI and ML. The automated system will use this information to suggest relevant data sets and analytics.
Elastic
According to the data architecture, the company can expand or contract as necessary. Administrators can find solutions to issues thanks to the adaptability of data architecture.
Simple
An effective data structure will have a straightforward layout that makes data transfer, data storage, data integration, and data analysis straightforward.
Secure
Modern data architecture provides safety because it can spot new security risks and only shares information with those who have a legitimate business need to see it, according to strict policies.
Best Practices
When planning a data architecture approach, the following best practices should be encouraged.
The process is driven by collaboration
Throughout an organization, the collaboration between the business and the IT department is crucial to the success of any given choice. Therefore, a well-designed data architecture promotes the achievement of cross-departmental objectives. Leaders in an organization are the ones who will decide what information is most useful for moving the needle. The data architect then uses this to lay out a plan for making the data available and tracking down its origins.
Prioritize data governance
It's important to have reliable information to make sound choices. Similarly, highly relevant data is used in data mining architecture. In addition, the information should be tailored to the company's requirements. Thus, the responsibility of the data stewards is to ensure that the organization's data is accurate and up-to-date. In this situation, inside specialists can take on the role of data stewards to improve the accuracy of the data being collected.
Attain agility
The data architecture needs to be flexible enough to include emerging technologies, which are essential in today's environment. As a result, the data architecture shouldn't revolve around a single piece of software or hardware. The data architecture needs to be flexible enough to adapt to new data kinds, as well as new tools and platforms, as they become available.
Data Architect Roles and Salary in India
In India, a data architect can expect to earn a median annual salary of ₹ 21,84,031. Below are some of the most common titles held by a data architect, as well as their corresponding average yearly salary.
Database Architect: ₹ 23,16,877
Senior Data Architect: ₹ 27,93,432
Data Modeler: ₹ 12,51,051
Data Warehouse Architect: ₹ 13,32,771
Final Words
We reach the final parts of the article, having successfully discussed data architecture, its components, best practices, characteristics, and the roles and salaries of data architecture professionals. If you aim to elevate in the tech domain, data science can help you start your journey. And, speaking of data science, Skillslash can help you build something big here. With Best Data Structure and Algorithm Course, andData Science Course In Bangalorewith placement guarantee, . Skillslash can help you get into it with itsFull Stack Developer Course In Bangalore. you can easily transition into a successful data scientist. Get in touch with the support team to know more.
0 notes
Text
What is Doughnut Chart? : A Brief Guide to Understand
It's as crucial to understand the data as it is to perform the analysis itself in the field of data analytics. As an analyst, you have the responsibility of convincing your superiors and the general public that the data points in a particular direction, even if various people may interpret the data in different ways once it has been analyzed.
When trying to explain data, it's never a good idea to just show a bunch of spreadsheets or paragraphs of text. If you want to do a better job of explaining your data, you need some kind of visual aid. This demonstrates why it's crucial to use visuals while interpreting data.
In this article, we will learn about the doughnut chart and try to have a complete understanding of it. Let's start with a short introduction.
Doughnut Chart
As a method for data visualization, the doughnut chart is currently the most popular option. Your data are depicted as a component of the whole in a doughnut chart. The main shape is circular, with a sizable depression smack in the middle. In most cases, the doughnut chart is used to segment a particular field according to the proportion of coverage it received. It is also possible to use it for numbers rather than percentages; however, the viewer will need to be made aware of the total of all the portions of the doughnut chart.
Advantages of a Doughnut Chart
The ease with which one can both construct and interpret a doughnut chart is perhaps the greatest benefit of using one.
One of the most fundamental ways that data can be represented is through the use of a doughnut chart. There are not many tools that are superior to a doughnut chart in situations when you need to explain the predominance of a particular field in your analysis or the share of competitors in a market.For example, In most cases, the data analysis software that you use will also provide you the option to rearrange the values of the metrics displayed in the doughnut chart in order to better illustrate your argument.
In addition, a doughnut chart gives you several possibilities to connect the design of your chart with the design of the rest of your presentation. Doughnut charts are commonly used in marketing and sales presentations. You can make it in a variety of colors, or you can make it in a variety of shades of the same color.
You are very likely to come across doughnut charts, which are among the styles of graphical representation that are the easiest on the eyes of the reader. When displayed on a page alongside text, they do not take up a significant amount of additional space. They are also the form of pictorial representation that require the least amount of explanation. They do not require any additional explanation text to be written. At other times, the percentage share of the predominant measure is all that is required to adequately explain them.
Disadvantages of a Doughnut Chart
Recent years have seen a proliferation of representational formats that use a three-dimensional (3D) image to convey information.
When performing an analysis of a doughnut chart in three dimensions, one encounters a number of challenges, though.
In addition, the chart is a wonderful tool to utilize if the number of metrics utilized in your area of expertise is quite small, possibly numbering in the single digits. However, your doughnut chart becomes more difficult to interpret as the number of sectors increases.
Additionally, there is not much room for an explanation, should one be necessary, and additional methods of data analysis must be utilized to identify outliers.
Doughnut Chart and Pie Chart: The Difference
The huge hole in the middle of a doughnut chart is the most noticeable distinction between it and a pie chart. If you want to draw attention to a specific piece of information—say, the total of all the doughnut chart's sectors—you may do so by placing that piece of information in this hole. Doughnut charts can thus display slightly more information than pie charts. The two concentric doughnuts can represent two separate data series, making the doughnut chart a very versatile data visualization tool. In the case of a pie chart, this cannot be done.
Conclusion
An alternative way of looking at a doughnut chart is to think of it as a more advanced variant of a pie chart. When presenting market share, product categories, product sub-categories, etc., this kind of chart can be really helpful. This article briefly discusses the doughnut chart, its advantages and disadvantages, and the difference between a doughnut chart and a pie chart.
Donut charts and other data science concepts may pique your curiosity. Skillslash can help you build something big here. With Best Data Structure and Algorithm Course With System Design, andData Science Course In Bangalorewith placement guarantee, . Skillslash can help you get into it with itsFull Stack Developer Course In Bangalore. you can easily transition into a successful data scientist. Get in touch with the support team to know more.
0 notes
Text
Searching in Data Structure: Different Search Methods Explained
As anyone who’s ever worked with data knows, searching is one of the most important operations you can perform. Given a set of data, you need to be able to find the specific items you’re looking for quickly and efficiently. The process of searching through data is known as algorithmics or algorithmic analysis. There are a variety of different search methods available, each with its own advantages and disadvantages. In this blog post, we’ll explore some of the most popular search methods used today and explain when you should use each one.
Linear Search
There are many different search methods that can be used when searching through data. Linear search is one of the most basic and simplest search methods. It involves looking through a dataset for a specific value by sequentially checking each element in the dataset until the desired value is found or all elements have been checked with no match being found. Linear search is best suited for small datasets as it is not very efficient for large datasets. To perform a linear search, you simply start at the first element in the dataset and compare it to the value you are searching for. If it is not a match, you move on to the next element and continue checking until you either find a match or reach the end of the dataset without finding a match.
Binary Search
Binary search is a fast and efficient search method that can be used on sorted data structures. It works by repeatedly dividing the search space in half until the target value is found or the search space is exhausted.
To perform a binary search, the data structure must first be sorted in ascending or descending order. Then, the algorithm begins by comparing the target value to the middle element of the search space. If the target value is equal to the middle element, then the search is successful and the index of the middle element is returned.
If the target value is less than the middle element, then the algorithm searches the lower half of the search space. If the target value is greater than the middle element, then the algorithm searches the upper half of the search space. This process is repeated until either the target value is found or there are no more elements to search.
Hash Table
A hash table is a data structure that stores items in an array. Each item in the array has a key that is used to find its location in the array. Hash tables are used to store data in a way that makes it easy to find and retrieve items.
Hash tables are used to store data in a way that makes it easy to find and retrieve items. Hash tables are used to store data in a way that makes it easy to find and retrieve items.
Trie
A trie is a type of search tree—an ordered tree data structure used to store a dynamic set or associative array where the keys are usually strings. Unlike a binary search tree, no node in the tree stores the key associated with that node; instead, its position in the tree defines the key with which it is associated. All the descendants of a node have a common prefix of the string associated with that node, and the root is associated with an empty string. Values are not necessarily associated with every node. Rather, values tend to be associated with leaves, and with some inner nodes that correspond to keys of interest.
Conclusion
There are many different search methods that can be used when searching through data structures. The most common method is the linear search, but there are also other methods such as the binary search and the hash table search. Each method has its own advantages and disadvantages, so it is important to choose the right one for the task at hand. In general, linear search is the simplest and easiest to implement, but it is also the least efficient. The binary search is more efficient but requires that the data structure be sorted before it can be used. The hash table search is even more efficient but can be more difficult to implement.
For a better understanding and learning journey, it’s best that you join the exclusive Data Structures and Algorithms course by Skillslash where you master the theoretical concepts, work with top AI startups to implement those learnings and receive unlimited job referrals. Skillslash also offers Data Science Course In Bangalorewith placement guarantee, .Skillslash can help you get into it with itsFull Stack Developer Course In Bangalore. Get in touch with the support team to know more.
0 notes
Text
Priority Queue in Data Structure: Characteristics, Types & Implementation
Priority Queue is a data structure that holds objects in a specific order. This order is decided by the priority of the object. The priority of an object can be anything like, highest to lowest value, earliest deadline first or any other user-defined criteria. A priority queue is different from a regular queue where all objects have the same order. In a priority queue, each object has some priority associated with it and the order in which objects are stored depends on their priorities. priority queues are used in a lot of applications like CPU scheduling, Disk Scheduling, Operating Systems, etc. They are also used in graph algorithms like Dijkstra’s algorithm, Prim’s algorithm, etc.
What is a Priority Queue?
A priority queue is a data structure that allows you to store and retrieve data items in order of priority. Priority queues are often used in applications where data items must be processed in order of importance, such as in a hospital emergency room or an air traffic control system.
Priority queues can be implemented using a variety of different data structures, such as arrays, linked lists, or heaps. The most commonly used implementation is the binary heap, which offers both efficient insertion and deletion of data items.
When inserting a new data item into a priority queue, the item is given a priority value. The higher the priority value, the more important the item is. When deleting an item from the queue, the item with the highest priority value is always deleted first.
Priority queues have a number of applications in computer science and engineering. They are often used in scheduling algorithms, such as CPU scheduling and disk scheduling. Priority queues are also used in many graph algorithms, such as Dijkstra's algorithm and Prim's algorithm.
Characteristics of a Priority Queue
A priority queue is a data structure that allows you to store data according to a priority. The most common way to implement a priority queue is with a heap. A heap is a tree-based data structure where the root node is the element with the highest priority. The elements of the tree are organized so that the element with the next highest priority is always stored in the left child node, and the element with the next lowest priority is always stored in the right child node.
When you insert an element into a priority queue, it is added to the end of the tree. The tree is then rearranged so that the element with the highest priority is always at the root. This rearrangement is called "heapifying" the tree.
The main advantage of using a priority queue is that it allows you to efficiently find and remove the element with the highest priority. This operation, known as "extracting the maximum," can be performed in O(log n) time, where n is the number of elements in the queue.
There are two main types of priority queues: min-priority queues and max-priority queues. In a min-priority queue, elements are added to the queue according to their minimum value. That is, elements with smaller values have higher priorities than elements with larger values. In a max-priority queue, elements are added to the queue according to their maximum value. That is, elements with larger values have higher priorities than elements
Types of Priority Queues
There are two types of priority queues: min-priority queues and max-priority queues.
In a min-priority queue, the element with the smallest key is always at the front of the queue. In a max-priority queue, the element with the largest key is always at the front of the queue.
Priority queues can be implemented using an array or a linked list.
When using an array, we need to keep track of both the size of the array and the current number of elements in it. This is because, unlike a linked list, an array does not have dynamic sizing. As such, when we enqueue an element onto a full array, we need to resize it first.
To implement a priority queue using a linked list, we need to create a node class that has two fields: a key field and a data field. The key field will hold the priority value of the node and the data field will hold the actual data element.
We also need to create a head pointer that points to the first node in the list and a tail pointer that points to the last node in the list.
To enqueue an element into our priority queue, we first need to compare its key with that of the head node. If it is smaller (in the case of a min-priority queue) or larger (in the case of a max-priority queue), then we can simply insert it before head and update head pointer
Implementing a Priority Queue
A priority queue is a data structure that allows you to store and retrieve elements in order of importance. Priority queues are often used in applications such as scheduling, where the most important tasks are given the highest priority.
There are two main types of priority queues: min-priority queues and max-priority queues. Min-priority queues give the smallest element the highest priority, while max-priority queues give the largest element the highest priority.
Priority queues can be implemented using an array or a linked list. The array implementation is more efficient, but the linked list implementation is easier to understand.
To implement a priority queue using an array, you will need to keep track of two things: the size of the array and the current position of the elements. The size of the array will determine how many elements can be stored in the queue. The current position will keep track of where each element is located in the array.
To insert an element into a priority queue, you first need to find its correct position in the array. To do this, you compare the element to all of the other elements in the array until you find its correct position. Once you have found its correct position, you insert it into that position and shift all of the other elements down one spot in the array.
To remove an element from a priority queue, you simply remove it from its current position in the array and shift all of the other elements up one spot in the array.
Applications of Priority Queues
There are a number of applications for priority queues in data structure and computer science. One example is in scheduling algorithms, where tasks are assigned priorities and processed according to those priorities. Another example is in graph theory, where priority queues can be used to implement shortest path algorithms.
Priority queues can also be used to implement other data structures, such as heaps. Heaps are a type of data structure that can be used to store data in a way that allows for quick retrieval of the maximum (or minimum) element. Priority queues can also be used to efficiently process large amounts of data by storing the data in an order that allows for quick access to the most important elements.
Conclusion
In this article, we have looked at the priority queue data structure: what it is, its characteristics, types and how to implement it. Priority queues are a very important data structure with a wide range of applications. I hope that this article has given you a good understanding of them so that you can start using them in your own programs. If you wish to know more about these concepts and feel to study them better, you can go with Skillslash’sData Structures and Algorithms courseand learn in-depth about the topic and become a successful professional in this field.Skillslash also offers Data Science Course In Bangalorewith placement guarantee, .Skillslash can help you get into it with itsFull Stack Developer Course In Bangalore. Get in touch with the support team to know more.
0 notes
Text
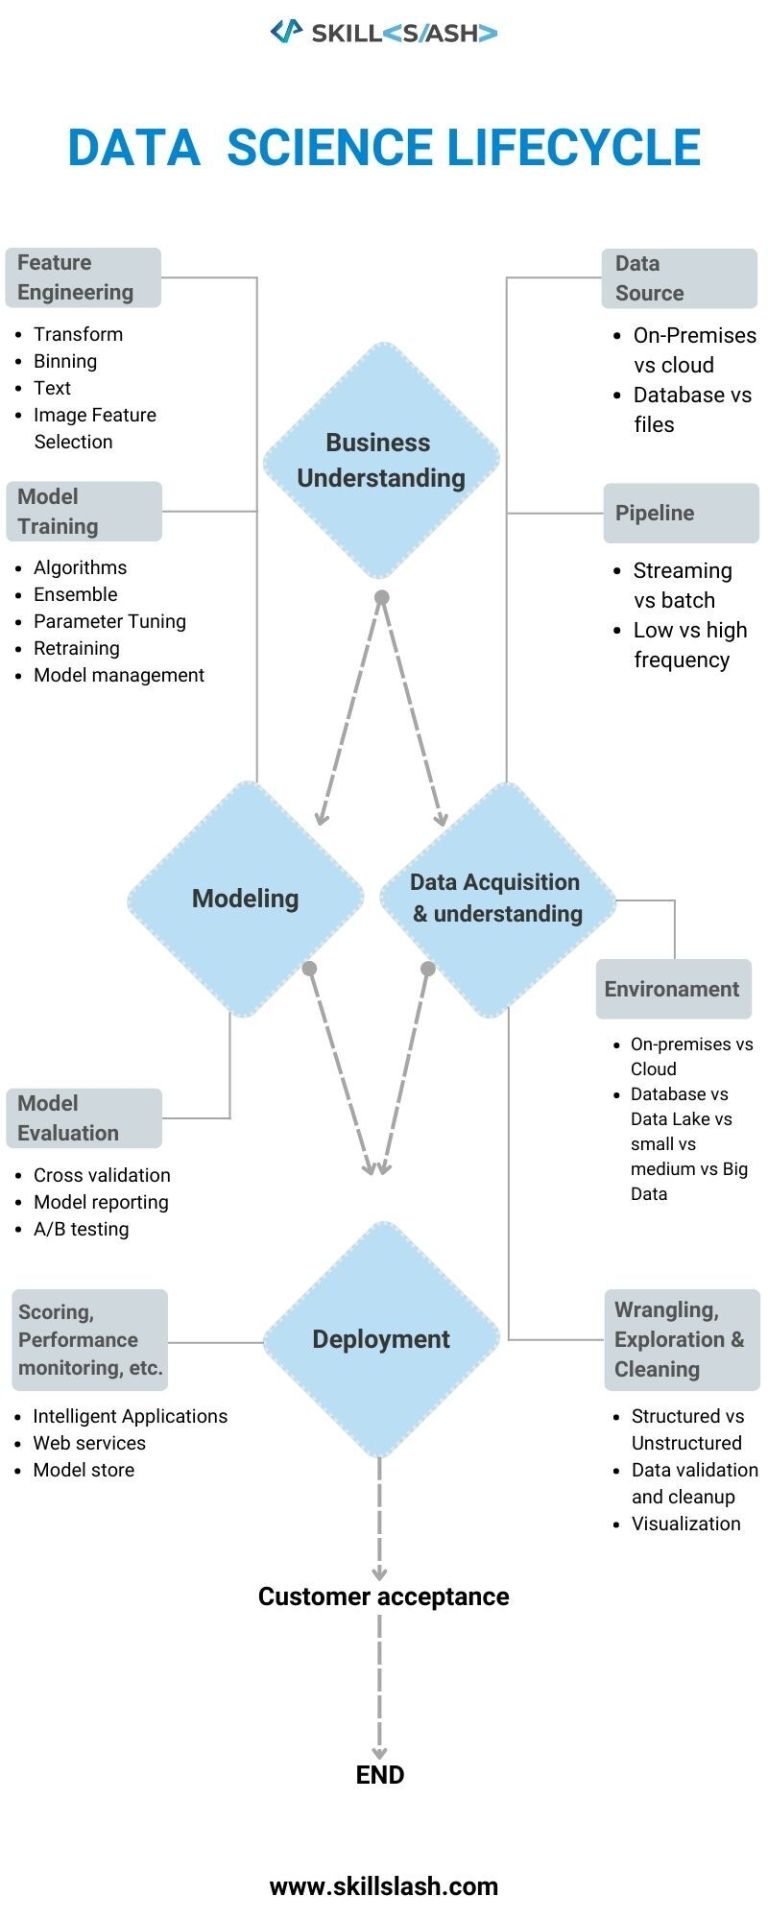
DATA SCIENCE LIFECYCLE
0 notes
Text
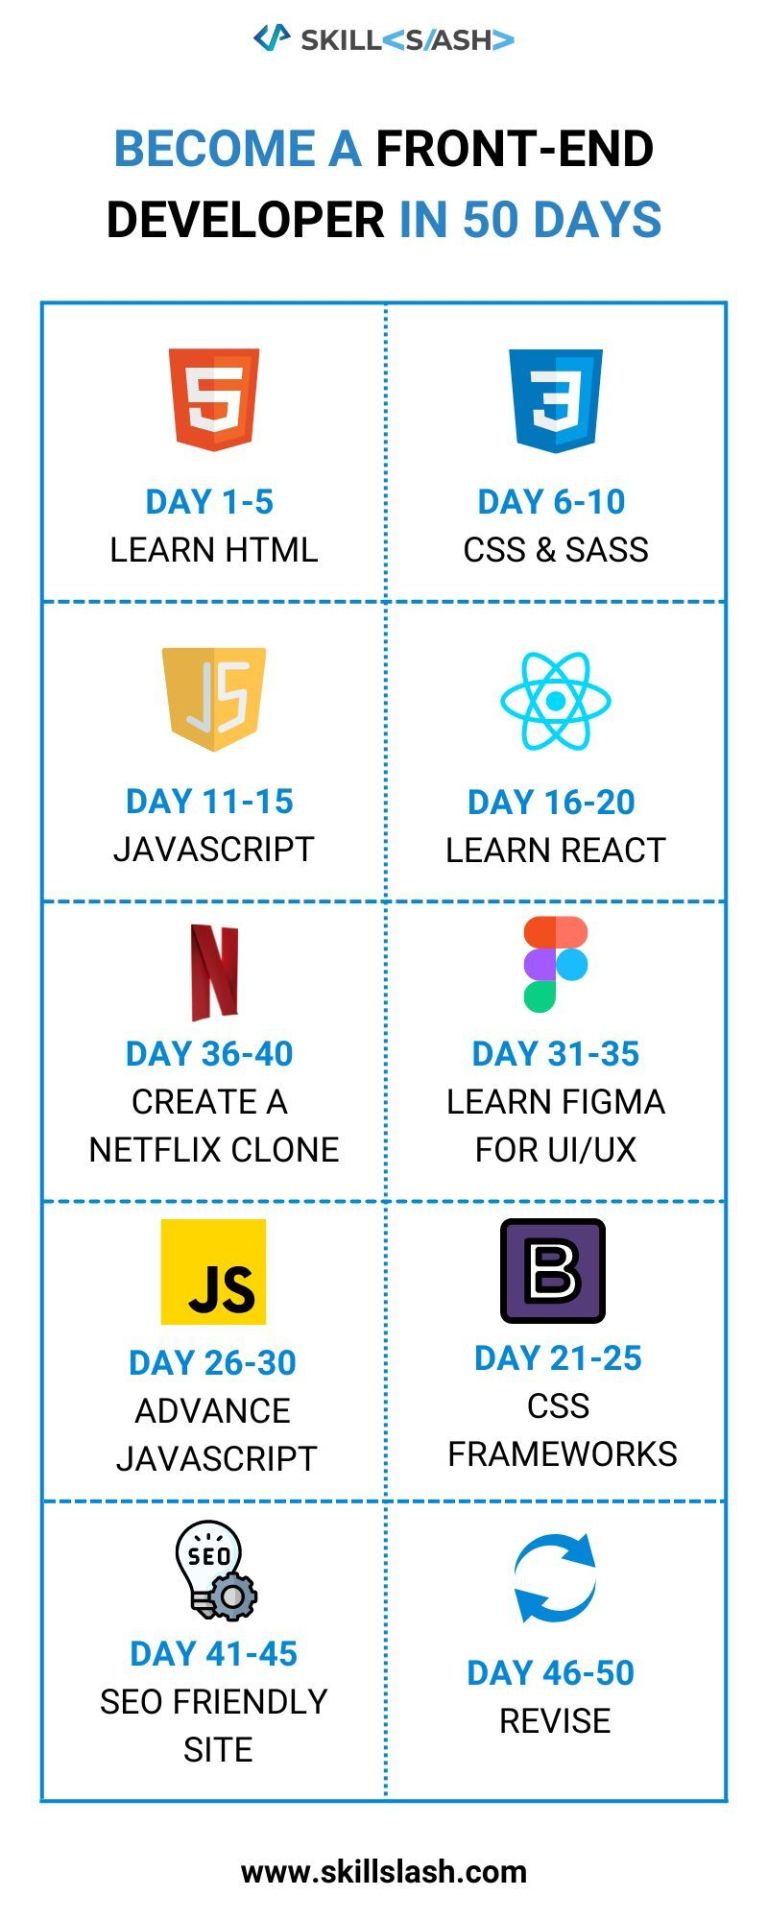
BECOME A FRONT-END DEVELOPER IN 50 DAYS
0 notes
Text
What is Cross-Validation and Validation in Machine Learning?
In machine learning, cross-validation and validation are two important methods for assessing the performance of a model. Cross-validation is a technique for estimating how well a model will generalize to new data. Validation is a technique for assessing the accuracy of a model on a dataset. In this blog post, we will explore the differences between cross-validation and validation. We will also discuss when to use each method and how to implement them in machine learning.
Cross-Validation
Cross-validation is a technique for assessing the accuracy of a machine learning model. It involves partitioning the data into two or more sets, training the model on one set and then testing it on another. This process is repeated until all sets have been used as both training and test sets. The final accuracy score is then calculated by averaging the scores from all the iterations. There are several benefits to using cross-validation over traditional hold-out validation. First, it reduces the chance of overfitting, as the model is trained and tested on different data each time. Second, it gives a more accurate estimate of model performance, as all of the data is used in both training and testing. Finally, it is more efficient than hold-out validation, as there is no need to reserve a portion of the data for testing. Cross-validation can be used with any machine learning algorithm, but it is most commonly used with decision trees and neural networks.
Validation
Validation is the process of assessing whether a machine learning model is accurate. This can be done using a variety of methods, but the most common is cross-validation. Cross-validation involves partitioning the data into a training set and a test set, training the model on the training set, and then assessing its accuracy on the test set. There are a few things to keep in mind when doing validation: 1. The goal is to assess how well the model will generalize to new data, not just how well it fits the training data. This means that it is important to use a test set that is representative of the data that the model will ultimately be used on. 2. It is also important to use a sufficiently large test set. If the test set is too small, there may not be enough data to accurately assess the model's performance. 3. When partitioning the data into training and test sets, it is important to do so randomly. This ensures that both sets are representative of the overall data distribution and helps prevent overfitting (when a model performs well on the training set but poorly on new data). 4. Finally, it is important to remember that no single measure of accuracy is perfect. It is always best to report multiple measures (e.g., precision and recall) when possible.
Pros and Cons of Cross-Validation and Validation
There are several advantages and disadvantages to using cross-validation and validation when training a machine learning model. Some of the pros of using these methods include: -Allows for better assessment of model performance -Reduces overfitting -Provides more reliable estimates of model generalization error However, there are also some cons to using cross-validation and validation, including: -Can be time consuming -May not work well with small datasets -Can be difficult to tune hyperparameters
How to Choose the Right Method for Your Data
There are multiple ways to validate your data when using machine learning, and it can be difficult to know which method to choose. The most important thing is to understand the trade-offs between different methods in order to make an informed decision. One of the most popular methods for validation is cross-validation, which can be used for both classification and regression problems. Cross-validation works by splitting the data into a training set and a test set, then training the model on the training set and evaluating it on the test set. This process is repeated multiple times, with different splits of the data, in order to get an accurate estimate of how the model will perform on new data. Another common method is holdout validation, which is similar to cross-validation but only splits the data once. Holdout validation can be useful when you have a large dataset and want to maximize the amount of data that is used for training. However, it is also more susceptible to overfitting if not done correctly. Ultimately, there is no single best method for validation; it depends on the specific problem you are trying to solve. Try out different methods and see what works best for your problem.
Conclusion
In machine learning, cross-validation and validation are important concepts that help you to assess the performance of your models. Cross-validation is a technique that allows you to train and test your model on different subsets of data, which can help you to avoid overfitting. Validation is a technique that allows you to evaluate your model on unseen data, which can give you an idea of how well your model will perform on new data. Both cross-validation and validation are essential tools for assessing the accuracy of your machine learning models.Skillslash can help you build something big here. With Best Data Structure and Algorithm Course With System Design, andData Science Course In Bangalorewith placement guarantee, . Skillslash can help you get into it with itsFull Stack Developer Course In Bangalore. you can easily transition into a successful data scientist. Get in touch with the support team to know more.
0 notes
Text
What is a Confusion Matrix in Machine Learning?
In machine learning, a confusion matrix is a table that is often used to evaluate the performance of a classification model (or “classifier”) on a set of test data. For each instance in the test set, the classifier predicts a class label and the confusion matrix shows the number of times each predicted label was correct or incorrect. In this blog post, we will take a look at what a confusion matrix is and how it can be used to evaluate the performance of your machine learning models. We will also see how to interpret the results of a confusion matrix and what some common pitfalls are that you should avoid.
What is a Confusion Matrix?
A confusion matrix is a table that is used to evaluate the performance of a machine learning model. The table shows the predicted values for each class and the actual values for each class. The diagonal elements of the table represent the number of correct predictions, while the off-diagonal elements represent the number of incorrect predictions. There are several measures that can be computed from a confusion matrix, including accuracy, precision, recall, and F1 score. Accuracy is the proportion of correct predictions made by the model. Precision is the proportion of positive predictions that are actually positive. Recall is the proportion of actual positives that were correctly predicted by the model. The F1 score is a measure of how well the model predicts positive examples and is computed as the harmonic mean of precision and recall.
How is a Confusion Matrix Used in Machine Learning?
A confusion matrix is a table that is used to evaluate the performance of a machine learning model. The table is made up of four cells, each of which represents the number of predictions made by the model in each category. The first cell represents the number of true positives, which are predictions that were correctly classified as positive. The second cell represents the number of false positives, which are predictions that were incorrectly classified as positive. The third cell represents the number of true negatives, which are predictions that were correctly classified as negative. The fourth cell represents the number of false negatives, which are predictions that were incorrectly classified as negative. The rows in the table represent the actual values, while the columns represent the predicted values. So, a row with two entries would represent an actual value of positive and a predicted value of either positive or negative. A column with two entries would represent a predicted value of either positive or negative and an actual value of either positive or negative. The accuracy is calculated by taking the sum of the true positives and true negatives and dividing by the total number ofpredictions made. This gives us a ratio of correct predictions to total predictions. The precision is calculated by taking the sum of the true positives and dividing by the sum of all predicted positives (true positives + false positives). This gives us a ratioof correct positive predictions to all positive predictions. The recall is calculated by taking the sumof true positivesanddividingbythesumofactualpositives(
What are the Benefits of Using a Confusion Matrix?
A confusion matrix is a table that is used to evaluate the accuracy of a classification model. The table is made up of four columns: true positives, false positives, true negatives, and false negatives. Each row represents the actual class while each column represents the predicted class. The benefits of using a confusion matrix are: -It allows you to see how your classification model is performing on different classes. -It can help you to improve your classification model by identifying areas where it is doing well and areas where it needs improvement. -It is a simple and easy way to evaluate your classification model.
How to interpret a Confusion Matrix
In order to interpret a confusion matrix, it is important to understand what each of the four quadrants represent. The first quadrant represents true positives, which are correctly predicted positives. The second quadrant represents false negatives, which are incorrectly predicted negatives. The third quadrant represents false positives, which are incorrectly predicted positives. The fourth quadrant represents true negatives, which are correctly predicted negatives. To calculate the accuracy of the predictions, we need to take the sum of the true positives and true negatives and divide by the total number of samples. This gives us the ratio of correct predictions out of all of the predictions made. $$ \text{Accuracy} = \frac{\text{True Positives} + \text{True Negatives}}{\text{Total Samples}} $$ The precision measures how many of the positive predictions were actually correct. This is calculated by taking the ratio of true positives to all positive predictions (true positive + false positive). A high precision means that there were few false positive predictions. $$ \text{Precision} = \frac{\text{True Positives}}{\text{True Positives} + \text{False Positives}} $$ The recall measures how many of the actualpositive samples were correctly predicted as positive. This is calculated by taking the ratio of true positives to all actual positive samples (true positive + false negative). A high recall means that there were few false negative predictions
Alternatives to the Confusion Matrix
A confusion matrix is a table that is used to evaluate the accuracy of a classification model. The table shows the predicted class for each observation in the test set and the actual class for each observation. There are other ways to evaluate the accuracy of a classification model. One way is to use a receiver operating characteristic curve (ROC curve). This curve plots the true positive rate (TPR) against the false positive rate (FPR) for different values of the threshold. The area under the ROC curve (AUC) is a measure of how well the model can distinguish between classes. Another way to evaluate a classification model is to use precision and recall. Precision is the number of true positives divided by the total number of predictions, and recall is the number of true positives divided by the total number of actual positives.

Conclusion
A confusion matrix is a powerful tool for measuring the accuracy of a machine learning model. By visualizing the results of a model's predictions, a confusion matrix can help you quickly identify areas where the model is performing well and areas where it could use improvement.Skillslash can help you build something big here. With Best Dsa Course, andData Science Course In Bangalorewith placement guarantee, . Skillslash can help you get into it with itsFull Stack Developer Course In Bangalore. you can easily transition into a successful data scientist. Get in touch with the support team to know more.
#data science course in mumbai#skillslash#education#developers & startups#student#datasciencecourseinmumbai
0 notes
Text
Top 5 Data Collection Methods & Process
The value of data has been demonstrated throughout all contemporary endeavors, from academia to commerce. In order to fully understand the processes that the data is collected for, sufficient data must first be collected.
However, there are particular channels via which data is gathered. The article will center on the numerous techniques that can be employed to gather data. In addition, the top five approaches that can be used for data collection will be outlined.
Various Data Collection Methods
Primary data collection and secondary data collection are the two broad categories into which many data-gathering techniques can be placed. Primarily, we can categorize the ways in which we gather information into two broad categories: qualitative and quantitative.
Qualitative data collection methods
The emphasis in this form of data gathering is on the quality of the data collected rather than on the quantity. Researchers often rely on their gut feelings or other unstructured sources of information while collecting this type of data.
While researchers or users can always adjust their approach, gathering qualitative data takes a significant amount of effort. Research requires meticulous documentation in the form of notes, photographs, audio recordings, or any other medium deemed appropriate by the researcher.
Interviews, document reviews, online questionnaires, web surveys, discussions, and observations are all examples of common qualitative methods of data collection.
Quantitative data collection method
Quantitative research relies more heavily on quantity than quality, as suggested by the name of the methodology. Data derivation typically entails some sort of mathematical calculation. Interviews (in-person, over the phone, and via computer-assisted personal interviewing [CAPI]) and questionnaires (in both electronic and paper-and-pencil formats) are all part of the quantitative approach to data collecting.
5 Methods of Data Collection
There are several reported approaches to data collection. Some of the most common methods of data collection in the present day are as follows:
Surveys
Among the many methods of gathering information, customer surveys present an opportunity to directly query clients for their thoughts and opinions. Surveys are a useful tool for gathering both qualitative and quantitative information. Typically, they take the form of a list of questions or concerns about a given service or item. Typically presented as multiple-choice inquiries, or occasionally requiring an explanation in a few words, these inquiries require responses from the customers. Study questionnaires can be administered over the internet, paper, and pencil, or over the phone. However, surveying in an online format is the most convenient. The poll can be created and the link shared via email, social media, or any number of other channels.
Keeping an eye on the social media landscape
Many people these days utilize social media to document their daily activities online. This is one of the advantages of modern technology, especially given the internet's central role in disseminating knowledge. Social media is also useful for another purpose: gathering feedback from customers. Researchers can learn about customer preferences by perusing the lists of people who are already using or interested in a particular product or brand. It's important to know who you're selling to before you can create a successful product. People who are passionate about a certain brand are more likely to mention it in their profiles. By frequently looking for brand names, you can learn what kinds of consumers are buying your products. There are also several resources available to help make the most of analytics from outside sources.
Online monitoring
Owning an app or website can provide a wealth of information on customers for a company or organization. The acquisition of client information will be greatly aided by the technological tools available today. Customers contribute data points even if they just visit a single page. Data analysis reveals useful information about the website's popularity and the number of people who have visited it. In addition to this, data about which tabs visitors opened and for how long they stayed on the site is also recorded. Collecting this data and analyzing it with the right analytics program is possible.
Marketing Analytics
Businesses rely on marketing campaigns to spread the word about all of the products they've created. Despite marketing efforts, it has been noted that a great deal of data may be gathered from any website, email, or another online medium. With the right ad placement software, you can track which consumers or viewers clicked on your marketing ads. Information about the customer's viewing time and device is also sent.
Registration and subscription data
When a customer joins an organization's email list, the company learns certain details about that person. The next step is to collect data from clients, which will be utilized to send them the information they care about.
Final Words
With this, we reach the concluding part of the article. To summarize our discussion, we learned in-depth about the data collection types and the 5 ways to easily collect data. If you have a knack for data and numbers, then a future in data science will be the ideal path for you.
Skillslash can help you build something big here. With Best Dsa Course, andData Science Course In Bangalorewith placement guarantee, . Skillslash can help you get into it with itsFull Stack Developer Course In Bangalore. you can easily transition into a successful data scientist. Get in touch with the support team to know more.
0 notes
Text
Sorting in Data Structure: Categories & Types [With Examples]
Introduction to Sorting
Sorting is one of the most fundamental operations in computer science. It is the process of arranging a given set of data in a certain order, typically either in increasing or decreasing order. Sorting is an important part of many algorithms and data structures, and has a wide variety of applications.
There are many different ways to sort data, and the choice of sorting algorithm can have a significant impact on the efficiency of a program. In this article, we will take a look at some of the different categories of sorting algorithms, as well as some specific examples.
One common way to classify sorting algorithms is by their efficiency. In general, we can divide sorting algorithms into two broad categories:
• Linear time sorting algorithms: These are algorithms that take O(n) time to sort n elements. Examples include insertion sort and selection sort.
• Quadratic time sorting algorithms: These are algorithms that take O(n2) time to sort n elements. Examples include bubble sort and merge sort.
Different Types of Sorting Algorithms
There are a few different types of sorting algorithms, and each has its own benefits and drawbacks. Some of the most common sorting algorithms are:
-Selection sort: Selection sort is a simple algorithm that sorts an array by repeatedly finding the minimum element (or maximum element) and swapping it with the first element of the unsorted part of the array. This algorithm is not very efficient, but it is easy to understand and implement.
-Insertion sort: Insertion sort is a slightly more efficient algorithm than selection sort. It sorts an array by repeatedly inserting elements into the sorted part of the array, in order, until all elements are in their correct positions.
-Bubble sort: Bubble sort is another simple algorithm that sorts an array by repeatedly swapping adjacent elements if they are in the wrong order. This algorithm is not very efficient, but it is easy to understand and implement.
-Merge sort: Merge sort is a divide-and-conquer algorithm that sorts an array by recursively breaking it down into smaller arrays and then sorting those arrays independently before merging them back together into one sorted array. This algorithm is more efficient than selection or insertion sort, but it requires extra space for the smaller arrays.
-Quick sort: Quick sort is a divide-and-conquer algorithm like merge sort, but it uses a different strategy for choosing which element to use as the pivot point (the point around which the array will be divided
How to Choose the Right Sorting Algorithm?
There are a few key considerations when choosing the right sorting algorithm for your data set:
-The size of the data set: For small data sets, any sorting algorithm will likely suffice. But for large data sets, you'll want to choose an algorithm that is both fast and efficient in terms of memory usage.
-The type of data: Some sorting algorithms work better with certain types of data than others. For example, quicksort is typically faster than mergesort for numeric data, but not necessarily for strings.
-The structure of the data: If the data is already partially sorted, some algorithms will perform better than others. For example, insertion sort is typically faster than quicksort for nearly sorted data.
-Your specific needs: There may be other factors to consider, such as whether you need a stable sort (one that preserves the order of equal elements) or whether you can afford to modify the input array.
Examples of Sorting Algorithms
There are a variety of sorting algorithms, each with its own advantages and disadvantages. Some sorting algorithms are more efficient than others, while some are more difficult to implement.
Here are a few examples of sorting algorithms:
-Bubble Sort: Bubble sort is one of the simplest sorting algorithms. It works by comparing adjacent pairs of elements and swapping them if they are in the wrong order. This process is repeated until all of the elements are sorted. Bubble sort is not very efficient, but it is easy to implement.
-Selection Sort: Selection sort is another simple sorting algorithm. It works by finding the smallest element in the array and swapping it with the first element. Then, it finds the second smallest element and swaps it with the second element. This process is repeated until all of the elements are sorted. Selection sort is not as efficient as some other algorithms, but it is easy to understand and implement.
-Insertion Sort: Insertion sort is a bit more efficient than selection sort. It works by dividing the array into two parts: a sorted part and an unsorted part. The algorithm then takes each element from the unsorted part and inserts it into its correct position in the sorted part. This process continues until all of the elements are sorted. Insertion sort is relatively easy to understand and implement.
-Merge Sort: Merge sort is a divide-and-conquer algorithm that is fairly efficient. It works by dividing the
Conclusion
Sorting is an important topic in data structures, because it provides a way to organize data so that it can be searched efficiently. There are many different sorting algorithms, each with its own strengths and weaknesses. In this article, we looked at two broad categories of sorting algorithms: those that sort by comparison and those that sort by distribution. We also looked at four specific sorting algorithms: selection sort, insertion sort, merge sort, and quick sort. Each of these algorithms has its own advantages and disadvantages, so it's important to choose the right algorithm for the task at hand.
If you wish to learn more about data structures and algorithms and feel you want to take it up in your career path, Skillslash can help you build something big here. With Best Dsa Course, and with itsData Science Course In Bangalorewith placement guarantee, . Skillslash can help you get into it with itsFull Stack Developer Course In Bangalore. you can easily transition into a successful data scientist. Get in touch with the support team to know more.
0 notes
Text
7 Data Mining Functionalities Every Data Scientists Should Know About
Information can be mined using a technical process called "data mining," which deals with very large data sets. Data mining seeks to establish norms or rules that may be applied to new or existing data sets in order to provide explanations for observed phenomena.
Data mining is a technique for extracting useful information from large amounts of unstructured data through the application of mathematical analysis, which was previously impossible with traditional methods of data exploration.
When dealing with massive amounts of data, data mining is a helpful and incredibly convenient technique. Through this article, we will aim at discussing the 7 important data mining functionalities data scientists should definitely know about. Let’s begin without any ado.
Class/Concept Description: Characterization and Discrimination
The data is organized into categories or concepts so that it can be connected with outcomes. Examples can be used to describe data classes and concepts, which is helpful when explaining how to do data mining. As an illustration of data mining capabilities in a class/concept description, consider the new iPhone model, which comes in Pro, Pro max, and Plus tiers to cater to specific client needs.
Characterization of Data
Data characterization is the process of identifying and summarizing the essential characteristics of a dataset. Specifically, it generates rules that reflect the preferences of the intended audience—in this case, iPhone purchasers. Simple SQL queries can be used to gather the data, and OLAP operations can be used to aggregate the information.
One such method used to generalize or characterize the data with little input from the user is the attribute-oriented induction methodology. The aggregated information is displayed in several visually appealing formats, including tables, pie charts, line charts, bar graphs, and graphs. A rule known as the characteristics rule of the target class displays the multidimensional relationship between the data.
Segregation of data
One of data mining's many uses is data classification. It's a study that looks at the differences in information between the two groups. The target class is typically matched up with a set of categories that have already been established. It uses a set of criteria called discriminant rules to compare and contrast the class's attributes with those of the preset class. Data discrimination techniques are quite similar to data characterization techniques.
Classification
The ability to classify information is a crucial data mining feature. To foresee patterns in data, it employs data models. Using our spending habits, online banking and smartphone apps may provide useful visualizations, such as pie charts and bar graphs. This is one way to characterize the danger we face when trying to secure a new loan.
Predictions and analyses are made using tools like IF-THEN logic, decision trees, mathematical formulas, and neural networks. It generates new instances based on training data to evaluate against the current ones.
IF-THEN: When describing an IF-THEN rule, the IF clause is called the rule antecedent or precondition. The rule consequent refers to the "then" part of the IF-THEN rule. An antecedent condition may have one or more attribute tests that are ANDed together for truthfulness. Together, the antecedent and the consequent are utilized to determine if a decision is true or untrue.
Decision Tree: Decision Tree Mining is a technique for constructing classification models from data. It builds tree-like representations of data for use in classification. It's used while building data models to draw conclusions about groups of things or sets of numbers.
Neural Networks: Neural networks are a common method for effective data mining because of their ability to efficiently transform unstructured data into actionable insights. In this way, businesses can sift through reams of data in search of previously undiscovered tidbits about their clientele.
Prediction
The data's missing digits can be uncovered by the data mining prediction algorithm. The missing information is uncovered by regression analysis. Classification is used for prediction if the class label is unavailable. The relevance of prediction to corporate intelligence has contributed to its widespread acceptance.
Data can be predicted in two ways:
Data that is not currently available or is missing can be predicted using a technique called prediction analysis.
Using a previously constructed class model, a prediction of the class label is made.
It's a method of foresight that lets us look far into the future for potential payoffs. To foresee future tendencies, we require a massive data set containing historical values.
Association Analysis
Data mining includes the capability of conducting an Association Analysis. It establishes a connection between two or more data points. Through this process, the connection between the data and the rules that govern them is uncovered. It's most useful in the business of selling things directly to consumers. An actual application of association analysis is Amazon's "Customers who bought this also bought.." recommendation.
It groups together characteristics that are exchanged together frequently. It is commonly used in market basket analysis to discover what is known as association rules. Two different things can link the characteristics. Both confidence and support provide information about the frequency with which particular associations have occurred in the past.
So, for instance, if mobile phones were sold with headphones, confidence would be at 40% and support would be at 2%. In other words, headphones were included in the purchase of only 2% of mobile phones. The rate at which a certain link is repeated corresponds to a level of confidence of 40%.
Cluster Analysis
Cluster analysis refers to a method of unsupervised categorization. It's very much like data mining's categorization feature, which also involves categorizing and grouping information. In contrast to classification, the label for the cluster in question is not known in cluster analysis. Clustering methods are used to categorize data.
Clusters of items that share similar characteristics. When comparing the two clusters, you'll notice a dramatic difference. When sorting data into groups, it's important to prioritize similarity within each class and penalize overlap between classes. Machine learning, image processing, pattern identification, and bioinformatics are just a few of the numerous areas where clustering has been found useful.
Below are a few of the clustering algorithms and a little bit about each one:
K-means clustering algorithm: Data is clustered using the k-means technique so that cluster members share similar traits while those in other clusters share more dissimilar ones. The greater the distance between the two locations, the greater the degree of similarity between them. The underlying principle of this method is that there should be a minimal deviation between individual data points inside a cluster.
Gaussian Mixture Model algorithm: K-means, an alternative to the Gaussian Mixture Model technique, has the drawback of requiring a circular presentation of the data. Due to the circular nature of the distance computations used by k-means, data that is not centered around the centroid does not get categorized most optimally. This issue can be fixed by using a Gaussian mixture model. Informational value can be achieved even if the data does not cluster around some central point. The Gaussian mixing algorithm uses a combination of parameter estimates from multiple Gaussian distributions to fit data of arbitrary shape and complexity.
Mean-shift Algorithm: The mean-shift algorithm is useful for many computer-vision applications, including the analysis of photographs. A seed cluster size is not required as it is calculated by the algorithm. Iteratively moving data points closer to the mode. The mode is the region where the majority of observations fall. This hierarchical method of clustering does not scale well, which is a major drawback when working with large data sets.
Outlier Analysis
Outlier analysis is performed on data that does not fit into any of the predefined categories. There will be data instances that don't fit well into any of the preexisting categories or broad models. We refer to these exceptional numbers as "outliers." Outlier mining is the process of identifying and understanding these anomalies, which are typically dismissed as random variations or exceptions. You may classify this as another data mining capability.
While these anomalies are typically ignored as noise, they may represent useful correlations in some scenarios. In spotting these outliers, as they are sometimes known, you will have made a big discovery. Statistical tests that determine probability are used to detect outliers.
Other names for outliers are:
Deviants
Abnormalities
Discordant
Anomalies
Evolution & Deviation Analysis
As a byproduct of data mining's other capabilities, evolution analysis, we obtain data clustering that is time-related. There are patterns and shifts in behavior that can be seen across time. This type of analysis is useful for detecting patterns in time-series data, identifying periodicities, and identifying recurring tendencies.
Conclusion
In a broader sense, fields as diverse as space exploration and retail marketing can all benefit from data mining and related features. As a result of data mining's functions, data can be interpreted in a wide variety of ways; for example, by using the information in datasets to construct and design new models with a wide range of real-world applications.
If you feel working around data is your go-to thing, a career in data science will be ideal for you. Skillslash can help you build something big here. With Best Dsa Course, andData Science Course In Bangalorewith placement guarantee, . Skillslash can help you get into it with itsFull Stack Developer Course In Bangalore. you can easily transition into a successful data scientist. Get in touch with the support team to know more.
0 notes
Text
Data Cleaning Techniques: Learn Simple & Effective Ways To Clean Data
In this article, we will learn about the different data cleaning techniques and how to effectively clean data using them. Each technique is important and you also learn something new.
Top Data Cleaning Techniques to Learn
Let's understand, in the following paragraphs, the different data cleaning techniques.
Remove Duplicates
The likelihood of having duplicate entries increases when data is collected from many sources or scraped. People making mistakes when keying in the information or filling out forms is one possible source of these duplications.
All duplicates will inevitably distort your data and make your analysis more difficult. When trying to visualize the data, they can also be distracting, so they should be removed as soon as possible.
Remove Irrelevant Data
If you're trying to analyze something, irrelevant info will slow you down and make things more complicated. Before starting to clean the data, it is important to determine what is important and what is not. When doing an age demographic study, for instance, it is not necessary to incorporate clients' email addresses.
There are various other elements that you would want to remove since they add nothing to your data. They include URLs, tracking codes, HTML tags, personal identifiable data, and excessive blank space between text.
Standardize Capitalization
It is important to maintain uniformity in the text across your data. It's possible that many incorrect classifications would be made if capitalization were inconsistent. Since capitalization might alter the meaning, it could also be problematic when translating before processing.
Text cleaning is an additional step in preparing data for processing by a computer model; this step is much simplified if all of the text is written in lowercase.
Convert Data Types
If you're cleaning up your data, converting numbers is probably the most common task. It's common for numbers to be incorrectly interpreted as text, although computers require numeric data to be represented as such.
If they are shown in a readable form, your analytical algorithms will be unable to apply mathematical operations because strings are not considered numbers. Dates that are saved in a textual format follow the same rules. All of them need to be converted into numbers. For instance, if you have the date January 1, 2022, written down, you should update it to 01/01/2022.
Clear Formatting
Data that is overly structured will be inaccessible to machine learning algorithms. If you are compiling information from several resources, you may encounter a wide variety of file types. Inconsistencies and errors in your data are possible results.
Any pre-existing formatting should be removed before you begin working on your documents. This is typically a straightforward operation; programs like Excel and Google Sheets include a handy standardization feature.
Fix Errors
You'll want to eliminate all mistakes from your data with extreme caution. Simple errors can cause you to lose out on important insights hidden in your data. Performing a simple spell check can help avoid some of these instances.
Data like email addresses might be rendered useless if they contain typos or unnecessary punctuation. It may also cause you to send email newsletters to those who have not requested them. Inconsistencies in formatting are another common source of error.
A column containing just US dollar amounts, for instance, would require a conversion of all other currency types into US dollars to maintain a uniform standard currency. This also holds for any other unit of measurement, be it grams, ounces, or anything else.
Language Translation
You'll want everything to be written in the same language so that your data is consistent. Also, most data analysis software is limited in its ability to process many languages because of the monolingual nature of the Natural Language Processing (NLP) models upon which it is based. In that case, you'll have to do a complete translation into a single language.
Handle Missing Values
There are two possible approaches to dealing with missing values. You can either input the missing data or eliminate the observations that contain this missing value. Your decision should be guided by your analysis objectives and your intended use of the data.
The data may lose some valuable insights if you just eliminate the missing value. You probably have your reasons for wanting to retrieve this data in mind. It may be preferable to fill in the blanks by determining what should be entered into the relevant fields. If you don't recognize it, you can always substitute "missing." If it's a number, just type "0" into the blank. However, if too many values are missing to be useful, the entire section should be eliminated.

Conclusion
We reach the final parts of the article, having discussed 8 highly important data cleaning techniques professionals must know about. These techniques make your job easier to deal with data, removing unwanted ones. If you feel data and numbers are where you feel at ease, data science is the ideal career path for you.
Skillslash can help you build something big here. With Best Dsa Course, and with itsData Science Course In Bangalorewith placement guarantee, . Skillslash can help you get into it with itsFull Stack Developer Course In Bangalore. you can easily transition into a successful data scientist. Get in touch with the support team to know more.
0 notes
Text
What is Business Ethics and Why is it Important?

Business ethics is a system of moral principles that guide businesses and business decision-making. These principles can be adopted by individuals, groups, or organizations, and they provide guidance for behavior in the marketplace. The importance of business ethics has been discussed and debated for many years, but there is no denying that it is more important now than ever before. With the advent of the digital age, businesses have access to more information and consumers are more aware of the inner workings of businesses. In this blog post, we will explore what business ethics is and why it is important. We will also discuss some of the challenges businesses face when trying to adhere to ethical standards.
What is business ethics?
Business ethics is the study of proper business practices and standards. It covers a wide range of topics, from corporate governance and social responsibility to environmentalism and fair trade. Business ethics is important because it helps businesses avoid legal problems and negative publicity, while also promoting goodwill among employees, customers, and other stakeholders. There are many different ways to approach business ethics. Some companies have formal codes of conduct that their employees must follow. Others take a more casual approach, relying on employees to use their best judgment in ethical situations. Either way, it is important for businesses to make sure that their employees are aware of the ethical standards they are expected to uphold. Businesses can face ethical dilemmas when they are trying to decide what is in their best interest versus what is right or wrong. For example, a company might be tempted to cut corners on safety procedures in order to save money. However, this could lead to accidents or injuries that could have been avoided if proper safety protocols had been followed. It is important for businesses to consider the potential consequences of their actions before making decisions. If a company does something that hurts someone or damages the environment, it could face legal penalties. Even if a company does not break any laws, it could still lose customers or damage its reputation if its actions are seen as unethical. Some common business ethics issues include discrimination, bribery, insider trading, and fraud. Discrimination occurs when a business treats someone differently based on race, gender,
Why is business ethics important?
Business ethics is important because it is the foundation upon which businesses are built. Businesses that operate ethically are more likely to be successful and to earn the trust of their customers, employees, and shareholders. Ethical businesses are transparent in their dealings, honest in their communications, and fair in their treatment of all stakeholders. They act with integrity and respect, and they adhere to a set of values that guides their decision-making. Building an ethical business requires making a commitment to doing things the right way, even when it’s not easy or convenient. It’s about more than following the letter of the law – it’s about acting with integrity, compassion, and respect.
How can business ethics be applied in the workplace?
The term “business ethics” can be used to refer to the ethical principles that guide the conduct of an individual or a business. These principles can be applied in the workplace to help create and maintain a culture of ethical behavior. Some ways that business ethics can be applied in the workplace include: Developing and communicating a code of ethical conduct: This can provide employees with guidance on how to behave in ethically questionable situations. It can also help managers set expectations for employee behavior and hold employees accountable to these standards. Fostering transparency and open communication: Creating an environment where employees feel comfortable asking questions and raising concerns can help identify potential ethical issues before they become problems. Encouraging ethical decision-making: Helping employees understand how to weigh different factors when making decisions can assist them in making choices that are aligned with the company’s values. Leading by example: As the leader of a company, your actions set the tone for the rest of the organization. Modeling ethical behavior yourself is one of the best ways to encourage others to do likewise.
Conclusion
Business ethics is the study of moral principles and values in the business world. It is important because it sets the standards for how businesses should operate. Businesses that adhere to ethical principles are more likely to be successful and have a positive impact on society. Those that don't can damage their reputation and cause harm to employees, customers, and other stakeholders.Skillslash can help you get into it with itsFull Stack Developer Course In Bangalore. It's also popularly known for providing the best Data Science Course In Bangalorewith placement guarantee. Skillslash also offers Data Structure and Algorithm with System Design Course. To know more, get in touch with the support team.
0 notes