
Welcome! Click the box with "arrows" in the left-hand corner to learn more about our page! Parents, use #forparents to do a quick search for guides and such for your children.Students use #forstudents to look for ideas, tips, and tricks! ** Posts with media are not ours unless otherwise noted **
Don't wanna be here? Send us removal request.
Statistics
We looked inside some of the posts by projectscifair-blog and here's what we found interesting.
Average Info
Notes Per Post
15K
Likes Per Post
8K
Reblog Per Post
7K
Reply Per Post
8
Time Between Posts
14 hours ago
Number of Posts By Type
Video
3
Link
2
Photo
8
Text
4
Last Seen Tumblr Blogs


Fun Fact
BuzzFeed published a report claiming that Tumblr was utilized as a distribution channel for Russian agents to influence American voting habits during the 2016 presidential election in Feb 2018.
Video
youtube
Hi scientists!
Have you ever wondered what happens in the brain that makes sugary foods so hard to resist?
Thanks to TED-Ed on YouTube, Nicole Avena gives you a lesson on how the brain is affected upon consumption of your favorite dessert. An overload of sugar can be bad for your body, so it is important to consume as such in moderation. This also goes to say that you need a healthy balanced diet if you want to not only gain the nutrients and vitamins your body can’t make but needs, but also to have a well-functioning and responsive brain!
Enjoy!
2 notes
·
View notes
Video
youtube
Hey science nerds!
Are you still confused about the difference between an independent and dependent variable?
Kyle Kobe, a biology teacher at Beverly Hills High School and content creator behind Beverly Biology on YouTube, has made a wonderful video explaining the differences between the two variables. This video is a definite must-see, especially because there is a comprehensive review at the end to check for your understanding.
Check out Beverly Biology for more science-related videos!
1 note
·
View note
Link
Hey scientists!
Have you ever wondered what makes a good hypothesis? Were you unsure if your hypothesis fit the “testable” criteria?
The amazing crew at Science Buddies have gone over just what a hypothesis is. They also have curated a list of examples of both good and bad hypotheses. This page is a definite must read for all your science fair project needs!
Click “Writing a Hypothesis for Your Science Fair Project” to access the material.
Good luck and cheers!
0 notes

Photo

“Psychiatrist Dr Karen Norberg, of National Bureau of Economic Research in Cambridge, Massachusetts, spent a year knitting an anatomically correct replica of the human brain” - Women’s Art on Twitter
2K notes
·
View notes
Text
The 3 Variables of an Experiment
In the following post, we will be reviewing the three different types of variables that are most often neglected in science fair projects. It is important to consider the three very different variables if you want to create a successful project. But before we delve into the specifics, let’s first define just what a variable is.
A variable is a condition, a quantity, etc. that can change in an experiment. For example, changing the amount of sunlight a plant receives as it is growing, or measuring plant growth as a result of changing the lighting conditions are examples of variables that can be or do change during the experiment. It is important to have them because a good experiment always establishes a cause-and-effect relationship between the variables. This is the basis for a well established science fair project. Students often miss points for forgetting a variable or two because of poor planning. Remember, you are trying to support your hypothesis with as much evidence as you can. Simply saying yes or no will not cut it. Having this cause-and-effect relationship displays that you understand how a variable changes if you control or manipulate a specific condition. Therefore, with this understanding, you will be able to make a conclusive statement that answers your hypothesis.
The three different types of variables that you MUST include in your science fair project is as follows:
(1) Independent (2) Dependent (3) Control
The Independent Variable
The independent variable is one that can be changed by the scientist. Often times, it is the one that is controlled as to observe the effect it has on the dependent variable.
For example, continuing on with the motif of plants, the independent variable in a study that dealt with the effects of sunlight on plant growth would be the amount of sunlight that is supplied to the plant. You can control just how much the plant is exposed to the sun. From there, you can then see the effect that the sun had on the plant growth.
The Dependent Variable
The dependent variable is one that cannot be changed. Rather, it is one that is often observed and therefore measured on the basis of the effect(s) that the independent variable had on it. This is usually the variable that you are interested in. It usually is the one that you want to study for any effects that may arise as a direct result of controlling the independent variable.
For example, for the case of the aforementioned study, the dependent variable would be the amount of plant growth that occurs as a result of controlling the amount of sunlight it received. Plant growth is directly affected by a variety of factors, such as the amount of water supplied, the amount of sunlight, the type of soil, etc. Here, we want to see the effects that these variables may have on the amount of plant growth, thus it is our dependent variable.
The Control Variable
The control variable serves a very special purpose in lab experiments. They are kept constant throughout the lab, where they used for comparison purposes during data analysis. The dependent variable is usually compared to the control as to characterize the extent of change that has occurred in the former as a direct result of the independent variable.
For example, how do we know that the amount of sunlight a plant receives plays an important role in the amount of growth that occurs? In order to describe these effects, we must have a control. Perhaps growing a plant in the maximum amount of exposure to the sun can be the control for the experiment above. In doing so, you are able to observe the direct effect of manipulating the amount of sunlight on plant growth to normal conditions.
It is highly important that you include a control because it is with the control variable that will allow you to make the necessary comparisons to either confirm or deny your hypothesis.
Always ensure that whenever you conduct an experiment, you have these three variables. Lack thereof would result in a failed experiment without concrete evidence for any changes that a particular variable has on another. It is with these measurable observations that will help you support your hypothesis and thus, answer the question at hand.
Good luck scientists!
0 notes
Text
Science Fair Project Judging Criteria Resources
Hey parents and scientists alike!
We have found two different, yet similar resources that go over the criteria that must be met during the science fair judging process. Please go over the two resources so that you do not lose easy points!
We have a thorough and detailed list of the top 10 commonly missed points during judging as well:
Top 10 Commonly Missed Points During Science Fair Judging
Without further ado, here are the resources:
(1) The Society for Science & the Public (Society)
Thanks to the nonprofit 501(c)(3) team, they have provided some grading criteria for projects entered into their very own Intel International Science and Engineering Fair (Intel ISEF).
This resource is a definite must read if you wanted an extra set of criteria to follow.
Judging Criteria for Intel ISEF
**DISCLAIMER: Please do not use this resource as a substitute to the grading criteria that your school has provided for you. Use this only as a reference, in the event that you want to ensure all your bases are covered.**
(2) Riverside County Office of Education
For those of you who are visiting our site from the Riverside Unified School District (RUSD) and/or the surrounding area, this resource may just be the perfect guide for you!
The following link will direct you to a PDF, based on the school academic year 2016-2017, that goes over safety regulations, a typical science fair project preparation timeline, and the grading criteria used by all judges during judging!
We HIGHLY recommend that you utilize this source as a supplement to what was given to you by your teacher. If you are going to compete at the county level, then this is a great resource to use to prep yourself for the next level.
Riverside County Science and Engineering Fair Regulations and Information Packet
We hope that you found these resources especially helpful like we did!
Good luck scientists!
0 notes
Text
Commonly Missed Points during Science Fair Judging
Hey scientists!
We all know how daunting the judging process can seem. But guess what? It doesn’t have to be that way! In this post, we’ll be going over the tope 10 commonly missed points that students often lose during the judging process.
Why settle for a 75% when you can get a 100%? C’mon what are you waiting for? Let’s get to the top 10!
(1) Data and Sample Size
Very often, many projects that are judged lose points when it comes to the data used to support interpretations and conclusions. In order to draw conclusions from data, a sufficient sample size must be used. Just because you obtained the results from one trial does not mean that the results would be applicable for all future trials. It is important to do multiple trials and average these results to obtain the best possible support for your interpretation and conclusions.
Example: Let’s say you are doing an experiment on how certain bugs react to light and you make a hypothesis as to which bug you think would move the furthest away when exposed to light. The different bugs you use happen to be flies, rollie pollies, spiders, and ants. You will want to use more than one of each type of bug, as well as test each of those individual bugs multiple times. Then, you can make put all this data into multiple tables and take averages to compare the overall distance moved. This will better support your interpretations and conclusions.
(2) Background Research
As a scientist, it is important to determine why your experiment is important and how it applies to the broad field of science itself. Thus, sufficient background research must be done to show what previous scientists have done in the field your experiment falls under and from there, you can explain the importance of your current study.
Example: If you are doing the classical experiment using Mentos and soda, you would want to do some research and reference books/websites on chemical reactions and the components in each item that causes the chemical reaction. What are some reasons the height may differ depending on the different kinds of soda you use?
(3) Applications of Your Experiment
Science doesn’t just stop with one experiment and the conclusions from that one experiment. In fact, science builds on itself and the work of others. This being said, it is important to consider once again the importance of your experiment and how your findings can be applied on a larger scale, like at your school as a whole, the local community, or even the world.
Example: Another common experiment utilizes fruits, vegetables, and a multimeter to determine the electrical content of these everyday food items that can likely be found in your home. How important is electricity in your daily life? Electricity is need to charge your cell phone/laptop, cook food, turn on your lights at home, etc. Consider that natural resources are not unlimited. What if there comes a time where electricity is no longer as abundant as it is now? How can your findings on which fruit or vegetable contains the most electricity help a world where electricity is slowly becoming unavailable?
(4) Future Experiments
On a similar note, it is important to determine what other experiments can be done to further your experiment and the results you obtained. Thinking of how your results can be applied on a larger scale, how can these thoughts be constructed into new experiments.
Example: After staining so many of your favorite shirts, you realize that you need to find the best possible laundry detergents to do the job and get your shirt back to normal. Proceeding through the scientific method and coming to a conclusion through your data, you determine that the best laundry detergent of the 4 you tested (Gain, Downy, Tide, and All) was Tide. But now what? Although this is important to all those parents who have children that like to play on the ground and play with food, what can you do besides let your friend’s parents know to buy Tide, even if it may be more expensive than the other brands? And how will you get other people outside of the local area to know? One possible way is, now that you’ve determined the best detergent, go back and determine if there are any differences in the composition of each detergent (i.e. does one have more of an ingredient than another). If there is, what is the significance of each component and does this explain why Tide has better cleaning power. Maybe eventually, you can create and design your own detergent to test!
(5) Data Collection
It is important to be able to communicate your data in the clearest way possible. This means taking advantage of data tables, graphs, charts, etc. When organizing the data into these various forms, be sure each item has a title, as well as other appropriate labels, which include axes for graphs.
Example: Do different kinds of water (i.e. distilled, tap, lake, sea) affect the height of a particular type of plant? Just as in number 1 above, it is important to do multiple trials for each kind of plant and organize this data into tables. Using this experiment as an example, multiple (let’s say 4 for our purposes) of the plant should be planted for each water condition (so, you’ll have a total of 16 plants). A table can be made for each water condition in which each row is a different plant and each column is a certain number of days after the initial seedling is planted (so, you’ll have a total of 4 tables). Averages (or the sum of all the results divided by the number of trials) of each column should be made for comparison. Then, these averages can be plotted into a graph to show the relationship between water and plant height from which conclusions can be drawn.
(6) Methods/Procedure
Another scientist should be able to reproduce your results. Thus, your methods and the procedure you follow should be clear and in a step-by-step format with no steps missing to ensure whoever sees your procedure can follow it and obtain, ideally, the same, or at least similar results.
Example: Maybe you’ve made slime before and are wondering what the best ratios of glue to water to borax are to make the best slime. Of course, you’ll want to define what “best” means, stickiest, most consistent, most flexible, etc. But, no matter what, the procedure will be the same and you’ll want to write it in a step-by-step format like so:
Make the borax solution.
Measure out and pour glue into styrofoam bowls.
Add food coloring (2-3 drops).
Add water into the bowl and stir.
Slowly add borax solution.
Knead into slime.
Once complete, place in plastic bags to take home.
Of course, you’ll want to be more detailed with some of the steps, but this should be the formatting of your procedure.
(7) Hypothesis
Your hypothesis should be clear, understandable, and testable using the scientific method. Judges should be able to understand exactly what you will be doing in your experiment, why you are doing it, and what you expect will be the results.
Example: All of us see advertisements on the daily, but seeing as almost everything claims to be the best, how can we determine what works best? Maybe you’re curious as to which toothpaste brand (Crest, Tom’s, Sensodyne, and Aquafresh) whitens the best. Why is this important? What do you expect the results to be (which brand)? Here’s a sample hypothesis for this experiment: Brushing your teeth is important for not only preventing cavities, but also keeping them nice a white, and based on the ingredients of 4 different toothpaste brands (Crest, Tom’s, Sensodyne, and Aquafresh), it is expected that Crest whitens teeth the best.
(8) Presentation (Poster)
The poster should be easy to follow and flow in the order of the scientific method. It is important that all pictures, tables, and data be labeled appropriately, be easy to read, and be visually appealing.
(9) Journal Entries
Make sure these entries are as detailed as possible. Scientists always keep a record like a lab notebook or something else to keep track of the day-to-day activities and happenings of their experiments. You should record anything significant to your experiment, including changes in color, height, texture, touch, or whatever else applies. Use your five senses! Rough sketches and data tables/graphs also help if applicable to your experiments. Remember this is a written record and does not need to be typed, but should be hand-written and show you were taking good notes during your experiment.
Example: What are the effects of different drinks on your teeth? If you decide to use eggs soaked in these different drinks, let’s say Coke, coffee, Lipton tea, hot chocolate, milk, and water, to determine the best and worst drinks for your teeth, you will want to record your findings after certain time periods and track down the color and texture changes in the egg shells, as well as any other changes you think are significant. If possible, include sketches or pictures of these changes and note the time that has passed since soaking the egg in a particular drink. These journal entries should read like a diary and, in a sense, allow the reader to “experience” you doing the experiment.
(10) Portfolio
If possible, all, if not most, of the things in here should be typed and organized (with the exception of the journal entries which are included here). Everything on the poster presentation should be included here, as well as any additional materials such as references and other project/experiment relevant information.
And there you have it! The Top 10 commonly missed points that students lose during the judging proces!
Although there are a lot of components to a science fair project, the most important thing is to have fun! Choose an experiment or a topic that you enjoy, want to know more about, or is just fun for you and the rest will fall in place. Hopefully these hints will be able to help you raise the level of your science project while still allowing you to pursue your passions and have fun! Remember to think like a scientist and think outside the box!
0 notes
Video
youtube
Hey fellow scientists!
+tunes2teach over at YouTube created a very educational (and fun!) rap video about the scientific method.
If you have time, check out the video! You can find their channel with the link below:
+tunes2teach on YouTube
A more detailed explanation of the scientific method can be found here:
The Scientific Method (detailed Version)
Have fun!
0 notes
Link
Hi fellow scientists!
Khan Academy is a great resource to reference when you not only need help with your classes (like math and history), but it is also can help you with the scientific method!
Please refer to the link above to get a shortened version of the scientific method. If you would like a more detailed explanation of what they go over, then please refer to the following link:
The Scientific Method (Detailed Version)
Click “Khan Academy” to access the material.
Good luck!
0 notes
Text
The Scientific Method
Want to start a science fair project, but don’t where to start? Lucky for you, this post is here to guide you in developing a successful project!
For starters, a good project always begins with this term known as the scientific method.
What is the scientific method you ask? Well, it is an organized method of steps that scientists refer to when they want to answer a question about the natural world around them. From Albert Einstein to your parents, almost everyone that has taken a science class has encountered the scientific method at one point. How do you think scientists were able to figure out how to make the best slime? This approach will help you answer the essential question of your interest via the development of a viable experiment and proper analysis of your data. So what are you waiting for? Let’s get to the good stuff!
Scenario: Let’s say its a typical Saturday morning. You’re on the couch watching the latest episode of Stranger Things on Netflix, and your mom comes into the living room asking for your help with the laundry. When you get to the laundry room, you notice that the usual laundry detergent that she uses, Gain, has been replaced by Tide. You ask her why she’s using a different brand, with which she responds, “It’s because this is cheaper.” Not thinking much of it, you help load the dirty laundry into the washing machine and go back to the living room to continue watching TV. After a few hours, she asks for your help again, but this time she needs help putting the clothes away. As you’re folding them, you notice that your favorite shirt that you stained last week with ketchup is immaculate and clean. You observe that a ketchup stain usually never came off a shirt when your mom used Gain rather than Tide. After making this connection, you then develop the question: “Which laundry detergent is the best at its job, that is, removing stains and cleaning dirty laundry?” You do research on brands that you could use to include in the study. You also design a proper experiment to test your hypothesis. Once the trials are over, you use the data that you have collected to perform a data analysis. After following the steps of the scientific method, as explained here on Project Science Fair, you find that Tide is in fact a better laundry detergent over other brands like Gain, Downy, and All. Who knew helping mom could be this fun and educational?
(1) Observe the natural world around you
The first step is basically the first and most important step in the scientific method. Not only does it set the overall tone of your project, but it also makes you focus on one thing, wherein you propose a question about a natural phenomena around you.
(2) Do your homework (aka do background research of your topic of interest) and ask a solid question
A good question is one that does not require a yes or no as an answer. Science requires ALOT of research, most of which is found through experiments that consider questions beginning with words like “which” or “what”. Of course, this depends on the question you come up with, but a good project will always require more than just a simple one-worded response. A good question also allows for further investigation of the problem at hand. It is important to choose a topic that you are interested in, but make sure that you can make clear observations like the ones made in the scenario above. This is key for obtaining good results to support for hypothesis (will be discussed later). Remember, both quantitative (e.g. numerical) and qualitative (e.g. color, shape) observations count! The more observations that you can make, the better! After asking a question, do some research about your topic of interest. Perhaps someone has already done prior research with a question similar to yours. If that is the case, see if you can replicate the experiment and obtain the same results that they did. Maybe change a variable (e.g. include more brands of detergents, conduct multiple trials, change the type of stain, etc.) to see if you could make new findings with which you could then maybe share this knowledge with others, like your mom or dad, all of whom may be interested in your topic of interest. This is also the time to find the background information necessary for your lab write-up (that is, if your teachers require one for you!) Overall, this is a great protocol to follow for now and future reference!
(3) Upon asking a question, propose a hypothesis
You may be wondering what a hypothesis is. It is essentially the answer to your question. It is a prediction of what you think will happen when you carry out the experiment. This step may seem like an easy feat. Although it is, it is important that you make a prediction that is testable. In doing so, you make the experiment possible to conduct. There must be a way to support your prediction. How can this occur? Through a TESTABLE hypothesis of course!
(4) Test your hypothesis and carry out the experiment (aka the fun stuff!)
Now comes the fun part. In this step you get to do the experiment! Just make sure that you have the proper materials well beforehand. Some experiments are time sensitive, so it is crucial that you leave more than enough time in-between conducting trials and analyzing the data so that you do not turn in a late project. Try to use materials that you already have at home, so that way you don’t have to go out and spend money on supplies. But that does not mean that you can’t go to your nearest Target to snag that last container of Elmer’s glue. If you have to do it, then by all means let your parents know and get the supplies that you need! As you carry out the experimental procedure, take good notes of any quantitative or qualitative changes that occur. In the case of the scenario above, you would record the effectiveness of the laundry detergent on removing stains from clothes. This would be a qualitative observation, since you are observing whether or not the shirt comes out free of stains or not after a single wash. This record of observations will be important when it comes to data analysis and consequently your conclusion. One common mistake that students often lose points for during judging is the lack of trials. It is important to carry out more than just one trial because you want to be sure that the results you are getting are truly reflective of what one could expect from doing the experiment themselves. Multiple trials will “average” the data you have so that you get an approximate answer that is centered and more accurate than one trial that could have been affected by an unknown error. If your project requires the use of fire and/or electrical wires, please ask your parents for assistance. We care about your safety, so please have your parents supervise you as you carry out your experiment!
(5) Analyze your findings and make a conclusion (aka answer your question)
After you finish your experiment, you have to analyze the results that you just obtained. This includes calculating (if applicable) the mean (average), the standard deviation (variance), etc. Follow your own measure if it includes qualitative data (e.g. a tally including the number of times the shirt is clean or not). This is also the section to include graphs, whether it be a pie chart or bar graph. Make sure it is an appropriate chart for the right kind of data. Of course, the process of analysis will vary across each project, but include calculations as you see fit. Remember, you can never include too much in your report, however, there are right or wrong calculations. Try to be concise and include all significant data points that will help support you claim. Once you are done with data analysis, you are ready to answer your question. Make sure you do your best to include all relevant data in the conclusion because this is what you will use to prove your cause. You want your friends to believe that Tide is the best laundry detergent right? So prove it to them—give them the facts and what you found. Perhaps maybe you can convince them to switch to this brand (#notsponsored). Always refer back to the main point of the project though. Include a definitive answer to your question. (e.g. The laundry detergent that does the best job at removing stains is….).
REVIEW:
(1) Make observations around you (2) Ask a specific question (3) Make a hypothesis (4) Experiment time! (5) Analyze the data and make a conclusion
Whew, congrats on making it to the bottom of this post! I know it was a lot to read, but everything that was mentioned here plays a major role in the development of a successful project.
So what are you waiting for? Go on out there and make us proud!
0 notes
Photo

Psychology and Neuroscience- Neural Impulses // 17 February 2016
77 notes
·
View notes
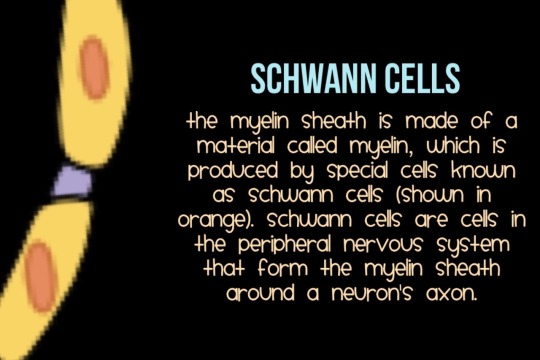
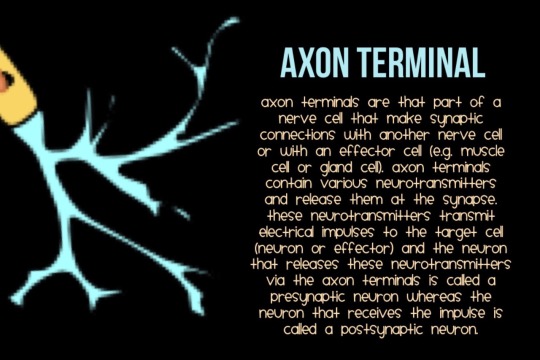
Photo

Action Potential - As a nerve impulse travels down the axon, there is a change in polarity across the membrane. The Na+ and K+ gated ion channels open and close in response to a signal from another neuron. At the beginning of action potential, the Na+ gates open and Na+ moves into the axon. This is depolarization. Repolarization occurs when the K+ gates open and K+ moves outside the axon. This creates a change in polarity between the outside of the cell and the inside. The impulse continuously travels down the axon in one direction only, through the axon terminal and to other neurons.
461 notes
·
View notes
Photo

Learning with games! We need this! :)
407 notes
·
View notes
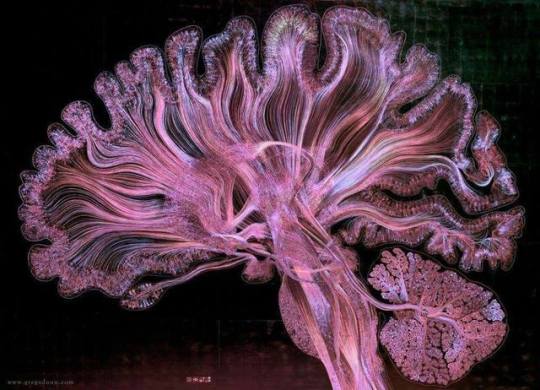
Photo
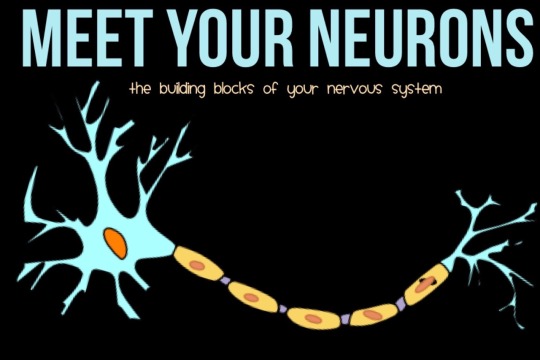
The brain is what it is because of the structural and functional properties of interconnected neurons. Your brain contains between 80 and 100 billion neurons, about as many stars in our galaxy.
More like this on @tobeagenius
3K notes
·
View notes
Photo

Follow realpsycho.tumblr.com for more psychology information!
117 notes
·
View notes
Photo
Thousands of neurons reflected by white, red and violet light
9K notes
·
View notes