Don't wanna be here? Send us removal request.
Text
Bonus post: Stats 101 - testing data for normality & significance tests for categorical and continuous variables.
Understanding and analysing data can be a tremendously daunting task, so I thought I would put together a simple go-to guide on how to approach your data, whether it be numerical or categorical. 📈📊
This post will cover:
Types of data
Contingency tables and significance tests for categorical data
Testing for normality in continuous data
Significance tests for continuous variables
NB: Remember to keep your data organised, especially if you are using software packages like ‘R’, MATLAB, etc.
Before I move on, I would like to thank the University of Sheffield core bioinformatics group for most of the content below. 💡
Types of data

There are two main types:
Numerical - data that is measurable, such as time, height, weight, amount, and so on. You can identify numerical data by seeing if you can average or order the data in either ascending or descending order.
Continuous numerical data has an infinite number of possible values, which can be represented as whole numbers or fractions e.g. temperature, age.
Discrete numerical data is based on counts. Only a finite number of values is possible, and the values cannot be subdivided e.g. number of red blood cells in a sample, number of flowers in a field.
Categorical - represents types of data that may be divided into groups e.g. race, sex, age group, educational level.
Nominal categorical data is used to label variables without providing any quantitative value e.g smoker or non smoker.
Ordinal categorical data has variables that exist in naturally occurring ordered categories and the distances between the categories is not known e.g. heat level of a chilli pepper, movie ratings, anything involving a Likert scale.
Contingency tables & significance tests for categorical variables
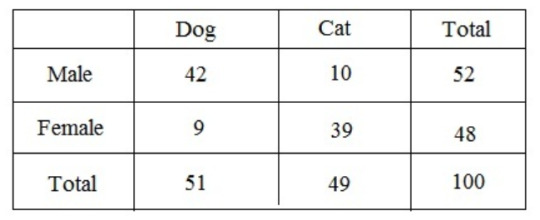
Contingency tables (also called crosstabs or two-way tables) are used in statistics to summarise the relationship between several categorical variables.
An example of a contingency table:
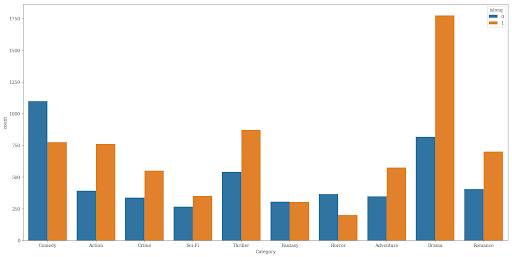
A great way to visualise categorical data is to use a bar plot/chart, which looks something like this:
There are two main hypothesis tests for categorical data:
Chi-squared test
Fisher exact test
Chi-squared test:
Compares the distribution of two categorical variables in a contingency table to see if they are related e.g. smoking and prevalence of lung cancer.
Measures difference between what is actually observed in the data and what would be expected if there was truly no relationship between the variables.
Fisher exact test:
Is used instead of Chi-squared when >20% of cells have expected values of <5, or any cell has a count of <1.
If you want to compare several contingency tables for repeated tests of independence i.e. when you have data that you’ve repeated at different times or locations, you can use the Cochran-Mantel-Haenszel test.
More detail:
In this situation, there are three nominal categorical variables: the two variables of the contingency test of independence, and the third nominal variable that identifies the repeats (such as different times, different locations, or different studies). For example, you conduct an experiment in winter to see whether legwarmers reduce arthritis. With just one set of people, you’d have two nominal variables (legwarmers vs. control, reduced pain vs. same level of pain), each with two values. If you repeated the same experiment in spring, with a new group, and then again in summer, you would have an added variable: different seasons and groups. You could just add the data together and do a Fisher’s exact test, but it would be better to keep each of the three experiments separate. Maybe legwarmers work in the winter but not in the summer, or maybe your first set of volunteers had worse arthritis than your second and third sets etc. In addition, combining different studies together can show a “significant” difference in proportions when there isn’t one, or even show the opposite of a true difference. This is known as Simpson’s paradox. To avoid this, it’s better to use the Cochran-Mantel-Haenszel for this type of data.
Testing for normality in continuous data
The first thing you should do before you do ANYTHING else with your continuous data, is determine whether it is or isn’t normally distributed, this will in turn help you choose the correct significance test to analyse your data.
A normal (also known as parametric) distribution is a symmetric distribution where most of the observations cluster around the central peak and the probabilities for values further away from the mean taper off equally in both directions. If plotted, this will look like a symmetrical bell-shaped graph:
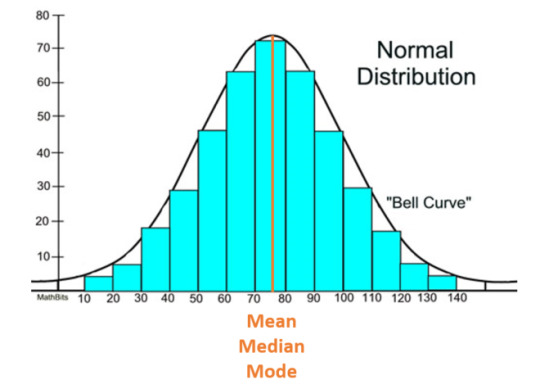
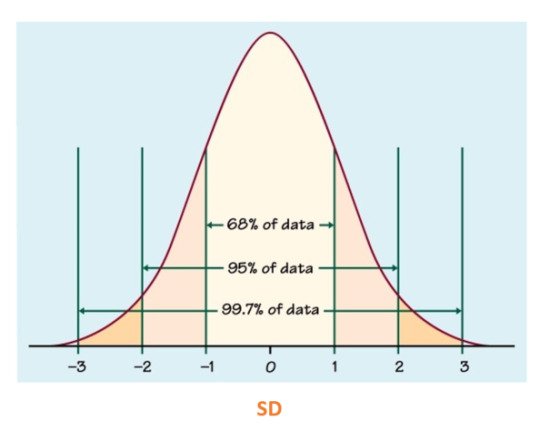
A standard deviation (SD) can be calculated to measure the amount of variation or dispersion of a set of values from the mean. The main and most important purpose of this is to understand how spread out a data set is; a high SD implies that, on average, data points are all pretty far from the average. The opposite is true for a low SD means most points are very close to the average. Generally, smaller variability is better because it represents more precise measurements and yields more accurate analyses..
In a normal distribution, SD will look something like this:
In a normal distribution, skewness (measure of assymetry) and kurtosis (the sharpness of the peak) should be equal to or close to 0, otherwise it becomes a variable distribution.

Testing for normality
Various graphical methods are available to assess the normality of a distribution. The main ones are:
A histogram, which will look something like this:
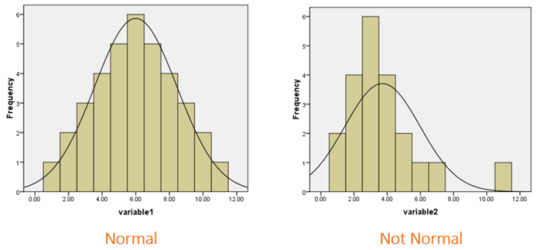
Histograms help visually identify whether the data is normally distributed based on the aforementioned skewness and kurtosis.
A Q-Q plot:
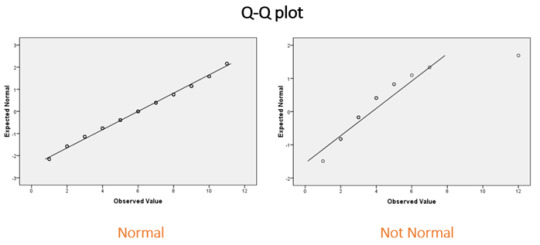
Q-Q plots allow to compare the quantiles of a data set against a theoretical normal distribution. If the majority of points lie on the diagonal line then the data are approximately normal.
and…
A box plot:
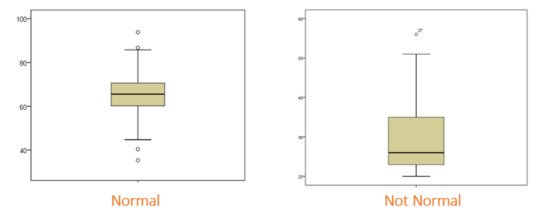
A box plot is an excellent way of displaying continuous data when you are interested in the spread of your data. The thick horizontal bar indicates the median, the top and bottom of the box indicate the interquartile range, and the whiskers represent the spread of data outside of this interquartile range. The dots beyond the whiskers represent outliers, which represent observations that are distant from other observations.
A disadvantage of the box plot is that you don’t see the exact data points. However, box plots are very useful in large datasets where plotting all of the data may give an unclear picture of the shape of your data.
A violin plot is sometimes used in conjunction with the box plot to show density information.
Keep in mind that for real-life data, the results are unlikely to give a perfect plot, so some degree of judgement and prior experience with the data type are required.
Significance tests
Aside from graphical methods, there are also significance tests, which are used to test for normality. These tests compare data to a normal distribution, whereby if the result is significant the distribution is NOT normal.
The three most common tests are:
Shapiro-Wilk Test (sample size <5000)
Anderson-Darling Test (sample size > or = 20)
Kolmogorov-Smirnov Test (sample size > or = 1000)
Significance tests for continuous variables
A quick guide for choosing the appropriate test for your data set:

t-test - normally distributed (parametric) data
There are three types of t-test
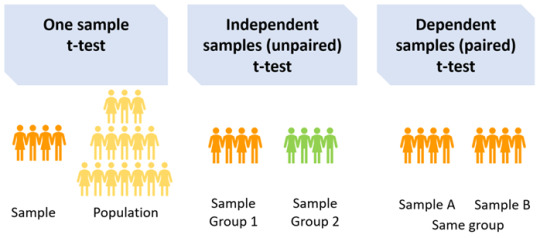
One sample t-test: Compares the mean of the sample with a pre-specified value (population mean) e.g. if the average score of medical students in UK universities is 72 and you want to test whether the average score of medical students in your university is higher/lower, you would need to specify the population mean, in this case 72, when running your t-test.
A two-sample t-test: Should be used if you want to compare the measurements of two populations. There are two types of the two-sample t-test: paired (dependent) and independent (unpaired). To make the correct choice, you need to understand your underlying data.
Dependent samples t-test (paired): Compares the mean between two dependent groups e.g. comparing the average score of medical students at the University of Sheffield before and after attending a revision course, or comparing the mean blood pressure of patients before and after treatment. Independent samples t-test (unpaired): Compares the mean between two independent groups e.g. average score of medical students between University of Sheffield and the University of Leeds, or comparing the mean response of two groups of patients to treatment vs. control in a clinical trial.
There are several assumptions for the independent (unpaired) t-test:
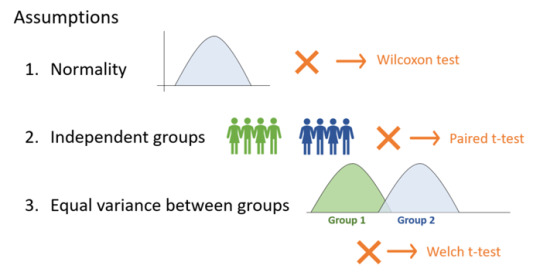
The t-test assumes that the data has equal variance and relies on the data to be normally-distributed. If there isn’t sufficient confidence in this assumption, there are different statistical tests that can be applied. Rather than calculating and comparing the means and variances of different groups they are rank-based methods. However, they still come with a set of assumptions and involve the generation of test statistics and p-values.
Welch t-test, for instance, assumes differences in variance.
Wilcoxon test (also commonly known as the Mann-Whitney U test) can be used when the data is not normally distributed. This test should not be confused with the Wilcoxon signed rank test (which is used for paired tests).
The assumptions of the Wilcoxon/Mann-Whitney U test are as follows:
The dependent variable is ordinal or continuous.
The data consist of a randomly selected sample of independent observations from two independent groups.
The dependent variables for the two independent groups share a similar shape.
Summary of the above:

ANOVA - normally distributed (parametric) data
Like the t-test, there are several types of ANOVA tests:
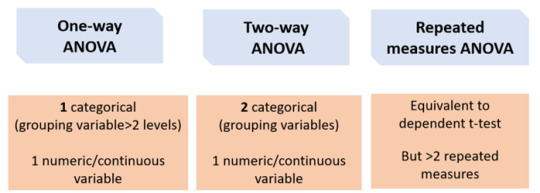
One-way ANOVA:
Equivalent to the independent t-test but for > 2 groups. If you want to compare more than two groups, a one-way ANOVA can be used to simultaneously compare all groups, rather than carrying out several individual two-sample t-tests e.g. to compare the mean of average scores of medical students between the University of Sheffield, the University of Leeds, and the University of Manchester.
The main advantage of doing this is that it reduces the number of tests being carried out, meaning that the type I error rate is also reduced.
Two-way ANOVA: 2 categorical (grouping variables) e.g. comparing the average score of medical students between the University of Sheffield, the University of Leeds, and the University of Manchester AND between males and females.
Repeated measures ANOVA
Equivalent to a paired t-test but for >2 repeated measures e.g. comparing the average score of medical students at University of Sheffield for mid-terms, terms, and finals.
If any of the above ANOVA tests produce a significant result, you also need to carry out a Post-Hoc test.
Post-Hoc test e.g. Tukey HSD
A significant ANOVA result it tells us that there is at least on difference in the groups. However, it does not tell us which group is different. For this, we can apply a post-hoc test such as the Tukey HSD (honest significant difference) test, which is a statistical tool used to determine which sets of data produced a statistically significant result…
For example, for the average scores of medical students between the University of Sheffield, the University of Leeds, and the University of Manchester, the Tukey HSD output may look something like this:

This shows a significant difference between medical students in Manchester and Sheffield and between Leeds and Manchester but not Leeds and Sheffield.
Kruskal Wallis and Friedman tests
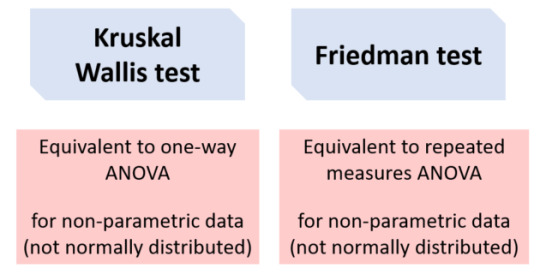
Data that does not meet the assumptions of ANOVA (e.g. normality) can be tested using a non-parametric alternative. The Kruskal-Wallis test is derived from the one-way ANOVA, but uses ranks rather than actual observations. It is also the extension of the Mann-Whitney U test to greater than two groups. Like the one-way ANOVA, this will only tell us that at least one group is different and not specifically which group(s). The Post-Hoc Dunn test is recommended, which also performs a multiple testing correction. For the Friedman test, you can use the Wilcoxon signed-ranks Post-Hoc test. And that is your go-to guide to on how to approach your data! I really hope you find it useful; it definitely helps clarify things for me. ✨
GOOD LUCK!

88 notes
·
View notes
Text


4 notes
·
View notes
Text
maybe you nerds should try a real “goblet of fire” and light up a bowl
38K notes
·
View notes


