Don't wanna be here? Send us removal request.
Text
Week 10
1. This week after I finished my pelican wing mini project, I wasn’t able to gather quality flow visualization, but at least I was able to observe some vortices generated by visualizing the flow one feather at a time.
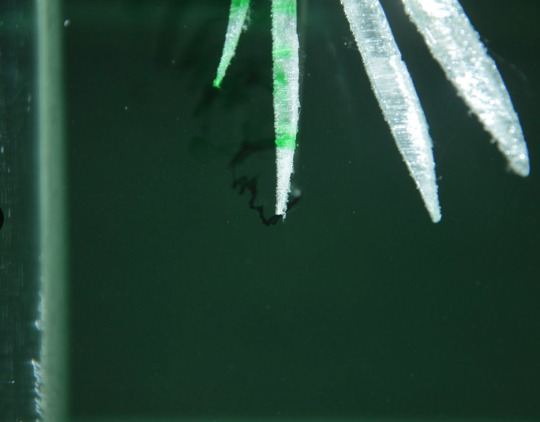
This is the best flow visualization that can be obtained due to the complex geometry of the feathers and the fact that the dye can be flowed in one direction. Also Austin and I placed the real pelican feather donated by Al Bowers at the outlet of the wind tunnel and ended up observing that when the exposed to airflow, the feather experienced some upward deflection which presented lift and backward deflection, which resembled drag.

Our project improvement recommendations include using multiple dyes to see the flow visualization on multiple feathers instead of one feather, building a better mount for feathers, and having better lighting upstream of feathers.
a. If I were to pick one thing that I understand pretty well about aerodynamics I didn’t at the star of AERO 307 is the fact that the flow separating from the wing is a good indicating that the wing stalling and the fact that the finite wings stalls near the middle and doesn’t stall near the wing tips due to the wingtip vortices.
b. The one thing about aerodynamics that still confuses me are the components of drag measured: total drag, pressure drag, and viscous drag. Im still confused on what kind of drag that is measured based on the equipments. I assume that when using the pressure taps, the pressure drag is measured? But depending on the experiment, I’m lost on what drag is measured unless I am specified.
c. My highlight of AERO 307 was learning about the fact that the aspect ratio really make a difference in terms of the stall distributions and the fact at a stall angle, only parts of the wings stall. It is interesting to see how the the flow doesn’t separate near the tips of the wings due to the wingtip vortices. At the stall angle of attack, only the center of the wing stalls, but as the angle of attack increases, the entire wing would eventually stall completely.
d. My lowlights for my AERO 307 are mostly the struggle of running the water tunnel. Even though I was using the water tunnel twice, it was a struggle to make efficient use of the water tunnel since I was struggling to pressurize the ink containers and pumping the dye into the water tunnel, keeping the dye dispenser stable while the water tunnel is running, getting proper lighting, and getting the best footage. For my formula car flow visualization, I was struggling with Neiman with finding optimum lighting, and holding the dye dispenser in the same position for a period of time while trying to visualize where the flow would separate. For my pelican experiment, it’s a similar concept, in which I was struggling to get the desired flow visualization I wanted due to the visualization
e. As I approach graduation, since I am aeronautical concentration, I am still undecided in my future in Aerospace Engineering, but I am likely going to stay in the air side. The fact that there are improvements in vehicle design and supersonic planes seem intriguing for me, and I would like to take part in the advancement of the transportation industry.
1 note
·
View note
Text
Week 9
1. This week, Austin and I were going to test the pelican wings the second time in hopes of getting a better flow visualization of the object. Since we weren’t able to get a great flow visualization last time, we plann to test the flow a different way this time. Last time when we were running the water tunnel, it ran at 4.5 in/s we realized that the flow seed was too fast for is to visualize the wing tip vortices around the pelican feathers. The way we positioned the dye was another problem. Since we didn’t realize that the dye dispenser was slightly bent downwards, it was difficult to get the flow the pelican wing top, especially if the flow was in the uniform direction. So for this week, we changed our approach to the test, and ran the water tunnel at 2.5 in/s and ended up having a better accuracy of the flow around the wing. We originally tried to center the wing tip centered at the green dye flow since we also want to see how the flow around one feather affects the flow around the feather behind it.
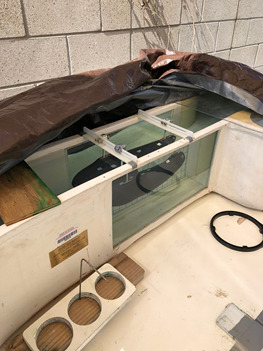
2. For me, since Austin and I only tested the pelican wing tip on Thursday from 4-6pm, I decided to show up half and hour earlier to set up the water tunnel since I know that setting up the water tunnel would be tedious. I changed the setup format of the water tunnel and have the wooden platform position as shown below:
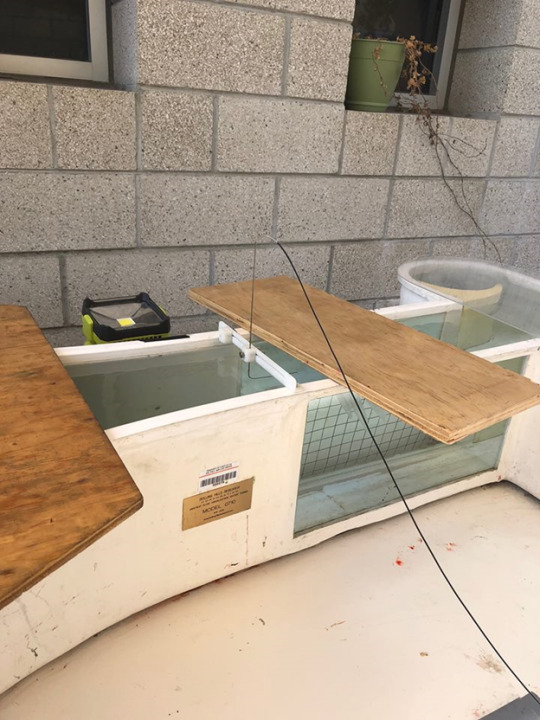
instead of covering the test section since it gives me more degrees of freedom in rotating the pelican wings without the fear of dropping the wingtip into the test section. Since I was testing the water tunnel during the AERO 569 private session, Austin and I were only limited to the water tunnel area and the sink. This shouldn’t be much of a problem for us since we could ask the AERO 569 students to grab equipments for us from there. For the most part, during the test, some of the feathers were stalling at some angle of attack as shown here:
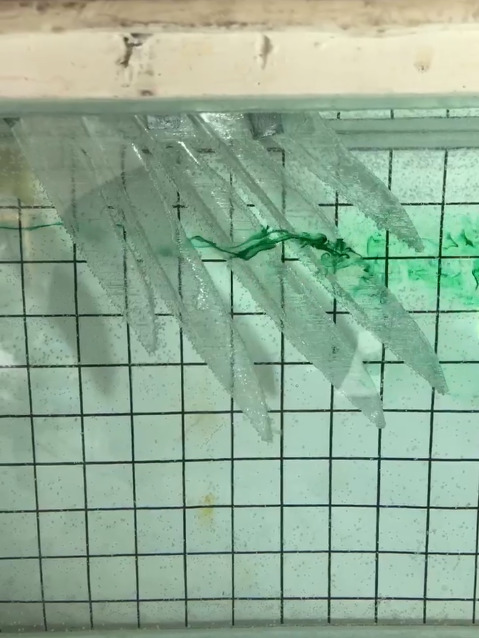
It’s noticable that some of the feather are stalling during the flow. Since the feathers are angled differently from the others, it is obvious that some of the feathers would have to stall especially with this complicated geometry. For the most part, most of the flow that I was able to visualize was the small vortex at the tip of the leading feather as shown below:
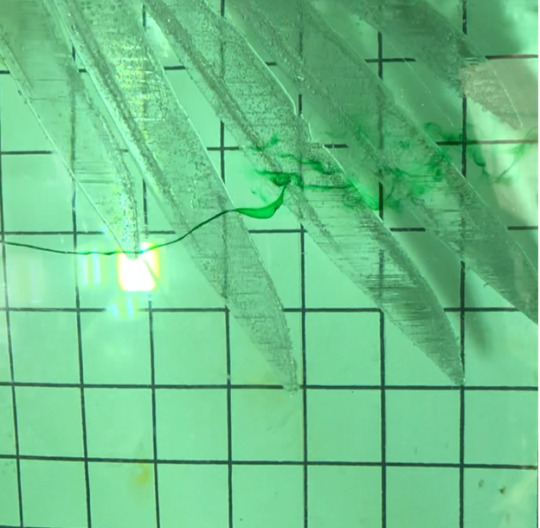
Though it wasn’t really a vortex, the flow visualizion seems interesting and distinguishable from the previous run at the flow visualization. For the most part though, the best we could do for this experiment is really one feather at a time.
3. For the flow visualization, it still didn’t go out too well as we wanted to see, but at least the flow visualization was a bit better than last time and we saw some vortex form after the flow gets past the leading feather tip. Though the green dye could only travel in a linear direction, we ran into issues when the green dye was somewhat rotating as it flowed, as shown below:
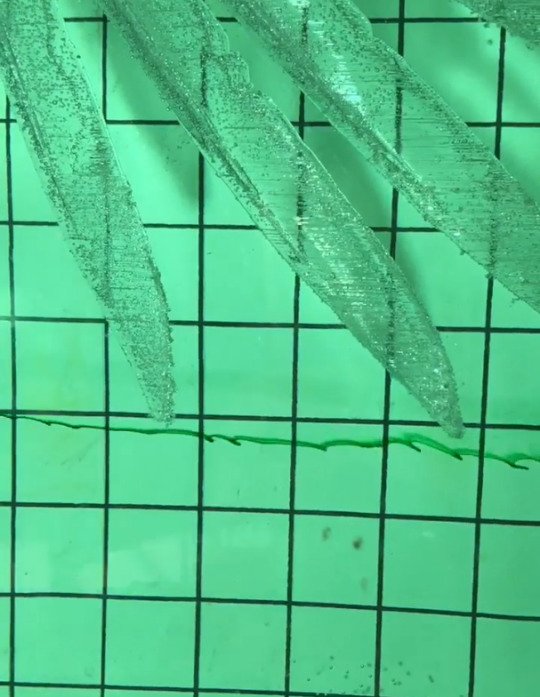
As the green dye flowed through the water channel, the flow noticably started to become slightly turbulent without interacting with the feathers. This caused made it hard to observie the flow around the feather tip since the flow was also somewhat diverging from the feather tip and precision was critical when it comes to getting a quality flow visualization. The fact that we had to position the green dye dispenser and the wing tip with extreme accuracy was difficult to pull off since it was windy during the test, which affected the flow of the water. From the side view, it was hard to get any quality flow visualization since the dye that is flowing in the direction towards the camera interferes with the visual component of the show, as shown below:
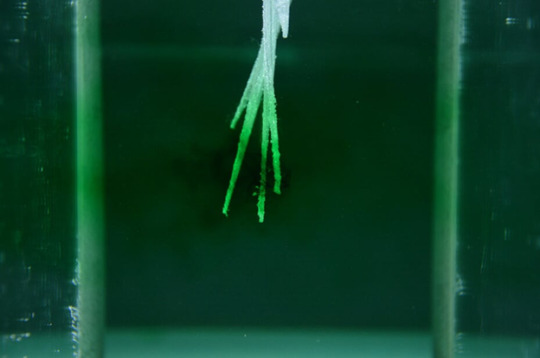
From this view, the vortex that we like to see form on the feather tip ends up looking like a faint cloud of dye in the water, which isn’t what we want to see. Overall, due to the complex geometry and the the face that the dye can only flow in one direction, the results from this week’s testing didn’t turn out to the way we want, but at least we could see how the feather tip affects the flow direction as the green dye flows by the feather tip.
4. For next week, I plan on putting mounting the pelican wingtip into the wind tunnel to see how the feathers deflect on varying wind velocities. Since the real pelican feathers came in, I will likely test out the real feathers since the 3D printed feathers are made of different materials and would likely deflect differently than the real pelican feather, given that the feathers were made of T-glase. Since it will be tested in the wind tunnel instead of the water tunnel, the setup wouldn’t be as tedious and would be more straight forward, though the difficulty I could find is to most secure way to mount the feather tip in the wind tunnel, but I think we could figure that out. Also, since Austin and I will be presenting on Wednesday, it will be similar to the flow visualization, but I will likely be explaining the ‘vortex’ that forms at the feather tip. I was hoping for better flow visualizion through the water tunnel, but it required accuracy and minimal interference from the wind and lighting.
5. This week I was reading an article about the how pelicans fly close to the water. This takes me back to AERO 302 when I was learning about the ground effect, which is essentially what this article was about. Pelicans tend to fly near the surface of the water since the pressure is higher on the ground, so it increases lift for the pelicans. Also, since the it they are flying close to the surface of the water, drag is reduced since wing-tip vortices are inhibited near the surface. Basically, by taking advantage of the ground effect, the pelican can fly above the water with great efficiency since they don’t’ have to exhaust much energy to generate thrust due to minimal drag. The link to the article is here:
https://www.northcoastjournal.com/humboldt/why-do-pelicans-fly-so-close-to-the-water/Content?oid=2125993
0 notes
Text
Week 8
1. This week, Austin and I were figuring out how to set up the pelican wing tip experiment. For the most part, we had our test plan, 3D print the pelican wing tip with t-glase material and analyze the wing tip vortices using the water tunnel. Our plan is to run the pelican wing tip in the water tunnel at the Reynolds Number of 57,000. In order to 3D print the pelican wings, I would have to obtain the pelican CAD file from Dr. Doig, in which the CAD file is created by students. Since the pelican wing tips are not fit to the right scale, I would have to edit the dimensions and scale to the entire wing tip to the right size. I ended up measuring the chord length of the pelican wing to be 5.282 inches, which has to fit with the additional wing tip I have to print. On the 3D model, it is 7.10 inches. To scale it, Austin and I scaled the 3-D CAD model so that the chord length would be 5.282 inches. 3D printing the wing was tedious since it my first time 3-D printing stuff, and that the geometry printed was complex and we weren’t sure if we could 3D print the material. We had to apply a glue stick on the pad where the wing tip is printed on, with the bed temperature of 60 C and nozzle temperature of 230 C.
2. After nearly 6 hours of printing the wing, I ended up with a snooth 3-D printed pelican wing tip shown below:
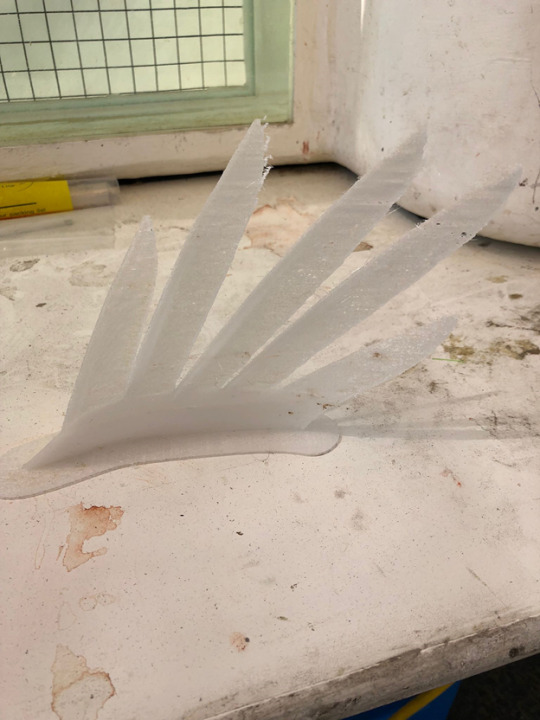
As I have done a couple weeks ago, since I want to analyze the flow viz around the pelican wing tip, I would have to go through a tedious water tunnel setup procedure of filling the water tunnel up with water and draining it. Similar to last time, since I wanted to reduce the effects of the glare, I had to cover the water tunnel in a tarp and placed lamps to have a clear visualization of the water flow as possible. Though there are effects of the wall boundary layer, it could be negligible since the main focus of this experiment is on the wing tip vortices. The flow visualization is shown below:
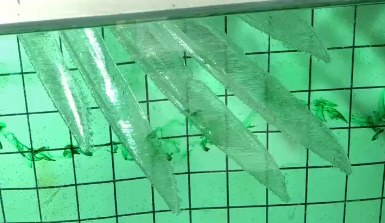
Similar to last time, I used green dye to visualize the flow, but I had trouble pressurizing the bottle containing the dye. It’s probably due to the fact that I didn’t shake well before pouring the dye into the container.
3. After doing the experiment, I felt that the flow viz didn’t go too well since it was hard to get a nice flow viz around 5 feather tips at the same time. Since there are only 2 people in my group, me and Austin, it was hard to keep the dye steady and take the video clip at the same time. The green dye from the figure above isn’t as uniform and thus, it was difficult to get a clear visualization of the wing tip vortices around the tips. I feel that the way to get a better visualizaion is to angle the front wing tip parallel the the direction of the flow, but the other feathers are all in different angles of attack and at different heights. It is difficult with a dye flowing at a certain depth of the water tunnel.
4. For next, week, I plan on retesting the wing tip on the water tunnel and also test it in the wind tunnel. Instead of mounting the feathertips level to the wood, I think the best way to do this is to angle the front feather parallel to the direction of the flow like I said earlier, and see how the vortices form at the feathers behind the front feather. That’s my most realistic method I could think of in terms visualizing the wing-tip vortices. If I get the chance, I could also mount the 3-D printed wingtip on the pelican and test it in the wind tunnel. Since the scanivalve is not installed on the pelican wing, the best I could do is to use the fog and see how the fog flows around the feathers of the wing compared to the flow visualization in the water tunnel.
5. This week, I found an article about the Eta bike, which is a human powered vehicle that broke the record of the fastest human powered vehicle at the speed of 89.59 miles per hour. This is intriguing since I would like to travel really fast without having to rely on energy sources. However, since it is a human powered bike, it is designed to be lightweight, which is about 55 pounds. It has a carbon fiber on the outer surface, which cuts the drag 100 times better than cars. The Eta bike is a one-seater created by a Canadian engineering company called Aerovelo. The link to the article is here:
https://www.popsci.com/this-bike-is-worlds-fastest-human-powered-vehicle
1 note
·
View note
Text
Week 7
1. This week, since my group already tested the wings with the low aspect ratio and high aspect ratio, we were mostly coming up with the lift and drag curve for the blue and red wings and using XFOIL to compare and see if our experimental plots line up with the XFOIL plots or not. For the most part, since the excel file uploaded on polylearn had multiple sheets, we were having a hard time getting Matlab to read the files and take in the data of the forces in the x, y, and z. After a couple of tries, we were able to take in the data for each angle of attack that we ran at. Using the Reynolds number of 125000 for both wings, the velocity for the blue wing is 15 m/s while the velocity for the red wing is 11.3 m/s. The red wing is tested at the angle of attack of 0,5,8,10,12,14, and 16 degrees while the blue wing is tested at 0,5, 10, 14, 16, 17, 18, 19, 20, 21, 22 degrees. Then, I was paired up with Austin to do the mini-project that focuses on the phenomenon of the wingtip vortices on the feathertips of the pelican’s wings. This phenomenon reduces the drag that the pelicans face when flying through the air, therefore making their flight more efficient, due to the ground effect.
2. For the most part, I used a similar method to gather data for CL and Cd from XFOIL as I used in the NACA 4412 infinite wing lab since I wasn’t sure how to account for the aspect ratio of the wings. Assuming that XFOIL data is accurate with the experimental data that I use, I ended up using the same approach. The following plot below is for the red wing:
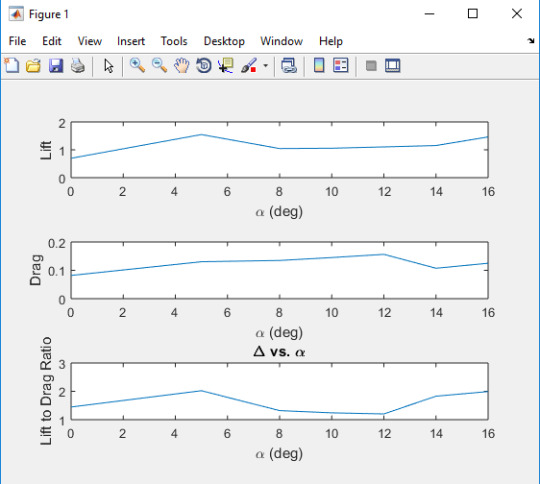
Here, judging from this graph, it can be shown that the maximum lift to drag ratio occurs at around 14 degrees, which is is when the wing begins to stall. Technically, the wing began to stall when the angle of attack was 12 degrees in the middle, but since the flow goes towards the wingtip, the tuffs in the outer region of the wing remains attached to the wing. The XFOIL plot is shown below:
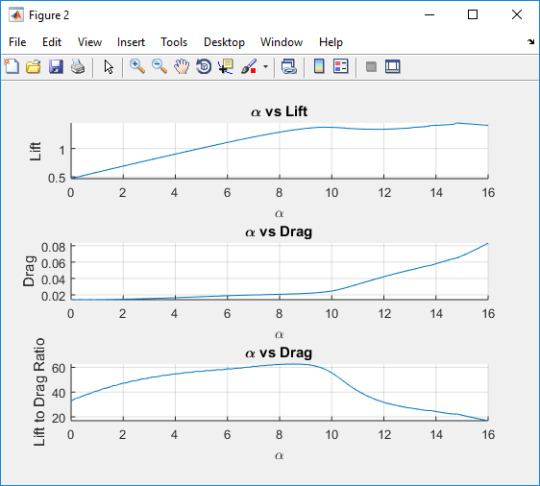
Here, the experimental data turns out to be in disagreement with the X-FOIL mostly for the drag. Experientally, the wing doesn’t stall 9 degrees, but according the X-FOIL plot for viscid flow, the lift to drag ratio is maximum at 9 degrees. The lift data for the red wing seems more accurate to the XFOIL data, but the drag for the red wing seems inaccurate. This probably has to do with the differing aspect ratio of the wing for the different wings. Since I used the similar approach for the NACA infinite wing but using different reynolds number, that probably also comes into play for the inaccuracy.
3. The part that stumbles me the most about the Finite Wing Experiment is the wind off data. I’m a little lost on why we test the pitch assembly without the wing attached to it. I’m assuming that it is to simply test that if the pitch assembly drifted during the first wing test?? The fact that I collected the forces in the X, Y, and Z direction is what confuses me. But I can see that the the pitch assembly was not insulated against EM interference, so we had to account for signal drift. I know that the data collected for both wings are important since we need them analyze and see the behavior of lift and drag when the tuff stalls in the middle. The bird wing tip feathers in the water channel really interests me since I am curious to see how having feather assemblies at the wing tip reduces the induced drag by spliting the strong tip vortex into weaker versions that induces drag and makes the flight less efficient. It will be interesting to visualize the flow at the wing tip where the smaller flow would merge and thus reduce the induced drag due to decreased wing tip vortices.
4. For next week, I am planning to finish up the tech memo for the force balance experiment, get the CAD file from Dr. Doig and print out the feater tip using the t-glase material since it is capable of printing out the thin feather surfaces. I am looking forward to testing the pelican feather tip on the water tunnel to visualize the flow around the wing and see how the wing assembly splits a large vortex into smaller divisions of vortices that doesn’t induce drag. Since I have used the water tunnel for my flow viz and knowing that it would take a while to drain the water tunnel and refilling it, I would have to be very precise about the dye and place it in a fixed location where I would be able to clearly visualize the vortex formation at the tip of the pelican wing.
5. This week, I ran into an article that is somewhat aerodynamically related but it happenes in the absense of aerodynamics since it is operated in a vacuum tube. Basically, China Aerospace Science and Industry Corp. is developing a MagLev train that could travel at supersonic speeds of up to 2,485 miles per hour, faster than commercial flights. Here, the train is “flying” since it is traveling at supersonic speeds, but it can’t really fly. The MagLev trains wil operate in a vacuum tube in the absense of air resistance and air properties, minimizing the possible drags. This concept is similar to the hyperloop transportationn concept here in the U.S. but it travels at a much higher speed. In addition, the vehicle’s acceleration speed is claimed to be slower than a plane in take off, so the passengers could be free of safety concerns. The link to the article is: https://www.cnet.com/news/china-flying-train-hyperloop-elon-musk-supersonic/
1 note
·
View note
Text
Week 6
1. This week, I gave a presentation about the flow viz about the air flow around the 3D printed model of the current Cal Poly Supermileage car. I figured that the flow would separate around 5.5 inches behind the trailing edge of the car. Since I was running the experiment at the Reynolds number of roughy 27,000, I figured that the 4-layer 1mm thick aluminum tape wasn’t thick enough since the boundary layer thickness is around 8 mm, thicker than the 1 mm, thus the trip strip doesn’t have any effect on the flow. For this week’s lab, I was grouped with Hunter, Austin, and Josh D to test the NACA 4412 finite wings: one with a high aspect ratio and one with a low aspect ratio. Basically, we were testing the wing to how the aspect ratio plays a role in the wing tip vortices and where the wing stalls at which angle of attack. The red wing experiment is run at 11.3 m/s while the blue wing is run at 15 m/s.
2. For the most part, I was helping the group take notes about the experiment. Since the red wing, the high aspect ratio wing, was mounted on the wind tunnel test section, I ended up testing the high aspect ratio wing first as shown below:
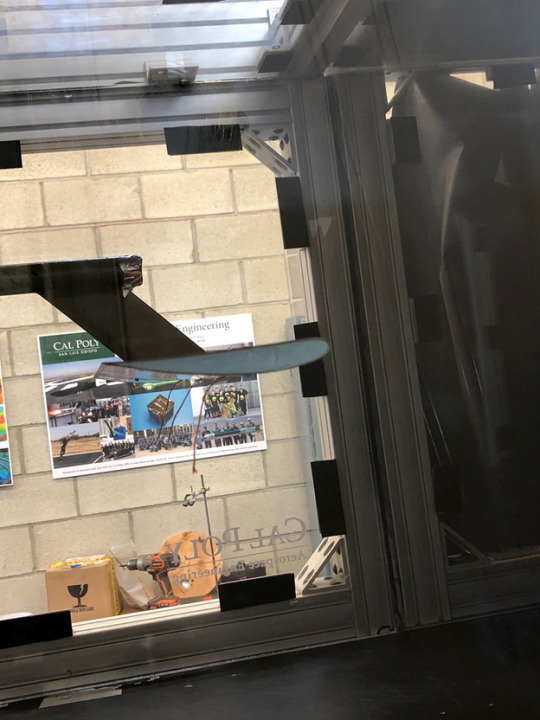
The experimental setup was familiar to last time when I was testing the NACA 4412 infinite wing where I had to make sure the outer doors are closed, and I had to make sure that there is no debris in the wind tunnel. For the red wing test, the runnel ran at 265 RPM to match the speed of 11.3 m/s and it is tested at the angle of attack of 0, 5, 8, 10, 12, 14, and 16 degrees. At this speed, the wing doesn’t stall until I reach 12 degrees, in which the tuff near the middle stalls first, but the outer tuffs near the wing tip stays attached to the wing.
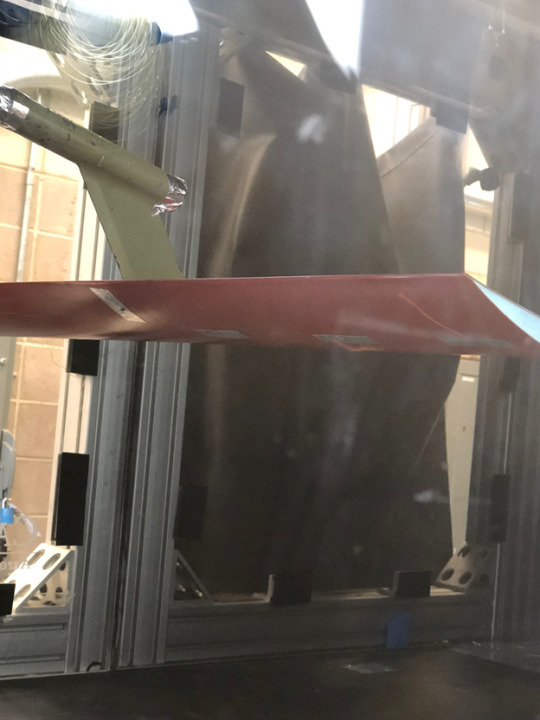
As shown, the tuff near the wingtip stays attached to the wing due to the effect of the wingtip vortices. Afterwards, I had to detach the wing from the test section and ran the test without the wing to measure the drag of the pitch assembly. Then, I installed the blue wing, the low one with the low aspect ratio. I first had to see if the wing is level by using a force balance. Based on the force balance reading, I ended up with an offset error of 0.6 degrees, which could play a role in inaccuracy. While I testing the blue wing, the wind tunnel ran at 345 RPM to have a velocity of the flow of 15 m/s and it is tested at 0, 5, 10, 14, 16, 18, 19, 20, 21, and 22 degrees. Contrary to the previous wing, the middle tuff on this NACA 4412 wing stalls at a higher angle of attack of around 16 degrees, as shown:

With a larger wing area, the flow tend to stay attached longer and delays the angle of attack in which the wing stalls. The other 2 tuffs didn’t stall until the angle of attack is 22 degrees, in which the tuffs point towards the wing tip due to the wingtip vortices.
3. This is by far the most interesting lab for me since it is interesting to see that not all parts of the wing stalls at a certain angle of attack due to the effect of the wing tip vortices. While the tuff near the middle of the wing stalls first, the tuffs near the tip of the wing stays attached longer and they point towards the wing tip as the angle of attack increases. With a lower aspect ratio, the flow tends to stay attached to the wing for a longer range of angle of attack. While the angle of attack changes, I can see that I had to displace the y-position of the wing to keep the wing centered in the test section to avoid any effects of the boundary layer of the wall of the test section.
4. For next week, the goal for my lab group is to test out the Xflr and get most of the lab report finished. Using the data I collected during the experiment, I should produce plots for the lift and drag vs the angle of attack that I used this week to compare the plots for both the wings and see how the aspect ratio of each wing affects the lift and drag of the other. Also, when comparing the data to Xflr, I might see some inaccuracies and figure out the reasoning behind some potential error.
5. This week, I read an article about the Mars Helicopter that will Fly on Mars on the next Mission. This may be space side stuff, but I feel that there is air side to it. Since it is used in a different atmosphere, the rotating blades would have to rotate at 3,000 rpm. Due to the thin atmosphere, the helicopter on the Mars surface is similar to earth at 100,000 feet up. Based on this, the helicopter has to be as light as possible while having fast-rotating blades to be able to fly around the Mars environment. The link to the article is :
https://www.nasa.gov/press-release/mars-helicopter-to-fly-on-nasa-s-next-red-planet-rover-mission
1 note
·
View note
Text
Week 5
1. For this week, I was working with Neiman to set up the supermileage car ready for testing. This is our second experiment in which we include a trip strip to see if we could trip the flow to delay flow separation. Since the flow separated 6 inches from the trailing edge of the car, we feel that inserting the strip there would keep the flow attached, but it would also make the flow more turbulent. So, we placed several layers of tape onto the separation point of the car for this purpose. Prior to testing the car on Wednesday, Neiman and I changed the lighting tactics a bit, shining the lights away from the grid, using the reflected light from the tarp as the lighting source. The plan was to use the tarp to minimize the effects of the lighting since the outer lighting would interfere with the flow visualization. We were thinking of using the same green dye we used last week to visualize the flow around the supermileage car. Setting up the water tunnel was time consuming since I had to make multiple trips to the sink in the wind tunnel lab to drain the water tunnel by scooping the water to the sink. We also stuck with the same velocity of the water current at 3.5 in/s we used last week.
2. For me, I had similar duties I had last week, which was to help drain the water tunnel, mount the supermileage car into the water tunnel, pumping green dye into the water tunnel, and recording the video with my phone in addition to using the lab camera to see which can lead to better viewing results. I helped Neiman used the hangars to hang the car in the center of the water tunnel, using duct tape and screws to secure the car to keep the car from interfering with the height of the boundary layer. The water tunnel setup ended up being similar to last week, as shown below:
The only difference is that flashlight is faced away from the grid behind the car, resulting in a better visualization than last week:
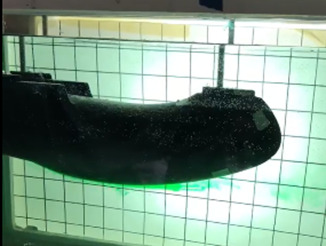
Last Week
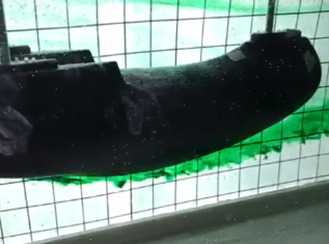
This Week
The results look better than last time and it clearly shows some slight flow separation at the same separation point from last week and it turns out that the trip strip didn’t really do much. I had to create a taller trip strip when the flow gets tripped, there’s higher pressure at the tip of the strip, resulting in the reattachment of the flow onto the car. However, it only turned out to produce a faint change in the flow visualization. When I was trying to pump the green dye into the water tunnel, I was having issues with the pump since the valve isn’t really pressurizing the dye bottle. It might have been due to some leak on one of the tubes for a different color dye. Neiman and I had to remove the connection joint that links to all three colors of green, red, and blue, and only attached the tube that links to the green dye. It turns out to be the solution and I was able to pump out the green dye as shown the figure above.
3. After testing the supermileage car with the trip strip attached, I can see that adding a trip strip makes the flow stay attached longer.
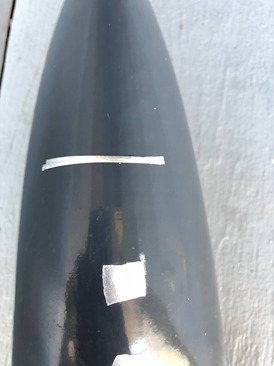
It’s a bit hard to tell, but I’d say that the flow did become more turbulent at the trailing edge of the car since flow didn’t really circulate there, like it did in the first one. However, I’m pleased that our changed lighting strategy worked and ended up making the flow more visible to see by just using the reflected light from the tarp as the light source, which was bright enough to make us see the flow. The thing that I am confused on is the fact that there is higher pressure on the tip of the trip strip. Is it because freestream pressure is higher than the pressure along the surface of the wing? Throughout the experiment, there were times that duct tape support failed while pumping green dye that it eventually fogged the water, making it hard to make contrast with the green dye and the surrounding water.
4. Since I am finished with the flow viz experiment this week, my goals for next week is to work on the presentation that I will present on Monday about the flow visualization and show how adding a trip strip affects the flow around the car. Based on the video that me and Neiman took, I might have to edit the video and add some contrast to be able to distinguish the flow visualization with the surrounding water. Neiman and I took more video clips of the experiment, and the goal is to filter out the sound and unnecessary content to show to the class. Now, the only goals for next week only pertains to the flow visualization experiment since the groups for the NACA 4412 on the force balance experiment hasn’t been assigned yet.
5. This week, I stumbled into an article about the AirFish 8 designed by a Singapore firm, Wigetworks. It is a “flying boat” that can reach speeds of up to 120 mph, capable of carrying up to 50 passengers. It is designed to transport people to remote islands that require long boat trips to get there. The AirFish-8 design operate based on the ground effect, in which high pressure near the ground helps keep the plane airborne at low altitudes of 1.5-60 feet above the ground. Requiring only 500 meters to take off, this vehicle is convenient when it comes to transporting people to places where ferries can’t reach. The link to the article is here:
https://www.thesun.co.uk/travel/5712849/the-airfish-8-flying-boat-by-wigetworks-that-can-reach-speeds-of-up-to-120mph/
1 note
·
View note
Text
Week 4
1. This week, I was originally planning to test the supermileage car ono Monday, but Neiman and I realized that we scheduled the experiment too early and we weren’t as prepared as anticipated. On Monday, we were in the lab measuring the length, width, and height of the car and found them to be 16. 025 inches long, 4.1875 inches wide, and 4.03125 inches tall. But for the most part, we are mostly concerned about where the flow will separate along the length of the car. We assumed that the flow will separate near the back of the car on the convex surface where it curves inwards. I was figuring out ways to mount the car into the water tunnel test section to get it tested. Neiman and I were thinking about hanging the car in the middle since we don’t want the car to interfere with the height of the boundary layer that is likely to large due to a small Reynolds number of 57,000. On Wednesday, we tested the Supermileage car at the rate of 3.5 in/s. Setting up and cleaning up the water tunnel was time consuming since it takes a while for the water to fill up the water tunnel and for it to drain.
2. Since I was doing the Flow Viz challenge for the most part, the only kind of “data” that I could gather is the video itself, where I can have a rough estimate of where the flow would separate. When I came to setup the lab on Monday, I was working find ways to mount the supermileage car into the middle of the water tunnel. One way I thought of was to screw the car onto the handles where the car would hang from and see if it stays in the middle of the test section. It turns out to work well, but I also needed more screws to secure it onto the test section. After realizing that some of the tapes are interfering with the flow, I had to replace the tapes that are worn out and it turned out to smooth out the surface better. I watched the other group set up the water tunnel and realized that it is important to block out the sunlight to have a clear visualization of the flow using the dye. When Neiman and I were ready to test our supermileage car on Wednesday, I had to come in earlier to help the other group drain their water tunnel. Then I was able to place the supermileage car and had to use some duct tape to secure it, as shown below:
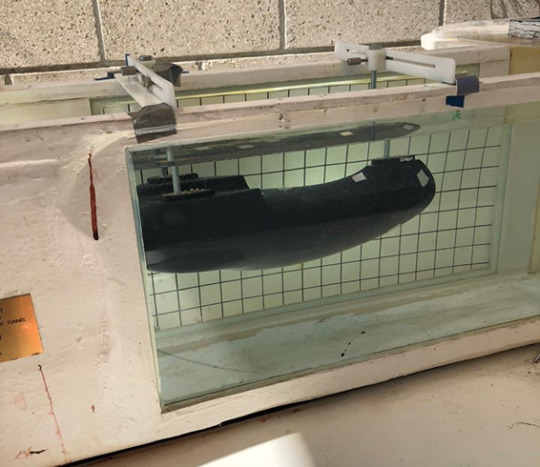
The duct tape does the job in securing the car to make sure it is in the center so that the height of the boundary layer won’t interfere with the car. While testing the car, we only used green dye since it was the only dye that worked.
3. After testing the supermileage car, my assumption was accurate in which the flow would separate near the back of the car, as shown below:
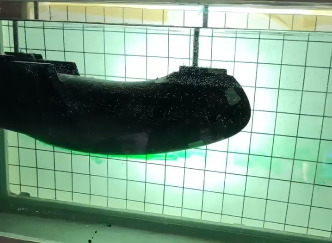
Here, since the grid is spaced by one inch, the flow seems to separate like 6 inches from the back of the car. The flow visualization isn’t clear since the lighting behind the grid is causing a glare interfering with the visualization of the flow. At first, we didn’t block out all the sunlight and felt that it wasn’t an issue, but seeing that the light behind the grid is making it hard to visualize the flow, we eventually covered the water tunnel but didn’t work out too well. Though we could see that the flow separates 6 inches from the back and forms a boundary layer that transitions into turbulent 3 inches from the back, the flow visualization wasn’t detailed enough to be presented to the class.
4. For next week, I’m planning to test the supermileage car again, but this time with the trip strip to trip the flow and see how it improves the flow over the supermileage car. We assume that the flow would remain attached to the car longer and the flow stays laminar. Also, I need to figure out how to deal with the lighting situation so that when I record the flow viz, the glare from the lighting won’t interfere with the flow visualization. Based on the changes I hope that I clearly show the comparison of the flow visualization around the supermileage car with the trip strip and without the trip strip. Hopefully the video clips wouldn’t have the glaring effect this time.
5. This week, I stumbled into an article aerodynamically related: Building the hypersonic missiles. This article is interesting since missiles usually travel at supersonic speeds, but not a hypersonic speeds. The pentagon has given Lockheed Martin a $928 Million to create hypersonic missiles that are incredibly hard to defend against. Knowing about the incident that happened with Syria, I feel that this is a great step for the United States moving forward. The missile must exceed mach 5 and must be capable of being carried on the fighter and bomber aircraft. The link to this article is: https://www.flightglobal.com/news/articles/usaf-awards-lockheed-martin-928-million-contract-fo-447826/
1 note
·
View note
Text
Week 3
1. This week, my group did the second part of the NACA 4412 Airfoil experiment, only this time with the wake included. The wake rake is installed to measure the total drag of the NACA airfoil, as opposed to just the pressure drag of the NACA 4412 airfoil. We ran the test at the same Reynolds number of 500000, and slightly adjusted our speed to 30.5 m/s. Though the lab procedures were like the one from last week, we only tested it at angles of attack of 0, -5, and -7 degrees since we want to see the total pressure the probe is reading when the airfoil is inverted. If we tested the airfoil at angle attacks of -8 or higher, we would have inaccurate data due to stall. After testing the NACA 4412 wing, we were working on the NACA 4412 memo, and making plans on who does what on the memo. As of now, I am working on the experimental setup and the methodology portion. For the flow viz project, I ended up teaming with Neiman and planned to test the Cal Poly Supermileage Car in a water tunnel to see where the flow separates.
2. Before conducting the wake experiment, I had to calibrate the rake to get the probe to align with the trailing edge before running the experiment for each angle of attack, as shown below:
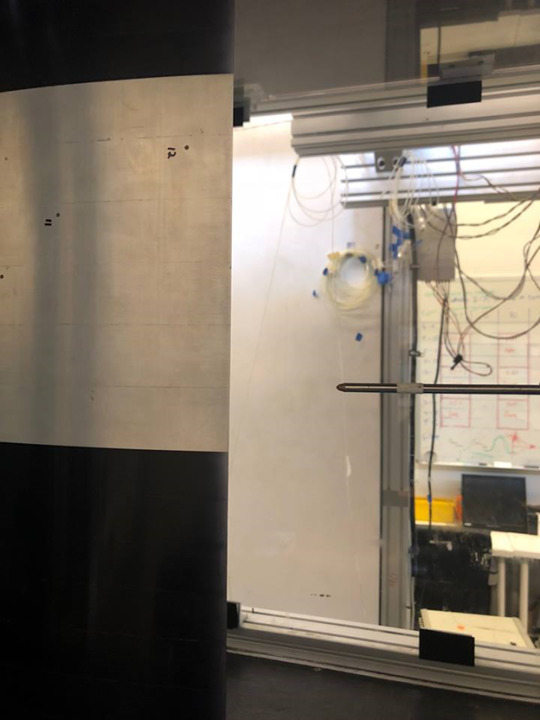
The wind tunnel is run at 686 RPM since our speed was 30.5 m/s. When I started the experiment, I had to start in the position where there is free stream and move down along the y-axis to gather full data of the total pressure the probe reads at each position. I had to decrease increments when there is a change in total pressure (the third panel of pressure data) to see how the total pressure changes as a decrease in the y-position. For the lab, my group came up with the pressure plots, referenced to the freestream pressure for each angle of attack of 0, -5, and -7, which are shown below:
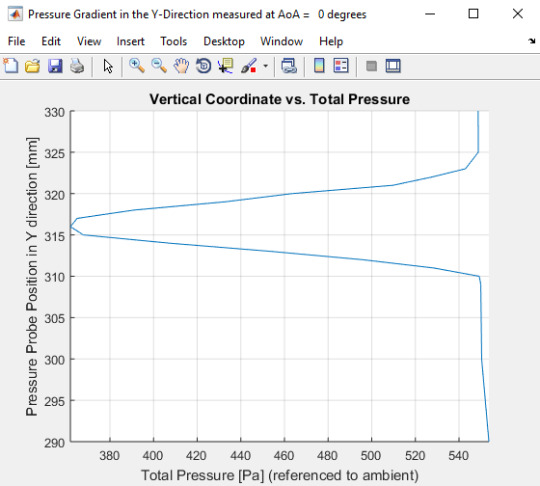

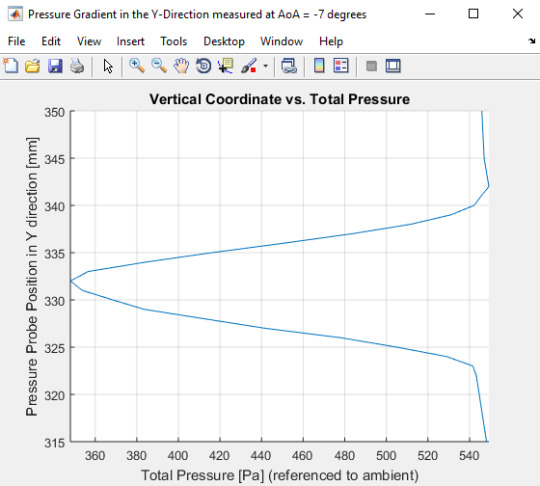
Based on the shape of the graph, the data seems reasonable as there should be a dip in the dynamic pressure curve as the pressure probe inches closer to the trailing edge. Since we didn’t reach the stall angle, the angle here should be accurate. For the flow viz challenge, I was discussing with Neiman about what to do and as of now, I am testing at 3-4:30 on Monday and for my part, I would pour color dye into the test section of the water tunnel, and take the video of the flow viz of the flow past the mileage car to see where the flow will separate.
3. For this week’s testing, I initially thought that the lab procedures were like that of last week, so I was a bit confused on my part. I thought I was supposed to change the angle of attack for every run like last time, but I realized that I only change the angle of attack for each run. The thing that I must keep changing is the position of the pressure probe to measure the pressure for each position. The one thing that I need clarification on is how is the wake portion of the lab measuring the total drag as opposed to only the pressure drag for the first portion of the drag of the NACA 4412 airfoil? I understand that the objective is to measure the area where there is a velocity deficit, and to measure the total drag, knowing only the pressure drag from the previous experiment, but I’m having trouble grasping how this can lead to the total pressure. If there were any slight errors in the test, it would have been due to the door of the control room open during the test, affecting the pressure, as shown below:
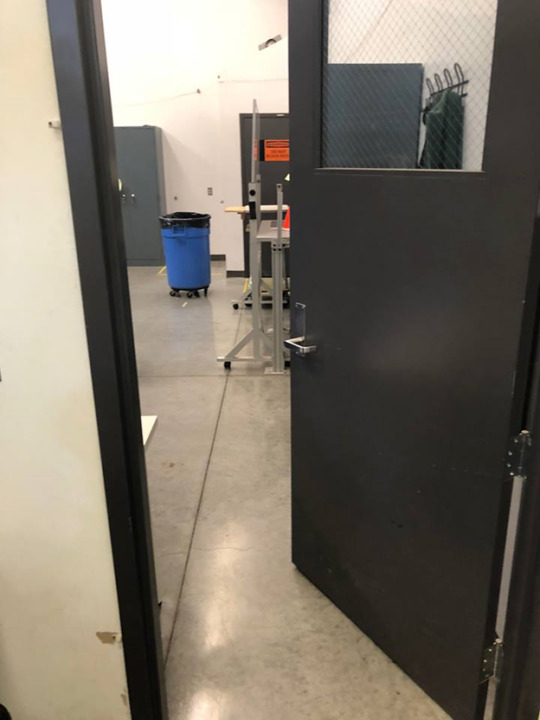
This was, again, part of my confusion of my lab task.
4. My plans for the week ahead is to finish up my NACA 4412 Lab Memo, come prepared for the Mileage Car test, and find out where the flow would separate on the Cal Poly Supermileage car. Neiman would then take a screen shot of the footage of the flow viz and create a scale to see where the flow would separate. As of now, since we are running at a low Reynolds number of approximately 57000, the water would flow at a rate of 5 in/s. At this rate, we would expect the flow to separate near the back of the car. Since I am using the water tunnel, I am recording the flow viz from the side of the tunnel so that I could get a clear visualization of the flow viz. If I record from the top, the video would not be as clear since the reflection from the water would interfere with the video quality.
5. I have ran into some article that is somewhat aerodynamically related, a six-mile long hyperloop system in Dubai that would have the first section complete by around 2020. The pod would travel at the speed up to 1200 km/hr. Though the main factor of the hyperloop is the lack of friction, I feel that aerodynamics play a role in this since the pods would have to be designed to resist the drag when traveling at such a high speed. The high speed is achieved by reducing air pressure inside to tube to the pressure equivalent at 20000 ft above sea level. If this is achieved, then it would be a major improvement in the transportation industry for years to come. The link to the article is: http://www.dailymail.co.uk/sciencetech/article-5635363/Worlds-commercial-Hyperloop-hurtle-passengers-Abu-Dhabi-2020.html
1 note
·
View note
Text
Week 2
1. This week, my group did the first part of the NACA 4412 airfoil experiment when it’s inverted since we are curious to see how it affects the angle of attack of which it stalls opposed to when the airfoil is not inverted. We ran the test at the Reynolds number of 500,000 so we wanted the airflow to travel at 31.3 m/s. For the air to flow at 31.3 m/s, we kept increasing the wind tunnel RPM until the airspeed reached 31.3 m/s, which is when the wind tunnel is at 695 RPM. We did 2 runs at the angle of attack of 0, -5, -6, -7, -8, -9, and -10 degrees without the trip strip attached. We attached a piece of strip at the end of the airfoil see at which angle of attack the flow would separate and the small strip would be detached from the surface. After the experiment, we compared our experimental plots to the plot on XFoil.
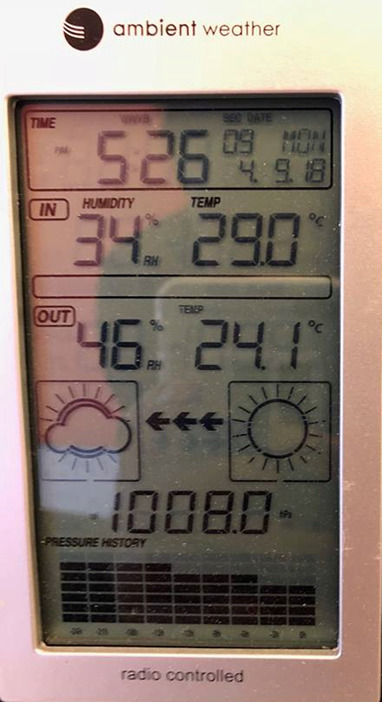
2. For me, I was mostly in charge of turning on the wind tunnel and collecting the data while the wind tunnel is running. I had to set the wind tunnel to certain parameters based on the surrounding temperature, mostly 24.1 degrees Celsius, and the atmospheric pressure of the lab of approximately 1008.0 hPa as shown in the ambient weather indicator below:
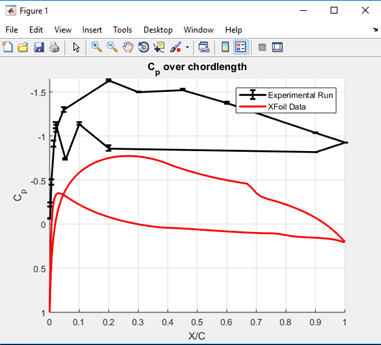
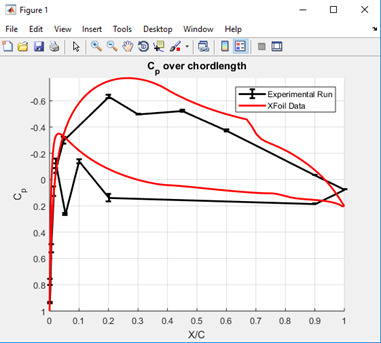
After telling on of the other group members to adjust the angle of attack, I had to wait 20 minutes for LabView to stabilize and adjust to the new angle of attack to collect data. I collected 200 data points for the first run and 100 data points for the second run. For the first run, I ran the wind tunnel at 695 RPM while for the second run, I ran the wind tunnel at 697 RPM. Despite the different RPM, the results look like each other for each of the two runs:
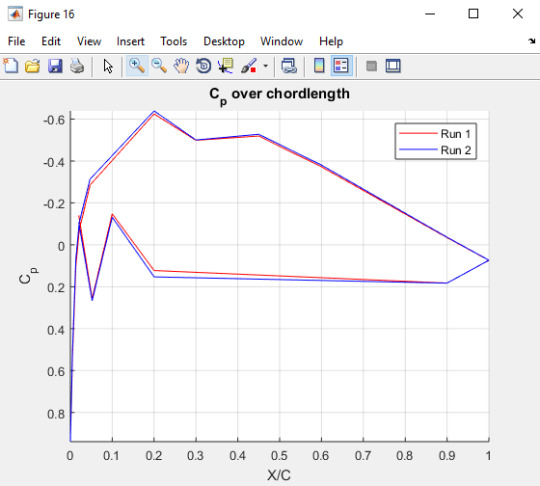
The graph above shows the CP plot for the angle of attack of 0 degrees. Since the experiment is run at two slightly different RPMs of 695 and 697 for runs 1 and 2, respectively, the cp plot above appears to show a slight difference in the cp plot for each run. The pressure ports were also off, so I had to add 1 to cp to ensure that the maximum cp is 1 and match well with the XFoil plot.
3. For the most part, I used XFoil to gather cl and cd for viscous flow for angle of attack from 0 to -10 degrees and saw that the max L/D plot occurred at angle of attack of -9.3 degrees, similar to what I saw when the small strip detaches from the surface at the angle of attack of around -9 degrees.
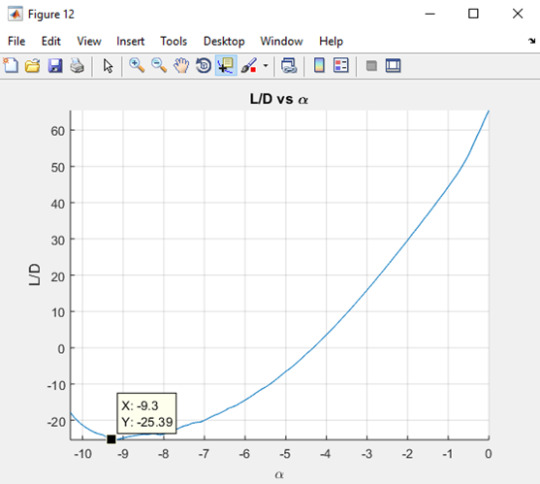
Here, since the NACA airfoil is inverted, I technically used the numerically minimum L/D of -25.39 to see where the plane stalls at “maximum” L/D. The one thing that I am still having trouble with is figuring out how to get the cd values from out experimental data and whether the cd values are accurate or not. My group has been coming up with negative drag values and we weren’t sure if they are correct or not. Hopefully that is something we could figure out by next week.
4. For next week, I am going to test the NACA 4412 airfoil using the wake rake and using the same angle of attack of 0, -5, -6, -7, -8, -9, -10 degrees at the Reynold number of 500000 and the velocity of 31.3 m/s to see how the wake rake affect the cp, cl, and cd results. The wing should stall at a lower angle of attack since the wake is making the airflow more turbulent along the wing.
5. I recently read an article of conceptual hypersonic planes , the “Paradoxal”, “Skreemr”, and “Antipod” that can allow for quick long distance travel. Created by Charles Bombardier, these planes are launched by railgun, travel into space by injecting liquid oxygen into the engines, and can travel 12,427 miles in less than hour. The link to the article is found here:
https://futurism.com/take-a-look-at-the-ultrafast-spaceplanes-of-tomorrow/
1 note
·
View note
Text
1. My name is Jimmy Truong and I am one of the members of group 3 who will test the airfoil on Monday at 3-4:30. Prior to testing the airfoil, we developed a test plan and decided to run the test at the reynolds number of 525765.09223 and the speed of 30 m/s. We also decided to run the For the most part, my group was figuring out how to get an accurate cp plot of the NACA 4412 airfoil based on the sample data provided by the TA, and using XFoil to generate a cp plot at angle of attack of 0, 5, 10, 12, 14, 16 to see which angle the plane stalls at.
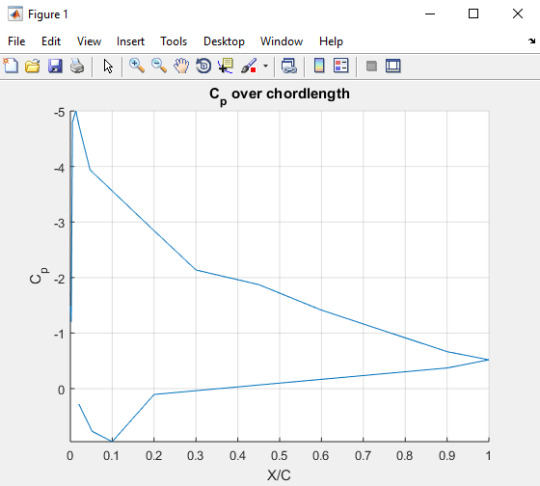
2. For the cp plot, we end up having errors in the cp plot since it does not look as smooth as shown in the lab manual as shown in the graph below.
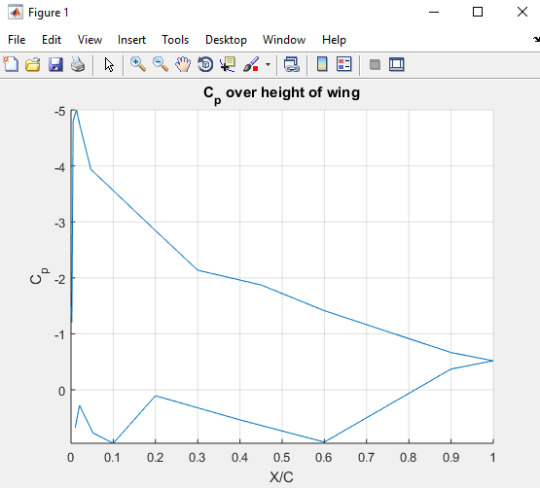
As shown, the plot looks funky despite plotting it based on the x/c positions provided in the lab manual, with only port 7 taken out since the pressure value seems like an outlier compared to the other pressure values within the trend. One of the issues we encountered in the lab was the fact that panels 17,18,19,and 20 were improperly ordered. This could be why the cp experienced a slight increase for the 20th port. Another was that at port 14, cp increased to 1, making the plot less smooth. Thus we had to remove ports 14 and 20 on top of port 7, interpolate and the plot turned out to be more smooth.
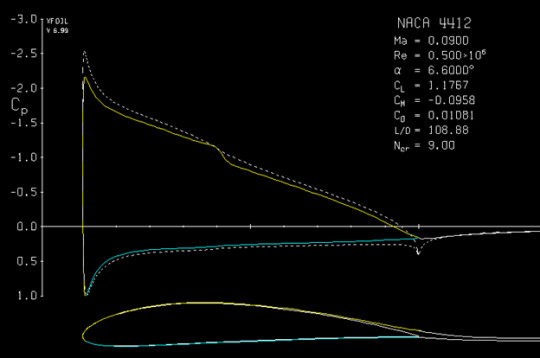
For the XFoil, I was mostly learning how to use it based on the tutorial. Since we are trying to see which angle of attack that the flow separates at the leading edge when testing the airfoil at mach 0.09 with Reynolds number of 500,000, in which the plane stalls, we made several attempts at various angles until we see L/D max out, in this case at 108.88, as shown below. We plotted the XFoil in viscous flow since we can’t always assume inviscid flow in real life.
Here, the we also saw that the flow starting to separate at the angle of attack of 6 degrees.
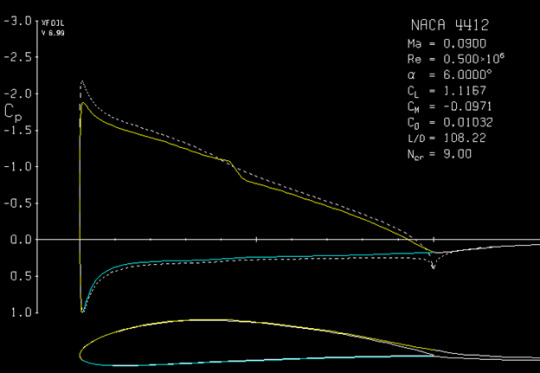
As the flow begins to separate from the upper surface of the airfoil, the airfoil will slowly reach its stall point.
3. Since we didn’t test the wing in the lab yet, we weren’t able to provide actual experimental results, but surprisingly, while our team thought that the airfoil stalls at 12 degrees, the airfoil stalls at 6.6 degrees when running at mach 0.09 at Reynolds number of 500000. I feel that stall angle varies at every speed since the speed is low, it is reasonable for the plane to stall at 6.6 degrees. Though the low stall angle is a bit surprising, I am curious to see how the stall angle changes as the speed of the plane increases.
Based on the sample data provided, we are having trouble seeing how to find the cn and ca using the data provided. I know that I could the “panel method” to find the pressure components of lift and drag, but it is complicated on where to start and I need come clarification on how to get there.
4. For the upcoming week, my goal is to gather accurate data from the wind tunnel and to see whether the flow separates at 6.6 degrees or not. Also, if my group and I could come up with a code for the cl and cd plot, we can then come up with a reasonable cl vs cd plot to see where the plane stalls.
5. While I am curious about the stall angles at different speeds, I have not seen some cool aerodynamics outside of class this week. But I did read an article about how NASA hires Lockheed Martin to build a quiet supersonic x-plane, which is aerodynamically interesting since planes traveling at high speeds are mostly noisy since they create a loud shockwave. I am curious to see how the plane will fly without making a loud noise. The link to the article is here:
https://www.space.com/40187-lockheed-martin-building-quiet-supersonic-jet.html
1 note
·
View note