I have keen interest in learning about technology, I always try to explore new things and I write articles and reviews on newly released products. As a technology blogger from last 6 years, I have earned a huge industry exposure across the domains. I am associated with many companies, I give feedback to the company owners about their product based on research I do. It will help the company to provide better product to the customers. I am even associated with leading technological blogs and website and do a guest posts for them.
Don't wanna be here? Send us removal request.
Text
Roblox Outage Sparks Usage Rise in Rival Mobile Games Minecraft and Among Us
The recent server outage for Roblox from Roblox Corporation coincided with a rise in usage of alternative multiplayer mobile games such as Minecraft from Mojang and Among Us from InnerSloth on Android, an analysis of preliminary Sensor Tower Consumer Intelligence data shows.
Usage Trends
The Roblox outage began on October 28 and lasted until October 31, during which time players were unable to access the game or even visit its website. Comparing the period of full-day outage from October 29 to 31, the average time spent in the app declined by 93 percent week-over-week worldwide. This is due to our panel of installs continuing to show session counts based on attempts to access the app.
Analyzing other popular apps and games during the same period between October 29 to 31, Sensor Tower data shows that Minecraft’s usage increased by 2 percent week-over-week. Among Us, meanwhile, saw time spent climb by 6 percent W/W. Usage in Among Us surged by approximately 12 percent on October 29 compared to the day prior, while Minecraft’s usage climbed by 13 percent D/D on October 30, compared to the day prior.

Twitch also saw an increase in usage, with time spent in the app rising by 8 percent W/W. It should be noted, however, that numerous reasons could be at play for the streaming platform’s growth, including the League of Legends semi-finals over the weekend and Halloween holiday streams from popular channels/streamers.
Session Count
Analyzing the average number of daily sessions players engaged in each day between October 29 to 31, Roblox saw a decline of approximately 33 percent W/W, suggesting players were still hoping to access the game throughout its downtime.
During the same period, average daily sessions for Minecraft and Among Us saw minimal growth W/W. Twitch, however, experienced an increase in average session count of 11 percent W/W.
Among Us Rises
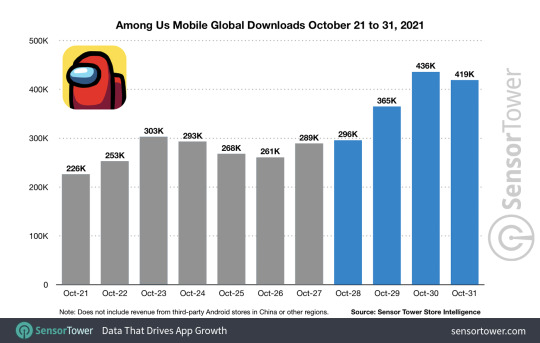
Preliminary Store Intelligence estimates across both the App Store and Google Play showed growth in both downloads and player spending during the Roblox outage. Among Us mobile downloads peaked at approximately 436,000 on October 30, up 19 percent from the day prior and 44 percent W/W. This marked the title’s best day for installs since April 4, 2021. During the same day on October 30, Among Us picked up approximately $12,000, a rise of 1 percent from the day prior and 11 percent W/W. It was the mobile title’s best day for revenue since July 17, 2021.
As with our recent analysis of Facebook’s services outage, as well as causing an inevitable drop in usage with consumers unable to access an app, downtime can also result in users heading elsewhere for entertainment. Whether this recent outage for Roblox will have a long-term impact remains to be seen, though few other apps offer the type of experience the Roblox itself provides.
Sensor Tower’s Store Intelligence platform is an Enterprise level offering. Interested in learning more?

Roblox Outage Sparks Usage Rise in Rival Mobile Games Minecraft and Among Us published first on https://spyadvice.tumblr.com/
0 notes
Text
Parents and caregivers can get on-demand delivery of baby and kid items via the Uber and Uber Eats apps. published first on https://spyadvice.tumblr.com/
0 notes
Text
You can now watch TikToks on your Fire TV. published first on https://spyadvice.tumblr.com/
0 notes
Text
These are the best virtual private networks for protecting your privacy on your Android mobile device. published first on https://spyadvice.tumblr.com/
0 notes
Text
Who says you can't learn and have fun at the same time? published first on https://spyadvice.tumblr.com/
0 notes
Text
The FaceTime feature arrives with the iOS 15.1 upgrade. Meet your new go-to watch party app. published first on https://spyadvice.tumblr.com/
0 notes
Text
This hack helps you save money and still get free two-day shipping. We'll show you how. published first on https://spyadvice.tumblr.com/
0 notes
Text
Can you unravel the mysteries in these Apple Arcade games? published first on https://spyadvice.tumblr.com/
0 notes
Text
The service was previously available only to people who listed English as their primary language. published first on https://spyadvice.tumblr.com/
0 notes
Text
Game Changer: Sensor Tower’s Game Taxonomy Takes Top Spot for Most Thorough Game Coverage
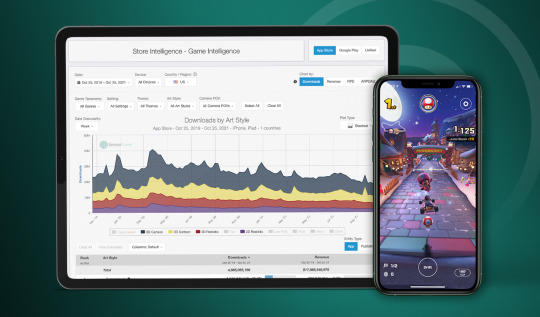
Supercharge your game research with Sensor Tower’s Game Taxonomy, which now–following the recent completion of our historical game coverage project and addition of over 1,300 games in September 2021–offers the most thorough mobile game classification coverage among all global mobile intelligence providers. Game Taxonomy, first introduced in August 2020, spans a variety of well-known genres (Casual, Mid-Core, Sports & Racing, and Casino) and offers a deeper look into a multitude (79 and counting!) of detailed sub-genres. It also includes other tags for game characteristics, such as Setting, Theme, Art Style, IP, and more. Game Taxonomy is crucial to our customers navigating the vast mobile gaming landscape.
“Our game classification has changed the way our gaming customers analyze and research games across M&A, new title development, user acquisition, and countless other initiatives,” according to Chirag Ambwani, VP Gaming at Sensor Tower. “Sensor Tower’s Game Taxonomy has, quite literally, been a game changer.”
Throughout the development of our proprietary taxonomy, we have been committed to building a high-quality dataset that can quickly adapt to the latest trends in mobile gaming. Top performing games are added to Sensor Tower’s dataset weekly, and each title is manually tagged via an in-depth QA process by our team of gaming analysts to ensure each title is accurately categorized.
Let’s take a closer look at where Sensor Tower’s Game Taxonomy stands today and how it has evolved in response to market trends.
Game Taxonomy Coverage & Evolution
As of October 2021, Game Taxonomy offers coverage for approximately 31,000 total apps and 16,000 unique game titles, encompassing the Top 500 games by downloads and revenue (for US App Store & Google Play) each month between 2017 to 2021. 2021 boasts even more coverage, with classifications for the Top 250 games by downloads and revenue for every week.
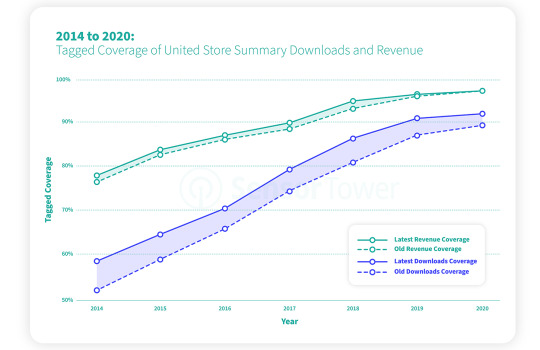
This graph shows our overall coverage of the entire Games category. Discord, the PlayStation app, and other non-playable apps, while included in the Games category, are not tagged by our Taxonomy.
Since it first launched, Game Taxonomy has evolved to include coverage of all Licensed IP games with four valuable IP fields (Licensed IP, IP Operator, Corporate Parent, and Media Type). As game developers continue to explore cross-play opportunities, Sensor Tower’s gaming analysts took on the challenge of adding two additional Game Taxonomy fields for classifying Game Cross-play and Game Ports (ex. PC/Console to Mobile, Brand Extension, etc.). Most recently, Game Taxonomy has expanded to include an additional filter for Apple Arcade games, which can be found with the “Apple Arcade” global field. (Please note that Sensor Tower does not provide download and revenue estimates for Apple Arcade, as they do not chart in store rankings).
What’s Next for Sensor Tower’s Game Taxonomy
Just over a year later since Game Taxonomy was launched, Sensor Tower’s investment into building and maintaining the largest proprietary game classification system has become a critical differentiator in the mobile intelligence space. In the coming months, Sensor Tower’s team aims to further expand the dataset with Monetization classifications. Stay tuned for updates!
Interested in learning more about using Sensor Tower’s Game Taxonomy to power your game research? Request a demo with our sales team.
Game Changer: Sensor Tower’s Game Taxonomy Takes Top Spot for Most Thorough Game Coverage published first on https://spyadvice.tumblr.com/
0 notes
Text
Users of Twitter's subscription service will get experimental features like longer video uploads and pinned conversations. published first on https://spyadvice.tumblr.com/
0 notes
Text
The best iPhone apps have changed the way we communicate, watch TV and play games. published first on https://spyadvice.tumblr.com/
0 notes
Text
The best Android apps of the year include a social media giant, a video editor and a gaming streaming service. published first on https://spyadvice.tumblr.com/
0 notes
Text
Adobe's AI technology selects regions of your photo so you can make detailed edits faster -- and without needing to open the image in Photoshop. published first on https://spyadvice.tumblr.com/
0 notes
Text
European Consumer Spending in Mobile Apps Grew 21% in Q3 2021 to $4.6 Billion

European consumers spent an estimated $4.6 billion across the App Store and Google Play during Q3 2021, Sensor Tower Store Intelligence data shows. This represented an approximately 21 percent year-over-year increase in gross revenue from Q3 2020, based on user spending for in-app purchases, subscriptions, and premium apps. European spending accounted for 13.6 percent of global mobile app revenue in Q3 2021, which exceeded $33.7 billion. For comparison, in Q3 2020, Europe accounted for approximately 13 percent of global consumer spending in mobile apps.
In this report, we delve deeper into mobile non-gaming and gaming apps revenue and download figures, and identify which countries are driving the region’s market forwards.
European Mobile App Revenue and Downloads
The App Store drove the majority of user spending in Europe, generating $2.4 billion in gross revenue in Q3 2021, a Y/Y rise of 20 percent. Google Play revenue, meanwhile, grew by 23.5 percent Y/Y to $2.1 billion.
Overall, the App Store accounted for 53 percent of user spending in Europe during Q3, with Google Play making up the remaining 47 percent.

When it comes to downloads, the App Store and Google Play accumulated a combined 6.4 billion unique installs in Q3, down by 3 percent Y/Y.
As is typically the case globally, Google Play drove a greater number of downloads than the App Store, amassing 4.7 billion installs in Europe in Q3, a decrease of approximately 4 percent Y/Y. The App Store, meanwhile, generated 1.7 billion downloads, with installs growth remaining flat Y/Y.
Google Play accounted for 73.2 percent of all downloads, while the App Store made up 26.8 percent.

Europe’s Top Countries
The European country that drove the most revenue in Q3 2021 was the United Kingdom, generating more than $894 million in user spending last year, up 21.4 percent Y/Y. Germany ranked in No. 2 with $839.4 million, an increase of close to 17 percent, while France ranked No. 3, having accrued close to $489.8 million, up 14.6 percent. Turkey entered the top five revenue-generating countries in Europe last quarter, as user spending rose more than 80 percent to $234.7 million. The big earners driving the Turkish market were PUBG Mobile from Tencent, Garena Free Fire from Garena, and TikTok from ByteDance.
The U.K. represented the largest share of App Store revenue in Europe with $583.5 million, or approximately 24 percent of all user spending on the store. Germany, meanwhile, took the lion’s share of Google Play revenue, generating $454.5 million, or about 21 percent of the total.

The biggest generator of downloads was Russia with 1.4 billion installs in Q3, down approximately 1 percent Y/Y. For comparison, Turkey ranked No. 2 for downloads with more than 819 million installs for the year, a decrease of 6.6 percent, while the U.K. ranked No. 3 with 573 million, down 7.4 percent.
Russia was the largest driver of downloads on Google Play, where it accrued 1.1 billion installs, or 23.8 percent of all downloads on the store in Europe. The U.K., meanwhile, led the way on the App Store with nearly 312.7 million downloads, or 18.2 percent of the total.
Europe’s Top Mobile Apps
Dating app Tinder was the top grossing non-game app in Europe in Q3, generating approximately $105 million in user spending, while Disney+ ranked No. 2 and YouTube ranked No. 3.
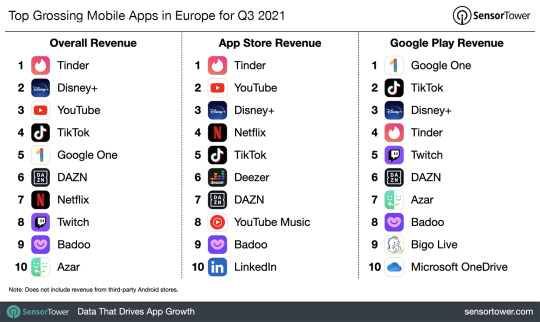
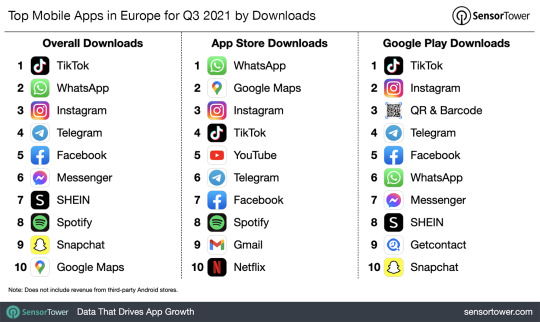
TikTok topped the downloads chart for Europe with 24.2 million installs during Q3. It was followed by Facebook’s WhatsApp at No. 2 and Instagram at No. 3.
European Mobile Game Revenue and Downloads
Mobile games generated $2.8 billion in Europe during Q3, an increase of 16.7 percent Y/Y. In total, gaming accounted for about 60 percent of all mobile app revenue in Europe based on player spending.
While on a global level the App Store generated more game revenue than Google Play, in Europe the opposite was true. Google Play generated $1.6 billion from mobile games in the region during the last quarter, up 14.3 percent Y/Y, while the App Store accumulated close to $1.1 billion from user spending, an increase of 10 percent.
Overall, Google Play represented 58.3 percent of total gaming revenue in Europe, while the App Store accounted for 41.7 percent.
Germany was a key driver for Google Play games revenue, with player spending on the storefront representing more than $366 million. On The App Store, meanwhile, the U.K. ranked No. 1 with $269.7 million in revenue from games.

Combined game downloads across Europe declined by 3.4 percent Y/Y from 2.9 billion in Q3 2020 to 2.8 billion in Q3 2021. Unique installs for Google Play remained flat year-over-year at approximately 2.3 billion, while App Store downloads decreased by 9 percent to 488.4 million. Overall, Google Play accounted for 82.4 percent of total game downloads in Europe last year, while the App Store made up 17.6 percent.

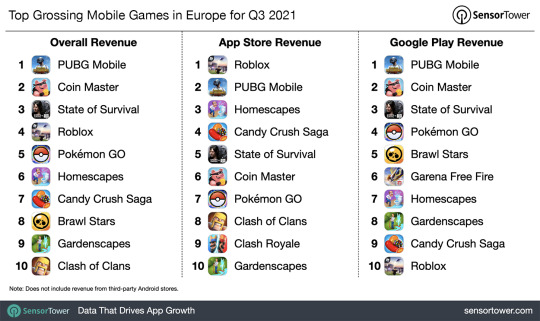
PUBG Mobile ranked as the No. 1 revenue generating mobile game in Europe during Q3, taking in more than $100 million, a rise of 56.7 percent Y/Y. It was followed by Coin Master from Moon Active at No. 2 and State of Survival from FunPlus at No. 3.
Hypercasual hit Count Masters from Tap2Play was the most downloaded mobile title in Europe during Q3, amassing close to 16 million unique installs in Q3. Fidget Toys Trading, also from Tap2Play, ranked No. 2, while My Talking Angela 2 from Outfit7 ranked No. 3. Despite having its official launch as recently as September 22, 2021, Pokémon Unite from The Pokemon Company ranked No. 9.

Europe’s mobile app market largely followed global trends when comparing market performance to Q3 2020 and the more immediate impacts of the COVID-19 pandemic and lockdowns. Downloads have declined Y/Y compared to 2020’s outsized gains, but consumer spending has continued to rise, reflecting new user habits of increased mobile device usage for anything from shopping and fitness to entertainment. Meanwhile, while games continue to account for the largest share of app revenue in Europe at approximately 60 percent, this share has declined from 63.6 percent in Q3 2020. Other categories take up a larger share than at a global level, where games accounted for 66.7 percent of consumer spending in Q3 2021.
Note: The revenue estimates contained in this report are not inclusive of local taxes, in-app advertising, or in-app user spending on mobile commerce, e.g., purchases via the Amazon app, rides via the Uber app, or food deliveries via the GrubHub app. Refunds are also not reflected in the provided figures.
Sensor Tower’s Store Intelligence platform is an Enterprise level offering. Interested in learning more?

European Consumer Spending in Mobile Apps Grew 21% in Q3 2021 to $4.6 Billion published first on https://spyadvice.tumblr.com/
0 notes
Text
Google Pixel 6 Review: Playing Catch-Up With the iPhone
With long battery life and nice cameras, the new Google devices excel at what popular phones have done for years. Is that enough? Google Pixel 6 Review: Playing Catch-Up With the iPhone published first on https://spyadvice.tumblr.com/
0 notes
Text
State of Food Delivery and Restaurant Apps in Europe 2021: Installs Rise 44% Since 2019

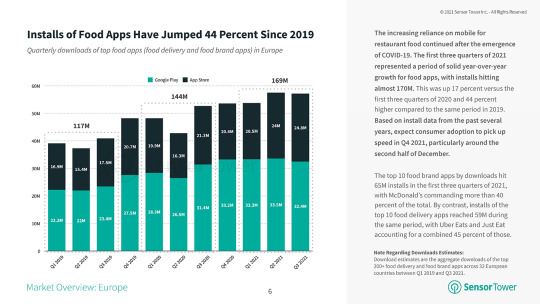
When restaurants closed their doors for in-person dining during the pandemic, consumers relied on mobile-first or online delivery services more than ever before. Our latest report, available now as a free download, shows food app installs hit almost 170 million in Europe in the first three quarters of 2021, climbing 44 percent since the same period in 2019. We analyzed download trends from January 2019 through September 2021 for Food Delivery and Food Brand sub-categories.
Adoption Expected to Pick Up Speed in Q4 2021
In the first three quarters of 2019, European food app installs reached 117 million. By Q3 2020, Google Play and App Store downloads for these apps across Europe surpassed Q4 2019 by 4.5 million. In the first three quarters of 2021, the top 10 food brand apps hit 65 million installs, with McDonald’s commanding over 40 percent of the total. UberEats and Just Eat accounted for a combined 45 percent of the total downloads for the top 10 food delivery apps. Consumers depended on mobile-first food apps since the emergence of COVID-19 and based on install data from the last few years, food app installs are forecasted to surpass 60 million in Q4 2021.
Food Brands Allocated Their Budget Into More Video Ads Amid COVID-19
In the United Kingdom, the top food brand apps saw their investment in Display and Video ads peak in Q3 2020. In the first half of 2020, food brand apps which include McDonald’s, Burger King, KFC, and Domino’s Pizza, invested around 25 percent of their advertising budget to Video and climbed to almost 75 percent in the second half of the year.
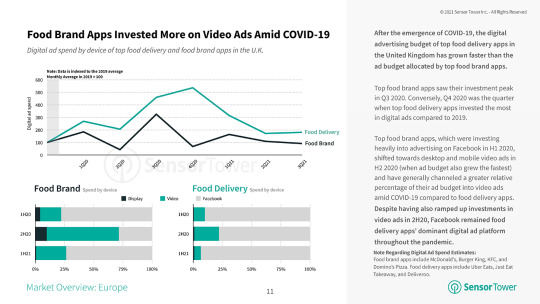
Facebook has been a major device for food delivery apps throughout the pandemic and top food delivery brands including UberEats, Just Eat, and Deliveroo invested over 80 percent of their advertising spend on the platform in the first half of 2021.
McDonald’s Consistently Ranked as the Top Food Brand in Europe
McDonald’s remains in a leading position in most European countries such as Ireland, Spain, and Russia, with average daily downloads peaking at roughly 250,000 in January 2020. In H1 2021, installs for McDonald’s in Russia, Spain, and the U.K. totaled 9 million.
Q1 2021 was the app’s best quarter in terms of growth in all three markets since 2019.

Our forecast predicts downloads of Food Brand and Food Delivery apps will hit 64 million in Q4 2021 and user adoption is expected to accelerate.
Check out the Sensor Tower Store Intelligence platform and Usage Intelligence for more analysis, including key insights on download trends, monthly active users for selected geographies, and more. To view more digital ad spend data, get set up with a Pathmatics demo. Download the complete State of Food Delivery and Restaurant Apps in Europe 2021 report in PDF form below:

State of Food Delivery and Restaurant Apps in Europe 2021: Installs Rise 44% Since 2019 published first on https://spyadvice.tumblr.com/
0 notes