This page was created as an assignment in order to explore a dataset of 521 imprisoned individuals at Eastern State Penitentiary from 1830-1839. Meant for private (Class use) only.
Don't wanna be here? Send us removal request.
Statistics
We looked inside some of the posts by easternadmissions and here's what we found interesting.
Average Info
Notes Per Post
1
Likes Per Post
1
Reblog Per Post
0
Reply Per Post
0
Time Between Posts
40 seconds ago
Number of Posts By Type
Text
11
Last Seen Tumblr Blogs


Fun Fact
Tumblr Inc. is funded by 13 investors.
Text
Introduction
For this project, we have been working with the Eastern State Admission Book (A) dataset. While more on this dataset will be explained below, these data were collected by prison administrators (most likely multiple different people) on incarcerated individuals from the years 1830-1839 -- the first decade of this prison’s operation. We are studying the records of these imprisoned folks in order to explore the legacy of racial bias in America’s criminal justice system. We believed that Easterns State’s status as the world’s first prison of such massive scale and unique ideology -- that would later serve as the model for hundreds of future carceral institutions -- could illuminate the deeper roots of the United States. as a, by and large, carceral state. We hope to exemplify any potential correlations through the following inquiry:
Did racial biases appear in the prison sentences during the early years of America’s criminal justice system? More specifically, how did race/ethnicity relate to sentencing periods (in years) for the same crime? For example, did black and white murderers get sentenced for the same period of time?
0 notes
Text
Data Context

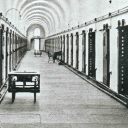
The Eastern State Penitentiary (ESP) is a prison located in Philadelphia, Pennsylvania and operated from 1829-1971. This prison was the first of its kind - a prision, “...designed to inspire penitence, or true regret, in the hearts of prisoners”(Eastern State Penitentiary Historic Site). Given such a mission, ESP refrained from employing corporal punishments. Instead, prison administrators strictly enforced isolation and hard, “honest” labor as a means of promoting incarcerated individuals to reflect on their supposed wrongdoings (Eastern State Penitentiary: America’s Most Historic Prison 2). ESP’s architecture resembled that of a church, with tall arched windows and sparse cells -- only a bed, toilet, and a bible (Ibid.). The ESP was considered one of the most expensive and famous prisons in the world, serving as the blueprint for future carceral institutions worldwide.
Given the context of ESP as an institution, the specific data collected on over 500 imprisoned individuals was especially niche and curated for the mission of the prison. Each inmate had a multitude of demographic, personal, and behavioral information recorded, such as: name, age, ethnicity, religion, occupation, birthplace, sentencing location, offense, sentencing periods, information about literacy, and discharge notes. Further information on these individual’s religious affiliations and practices was also recorded (e.g. “sold himself to the Devil & meant to rush on to hell for revenge -- did not wish to hear of religion”). The categories chosen make sense given the nature of the institution as one that wishes to cultivate true “penitence” -- partly through labor (i.e. the special attention to occupation, perceived religiosity, etc.). Due to spelling and syntax variations in these data, it appears that they were transcribed by hand and by multiple different individuals throughout the prison hierarchy. It is unclear to us exactly who, though it seems reasonable such records were acquired by a mixture of administrators, guards, and even chaplains.
To begin, we thought it essential to provide a bit more background on the data and the means by which it was collected. This is a crucial step in our project for it provides us with details essential for a nuanced analysis of the data visualizations that follow, exploring potential uses of these data in the future, and an acknowledgment of the ethical concerns surrounding the data collection process (see below).
0 notes
Text
Statement on Ethics and Limitations
Before we proceed onto methodology, it must be clearly stated that the collection and organization of this dataset are deeply unethical, even though the data set was a relatively minor part of the larger administrative apparatus of the prison. The notes column also attests to the moralizing that prisoners were subjected to by the prison officials, which must have felt incredibly condescending and degrading. Several aspects of the categorization are deeply racist. White and male prisoners never have their race or gender specified while Black and female prisoners do, effectively making whiteness and maleness into “default” categories. Occasionally the data collectors employed a complicated system of categories to refer to different skin colors (e.g. very light/medium/dark/very dark), while at other times employing racial slurs. With all that said, we have attempted to actively name whiteness, maleness, and edit out offensive terminology.
After careful consideration of the ethical dilemma we have been presented with, we still judged these data to be well-suited for connecting prison sentences to sociological factors such as race (and, admittedly less so, literacy/class). What the data cannot illuminate, however, is the experience of the prisoners themselves since many of the notes are subjective interpretations on part of the staff as opposed to personal anecdotes or journal entries. With the limitations imposed upon us we certainly have no intention of extrapolating our findings so that they may be applied outside of the historical and geographical context in which these data were collected. However we are interested in how the relationships we discover through these data may be compared to what we know (even just casually) about America’s current carceral system.
We are doing this work because we are invested in illuminating the exploitative nature of imprisonment — particularly within the American context — and wish to rehumanize the victims of such exploitation by exposing the injustice of the system under which they suffered. Overall, through an analysis of the relationship between, say, factors such as race, offense, and sentencing periods we hope to tell a story that displays the deeply rooted legacies of racism within the American criminal justice system; and, since we are working not with the experiences of imprisoned peoples, but the perceptions of them on part of people in power, the stories we tell speak less about the individuals incarcerated and instead weave a narrative about the workings of a system that deeply wronged them.
0 notes
Text
Methodology
For the data that we used, we classified certain categories and cleaned them in a manner that we thought would best accommodate future visualizations geared towards our purpose and exploration of this data set. The categories that we altered and cleaned that were used in our visualizations were Ethnicity, Religion, Occupation, Gender, Literacy, Offense, and Sentencing Periods.
For Ethnicity, certain ethnicities were categorized using outdated and possibly offensive. We altered these categories and named them Biracial, Black, White, Irish Presbyterian, and Irish Catholic. In the initial classifications, we dropped the descriptors of ‘light’, ‘dark’, ect. and grouped them into the Biracial category. We recognized that it would be difficult to account and consider the history pertaining to colorism. In doing so, we sacrificed the potential exploration of how colorism affected the experience of those imprisoned at the penitentiary.The initial categories for gender were written as ‘Ethnicity;Gender,’ so we split this into two and kept the original name ‘Gender’. While creating our visualizations decided to exclude the data points where the ethnicity was Irish Presbyterian and Irish Catholic. There were few of these data points and they weren’t represented in many crimes. The crimes that had Irish representation had egregious sentences that were skewing the data.
For blank cells in the two categories listed above, all of the null cells were changed to values of male and white. We made this assumption because the only things that were named in these categories were non-white identies and non-male identies thus, it made intuitive sense that white and male categories were the default. In short, we made an intellectual leap supposing that if their Ethnicity / Gender was not listed, it was assumed to default to white and male identities.
For religion and occupation, all of the null values were filled in as N/A but these categories were not altered in other ways (except in standardizing the spelling which was completed for each category). In regard to literacy, the same thing was completed but we did change it to literate, non-literate, learned in prison, or partially literate to create cohesion and ignored other descriptions in the Literacy column. Blank cells were given N/A values.
Lastly, the Sentencing Period and Offense columns were standardized by spelling and unit measure. For the Sentencing Period column, we changed values initially given in years, months, days, to just months. This was calculated by rounding to the nearest month in terms of days and excluding the exact value for the days.
In the rest of the columns, we decided which ones to keep and which ones to dispose of. We standardized the spellings and parsed the descriptions into key terms in the hopes that we could use common rhetoric in the descriptions to make a visualization / data analysis.
0 notes
Text
Who is Being Imprisoned?

(See Interactive Visualization Here)
To begin exploring the potential relationship between race and incarceration during this period of America’s history as a carceral state, we thought it would be interesting to compare the proportion of nonwhite people of color to white individuals in the population of Pennsylvania as a whole with the prison population. Since these data were collected from the years 1830-1839, we were a bit torn between which census (1830 or 1840) to use. In order to solve this problem, we decided to go with an average of the total population between 1830 and 1840 as we thought this would be the best way to take into account the change in population while staying true to the general demographic makeup of the state of Pennsylvania. Moreover, when comparing racial groups we had to mesh the categories of Black and Biracial into one, as census data marks someone “colored�� even if they are mixed. As we can see the from the figure (1) above, even though white people outnumber nonwhite people by over 1.4 million individuals, nonwhite people make up nearly half of the prison population (here: we must admit that this statement is only true if we assume these data are a representative sample of the prison population) - indicating that people of color are incarcerated at almost exponentially higher rates than their white counterparts. To be more specific: from these data it appears that people of color are imprisoned at a rate that is 24.5 times higher than their white counterparts (again: if we assume these data are a representative sample of the prison population).
A complication that arises with drawing conclusions from this visualization is that census data distinguishes between the free and the enslaved populations (which are not broken down by race). This, of course, makes the specific numbers subject to slight variation. But, given that the enslaved population both in 1830 and 1840 barely reached 500 people, the impact it makes on the total population (in the millions) is statistically and mathematically negligible. While we acknowledge that making a direct comparison is probably not in the cards with the information available (and the way it is categorized) we believe that the general message of the visualization reigns true anyhow.
0 notes
Text
Comparing Sentencing Periods (Based on Race and Offense)

(See Interactive Visualization Here)
With the racial distribution of Pennsylvania's general population and prison population established, we wanted to observe how the sentencing of prisoners was being approached. Figure 2 shows the relationship between race and average sentencing time. Black and Biracial prisoners had a longer sentencing time on average, at 41.987 and 42.758 months, respectively. White prisoners trailed behind an average sentencing time of 37.170 months.
Progressively, Figure 3 shows the relationship between race and sentencing time filtered by various crimes. This combats the problem of offense as a confounding variable in our first visualization, since offenses that are subject to longer/harsher sentencing may be overrepresented in certain races. A longer sentencing time corresponds with darker colors on the scale. Crimes that did not have representation from all three racial groups were excluded to help aid with visual comparison of sentencing trends. Some of these include horse stealing, riot, and perjury. With the exception of 3 of 11 crimes (assault with intent to kill, burglary, and forgery), white prisoners had the shortest sentencing times. Some of the noticeably longer sentencing times are for Black prisoners who committed manslaughter, Biracial prisoners who received stolen goods, and Biracial prisoners who committed robbery. The time periods were 72%, 71%, and 64% longer than the average of the other two races, respectively. From an initial viewing, it may seem like prisoners were allotted similar sentencing times. However, a slight variation in shade can mean the difference of a year or two. For this visualization, we would like its interactivity. A simple scroll over by the viewer can accentuate new patterns.
0 notes
Text
Mortality Rates in Prison

(See Interactive Visualization Here)
Figure 4 shows the percentage of inmates that were discharged. pardoned, or died, sorted according to race. We thought that exploring prisoner mortality -- stratifying by race/ethnicity -- had the potential to reveal racial bias not only prior to an individual’s imprisonment but within the institution of Eastern State Penitentiary itself. While in both cases around 85% were discharged at the end of their sentence, a somewhat higher percentage of Black or biracial people died while in prison (approximately 9%, compared to around 7% for white people). Black or biracial people were also pardoned at a lower rate.
0 notes
Text
What about Class Bias?

(See Interactive Visualization Here)
This visualization attempted to compare literacy levels, sentencing periods (in number of months), and whether or not an inmate was discharged (served out their full sentence) or pardoned (their charges absolved, even if they served their sentence). To clarify, literacy was characterized by whether someone could both/neither read and/nor write, could only read, could read a little, could spell, or whether they acquired some level of literacy in prison. Any description that was “reads” or “reads only” was categorized as “Partially Literate.” Any description that was “reads a little” or “spells a little” was renamed as “Minimally Literate” and then the inability to read or write at all was marked as “Illiterate.” If an individual acquired literacy in prison, that is indicated in a separate category “Learned in Prison.”
We thought that this might give us an idea as to whether sentencing was correlated with class bias. The visualization does not appear to illuminate any noticeably significant differences in sentencing periods between different literacy levels (just a mere couple of months). And even within the discharged category, those who were literate were sentenced for longer periods of time on average. There could be a couple of reasons for this, which are made clearer for us given the context of these data. It appears reasonable to assume that actually the majority of the population was not fully literate during this time. Furthermore, many of the occupations described (shoemaker, forger, etc.) indicate a -- mostly -- comparable level of class (not to mention that class distinctions were probably more stark). We hypothesize that literacy was recorded here more so as a measure related to one’s capacity to engage with religion (i.e. reading the bible). Thus, we envision that this visualization’s main utility is to highlight how incarceration rates and sentencing periods are more strongly correlated with racial biases rather than class or religious biases (at least in this specific American context).
0 notes
Text
Conclusions
Throughout this project, we aimed to explore the legacy of racial bias in the American carceral system. From the visualizations presented it is apparent that there is some sort of relationship between perceived race and sentencing periods -- as well as mortality rates while incarcerated -- in the context of Eastern State Penitentiary. In the first visualization, we learned that the incarcerated population was astoundingly skewed towards nonwhite people when compared to the population of Pennsylvania as a whole. Progressively, with our next two visualizations, the data reveals nonwhite individuals were sentenced for longer durations (measured in months) across the board. Even after stratifying based off of the offense they were imprisoned for (as it could very likely function as a confounding variable) white incarcerated individuals generally received lesser punishments for the same crime; the most stark differences we observe are for the offenses of manslaughter, robbery, and reception of stolen goods -- where Black and Biracial individuals were imprisoned longer. Furthermore, a somewhat higher percentage of Black or biracial people died while in prison while also being pardoned at lower rates.
While it seems clear that there is an obvious racial bias present in this dataset, we must take these findings with a grain of salt. To reiterate, our conclusions are only sound if we assume that we have a representative sample of the prison population. We were also forced to make a few educated guesses on the nature of an individual’s perceived race/ethnicity, and additionally had to reckon with the difficulty of accounting for the enslaved population in the census data we utilized. Overall, we do not think that this project and the resulting analyses should be used for anything other than this class assignment. However, these discoveries undoubtedly mirror what we already know about the workings of the American criminal justice system, and these data -- while tricky and very messy -- stem from a prison which, in many ways, set a precedent for the United States’ future (the world’s even) prison system with regards to mass and scale. In the end, the most important takeaway is that the roots of racism in this country’s prison system run deep. While the nature of incarceration may shift throughout the generations, the bias against nonwhite (specifically Black) Americans remains consistent, unfortunately so. (If you aren’t a prison abolitionist, then what are you doing here?).
0 notes
Text
Further Exploration?
Because of the nature of the project, we were not able to make use of the notes that the prison administrators made about each inmate, which largely focused on their religious beliefs and attitudes. One possible future project would be to analyze these notes to see what they showed about the administrators' view of the role and function of the prison and the criteria for determining its success or failure. One could also analyze the attitudes of the inmates to the administrators' heavy-handed attempts at moral instruction, and the role this religious interrogation itself might have played as a disciplinary tool.
0 notes
Text
Sources
1830s Census
1840s Census
Eastern State Penitentiary: America’s Most Historic Prison
About Eastern State Penitentiary Historic Site
1 note
·
View note