Don't wanna be here? Send us removal request.
Text
Assignment 4: impact of the expasion of cocoa harvested area on CO2 emissions
Plots
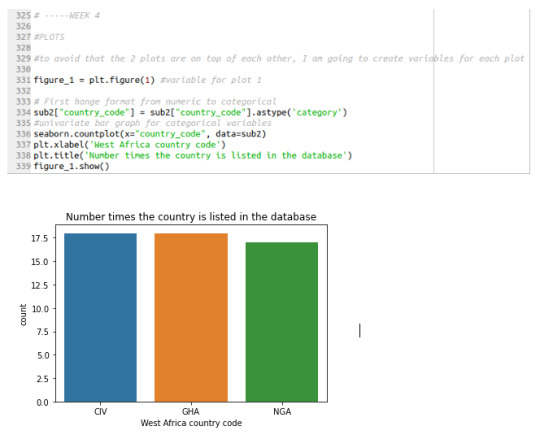
My data set includes data, per country, about CO2 emissions, above ground biomass and cocoa harvested area from 2001 until 2018, meaning that there are 18 values for each variable and, per country (total of 54) . The first plot shows the categorical variable of “country_code”. The graph below, shows the number of times the country is listed in the data set. In there it can be seen that Cote d’ Ivoire and Ghana are listed 18 times each whereas Nigeria is 17. This is because, previously “sub2” was defined as the values that included harvested area>=1000000 and this excludes one of the values for Nigeria, and it also excludes all the values for the other countries that were originally included in the data set (e.g. Liberia). The only other categorical variable I have is “year” and it wouldn’t be interesting to plot it, being the same for each of the 3 countries.
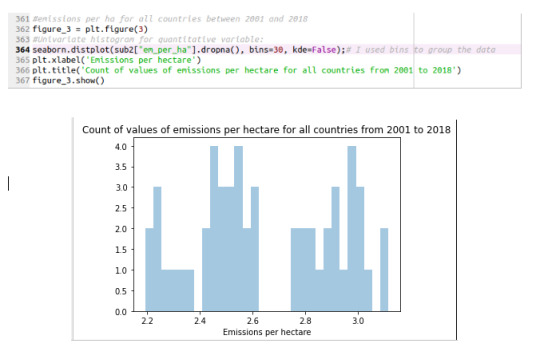
Next, I plotted the quantitative variable of “Emissions per hectare”. For this, I took into account all the emissions between 2001 and 2018 for the 3 countries (CIV, GHA, NGA) and created 30 bins for a better visibility of the distribution of the data. The graph below shows that the distribution is mainly bimodal with values distributed around the modes of approx 2.45 and 2.97 with low variability.
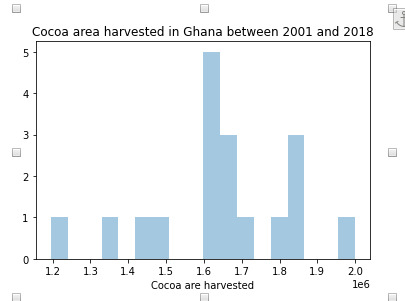
After this, I plotted the “ Cocoa area harvested” in this case, I was only interested in the data from Ghana and I divided the chart in 18 bins for better visualization. The graph shows that the mode is around 1.63 with low variability
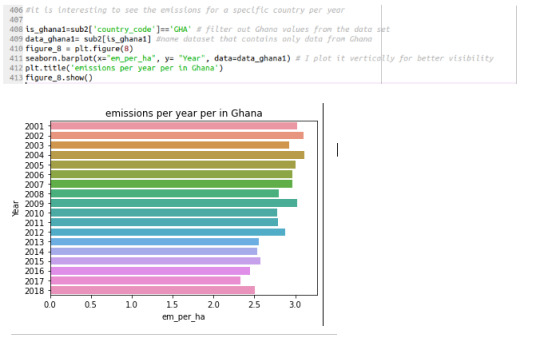
Finally, I also created a plot showing the CO2 emissions for Ghana from 2001 until 2018. For this I used the barplot function instead and set the years in the ‘y’ axis for better visualization. As it can be seen in the graph, the emissions started to follow a downward trend since 2004 from a value of around 3.3 until 2.5 in 2018.
Descriptive statistics
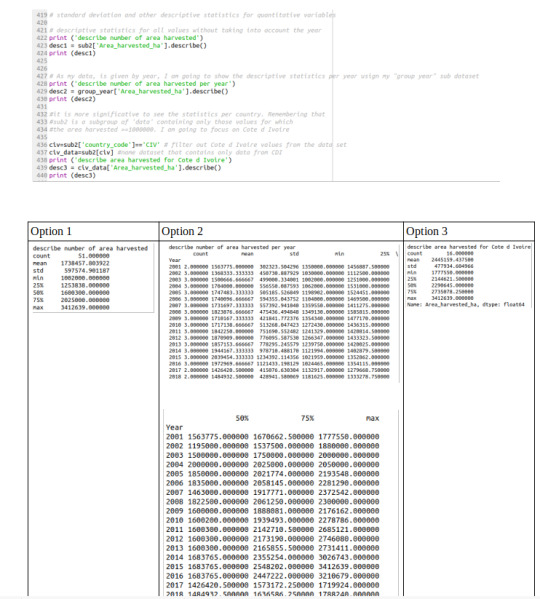
For the descriptive statistics, I considered three options to determine which one described better the variables. In the first alternative, I am describing the area harvested for the 3 countries from 2001 and 2018, this shows that the there are 51 values that in average have a value of 1738457.8 +/-597574.9 with a range of 2410639. In the second alternative, as included in the table below, I calculated the descriptive statistics per year, including the 3 countries. This option could be useful if a year comparison is needed. The table shows that the mean and standard deviation slowly increase every year until 2013 when they start decreasing again. It is also interesting to see that for the highest means in 2015 and 16 the standard deviation is greater. Finally, option 4 shows the statistics for just one country, CDI, between 2001 and 2018, in there the average yearly value is 2445159.4+/- 477934. The SD is a bit high, meaning that values can vary approx 20% every year.
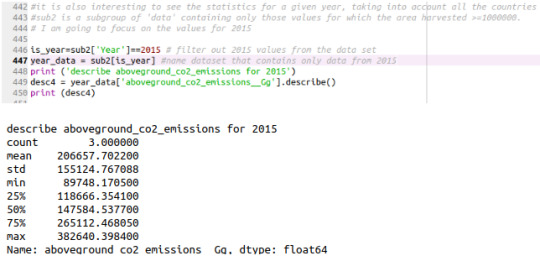
For above ground CO2 emissions, I decided to show the statistics only for 2015, including the 3 countries. The result below shows that there are only 3 values, corresponding to the 3 countries and hence, the standard deviation is large in comparison with the mean.
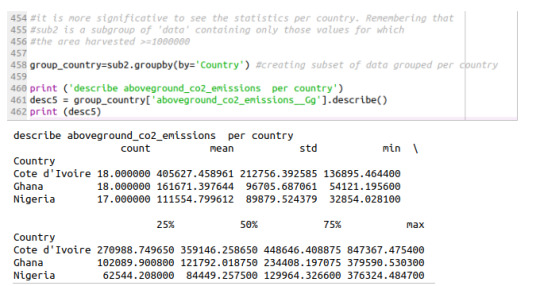
It might be more meaningful to describe the emissions between 2001 and 2018 per country. The results show that Nigeria has a greater standard deviation in comparison with the other countries, being the mean 111554.8 and the SD 89879.5 indicating that the data points spread far from the mean, with a difference of 80%.
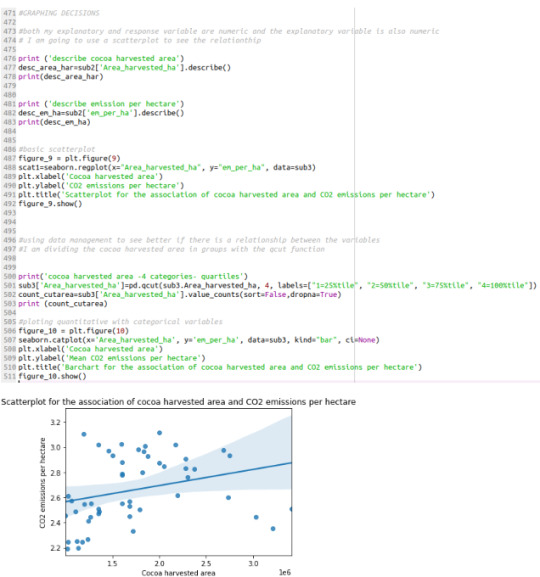
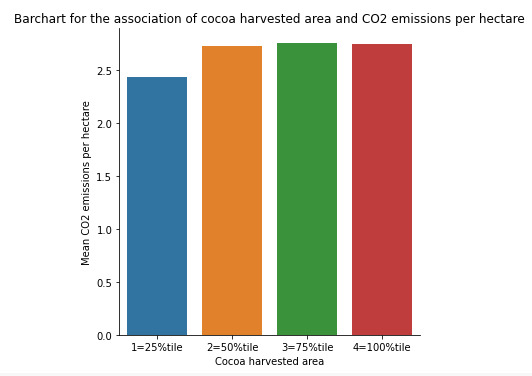
In my research question, I wanted to see the impact of the expansion of the cocoa harvested area on CO2 emissions in West Africa. Until now, I have narrowed down the data to CDI, Ghana and Nigeria. and for a harvested area >=1000000. Both my explanatory and response variable are numeric, therefore, I am using a scatter plot (below). This shows and upward trend meaning that the larger the cocoa harvested area, the greater the CO2 emissions per hectare. However, the points are scattered and not that close to the trend line meaning that the relationship is not that strong. Therefore, I am going to categorize the cocoa harvested area in 4 quartiles to see if I can find a stronger relationship. This confirms a very small upward trend from around 2.4 to 2.9 as shown in the bar plot below
0 notes
Text
Assignment 3: impact of the expansion of cocoa harvested area on CO2 emission

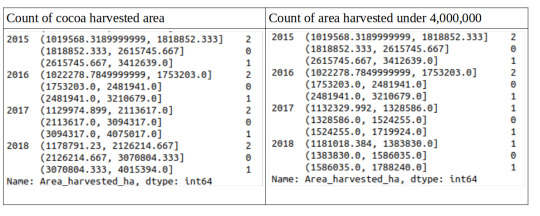
In my data set all the values are complete and correct and thus don't need to alter them, nor do I need to assign dummy values as explained in the lessons. However, for this exercise, I am going replace all the values of harvested area that are equal or higher to 4,000,000 with NaN, because I only want to focus on the lower values. In my data set, I only have 2 values greater than 4,000,000 in 2017 and 2018 for Cote d' Ivoire.
The frequency distributions (below) show that the “Count of area harvested under 4,000,000” in the years 2017 and 2018, only has 2 countries each, one in the lower range and one in the higher. Whereas, the same years for “Count of cocoa harvested area” show 3 countries each. This means that the values of area harvested above 4,000,000 were not taken into account as expected. I have organized the results below in 3 groups per every year of an easier comparison.
Data management 2
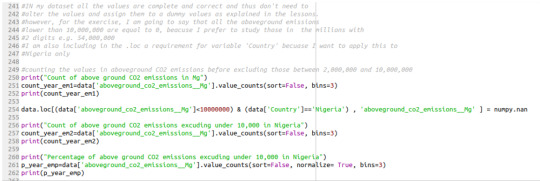
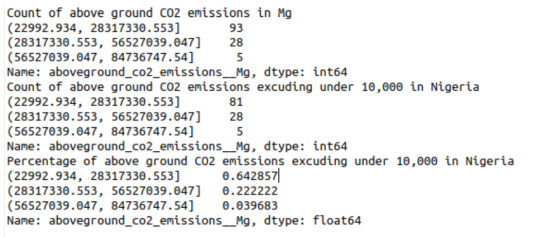
In this case, I am going to say that all the above ground emissions lower than 10,000,000 are equal to 0, because I prefer to study those in the millions with 2 digits e.g. 54,000,000. Furthermore, I am including another condition for the variable 'Country' because I want to apply the above only for Nigeria. The result of the first 2 tables show that there is a difference of 12 between the numbers included in the first group (93 vs 81), while the number of records in the other 2 groups stayed the same. This corresponds to the above ground CO2 emissions in Nigeria that were under 10,000,000 Mg. I have grouped the results in 3 groups, without considering the years, for an easier comparison.
Data management 3

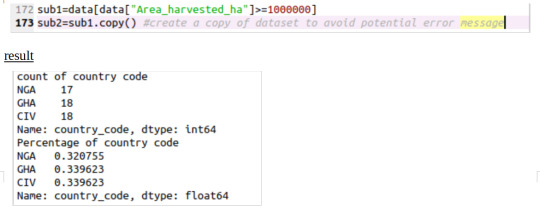
As mentioned in the comments in my code, I am assigning the ISO country codes to the country names, the result (below) shows that there are 17 records for Nigeria, 18 records for Ghana and Cote d’ Ivoire respectability. Nigeria has one less because, previously in my code, (see below) I indicated that sub 2 only included the data for which the harvested area was >=1,000,000 and Nigeria’s harvested area in 2001 was below that.
Creating secondary variables
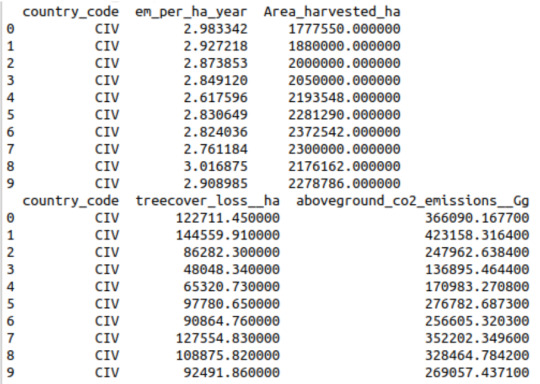
I am interested in knowing the above ground CO2 emissions per hectare per country per year due to tree cover loss. For that, I can divide the above ground CO2 emissions by the number of hectares under tree cover loss, as shown in the code below.

The tables below show the emissions per year per hectare of tree cover loss (em_per_ha_year) in ha per Giga-grams (this is the new variable). It can be seen that those values for the first 10 records are between 2.6 and 3.0
Data management of the new variable

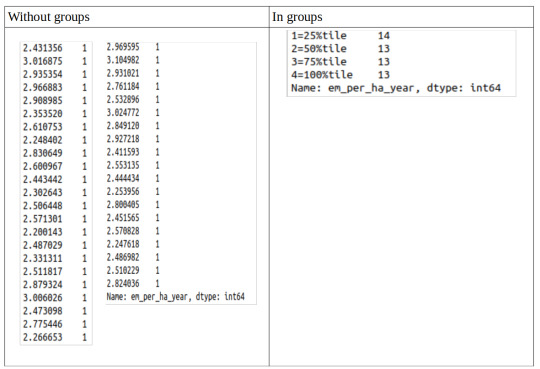
In here, I am dividing the variable in groups. First, I printed the counting without applying any groups and then I printed the counting in groups. It can be seen that in the first case, each value for the new variable is unique and thus, they are all counted one time. When I create a group I see that there are 14 records in the 25%tile and then 13 in each of the other 3 groups.
0 notes
Text
Assingment 2: Impact of the expansion of cocoa harvested area on CO2 emissions
229%
When doing this analysis, I realized that using data from Cote d’Ivoire only was not meaningful enough. Therefore, I decided to expand my data set and included other cocoa producing countries in West Africa, namely Ghana, Guinea, Liberia, Nigeria, Sierra Leone and Togo, a total of 7 countries.
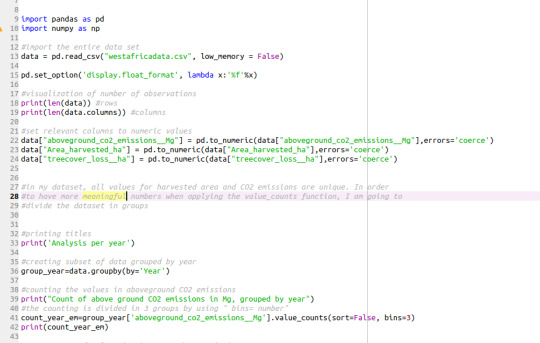
In this expanded data set, all values for cocoa harvested area, tree cover loss and CO2 emissions per country are unique. In order to have more meaningful numbers when applying the “value_counts” function, I have decided to divide my data set in groups.
Option 1: data grouped by year
In this option I wanted to see how the data was distributed for all countries every year. For this, I further divided the data per year in 3 groups. Overall, this grouping gives an interesting overview of how the variables per country are distributed every year.
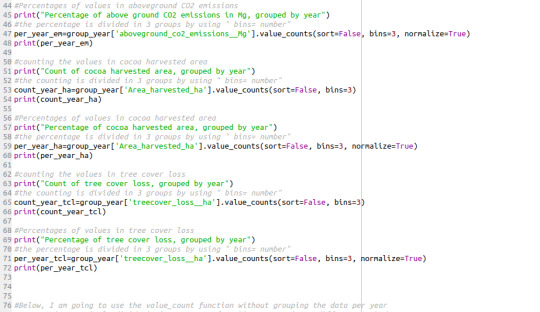
As a result, I obtained tables showing 3 groups per year for my variables (included below).
Count and percentage of CO2 emissions in Mg, grouped per year
For count and percentage of above ground CO2 emissions, in 2001, 5 countries (71.43%) had their CO2 emissions in the first group, with values between 554345.775 and 12596581.877 Mg. The other groups with higher values of CO2 emissions, had one country each, with 14.29% respectively. This means, that in 2001 71.43% of the countries had lower CO2 emissions than the rest. In contrast, in 2018, the distribution was more even, with 2 countries (28.57%) in the first group with emissions between 1219844.647 and 27183614.692 Mg, three countries (42.86%) in the second group and, 2 countries (28.57%) in the third. This variable had the largest change, it increased its value by a factor of 142.4 between 2001 and 2018.

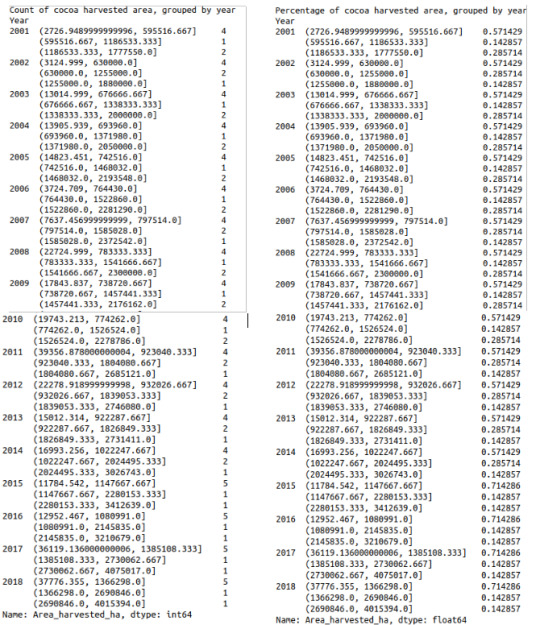
Count and percentage of cocoa harvested area in ha, grouped per year
When comparing 2001 and 2018 for cocoa harvested area, it can be seen that the minimum area increased by almost 14 times, from 2726.95 to 37776.36. In 2001, 57.14% of the countries (4) were grouped in the smaller area category while 28.57% (2) were in the group with the largest cocoa harvested areas. Between 2015 and 2018, 5 of the countries (71.43%) had their cocoa harvested are in the first group, the one with the smallest area and, only 1 country in the other 2 categories, representing 14.29 respectively.
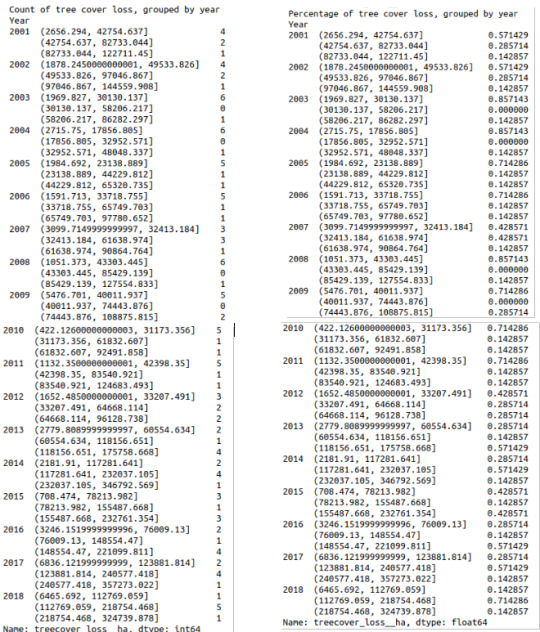
Count and percentage of tree cover loss in ha, grouped per year
In 2018, 5 countries (71.43%) had tree cover loss grouped in the second category going from 112769.059 to 218754.468 ha, the other 2 groups had only one country each. In contrast in 2001 the area under tree cover loss was considerably smaller, with the smallest value of 2656.29 being less than 2.43 times the 2018 lowest value. In that year, 57.14% of the countries had tree cover loss observations located in the first group, meaning that most of the countries had a smaller portions of land under tree cover loss.
Option 2: data divided in 3 groups
After this, I decided to group the data in a different way, not taking into consideration the year. Instead, I decided to simply divide the data set in 3 groups by including “bins” in the “value_counts” function as shown below.
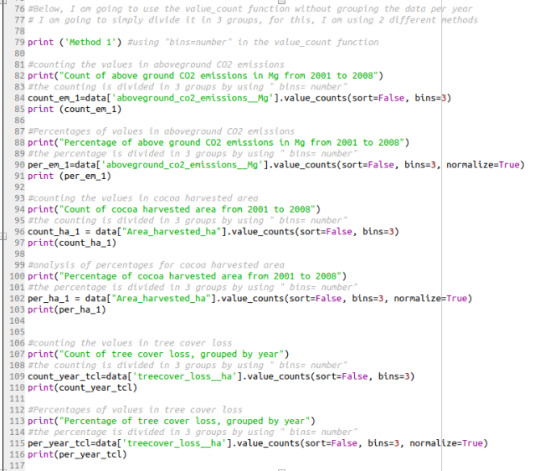
As a result, I obtained the tables below. As it can be seen, 73.8% (93) of the observations for the above ground CO2 emissions for the 7 countries from 2001 until 2018 are concentrated between 2299.932 and 28317330.551 Mg while only 3.96% of the observations are found in the third group. Regarding cocoa harvested area, 73.01% (92) of the observations are found between 429.482 and 1361339 ha whereas only 5.55% are in the third group, with the largest area, going from 2718178 to 4075017 ha. Tree cover loss follows a similar trend with 74.60% (94) of the observations between 157.345 and 119433.744 ha and 2.38% in the third group with the largest tree cover loss values. It should be noted, that there was no missing data in this data set. Overall, if we divide the data set in more sub groups we could see a more detailed stratification of the observations.
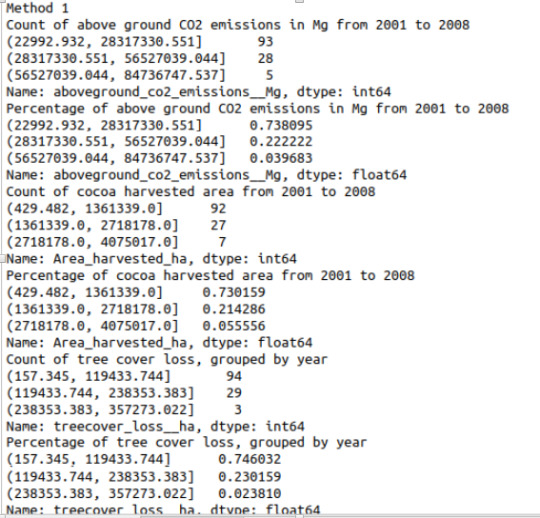
When comparing the 2 options, grouping by country vs. grouping in 3 groups, the first one gives more insight of how the emissions, cocoa harvested area and tree cover loss have changed since 2001 for every country. The second method just puts all the data together without keeping the time dimension.
Refining the research question
For this analysis I wanted to focus only in those countries that had a cocoa harvested area larger than 1,000,000 ha. For this, I created a sub data set using logic functions as shown below.

After this, I ran again the analysis for the counts and percentages of the observations, obtaining the tables included below
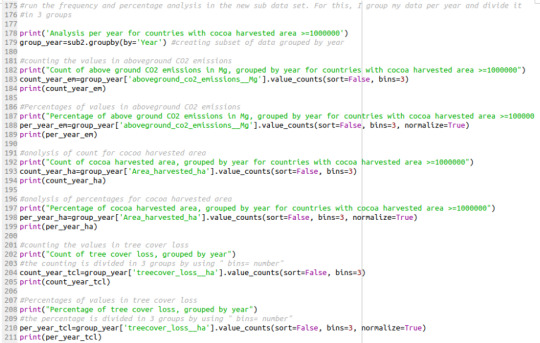
By including only the countries with cocoa harvested area equal or larger than 1000000 ha, the number of countries droped from 7 to 3 including Cote d’Ivoire, Ghana and Nigeria. It should be noted that in 2001 Nigeria had 966000 ha of cocoa harvested area, this explains why in the tables below, the values for 2001 only include 2 countries and not 3 as for the other years.
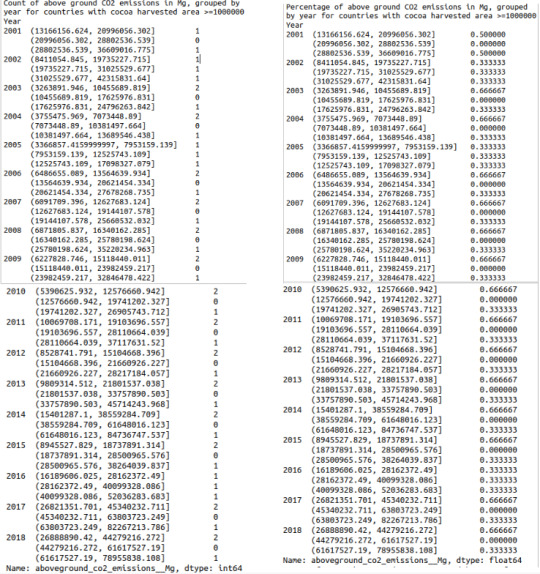
Count and percentage of above ground CO2 emissions in Mg, grouped by year for countries with cocoa harvested area >= 1000000 ha
Overall, there is a trend of increase of the CO2 emissions between 2001 and 2018. Trough the years, the emissions per country are changing constantly between the 3 groups, for instance, in 2002, the emissions per country were equally distributed per group with 33.33% each whereas in 2018, 66.67% of the countries (2) had their emissions grouped in the category with lower emissions and only one country had higher emissions than the rest.
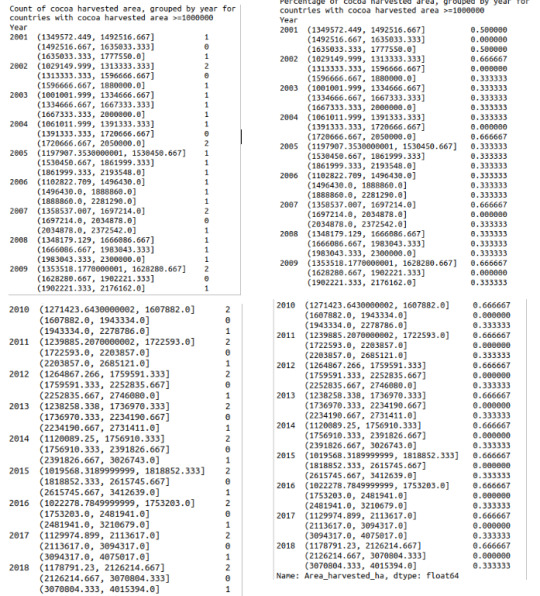
Count and percentage of cocoa harvested area, grouped by year for countries with cocoa harvested area >= 1000000 ha
The cocoa harvested area experienced an upward trend, triplicating between 2001 and 2018. The distribution of countries in each group changed through the years but since 2009 it kept the same percentages, with 66.67% (2) in group 1 and one country in group 3, with the largest area. This could represent that since 2009, the areas has been increasing proportionally in those 3 countries.
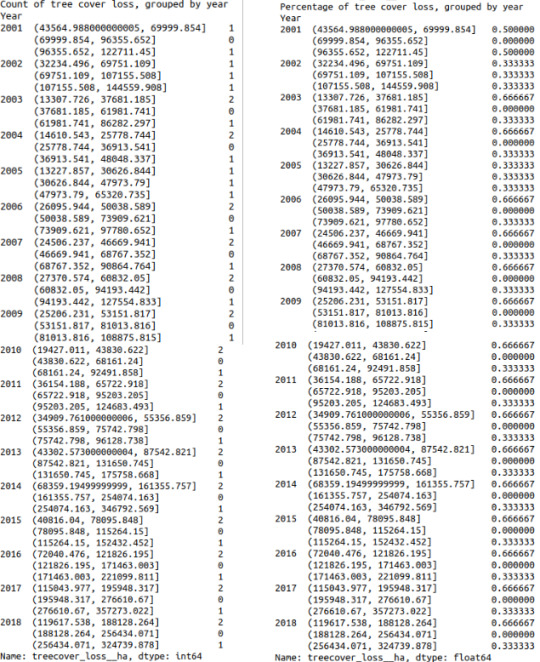
Count and percentage of tree cover loss, grouped by year for countries with cocoa harvested area >= 1000000 ha
Tree cover loss increased between 2001 and 2018 by a factor of 7.45. The distribution of countries between the 3 groups kept the same proportions since 2006 with 2 countries in the first group, none in the second and 1 in the third.
0 notes
Text
Assingment 1: Impact of the expansion of the cocoa harvested area on the CO2 emissions in Côte d’Ivoire between 2001 and 2008
Introduction
The data sets used in this study focus on the CO2 emissions potentially cause by the expansion of the harvested areas for cocoa production in Côte d’Ivoire. Data for harvested cocoa area, comes from the Food Agricultural Organization (FAO) and the data regarding tree cover loss, above ground biomass loss and CO2 emissions comes from the World Resource Institute (WRI) and Global Forest Watch (GFW). GFW, developed by WRI, is an online platform which provides forest monitoring tools and almost real-time data. The maps used in this platform use satellite and remote sensing to display near real-time data about tree cover loss (WRI, n.d.). Before diving deep into the literature review and the variables included in the codebook, it is important to understand the basic concepts included below.
Basic definitions
Forest
Overall there are different definitions of forest and it is often difficult to find a consensus. For instance, FAO (2015) defines forest as “Land spanning more than 0.5 hectares with trees higher than 5 meters and a canopy cover of more than 10 percent, or trees able to reach these thresholds in situ” (p. 3). GFW consider forests as a “landscape with a high density of trees and value for biodiversity, carbon storage, and human use” (GFW, n.d.). GFW datasets may use different types of “forests” (primary, secondary or tree plantations) which are indicated in every analysis (GFW, n.d.).
Tree cover
“Biophysical presence of trees, which may be part of natural forests or tree plantations (…) “tree cover” and “forest” should not be used interchangeably.” (GFW, n.d.). In the dataset used for this study, tree cover is defined as all vegetation with more than 5 meters of height which may include plantations or natural forests across a range of canopy densities (Hansen et al., 2013).
Primary forest
“A primary forest is a forest that has never been logged and has developed following natural disturbances and under natural processes, regardless of its age” (Convention on Biological Diversity, 2006). Goldman & Weisse (2019a) define it as “tropical humid forest, areas of natural, mature forest cover that have not been cleared and regrown in recent history (less than 30-50 years)”. In addition, FAO (2015) indicates that they are “naturally regenerated forest of native species, where there are no clearly visible indications of human activities and the ecological processes are not significantly disturbed” (p. 7). It is important to mention that these ecosystems are crucially important because they have trees that can be even thousands of years old, they are key for sustaining biodiversity and, they store more carbon than other biomes (Goldman & Weisse, 2019b).
Tree cover loss
GFW (n.d.) indicates that tree cover loss refers to “the removal of trees, which may be within natural forests or tree plantations. Accordingly, tree cover loss does not necessarily equate to deforestation and can result from a variety of factors, including mechanical harvesting, fire, disease, or storm damage”. In addition, Goldman and Weisse (2019a) point out that the yearly tree cover loss dataset of the University of Maryland analyses the complete removal of tree cover canopy in 30x30 meter pixels. They further clarify that this does not distinguish between human or natural causes of loss.
Deforestation
Definitions of deforestation depend on the definition assigned to “forest”. For instance, FAO (2015) defines deforestation as “the conversion of forest to other land use or the permanent reduction of the tree canopy cover below the minimum 10 percent threshold” (p. 5). Generally, GFW refers to deforestation as “the removal of a significant number of trees from a landscape, typically in the context of human actions rather than natural events such as fires or disease” (GFW, n.d.). GFW often refers to “gross deforestation[1]” instead of “net deforestation[2]”
Forest degradation
“The reduction of the capacity of a forest to provide goods and services” (FAO 2015, p. 26).
Protected areas
“Areas especially dedicated to the protection and maintenance of biological diversity, and of natural and associated cultural resources, and managed through legal or other effective means” (FAO 2015, p. 15).
Land use change
Land use change is a process where anthropogenic activities alter the natural landscape (Bimal & Harun, 2017). Land use change is one of the main drivers that is globally pressuring the terrestrial biodiversity. Currently, 39% of land has never been changed to human activities, approximately 26.5 million hectares of untouched landscape is converted each year (De Palma et al., 2018).
Above ground biomass
FAO (2015) defines above ground biomass as “all living biomass above the soil including stem, stump, branches, bark, seeds, and foliage” (p. 9). In this study, above ground biomass loss estimates are calculated based on the colocation of above ground live woody biomass density values for the year 2000 from Baccini et al., 2012 with annual tree cover loss data between 2001 and 2018 from Hansen et al., 2013 (Hansen et al., 2013).
[1] the total amount of forest loss (GFW, n.d.)
[2] the total amount of forest loss minus the amount of forest gain (GFW, n.d)
Research question and hypothesis
Research question
Impact of the expansion of cacao harvested area on the CO2 emissions due to above ground biomass loss in Côte d’Ivoire between 2001 and 2018.
Hypothesis
As mentioned in the literature review, included below, the leading cocoa farming system used in Côte d’Ivoire requires the removal of forests and thus, above ground biomass. This is a result of the perceived higher fertility and lower cost of planting cacao in those areas versus reinvestment and improvement of existent farms. This removal causes that the carbon stored in the above ground biomass is released into the atmosphere. It is expected that the expansion of the harvested area dedicated to cocoa production in Côte d’Ivoire, contributed to the increase of the CO2 emissions between 2001 and 2018.
Code book
Tree cover loss: “Hectares of tree cover loss at a national level, between 2001-2018, categorized by percent canopy cover” (Hansen et al., 2013).
Country biomass loss: Metric tons of aboveground biomass loss at a national level, between 2001-2018, categorized by percent canopy cover (Hansen et al., 2013).
Country CO2 emissions: Metric tons of CO2 emissions at a national level as a result of aboveground biomass loss, between 2001-2018, categorized by percent canopy cover (Hansen et al., 2013).
Area harvested: area, in hectares, from which a crop is gathered. Area harvested, therefore, excludes the area from which, although sown or planted, there was no harvest due to damage, failure, etc. (FAO, 2019).
Literature review
Cocoa production in Côte d’Ivoire
Cocoa (Theobroma cacao) is a tropical tree valuable for its beans which are used to produce the main ingredients of chocolate i.e. cacao liquor and butter. Through history, cacao production has been associated with Latin America, nevertheless, Africa is now the main producer (Kroeger et al., 2017 and Harris, Payne and Mann, 2015). It is estimated that West Africa is responsible for 70% of the world production (Wessel & Quist-Wessel, 2015), with Côte d’Ivoire at the lead (Kroeger et al., 2017). After its independence in 1960, Côte d’Ivoire became the leading world cocoa producer, it almost quadrupled its harvest from 5550,000 tons per year in 1980 to more than 2 million tons in 2018, an increase average of 3.5% per year (Wessel & Quist-Wessel, 2015).
Cocoa production in Côte d’Ivoire represents 14% of the country’s GDP and it employs more than 5 million small producers located mostly in the southern part of the country, one fifth of the Ivorian population (World Bank Group, 2019). Currently, the country accounts for approximately 40% of the world’s cocoa production (World Bank Group, 2019).
Expansion of cocoa harvested area and deforestation in Côte d’Ivoire
Côte d’Ivoire forms part of the West African Guinean rain forest (GRF), an ecosystem considered a global biodiversity hotspot (Bitty et al., 2015), nevertheless, at the start of the twenty first century, its area was reduced to 18% of the original, being 113,000 km2 (Gockowski & Sonwa, 2010). In large regions of the humid tropics, agricultural expansions led by smallholders is the main cause of deforestation (Norris et al., 2010). For instance, in the GRF region, where cocoa production is the most common land use system, the conversion of land for the expansion of the harvested area increased 3.3% annually between 1988 and 2007, resulting in the deforestation and forest degradation of approximately 2.3. million ha in the GRF (Gockowski & Sonwa., 2010). As matter of fact, cocoa is considered as one of the main drivers for the loss of West Africa’s humid forest coverage during the last decades, with the largest negative impact in Côte d’Ivoire and Ghana (De Beule, Jassogne & van Asten, 2014).
Smallholders are the main growers of cocoa in West Africa, tradition dictates that cocoa is planted randomly under thinned forest shade (Wessel & Quist-Wessel, 2015). In most cases, this implies slash and burn practices, removal of stumps by burning and traditional logging (Monnerat & Tchatchou, 2014). At the beginning of this process, forests look healthy from above, however, after a couple of years, cacao plantations completely replace the original vegetation (Barima et al., 2016). Farmers perceive this system as more advantageous than replanting old farms (Ruf & Schroth 2003 and De Beule, Jassogne & van Asten, 2014) because cocoa profits from the fertility of the forest soil and the shade provided by the remaining vegetation. This explains why approximately 6 million hectares of the forest in West Africa are planted with cocoa (Wessel & Quist-Wessel, 2015).
It should be noted that the average yield in the region has remained low as a result of poor farming practices, aging farmers and low productivity (Kroeger et al., 2017 and Wessel & Quist-Wessel, 2015). Consequently, and in order to increase production, farmers have expanded the cocoa harvested area into forested areas, resulting in further pressure in the remaining protected areas and forests (Kroeger et al., 2017).
In the case of Côte d’Ivoire, cocoa farms are increasingly found inside protected areas and forest reserves (Norris et al., 2010 and Ross 2014). Agricultural extension services in the country have traditionally supported full-sun systems for the increase of short-term yield (N’Goran, 1998). In addition, full forest clearance was also encouraged (Ruf & Zadi, 1998). Therefore, cocoa farming is the main driver of deforestation inside the country’s protected areas (Bitty et al., 2015). Côte d’Ivoire quadrupled its cocoa production between 1980 and 2018. This extension of harvested areas led to the sharp shrinking of the forest cover in the country which went from 12 million hectares in 1960 to less than 3 million hectares in 2019 (World Bank Group, 2019). This has a direct impact on the above ground biomass, the larger the deforestation, the larger the destruction of the above ground biomass.
The extent of degradation due to cocoa farming in Côte d’Ivoire varies, in some protected areas, it is lower than 10% but, in others, cocoa plantations have completely overtaken the protected areas. Overall, 7 of the 23 protected areas in the country are mostly producing cocoa (Bitty et al., 2015). According to the director of the government’s Forest Reserve Protection Agency (SODEFOR) 40% of the cocoa produced in the country comes from protected areas (Ficou, 2017). These nominally protected forest reserves and national parks, where production is illegal, are at risk of being converted to agricultural land, as matter of fact, not much primary forest remains in the south-central part of the country and the remnants are largely fragmented (Bitty et al., 2015).
While deforestation has extended across the country, cacao yields have declined exerting further pressure in the remaining forests (Dumont et al., 2014). In the period 1990-2011, cocoa plantation areas expanded from 1.6 to 2.5 million, an average of 69,093 hectares per year. This represents that approximately 60-97% of cocoa plantations are set up in forests range across the country (Kroeger et al., 2017). Côte d’Ivoire is the country with the highest deforestation rates in Africa (World Bank Group 2019). Less than 11% of the country remains forested with less than 4% densely forested[1] (Higonnet, Bellantonio and Hurowitz, 2017). As matter of fact, in the next decade alone, the expansion of cacao production could cause the loss of 17600 to 39500 hectares (De Beule, Jassogne and van Asten, 2014). In 2018, despite the increasing number of zero-deforestation commitments in the precedent years, the destruction of primary forest surpassed historical levels, with an increase of 26% when compared against 2017 (Weiss and Goldman 2019b).
[1] These numbers are based on the government’s own maps, BNETD, EtcTerra, RONGEAD, ONU-REDD (FAO/PNUD/PNUE). Government report available: https://www.nitidae.org/files/b24e760c/161216081210_161214_analyse_facteurs_def_deg_ci_rapport_final.pdf
Above ground biomass and CO2 emissions
While tropical forests only cover about 10% of the planet’s surface, they play a key role given that they store and process enormous quantities of carbon; around 6 times the amount humans release into the atmosphere due to fossil fuels (Malhi & Grace, 2000). This is precisely the case of tropical forest in Africa, which function as a carbon sink (Lewis et al., 2009). Small changes in these biomes could lead to major global impacts on the biodiversity and the climate (Lewis, 2006) and, it could turn them into major CO2 emitters (Baccini et al., 2012). Despite this, deforestation to expand farming land has been a main driver of the loss of tropical ecosystems (Seufert, Ramankutty and Foley, 2012). Worldwide, this land use change has contributed to approximately 10% of the global CO2 emissions during the first decade of the 21st century (Le Quéré et al., 2013).
When forests are cut down, the carbon stored below and above ground i.e. in branches, leaves, etc., is liberated to the atmosphere. Carbon emissions from forests are usually difficult to calculate (Baccini et al., 2012). There have been numerous efforts to quantify the carbon storage in aboveground biomass, and the numbers are often uncertain which complicates the calculation of terrestrial carbon emissions (Grassi et al., 2008). These estimations require data about the area lost and the carbon that was stored in that land (Gibbs et al., 2007 and Houghton, 2005), none of which are easy to calculate (Ramankutty, 2007).
More recently, technology developments have made this analysis more feasible. For instance, remote sensing has allowed to calculate the greenhouse gas emissions per hectare as the changes in the carbon stored in the aboveground biomass, before and after the clearing of a specific location (Harris, 2015). In addition, Hansen et al., (2015) mapped the extent of the global tree cover, its losses and gains between 2000 and 2012. Furthermore, there are other studies, focused more on field analysis in smaller locations, that have managed to compare the aboveground carbon stored in different production systems. For instance, Jadán et al., (2015) conducted a study in the Ecuadorian Amazon where they found that in primary forest the stored aboveground carbon was between 4 and 36 times greater than in cocoa monocultures and cocoa agroforestry systems.
This study is going to precisely use data resulting from remote sensing analysis, done by GFW. The calculation of CO2 emissions of above ground biomass, per year will be combined with data of cocoa harvested area, per year, reported by the Ivoirian government to FAO.
References
Baccini, A. & Goetz, S., Walker, W., Laporte, N., Sun, M., Sulla-Menashe, D., Hackler, J., Beck, P., Dubayah, R., Friedl, M., Samanta, S., Houghton, R. (2012). Estimated Carbon Dioxide Emissions from Tropical Deforestation Improved by Carbon-density Maps. Nature Climate Change, 2, 182-185. https://doi.org/10.1038/nclimate1354
Barima, Y., Kouakou, A., Bamba, I., Sange, Ch., Godron, M., Andrieu, J., Bogaert, J. (2016). Cocoa crops are destroying the forest reserves of the classified forest of Haut-Sassandra (Ivory Coast). Global Ecology and Conservation, 8, 85-98. https://doi.org/10.1016/j.gecco.2016.08.009
Bimal, P. & Harun, R. (2017). Land Use Change and Coastal Management. In Bimal, P. & Harun, R. Climatic Hazards in Coastal Bangladesh (pp. 183-207). Cambrindge, United States: Elsevier
Bitty, E. A., Bi, S. G., Bene, J.-C. K., Kouassi, P. K., & McGraw, W. S. (2015). Cocoa Farming and Primate Extirpation Inside Cote D’ivoire’s Protected Areas. Tropical Conservation Science, 95–113. https://doi.org/10.1177/194008291500800110
Convention on Biological Diversity (2006). Definitions. Retrieved May 3, 2020 from https://www.cbd.int/forest/definitions.shtml
De Beule, H., Jassogne, L., and van Asten, P. (2014) Cocoa: Driver of Deforestation in the Democratic Republic of the Congo? GIAR Research Program on Climate Change, Agriculture and Food Security (CCAFS) Working Paper no. 65. Available at http://www.cocoaconnect.org/sites/default/files/publication/Cocoa%20Driver%20of%20deforestation%20in%20the%20DRC.pdf
De Palma, A., Sanchez-Ortiz, K, Martin, P., Chadwick, A. Gilbert, G. Bates, A., Börger, L., Contu, S. Hill, S. and Purvis, A. (2018). Challenges with Inferring How Land-Use Affects Terrestrial Biodiversity: Study Design, Time, Space and Synthesis. In Boha, D.A., Dumbrell, A.J., Woodward, G. Jackson, M. (Ed.) Advances in Ecological Research (pp 163-199). InTech. doi: 10.1016/bs.aecr.2017.12.004
Dumont, E.S., Gnahoua, G.M., Ohouo, L., Sinclair, F.L., Vaast, P. (2014). Farmers in Cote di”ivoire value integrating tree diversity in cocoa for the provision of ecosystem services. Agroforest Systems, 88, 1047-1066. https://doi.org/10.1007/s10457-014-9679-4
Ficou, M. (2017). Le cacao et la forêt Ivorienne. Retrieved from http://www.sodefor.ci/index.php/79-articles-sodefor/106-le-cacao-et-la-foret-ivoirienne
Food Agricultural Organization (FAO). FRA 2015. Terms and definitions. 2015 (Forest Resource Assessment Working Paper 180). Retrieved from http://www.fao.org/3/ap862e/ap862e00.pdf
Food Agricultural Organization (FAO). (2019). Crop. Retrieved May 3, 2020 from http://www.fao.org/faostat/en/#data/QC
Gibbs, H., Brown, S., Niles, J., Foley, J. (2007) Monitoring and estimating tropical forest carbon stocks: Making REDD a reality. Environmental Research Letter, 2,4, 045023. doi 10.1088/1748-9326/2/4/045023
Global Forest Watch (n.d.) How does GFW define key terms. Retrieved May 3, 2020 from https://www.globalforestwatch.org/howto/faqs/faq-how-does-gfw-define-key-terms.html
Gockowski, J. & Sonwa, D. (2010). Cocoa Intensification Scenarios and Their Predicted Impact on CO2 Emissions, Biodiversity Conservation, and Rural Livelihoods in the Guinea Rain Forest of West Africa. Environmental management, 48(2), 307-321. doi 10.1007/s00267-010-9602-3.
Goldman, E. and Weisse, M. (2019). The world lost a Belgium-sized area of primary rainforest last year. World Resource Institute (WRI) Blog. https://www.wri.org/blog/2019/04/world-lost-belgium-sized-area-primary-rainforests-last-year
Goldman, E. and Weisse, M. (2019). Technical blog: Global Forest Watch’s 2018 Data update explained. Global Forest Watch. https://blog.globalforestwatch.org/data-and-research/technical-blog:-global-forest-watch's-2018-data-update-explained
Grassi, G., Monni, S., Federici, S., Achard, F. & Mollicone, D. (2008). Applying the conservativeness principle to REDD to deal with the uncertainties of the estimates. Environmental Research Letters, 3,3, 035005. doi 10.1088/1748-9326/3/3/035005
Hansen, M.C., Potapov, P.V., Moore, R., Hancher, M., Turubanova, S.A., Tyukavina, A., Thau, D., Stehman, V., Goetz, S.J., Loveland, T.R., Kommareddy, A., Egorov, A., Chini, L., Justice, C.O., Townshend, J.R. (2013). High-Resolution Global Maps of 21st-Century Forest Cover Change. Science 342(6160), 850-853. doi 10.1126/science.1244693
Harris, N. (2015). Technical Note. How much rainforest is in that chocolate bar?. World Resource Institute, Washington, DC. Available at https://wriorg.s3.amazonaws.com/s3fs-public/wri15_TECH_United_Cacao.pdf [Verified 27 April 2020]
Harris, N., Payne, O. and Mann, S. (2015). How much rainforest is in that chocolate bar?. World Resource Institute (WRI) Blog. https://www.wri.org/blog/2015/08/how-much-rainforest-chocolate-bar
Higonnet, E., Bellantonio, M. and Hurowitz, G. (2017) Chocolate’s dark secret. How the cocoa industry destroys national parks. Available at https://www.mightyearth.org/wp-content/uploads/2017/09/chocolates_dark_secret_english_web.pdf [Verified 27 April 2020]
Houghton, R. (2005) Aboveground forest biomass and the global carbon balance. Global Change Biology, 11(6), 945–958. https://doi.org/10.1111/j.1365-2486.2005.00955.x
Jadán, O., Cifuentes, M., Torres, B., Selesi, D., Veintimilla, D., Günter, S. (2015). Influence of tree cover on diversity, carbon sequestration and productivity of cocoa systems in the Ecuadorian Amazon. Bois et Forets des Tropiques. 3(325), 35-47. doi 10.19182/bft2015.325.a31271
Kroeger, A., Bakhtary, H., Haupt, F., Streck, Ch. (2017). Eliminating Deforestation from the Cocoa Supply Chain. World Bank, Washington, DC. © World Bank. https://openknowledge.worldbank.org/handle/10986/26549 License: CC BY 3.0 IGO.
Le Quéré C., Peters G., Andres R., Andrew R., Boden T., Ciais P. et al., (2013). Global carbon budget 2013. Earth System Science Data, 6(1), 689-760. https://doi.org/10.5194/essd-6-235-2014
Lewis, S. L. (2006). Tropical forests and the changing Earth system. Philosophical Transactions of The Royal Society B Biological Sciences, 361(1465), 195-210. doi 10.1098/rstb.2005.1711
Lewis, S., Lopez-Gonzalez, G., Sonké, B., Affum-Baffoe, K., Baker, T., Ojo, L., Phillips, O., Reitsma, J., White, L., Comiskey, J., Djuikouo, M., Ewango, C., Feldpausch, T., Hamilton, A., Gloor, M., Hart, T., Hladik, A., Lloyd, J., Lovett, J and Wöll, H. (2009). Increasing Carbon Storage in Intact African Tropical Forests. Nature, 457, 1003-1006. https://doi.org/10.1038/nature07771
Malhi, Y. & Grace, J. (2000). Tropical forests and atmospheric carbon dioxide. Trends in Ecology and Evolution, 15(8), 332-337. https://doi.org/10.1016/S0169-5347(00)01906-6
Monnerat, M., Tchatchou, B. (2014). Foresterie urbaine et agroforesterie pour l'adaptation et l'atténuation à Lukolela COBAM Brief Bogor, Indonesia: Center for International Forestry Research (CIFOR). http://dx.doi.org/10.17528/cifor/005065
N’Goran, K., (1998). Reflections on a durable cacao production: the situation in the Ivory Coast, Africa. Paper presented at a workshop held in Panama, 3/30-4/2, 1998. Smithsonian Institution, Washington, D.C.
Norris, K., Asase, A., Collen, B., Gockowski, J., Mason, J., Phalan, B., Wade, A. (2010) Biodiversity in a forest-agricultural mosaic—the changing face of West African rainforests. Biological Conservation, 143(10), 2341–2350. https://doi.org/10.1016/j.biocon.2009.12.032
Ramankutty, N., Gibbs, H., Frédéric, A., Defries, R., Foley, J., Houghton, R. (2007). Challenges to estimating carbon emissions from tropical deforestation. Global Change Biology, 13(1), 51-66. https://doi.org/10.1111/j.1365-2486.2006.01272.x
Ross, C. (2014). The plantation paradigm: colonial agronomy, African farmers, and the global cocoa boom, 1870s-1940s. Journal of Global History, 9, 49-71. https://doi.org/10.1017/S1740022813000491
Ruf, F. and Schroth, G. (2003). Chocolate Forests and Monocultures: A Historical Review of Cocoa Growing and Its Conflicting Role in Tropical Deforestation and Forest Conservation. In Schroth, G., Gustavo, A., Fonseca, B., Harvery, C.A., Gascon, C., Vasconcelos, H., Izac, A-M (Ed.) Agroforestry and Biodiversity Conservation in Tropical Landscapes (pp. 107-134). ISBN 1-55963-357-3
Ruf, F., Zadi, H. (1998) Cocoa: from deforestation to reforestation. Paper from workshop on Shade Grown Cocoa held in Panama, 3/30-4/2, 1998. Smithsonian institution, Washington D.C.
Seufert, V., Ramankutty, N., Foley, J.A. (2012). Comparing the yields of organic and conventional agriculture. Nature, 485, 229-232. https://doi.org/10.1038/nature11069
Wessel, M. & Quist-Wessel, F. (2015). Cocoa production in West Africa, a review and analysis of recent developments. NJAS - Wageningen Journal of Life Sciences, 74, 1-7. https://doi.org/10.1016/j.njas.2015.09.001
World Bank Group (2019) Situation économique en Côte d’Ivoire: au pays du cacao comment transformer la Côte d’Ivoire (Report No. 9). Retrieved from http://documents.worldbank.org/curated/en/277191561741906355/pdf/Cote-dIvoire-Economic-Update.pdf
World Resource Institute (WRI). (n.d.). Global Forest Watch. Retrieved May 3, 2020 from https://www.wri.org/resources/websites/global-forest-watch
1 note
·
View note