Don't wanna be here? Send us removal request.
Text
Assignment 4
In my study, I aimed to examine if there is any relationship between Urbanization rate “ as dependent variable” and both breast cancer rates and life expectancy “ each as independent variable”. My hypothesis is that there is a positive association with the two explanatory variables.
Firtly, I created graphs for each of the three variables according to the division that I did in the previous assignments, so I have four ranges for each of the variables. Regarding the first variable: Urban Rate, I divided the total into groups <=25%, >25 & <=50, >50 & <=75, and >75, then I conducted a bar chart for its frequency:

Regarding the second variable: Breast Cancer, I also divided the total into groups <=25%, >25 & <=50, >50 & <=75, and >75, then I conducted a bar chart for its frequency:

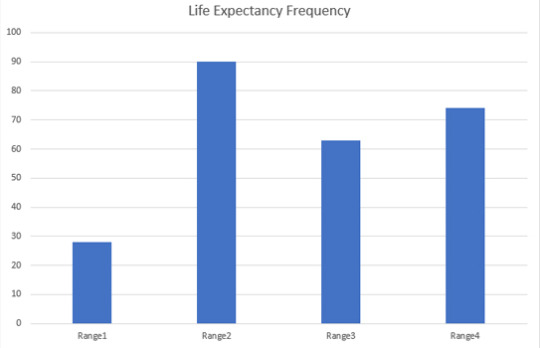
Regarding the third variable: Life Expectancy, I divided the total into groups after finding the max and min values and dividing the range by 4 and I got the following frequencies :

then I conducted a bar chart for its frequency:

However, after conducting the scatter plot for the association of urban rate with both of the other variables, the results are contrasted with my hypothesis!

as shown in the two scatter plots, there is no association between urbanization with neither breast cancer nor life expectancy. These results are contrasted with the literature that I read and with what I expected at the beginning of my study.
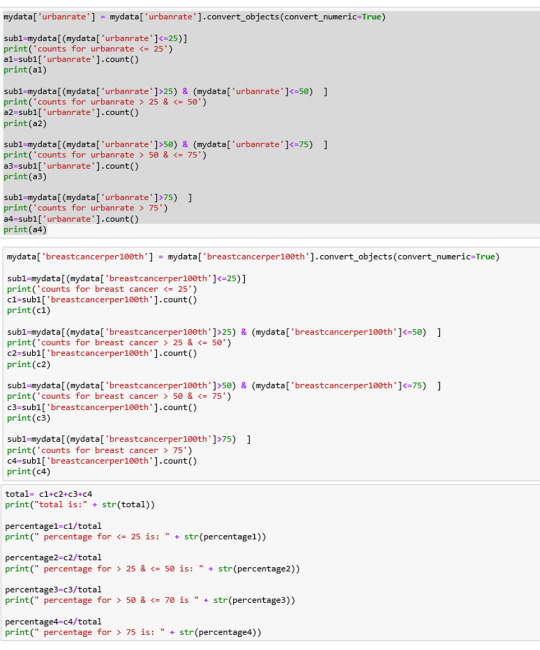
Below I will show a sample of the codes that I used for breastcancer variable , the other variable are coded just the same.

0 notes
Text
Urbanrate, Breastcancer & Lifeexpectency
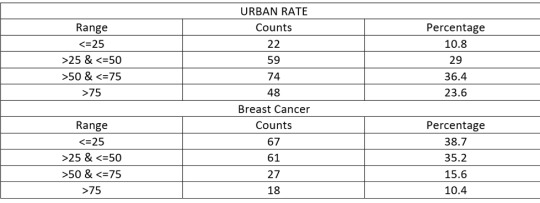
To manage my data, I considered the nature of the data set I am working with. Gapminder data set includes numeric data, which means that each country “observation” has different values. This might be problematic and not understandable when conducting the frequencies. Therefore, I have created ranges for the values and converted each variable into string . And I got the following:

The information in the above table show that most of the countries have urbanization rate between 50% and 75%. While only around 10% of the countries have less than 25% urbanization. Also, the table shows that the majority of the countries have breast cancer percentage less than or equal to 25%.
Regarding life expectancy , I found the range “ the difference between the maximum and mininmum values, then, I divided it into 4 categories:
Range 1 : <=56.69
Range 2 : >56.69 and <=65.594
Range 3 : >65.594 and <=74.494
Range 4 : >74.494
And found the following:

The table show that most of the countries have expected life age the belong to the second range “ between 56 and 65


0 notes
Text
Updated Assignment 2
Continuing with my study on gapminder data set “ the association between the urban rate, breast cancer and life expectancy”.
First, I wrote the code to get the number of variables” columns” and countries “ rows”. I got , as shown below, 213 rows “ countries” and 16 columns “ variables”. Now, as I am considering only three of these 16 variables, I started to conduct frequencies “ counts and percentages “ of those chosen variables.
The data in gapminder file are numeric, which means, each respondent “ country” has its own numbers. Therefore, I divided these data into ranges.
1- Urban rate: I divided the data into four ranges. The frequencies are as follows:
<=25 | 22
>25 & <=50 | 59
>50 & <=75 | 74
>75 | 48
In order to get the percentages, I counted the total of urban rate “ so any missed data are not counted”. Getting the total of 203. Then, I found the percentages as follows:
<=25 | 10.83%
>25 & <=50 | 29.06%
>50 & <=75 | 36.45%
>75 | 23.64%
2- Breast cancer: following the same as done with urban rate. The frequencies are as follows:
<=25 | 67
>25 & <=50 | 61
>50 & <=75 | 27
>75 | 18
Then, I counted the total of breast cancer responses. Getting the total of 173. Then, I found the percentages as follows:
<=25 | 10.83%
>25 & <=50 | 29.06%
>50 & <=75 | 36.45%
>75 | 23.64%
3- Life expectancy: it is somehow different with life expectancy as the values are not from 0 to 100. In this case, I looked for the minimum and maximum value ( 47.794 – 83.39 ). Then, divided the resulted range into four. After that, I counted the frequencies, finding:
Range 1 “ <=56.69 “ | 28
Range 2 “ >56.69 & <=65.594” | 90
Range 3 “ >65.594 & <=74.494” | 63
Range 1 “ > 74.494 “ | 74
Counting the total, the result is 255. Then using this total to find the percentages:
Range 1 “ <=56.69 “ | 10.98%
Range 2 “ >56.69 & <=65.594” | 35.29%
Range 3 “ >65.594 & <=74.494” | 35.29%
Range 1 “ > 74.494 “ | 10.98%

0 notes
Text
Assingment 2
“As I faced too many problems applying the lesson onto gapminder data set, I decided to upload this instead and wait for and advice”.
The photo below shows the codes that I have written . I did not include all the codes used by the tutor , I only used the ones that I am interested in.

As explained by tutor, the first variable that I coded represents the nicotine dependence in the past year(TAB12MDX).
As shown below, 4962 which is about 11.5% of the total sample depend on nicotine in the past year .
Taking the second variable( CHECK321) which represents the smoking status of respondents. Stating ‘1′ for those who smoked in the past year, ‘2′ for those who smoked prior to the past year, and ‘9′ is for unknown.
Results show that 9913 / around 55% of the total sample smoked in the past year and 8078 / around 44% smoked prior to the past year.
Limiting the study for only those who are between 18 - 25 year-old the sample will be only 1706

0 notes
Text
week 2
Getting really disappointed.Firstly I had so many troubles downloading the software of python and anaconda. The link provided by the course is not available. I spent too much of my time just looking for a way to get this software. I even tried to change my plan and learn SAS instead, but still , after registering twice with different emails, the website is just showing “ problems in registering” and I could not even learn this.
Finally, and after lots of attempts, I found a link to download anaconda and started working.
my chosen data set is gapminder. However, I again faced problems uploading the data, it is just showing that the file does not exist!.
Finally I decided to just submit the application of the lesson, and wait for any advice from my colleagues.
0 notes
Text
WEEK 2
I finished the first week 2 days earlier than I expected. I enjoyed the second assignment as it gives a chance to know other thoughts and ways of thinking. I wanted to start with the second week but I am too busy these days. Can not wait to go further with this interesting course.
0 notes
Text
Urbanization and Its Relation to Life Expectancy and Breast Cancer
- After I read all the available codebooks, I chose to work on the Gapminder study. My interest is specifically in urbanization ( urban rate). Why urbanization?. After many discussions with my colleagues at college about urbanization as an absolute indicator of development. I wanted to explore the topic more and to go deeper beyond it.
- To choose the relevant variables which can help to better understand the situation, I thought about choosing some indicators of health level . Therefore, I have decided to study the association between urbanization and life expectancy. Another interesting topic to be studied is the breast cancer and its relationship to the urbanization, if existing .
- Research Questions: Is urban rate associated with life expectancy?. Is urban rate associated with breast cancer rates?).
- Hypothesis: the higher the urbanization level the lower life expectancy rates and higher breast cancer incidence.
Literature Review:
Kabir,M(2008), examined a set of socio-economic variables as determinants of life expectancy in 91 developing countries with high, middle, and low expectations on life. Researcher found that urbanization is insignificantly related to life expectancy and it can not always be taken as a determinant of it. Singh,G. and Siahpush,M. (2014), examined the variation of expectation on life at birth in different rural-urban areas of the U.S. between 1969 and 2009. Study’s result was that the rurality level of areas is inversely related to life expectancy. This result was explained by the disparities of behavioral and health care factors. For instance, in rural regions more smoking and obesity exist, with lower health services available and accessible. Researchers concluded that poor rural started to enjoy survival probabilities which are available to rich urban since four decades. This disparity caused the life expectancy to be lower in the rural areas.
Tominaga,S. and Kuroishi,T. (1995), mentioned that the incidence rates of breast cancer is greater in industrialized countries in the West than developing countries in the East (e.g. Asia ). Researchers concluded that the mortality and incidence rates in Japan were higher in urban areas than rural areas. Hall,S. et al.(2005), wanted to investigate the association between breast cancer and urbanization level in North Caroline, after reporting that rural areas in the U.S. rates of breast cancer incidence were higher in urban areas. The study showed similar results to those in the US. Researchers explained the excess of incidence rates of breast cancer in the urban areas by the urban superiority of hospital registry and detection. Chen,W. et al.(2013), studied the rates of cancer incidence ,in general, and its relation to urbanization level of different areas in China. The study concluded that for men the cancer incidence and mortality rates were higher in low urbanization regions than the high and middle ones. By contrast, for females, rates of cancer mortality and incidence were dramatically higher in the highly urbanized areas than those in the middle and low urban areas. Results on breast cancer in specific were found to be the higher the urbanization the higher the breast cancer incidence and mortality rates.
- My codebook will be as shown below : “ showing only around 80 but the whole sample will be considered “
References:
[1]- Kabir,M.(2008),”Determinants of Life Expectancy in Developing Countries”. The Journal of Developing Areas, 41(2): 185-204
[2]- Singh,G. and Siahpush,M.(2014),”Widening Rural-Urban Disparities in Life Expectancy, U.S.,1969-2009”. American Journal of Preventive Medicine, 46(2): e19-e29
[3]- Tominaga,S. and Kuroishi,T.(1995),”Epidemiology of breast cancer in Japan”. Breast Cancer, 2:1-7
[4]- Hall,S. et al.(2005),”Urbanization and Breast Cancer Incidence in North Caroline, 1995-1999”. Annals of Epidemiology, 15(10): 796-803
[5]- Chen,W. et al.(2013),”Cancer incidence and mortality in China in 2013: an analysis based on urbanization level”. Chinese Journal of Cancer Research, 29(1): 1-10

1 note
·
View note