Don't wanna be here? Send us removal request.
Text

The Planets
Going in a little bit further away from the moon, we have the planets! (Check my moon blog if you haven’t seen it) At this time of the year, Mars, Jupiter, Neptune, and Uranus are visible. I’ll make a follow up post for Venus and Saturn later this year.
Keep reading for more zoomed in images and better details.
The planets are very far away from us. Even with the professional research-grade telescopes, they still appear very small and blurry. To get an intuitive idea, check the Solar Walk by On Other Planets out! You can take a trip by scrolling down the page, and all the planet sizes and distances are to-scale!
All the images in this blog are taken by the PROMPT-5 telescope from SKYNET Robotic Telescope Network. Filters and exposures information will be provided, but I won’t get into too much details about telescope hardware and image processing. To learn more, feel free to check out my general Welcome blog and Creating Colors blog.
Now, let’s dive into our system and explore the gorgeous features of our planets.
Side note: Holst’s symphony suite “the Planets” are fantastic, Jupiter is the most famous one but the others are all classics. Fun fact, there’s no Pluto because it wasn’t discovered by then.
Mars
For closer and brighter planets like Mars, Jupiter, and Venus, we use U, H⍺, OIII (so-called narrow band filters) as they let in fewer light and won’t over expose our CCDs. I took 10 exposures for 1.2 seconds in U, 0.3 seconds in H⍺, and 0.6 seconds in OIII. I'm lucky to take this image about the time when Mars had a close approach to the Earth (it happens about every 26 months). Otherwise, Mars could have been much blurrier!


Above is a side-by-side comparison of how mars should look like on the left (from Stellarium, a free computer planetarium) and the image I took on the right.
Just like our Earth, there are polar caps. But besides regular frozen water ice, there is thin layers of frozen carbon dioxide (dry ice) on Mars. FYI, the frozen point of carbon dioxide is -109 Fahrenheit! The white/grey portions of my images are partially polar caps, however, I do think they are primarily dust storms. Because there’s no liquid water and plants on the surface, the dust storms on Mars can get very insane. Below is a dust intensity map of Mars on the time when the image was take from the Planetary Climates Database Project. The two circled areas with lots of dusts match the shades we had on the image. I think it’s reasonable to conclude that we observed dust storms on Mars!

Unfortunately, the terrains are not very visible except the surface appears to be very red! It’s because the Martian soil is very iron rich, and when they rust, they turn red.
Jupiter

Jupiter costs 10 exposures of 1.5 seconds in U, 1 seconds in H⍺, and 1 seconds in OIII.
Unfortunately, the famous “Great Red Spot” is not facing the earth when I took the picture. :( But you can still see the atmospheric bands. Astronomers refer to the bright strips zones and the dark ones belts. Belts are air going inside to the planet’s center and flowing from east to west; and the zones are air rising from the center and flowing from west to east. It’s actually very similar to the high and low pressure system on Earth. I won’t explain how exactly atmospheric circulation works as it’s a bit off-topic and also a lot of work, here’s a link to internet geography’s explanation and an interactive illustration. But it’s good to know that winds are formed because air flows from high pressure (high particle density) to low pressure (low particle density). So when you think about it, if we live on Jupiter, we will still have to shoot down foreign balloons because the west-wind belt still exists!

If we try to bring out fainter objects in the image, we got see the moons (and an over-saturated Jupiter lol). The ones we can see with the exposure time we have are Galilean moons, as they were originally discovered by Galileo. Fun fact, we no longer used the name Galileo picked after the noble families who founded his research, we adopted the name chosen by Simon Marius, who independently discovered the moons at about the same time as Galileo, after the lovers of god Zeus (which is the Greek equivalent of Jupiter).
Back to the moons themselves, there are 3 out of 4 Galilean moons visible in this image, as Callisto out of frame. I could write an entire blog just about the Galilean moons, but here I just briefly talk about Io. It’s the closest moon to Jupiter, hence is always under the tug and stretch by extreme tidal forces exerted by Jupiter’s Gravity. As a result, constant volcanos ejecting sulfur compounds and make the it looks orange as we can see in the image. Highly recommend the third 3 episode of Love, Death, and Robots season 3 The Very Pulse of the Machine, the scenario of Io is really cool and somewhat physically accurate.
Besides the 4 Galilean moons, there are 92 known moons of Jupiter. Most those moons are small asteroids captured by Jupiter’s gravity, hence are very hard to observe. As more powerful telescopes are built, we are still discovering new moons! In fact, 12 were discovered earlier this month, and even amateurs can contribute.
Uranus & Neptune


It might be hard to tell them apart as Uranus and Neptune are so far away that they are just tiny pixelated dots from our telescopes. However, it’s way easier to distinguish when we recreate colors properly. Neptune has a very cute shade of baby blue, and Uranus is more greenish. Their atmosphere is mostly composed of hydrogen (84%), helium (14%), and methane (~2%). The difference between color is caused by the haze in their atmosphere: Neptune is further away from the sun and the cooler temperature causes more haze and make it bluer.
And that’s all folks! Hope you learn something interesting about our neighbors today. In fact, I learned a lot while writing this blog, and still there are so much we don’t know yet about our planets even if they are close by. Catch ya later!
#space and astronomy#astrophotography#astromony#planets#solar system#jupiter#neptune#mars#physics#photography#photograph#pics#telescope#Spotify
1 note
·
View note
Text

The Moon (Radio Edition)
There’s a full moon right in my window while I’m writing this blog. It’s pretty but it is annoying for astronomers because the moon is so bright and you can’t really see anything else. Luckily, optical is not the only way to do astronomy. If you haven’t seen my blog on the optical moon, check it out right here!
Moon doesn’t shine by itself like the sun, we can only see it when it’s reflecting the sunlight. Is it the same in radio waves? In other words, is the moon brighter in radio when there’s a full moon?
Spoiler alert, the brightness of the moon in radio is not related the moon phase, it’s actually related to the distance between the moon and us. Let’s dive right in and figure out why.
I’ll try to avoid getting technical about radio astronomy. A future blog should be expected to explore how radio telescopes work.
Not a Mirror of the Sun
We took two observations of the moon, one at waning crescent, and one at waning gibbous. The percentage of the moon surface that is illuminated are 44% and 66%. Interesting enough, their brightness are almost the same, and waning crescent with less brightness in optical actually have a slightly higher radio brightness at 927 Jansky compared to 845 Jansky. Janksy is a unit radio astronomers use to measure brightness, named after Karl Jansky who invented the first radio telescope. Btw, that telescope, also known as “Jansky’s merry-go-around” is still in exhibit at Green Bank Observatory in West Virginia.
But where does the radio waves come from? Maybe the moon is emitting by itself?
Thermal Radiation: Moon Shines Invisibly
Instead thinking about the moon, let’s swap object. Why is the sun so bright? Maybe because it’s burning? Thermal radiation exactly describes that! Anything that is hot would emit light! It’s important to notice that hot and light here are not what we usually refer to in everyday’s life.
To be hot in this context is to be above absolute zero, which cannot be achieved in real life, so everything is hot just to different degrees! And light refers to all sort of Electromagnetic waves. To learn more about EM waves, check my other blog right here.
Thermal radiation is
Emitting lights in a wide range of wide wavelengths, and its temperature decides which specific narrow part in the wide range has the strongest intensity and most observable.
Several remarks from the statement,
This is an over-simplified version to get the idea, for details check Wikipedia.
The emission is on a wide range, when we talk about the color/wavelength, it’s the one that is dominating.
In the visible range, the hotter a body is, it appears to be bluer.
If an object is very cold, the wavelength would be very large and falls into the radio wave category.
So, if we know how bright something is, and what’s the wavelength we are observing, we can basically figure out how hot the moon is.
With some calculation, I figured out that the moon surface temperature is about -17 F to 37 F, which is pretty close what the pros said! It also makes sense as the moon is pretty cold because there’s no atmosphere to preserve surface temperature.
And that’s all folks! Radio images might not be most impressive, but seeing the ‘invisible’ is always fun. Catch ya later!
1 note
·
View note
Text

Recreating Colors
Color is one of the most important factors that lead to woo and ahh when looking at astro images, even pictures in general. In this blog, we’ll dig into the physical natural behind colors, understand how human eyes interpret colors, and explore astronomers’ recreation of colors.
Light is Electromagnetic Wave
Do you know that micro waves are light? You might catch me using the word ‘light’ to refer everything on the EM spectrum (Electromagnetic spectrum) because just like visible light, radio waves, micro waves, and ultraviolets are all electromagnetic waves!

Electromagnetic Spectrum
Above is a spectrum of all forms of EM waves. It’s helpful to know that for waves, speed equals to wavelength times frequency. Since the speed of light is constant (thanks Einstein), the bigger the wavelength is, the smaller the frequency will be.
I won’t go in any more details about the natural EM waves. Here’s a link to NASA’s explanation if you are interested in learning more. The important take away here is light for us astronomers is way more that what we see in every day life, as the visible spectrum is only a tiny tiny fraction of what’s out there.
Eye Anatomy
Understanding lights as EM waves, colors are just a reflection of what the wavelength/frequency is. We perceive long wavelength light as red, and short wavelength as blue. Based on the reverse relationship between wavelength and frequency we just explained, slow frequency means red, and fast frequency means blue.
But how our eyes can distinguish different wavelength/frequency of lights?
There are two types of cells in our retina inside our eyes helps us see lights, rods and cones. Rods are really sensitive and help us to see in relatively dark environment, but they cannot help us in the color department. On the other hand, cones can only see well in more well-lit environment but they make our the world pretty.

Responsivity spectra of human cone cells
There are three types of cones, named as S, M, and L in the above image. Each of them are sensitive to different wavelengths. And the peak wavelengths are how we perceive colors: S peaks in the blue, M peaks in the green, and L peaks in the red. When our brain put together what each type of cones see, we have a full colored vision.
CCD & Filters
To image faint and far away objects, astronomers use CCDs. They are similar to the cameras we have in our smart phones, but way more sensitive to low lights and cannot distinguish colors. In fact, they would register the entire visible spectrum, plus a little bit of infrared.
When you think about it, CCDs are like rods in our eyes! That’s why we have filters to get us colors! Remember looking through a translucent plastic? Everything turns into the color of that piece of plastic. A filter functions exactly like that: it only allows lights within a specific range of frequency (aka color) to get in.
Astronomers made a lot of filters, each cover different part of the EM spectrum. They are not always correspond to what human eyes see. If we pick filters that lets in light similar to our cones, we can make images very close what our eye would see directly through a telescope. Otherwise, we have to tweak colors around in the images, which would be the topic in a later blog!

Jupiter under Halpha(Red), OIII(Green), and U(Blue) filters.
Then, we can just manually assign a color to the image based on what filter is used. Similar to how our brain works, we put all three colored image on top of each other, a process called stacking, to create a colored image.

Composite Colored Jupiter
And that’s all folks! Colors are amazing but can get really tricky and technical sometimes. Catch ya next time.
0 notes
Text
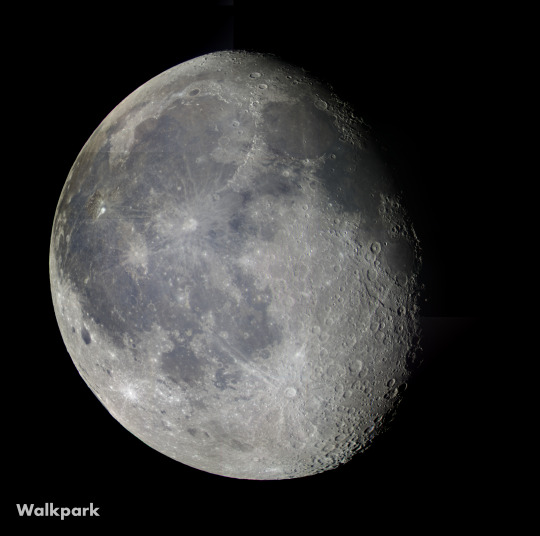
The Moon

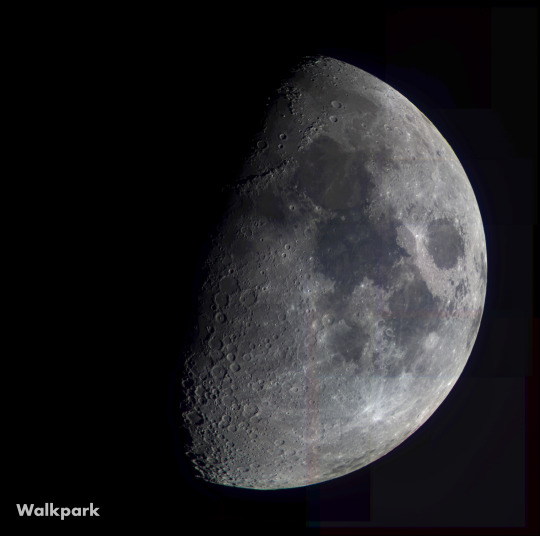
Some might say the moon is basic, saying it’s our closest neighbor and you can see some details even without a telescope.
You can’t be more wrong. The Moon is awesome! 🌝 Close up telescope images will show you astonishing terrains and surprising color variations. With some astronomical insight, it’s not hard to decipher the the moon’s secret past.
Now, let’s take a closer look into the moon image, shall we?
Btw, might want to check out some this warm welcome if you are new here.
(As a pianist, I highly recommend reading this blog while listening to Clair de Lune by Debussy)
What's on the moon? 👽
There’s so much to talk about the moon. How is it formed? Why we can only see half of the moon? etc. etc. This blog I’ll focus on explain what’s on the moon. If you ever go outside and look at the moon through naked eye, all you can really see are just dark and bright spots. In fact, back in the days, people used to believe that the dark regions are ocean just like the earth. That’s why they are still called ‘maria’ which means seas in Latin. (Yes, astronomers like to stick with the mistakes they made, and as all scientist they like Latin). And it turns out there are indeed mountains, but in the form of craters with dents in the middle.
How are they come to existence, and what determines their color?
It’s not hard to guess that craters were the result of collisions. When some small meteoroid hits the moon, it creates a dent, and breaks into pieces. Those pieces are called ejecta. Most ejecta stays in the crater, but some will fly off pretty far and form the slope we see around the crater. We call those ejecta blanket. I can imagine the collision heat them up like a real blanket! Those impacts from space create colorful glassy materials. As the image below shows, near the Aristarchus crater, the glassy deposit are blue as they contain titanium. If an area is geologically active, there might be dark yellow glass as you can see in the image below near the Aristarchus plateau.
Interesting enough, the maria are also formed by collisions, but indirectly. Those collisions were so big that it hits deep into the inner part of the moon (mantle), and brought out lava to the surface. As lava flowed across the moon surface, they cooled down and formed a type of rock called basalts. They usually have darker color as you can see in the Ocean of storms.

On a side note, be careful with your wording because meteor, meteorite, and meteoroid all mean different things! For a small space object, if it’s still in the space, it’s a meteoroid. It becomes a meteor when it flies through the atmosphere, and if it survives and is found on the ground, it settles as a meteorite.
Image Crafting 💻
I’m planning to write a stand-alone blog for the standard procedure of processing an image in Afterglow. Here I’ll just explain what’s special about the moon observation.
The moon is too big. Each image taken by the telescope of my choice would only take 1/9 of the moon. To get a full moon, I have to take in a 3x3 dithering pattern and stitch them together. This is way harder to get it done than it sounds. Since the telescope cannot point at where it’s supposed to point 100% accurate, we have to apply algorithm to identify which image goes where, and crop and zoom accordingly. That’s why you might see weird straight lines in the middle of the image because the software wasn’t perfect yet when putting mosaic together. Here are the raw images taken in a 3x3 grid pattern.
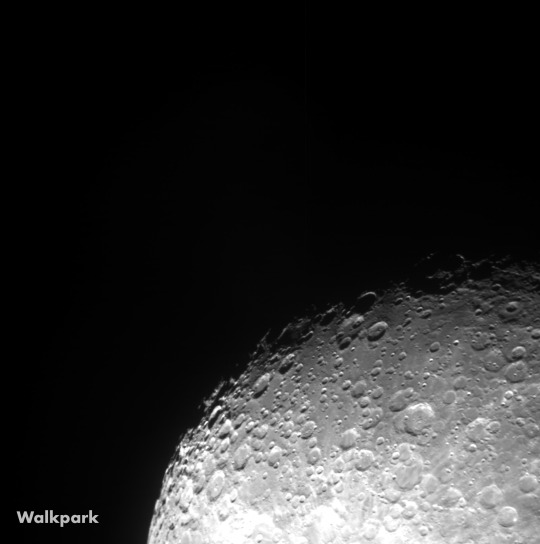
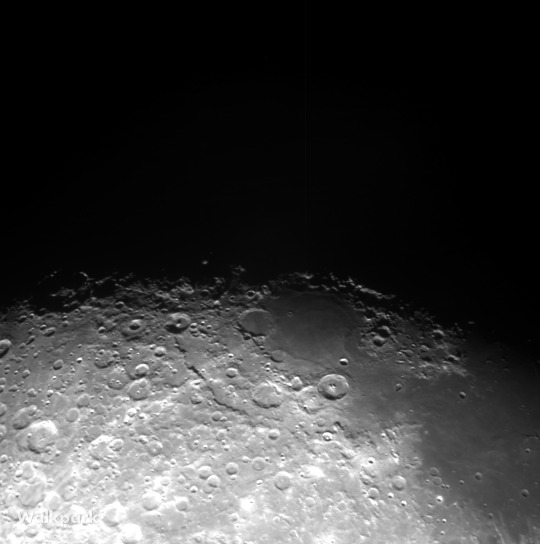
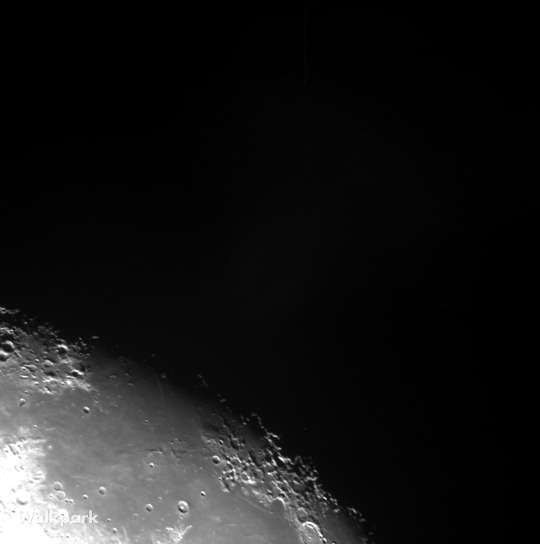

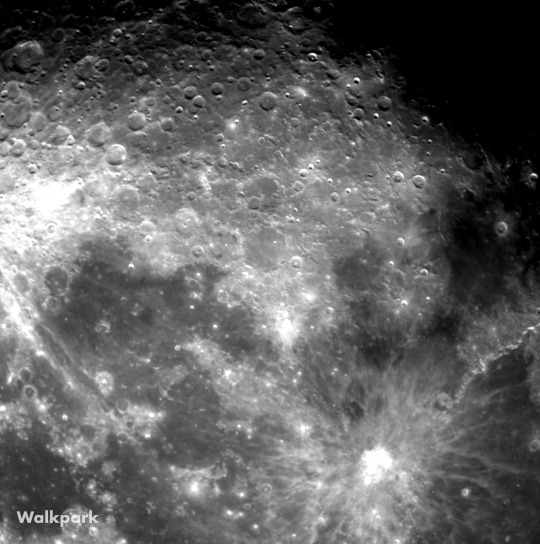


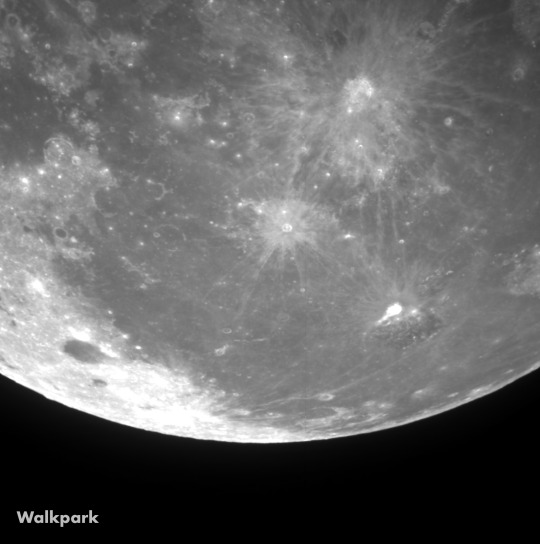
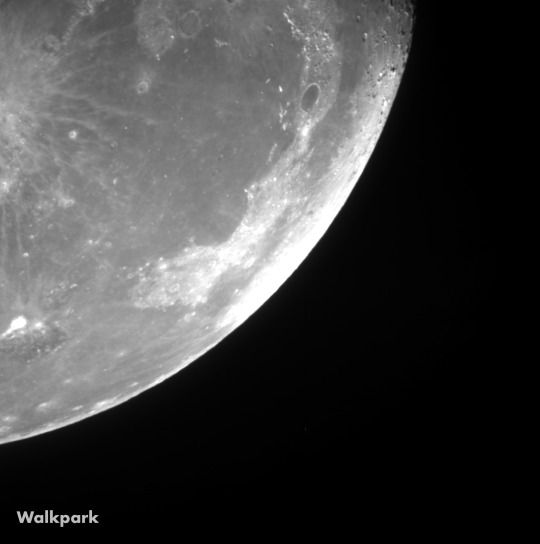
Moon phase is constantly changing. When it’s full moon, you do get the entire surface, but you miss out on the ‘terminator’ (the line that divides day and night). To get a full moon, I took two observations half a month a part to get both a waxing gibbous and a waning gibbous.
And that’s all folks! Hope y’all enjoy the moon and the especially the subtle colors!
9 notes
·
View notes
Text
Welcome! to my astronomy blog
Pretty images should be expected! I’ll be busy cranking up pictures of planets, clusters, nebulae, and galaxies, while preserving their real physical characteristics.
I’ll also show what’s behind the scene step by step, from the original ‘raw’ images all the way to a clean, sharp, and colored final product. Those images might not look the prettiest compared to the ones you find on NASA or Astronomy Picture of the Day, but they will be very physically accurate. And I will explain why the colors you see are the way they are without joggling jargons everywhere.
There might be specials blogs that I explain certain concepts that are important to astrophotography, such as color combinations and telescope mechanism.
A little background
Skynet, a robotic telescope network based in University of North Carolina Chapel Hill, is where I submit my observation requests. (Yes, it’s a Terminator reference) Skynet controls more than 20 telescopes across the globe, and can take observations automatically. It’s great to hang out and play Mario Kart with friends instead of operating a telescope in freezing January nights.
Afterglow, an image processing software by Skynet group, helps me make the images pretty! Despite having access to some really powerful telescopes, the images I get back will still be blurry, noisy, and black-and-white. Telescopes that are on the ground have to see through the atmosphere to look at the stars, and air doesn’t like to stand still that much. Have you ever seen through hot waves above a road in a hot summer day? It’s like that but imaging staring at a star really far far far away for two minutes! Afterglow comes in handy to make images crispy and clean.
Afterglow also gets me covered in the color departments since most of those sensitive cameras are only black-and-white. But black-and-white images are boring! To make colored images, we have to apply filters when taking images (exposing). If we let in red, blue, and green light one at a time, when we combine them we have a full colored image!
After exporting from Afterglow, I use Lightroom to tweak color, brightness, and other subtle stuff before I post them on this blog.
A little about me
I’m Walkpark (that’s why this blog is called astro_wp), a college student who loves space and science, and here’s a picture of my cat.

1 note
·
View note