#ttm periode 4
Explore tagged Tumblr posts
Visit Tumblr Blog
Explore Tumblr blogs with no restrictions, modern design and the best experience.
Last Seen Tumblr Blogs


Fun Fact
China blocked Tumblr because of pornography and censorship problems in 2013.
Text
Starbucks Corp. is a company that specializes in making, selling, and serving specialty coffee. It was established by Jerry Baldwin and Howard D. Schultz on November 4, 1985, and its main office is in Seattle, WA. Starbucks stock has been increasing its dividend amount every year and the dividend in the last five years grew from $1.26 to $1.96 per share. This indicates that the SBUX company is strong and reliable in terms of its fundamentals and financials and has a long-term potential for growth in its SBUX share price. The SBUX stock’s dividend yield for the TTM is 2.32% and its last dividend payment was 0.57 per share. The last ex-dividend date was November 9th, 2023 and its payout ratio is 63.33%. The SBUX stock has a float of 1.115 Billion shares and a market cap of $104.541 Billion. The Starbucks Corp. stock’s average volume for the last 10 days is 5.657 Million and its current volume is 7.7 Million. The SBUX stock has a CMP of $91.27 and an intraday gain of 0.21%. Starbucks’s latest quarterly balance sheet for the period ending June 2023, reported total assets of $28.73 Billion and total liabilities of $37.07 Billion. The debt-to-assets ratio is at 129.03%, which is a negative sign and might be a concern for SBUX stock. The latest quarterly earnings report for the period ending June 2023, displayed a revenue of $9.16 Billion, with a net income of $1.14 Billion, and a profit margin of 12.46%. This quarter, the reported revenue missed analysts estimate by $121.155 Million (1.30%). The next quarter’s revenue is estimated to be 9.302 Billion. SBUX Stock Price Technical Analysis in 1-D Timeframe Source: SBUX.1D.NASDAQ by TradingView At the time of publishing, the major EMA’s in Starbucks Corp. (NASDAQ: SBUX) are bearish and MACD shows a bearish cross on the charts and RSI is at 30.54 taking resistance from 14 SMA. However, the stock ratings for Starbucks stock are positive and highly recommended based on 30 analysts who have evaluated SBUX in the last three months. The 1-year price forecasts for Starbucks stock by 29 analysts range from $101 to $150, with a high potential for growth. The stock may continue to fall further if it breaks below the current levels and breaks below $85, which could lead to a target of $80. On the other hand, if Starbucks stock manages to reverse the trend and gain strong buying momentum It could rise above $95, triggering a rally above $100 or higher. Summary Starbucks Corp. (NASDAQ: SBUX) indicates that the traders and investors of the stock price are bearish on the 1-D time frame. The price action shows a bearish outlook at the time of publishing. The technical analysis tools of Starbucks’s stock price also support bearishness. The EMA, RSI, and MACD highlight downward signals and indicate that a downtrend may continue in the SBUX stock price. Technical Levels Support levels: $85 and $80 Resistance levels: $95 and $100 In this article, the views and opinions stated by the author, or any people named are for informational purposes only, and they don’t establish the investment, financial, or any other advice. Trading or investing in cryptocurrency assets comes with a risk of financial loss.
0 notes
Photo

How To Understand The P/E Ratio
The price-to-earnings ratio, or P/E ratio, helps you compare the price of a company’s stock to the earnings the company generates. This comparison helps you understand whether markets are overvaluing or undervaluing a stock.
The P/E ratio is a key tool to help you compare the valuations of individual stocks or entire stock indexes, such as the S&P 500. In this article, we’ll explore the P/E ratio in depth, learn how to calculate a P/E ratio, and understand how it can help you make sound investment decisions.
What Is the P/E Ratio?
The P/E ratio is derived by dividing the price of a stock by the stock’s earnings. Think of it this way: The market price of a stock tells you how much people are willing to pay to own the shares, but the P/E ratio tells you whether the price accurately reflects the company’s earnings potential, or it’s value over time.
If a company’s stock is trading at $100 per share, for example, and the company generates $4 per share in annual earnings, the P/E ratio of the company’s stock would be 25 (100 / 4). To put it another way, given the company’s current earnings, it would take 25 years of accumulated earnings to equal the cost of the investment.
In addition to stocks, the P/E ratio is calculated for entire stock indexes. For example, the P/E ratio of the S&P 500 currently stands at 28.61. Since prices fluctuate constantly, the P/E ratio of stocks and stock indexes never stand still. The P/E ratio also changes as companies report earnings, typically on a quarterly basis.
Three Variants of the P/E Ratio
While the math behind the P/E ratio is straightforward—price divided by earnings—there are several ways to factor the price or earnings used for the calculation.
The price-to-earnings ratio is most commonly calculated using the current price of a stock, although one can use an average price over a set period of time. When it comes to the earnings part of the calculation, however, there are three varying approaches to the P/E ratio, each of which tell you different things about a stock.
Trailing Twelve Month (TTM) Earnings
One way to calculate the P/E ratio is to use a company’s earnings over the past 12 months. This is referred to as the trailing P/E ratio, or trailing twelve month earnings (TTM). Factoring in past earnings has the benefit of using actual, reported data, and this approach is widely used in the evaluation of companies.
Many financial websites, such as Google Finance and Yahoo! Finance, use the trailing P/E ratio. Popular investment apps M1 Finance and Robinhood use TTM earnings as well. For example, each of these sites recently reported the P/E ratio of Apple at about 33 (as of early August 2020).
Forward Earnings
The price-to-earnings ratio can also be calculated using an estimate of a company’s future earnings. While the forward P/E ratio, as it’s called, doesn’t benefit from reported data, it has the benefit of using the best available information of how the market expects a company to perform over the coming year.
Morningstar uses this method, which it calls Consensus Forward PE. Using this method, Morningstar calculates Apple’s PE at about 28 (as of early August 2020).
The Shiller P/E Ratio
A third approach is to use average earnings over a period of time. The most well known example of this approach is the Shiller P/E ratio, also known as the CAP/E ratio (cyclically adjusted price earnings ratio).
The Shiller PE is calculated by dividing the price by the average earnings over the past ten years, adjusted for inflation. It’s widely used to measure the valuation of the S&P 500 index. The Shiller PE of the S&P 500 currently stands at just over 30 (as of early August 2020).
How to Use the P/E Ratio
The most common use of the P/E ratio is to gauge the valuation of a stock or index. The higher the ratio, the more expensive a stock is relative to its earnings. The lower the ratio, the less expensive the stock.
In this way, stocks and equity mutual funds can be classified as “growth” or “value” investments. An investment with an above average price-to-earnings ratio, for example, might be classified as a growth investment. Amazon, with a PE currently at about 123, is an example of a growth company. An investment with a below-average P/E ratio would be classified as a value investment. Citigroup, with a price-to-earnings ratio under 9, would be considered a value company.
The P/E ratio can be used to compare two or more companies. This can be useful given that a company’s stock price, in and of itself, tells you nothing about the company’s overall valuation. Further, comparing one company’s stock price with another company’s stock price tells an investor nothing about their relative value as an investment.
P/E Ratio and Future Stock Returns
While the P/E ratio is frequently used to measure a company’s value, its ability to predict future returns is a matter of debate. The P/E ratio is not a sound indicator of the short-term price movements of a stock or index. There is some evidence, however, of an inverse correlation between the P/E ratio of the S&P 500 and future returns.
Some studies show that an above-average Shiller P/E ratio suggests lower stock market returns over the following 10 years. A recent study found that the Shiller PE was a reliable predictor of market returns between 1995 and 2020. In contrast, a recent Vanguard study found that the Shiller PE and other P/E ratio measures “had little or no correlation with future stock returns.”
P/E Ratio vs. Earnings Yield
The P/E ratio is closely related to earnings yield. Where the P/E ratio is calculated by dividing the price of a stock by its earnings, the earnings yield is calculated by dividing the earnings of a stock by a stock’s current price. It expresses earnings as a percentage of a stock’s price.
The earnings yield is often compared to current bond interest rates. Referred to by the acronym BEER (bond equity earnings yield ratio), this ratio shows the relationship between bond yields and earnings yields. Some studies suggest that it is a reliable indicator of stock price movements over the short-term.
What Is the PEG Ratio?
The PEG Ratio is also related to the P/E ratio in important ways. Calculated by dividing the P/E ratio by the anticipated growth rate of a stock, the PEG Ratio evaluates a company’s value based on both its current earnings and its future growth prospects.
In this way, some believe that the PEG Ratio is a more accurate measure of value than the P/E ratio. Like the forward P/E ratio, however, it is based on future growth estimates, which may not materialize.
17 notes
·
View notes
Text
How to prepare your portfolio for the uncertain future?

Everyone thinks that due to the recent events caused by Coronavirus we are in uncertain times. I believe we are always in uncertain times. The emergence of any event has multiple co-dependent factors and nothing gets created out of a vacuum. Since we cannot know and control all the factors that lead to the manifestation of any situation; we cannot be 100% certain about any event. Thus, we are always in uncertain times, only the degree varies in our mind based on how we perceive the latest set of information which has known ‘knowns & unknowns’ and still missing out on unknown ‘knowns & unknowns’.
The best investors I know are those who believe that the future is always uncertain and they plan and account for such a situation in their investment management framework. The investors who do poorly are those who are always very sure of the future events. In this blog, I am going to give you insights on the important aspects of investment management employed by the best investors and how we can use them to maximize our portfolio returns besides minimizing the risk.
1. Be Cautiously Optimistic
We all know that to be able to be successful in life, we must be optimistic about our future. However, along with that optimism, caution should also be attached due to unknown ‘knowns & unknowns’ in the future. The best investors are cautiously optimistic about the future. In fact, Warren Buffet who is the 4th richest man in the world has two rules for investing:
Rule No 1: Never lose money
Rule No 2: Never forget rule no. 1
The above statement doesn’t mean that one will never have investment losses but following the above two rules will make you think in a direction to build strategies and approaches that minimize your losses.
Did you know many of the world’s best investors were already prepared for the crash? Warren Buffet is sitting on more than USD 120 billion of cash from many months, Howard Marks has been talking about being defensive since the last two years and so was Seth Klarman. It’s not that they knew the time of the market crash, but their investment strategies ensured that their portfolios were prepared for any such eventualities.
They understand that stock markets go through a cycle and the valuable lessons from history taught them to read signs and stay cautiously optimistic. They don’t fight the forces, they use them.
2. Use tactical allocation to make your portfolio future-ready
Smart investors are very careful about market valuations (prices) and investor behaviour. They know that human behaviour leads to extreme prices in the stock market – both on the upside and downside, and they are prepared to take advantage of such follies. The chart below illustrates that the smart money enters when valuations are low and the majority of the investors aren’t looking at that asset class or security.

How are they prepared for that? They use the principle of margin of safety. It means they buy any business or stock when its trading price is lower than their self-assessed fair value (also known as intrinsic value) of that business. Lower the trading price than fair value, lower is the downside risk and higher is the margin of safety and upside potential. Similarly, the smart investors stop making new investments and sold the one they were holding when they realize that market valuations are too expensive which results in higher downside risk, low margin of safety, and lower return potential. This provides them enough liquidity to invest again at cheaper prices when the tide goes out.
For common investors, arriving at a fair value of any stock could be very tricky. Hence, they can use a simple valuation parameter of 10-15 years average price per earning (PE) ratio. For example, the 15 years average twelve months trailing (TTM) PE ratio of benchmark Sensex is 18-19x. In previous market cycles, the TTM PE of Sensex has touched 28-30x at the market peak and 10-12x at the marker trough. So a mutual fund investor focused on large caps should gradually start reducing equity allocation from the portfolio as it keeps rising above 21x PE. On the contrary, one should gradually add up equity allocation as the Sensex PE keeps falling below 18x PE ratio. A sample tactical allocation plan for an investor with a moderate risk profile could be like this:

Please note, we have simplified the above case for understanding purposes. In reality, fair valuation of the Sensex depends on many factors and it keeps on changing but taking long term average (of at least 10-15 years) is a good way to start. The important takeaway is that there should be an allocation plan prepared for asset class volatility and it shouldn’t be just an ad-hoc emotional buying or selling. One can prepare a customized plan depending upon their investment liking and understanding of different asset classes, sub-categories, and their own risk profile. Having a sense of market/asset class cycles and at which stage we could be in that cycle helps tremendously.
Now let’s see how tactical asset allocation can make a huge difference in your portfolio performance. Consider an investor with a high-risk profile who chooses to take equity exposure in her portfolio by investing in an index fund tracking Sensex and the remaining amount in a debt mutual fund. She had a plan to reduce equity exposure to 40% of the portfolio when the Sensex TTM PE reaches 26x and increase it back to 100% when the Sensex TTM PE reaches 13x. If she had executed her plan with perfection in two years period from Oct 2007 to Oct 2009, her portfolio returns would have been positive 31% (46% more than Sensex returns) over the next two years compared to negative 15% returns if she had continued to stay 100% invested in equity.

Pardon me for using a perfect case scenario case for a short period of two years to drive across my point for the sake of calculation simplicity. In reality, the best strategy is to gradually increase equity allocation as the market continues to slide down since you never know if the market will really bottom at 13x or 14x or any other PE ratio. You would have still ended up making 20-25% higher returns over the Sensex returns in two years by making staggered investments during the down cycle. Series of such successful tactical asset allocation calls results in long term compounding returns and outperformance over the benchmark returns by 5-15% per annum which is just amazing!
There are various studies which explain that asset allocation accounts for 80-85% of portfolio returns while scheme selection contributes to only 15-20%. Despite that, many investors end up spending a majority of their time and energy in finding the best scheme and rarely on finding the best asset allocation.
However, having a plan is not the sure shot way to investment success if you do not have the right temperament and courage to execute the same. This brings us to the last but the most important quality of successful investors.
3. Patience, Courage, and Conviction
Since patience and courage are rare traits, so is the rare club of successful investors. I have seen many disciplined and experienced investors who resisted investing in equity for a long time due to expensive valuations but finally gave in to the psychological pressure of seeing their peers make money. They ran out of patience and ended up investing at the market peak. They find some reasons to justify the excessive valuation by assuming that the factors that are driving the market to excesses will continue to stay perpetually. By the way, bears turning bulls is also a strong signal of market reaching to its peak.
Having conviction to follow a strategy and patience to stick to a plan (usually by going against the herd) for as long as it requires, needs a great strength of courage and tranquil temperament. One can develop and strengthen these qualities by meditation and practicing mindfulness.
Downside of following a disciplined value investing approach is that you may end up being too early sometimes. But it is always better to be early than late. Being early can cost you some missed-upside but being late is very dangerous to your portfolio health.
The proof of the pudding is in the eating. Following the above three qualities of successful investors, we at Truemind Capital Services have been able to deliver decent results. As mentioned in our previous blog, we were underweight on equity before the market correction due to overvaluation and had taken decent exposure to Gold a year ago. We increased some of our equity exposure in the month of March when markets corrected significantly from its peak. This helped us generate positive return of 3%-8% on our portfolios under management in the last one year compared to -17% YoY decline in the Sensex value. This indicates an outperformance of 20-25% over the benchmark Sensex. However, we continue to stay cautiously optimistic.
We hope this piece helps in understanding on how to formulate an investment strategy for your portfolio. You must work on a plan immediately even if your portfolio has losses. Failing to plan would lay ground for future disappointments. If you are having difficulty in setting up a strategic investment plan that suits your unique requirements, feel free to discuss with us.
You can write to us at [email protected] or call us on 9999505324.
#investmentmanagement#wealthmanagement#investing#investors#investments#portfolio#mutualfunds#fundmanagement#wealthplanning#financialadvisor#financialplanner#SEBIRIA#truemindcapital
1 note
·
View note
Text
Chandigarh university online college in Punjab

Chandigarh university comes under one of the best universities in India and it also has the title of the best university in Punjab. Chandigarh university's online college is UGC-DEB approved and it has accredited by NAAC and is esteemed with A+ Grade.
Chandigarh Institution, like Aisa's fast-growing university, Limca Book, has received numerous honours for inviting the most companies for placement in a single year.
CU has also been named the best by Star Group, the best placement university by WCRC, the seventh youngest institution in India, and the third best private university in India by India Today.
It has also signed MOUs with over 250 foreign universities and institutes from countries such as the United States, Canada, the United Kingdom, and Australia. The University of Colorado is a private university that provides undergraduate, graduate, and doctoral programmes.
The learning management system (CU-LMS) of Chandigarh University is designed to keep you learning.
Chandigarh university online education overview
● The UGC-DEB has approved Chandigarh University.
● NAAC accredited it with an A+ grade in the first circle. The National Assessment and Accreditation Council (NAAC) is an institution that performs assessment programmes for colleges and universities in order to determine their quality level.
● It also belongs to the Association of Universities (AIU). AIU is a Delhi-based organisation that reviews foreign universities' courses, syllabi, standards, and credits. It was founded in 1925.
● Chandigarh University online college from Punjab has also been named Asia's fastest-growing private institution in a short period of time.
● Recorded in the Limca Book of Records for inviting the most firms for compass placements.
Chandigarh university online education admission procedure
Admission to Chandigarh university's online education programmes is based on academic achievement. For example, Individuals seeking MBA admission must have a valid CAT/MAT score. The admission procedure at Chandigarh university is short and crisp. The students just need to follow some steps written below to get enrol in this prestigious university.
Step1. Visit the university's official remote education webpage and. To apply for admission, go to the website and click the "APPLY NOW" or "APPLY ONLINE" button.
Step2. Enter the conditions before hitting the "SEND" button and Registered applicants will thereafter receive their CU distance learning username via SMS and e-mail.
Step3. Sign in again with a registered username or email address and After that, fill out a course registration form.
Step4. Fill in all of the required information correctly and all together download the referenced document.
Step5. Pay the registration cost with a credit or debit card or through internet banking. Paid calls will be communicated to applicants via SMS and e-mail.
Step6. On the "Overview" application form, click the "Next" button and in the last print the application form.
Documents required for admission in any courses
● Certificates for GATE/NET/NBHM/SLET/GPAT (if applicable)
● Mark sheets for qualifying degrees, degrees, and provisional certificates
● If applicable, OBC/SC/ST/PD category certification
● Part-time candidates must have experience and a NOC certificate.
Chandigarh university online courses and their specializations
Chandigarh university's online courses are numerous with lots of specializations, Cu offers both UG(undergraduate ) And PG(postgraduate ) courses to its students with quality education and expert teachers. CU offered courses are BBA, MBA, BCA, MCA, and B.Sc. Travel& Tourism (B.Sc. TTM), BCOM, MCOM, BA, MA English, MA Psychology. Here are the detailed pieces of information about Chandigarh university programs and their specializations.
Undergraduate courses :
1. BBA- bachelor of business administration
2. BA - Bachelor of Arts
3. BCA- Bachelor of computer application
4. BSc- Bachelor of science
5. B.COM - bachelor of commerce
Postgraduation courses:
1. MBA- Masters of business administration
2. MCA- Master of computer application
3. M.COM- Masters of commerce
4. MA- Master of arts
Specializations:-
● MA-
➔ Finance
➔ Marketing and management
● MBA
➔ Human resource management
➔ International Business
Chandigarh university online education admission eligibility criteria
Every university has eligibility criteria for its different courses but there is some general eligibility that will apply to every course in every university. Chandigarh university's online education eligibility differs from differing according to the courses, in other words, every course at Chandigarh university has different eligibility criteria. So keeping this in mind here is the full information on the eligibility criteria for Chandigarh university.
● Applicants must first meet the eligibility requirements for the CU distance learning course for which they desire to apply.
● Applicants to CU Distance Education must have completed their 10th and 12th grades from a recognised board or institution.
● Applicants must hold a bachelor's degree from a reorganised university.
● To be eligible for postgraduate study, individuals must hold a bachelor's degree or equivalent.
#chandigarhuniversityonlinemba#chandigarhuniversityonlinecourses#chandigarhuniversityonline#chandigarhuniversityonlinembafees#chandigarhuniversityonlinedegree
0 notes
Text
Coffee Machine Market Size, Share With Top Companies, Region Forecast 2021-2027
The Coffee Machine Market report is latest report published by Fusion Market Research which provides comprehensive information, overview of the demands and describe Impact of Covid-19 on the market during the forecast period 2021–2027.
Get Free Sample Report @ https://www.fusionmarketresearch.com/sample_request/2015-2025-Global-Coffee Machine-Market/14744
Coffee machine is cooking appliance used to brew coffee. Common commercially available coffee machine contains different types using different brewing principles. Its application includes household, office and commercial consumption. Market Segment as follows: Key Companies Nippon Mektron Zhen Ding Technology Unimicron Young Poong Group Samsung Electro-Mechanics Ibiden Tripod TTM Technologies Sumitomo Electric SEI Daeduck Group Nanya PCB Compeq HannStar Board LG Innotek AT&S Meiko Chin-Poon Shennan WUS Key Types Layer 4~6 Layer 8~10 Layer 10+ Key End-Use Consumer electronics Communications Computer related industry Automotive industry Others
Request For Discount @ https://www.fusionmarketresearch.com/request_discount/2015-2025-Global-Coffee Machine-Market/14744
Table Of Content
CHAPTER 1 MARKET OVERVIEW 1.1 Market Definition and Segment 1.1.1 Product Definition 1.1.2 Product Type 1.1.3 End-Use 1.1.4 Marketing Channel 1.2 Major Regions 1.2.1 Europe Market Size and Growth Figure Europe Coffee Machine Market Size and Growth Rate, 2015E-2020F (Million USD) Figure Europe Coffee Machine Market Forecast and Growth Rate, 2020E-2025F (Million USD) 1.2.2 America Market Size and Growth Figure America Coffee Machine Market Size and Growth Rate, 2015E-2020F (Million USD) Figure America Coffee Machine Market Forecast and Growth Rate, 2020E-2025F (Million USD) 1.2.3 Asia Market Size and Growth Figure Asia Coffee Machine Market Size and Growth Rate, 2015E-2020F (Million USD) Figure AsiaCoffee Machine Market Forecast and Growth Rate, 2020E-2025F (Million USD) 1.2.4 Oceania Market Size and Growth Figure Oceania Coffee Machine Market Size and Growth Rate, 2015E-2020F (Million USD) Figure Oceania Coffee Machine Market Forecast and Growth Rate, 2020E-2025F (Million USD) 1.2.5 Africa Market Size and Growth
…
CHAPTER 9 GLOBAL MAJOR COMPANIES LIST 9.1 Nippon Mektron 9.1.1 Nippon Mektron Profile Table Nippon Mektron Overview List 9.1.2 Nippon Mektron Products & Services 9.1.3 Nippon Mektron Company Dynamics & News 9.1.4 Nippon Mektron Business Operation Conditions Table Business Operation of Nippon Mektron (Sales Revenue, Sales Volume, Price, Cost, Gross Margin) 9.2 Zhen Ding Technology 9.2.1 Zhen Ding Technology Profile Table Zhen Ding Technology Overview List 9.2.2 Zhen Ding Technology Products & Services 9.2.3 Zhen Ding Technology Company Dynamics & News 9.2.4 Zhen Ding Technology Business Operation Conditions Table Business Operation of Zhen Ding Technology (Sales Revenue, Sales Volume, Price, Cost, Gross Margin) 9.3 Unimicron 9.3.1 Unimicron Profile Table Unimicron Overview List 9.3.2 Unimicron Products & Services 9.3.3 Unimicron Company Dynamics & News 9.3.4 Unimicron Business Operation Conditions Table Business Operation of Unimicron (Sales Revenue, Sales Volume, Price, Cost, Gross Margin) 9.4 Young Poong Group 9.4.1 Young Poong Group Profile Table Young Poong Group Overview List 9.4.2 Young Poong Group Products & Services 9.4.3 Young Poong Group Company Dynamics & News 9.4.4 Young Poong Group Business Operation Conditions Table Business Operation of Young Poong Group (Sales Revenue, Sales Volume, Price, Cost, Gross Margin) 9.5 Samsung Electro-Mechanics 9.5.1 Samsung Electro-Mechanics Profile Table Samsung Electro-Mechanics Overview List 9.5.2 Samsung Electro-Mechanics Products & Services 9.5.3 Samsung Electro-Mechanics Company Dynamics & News 9.5.4 Samsung Electro-Mechanics Business Operation Conditions Table Business Operation of Samsung Electro-Mechanics (Sales Revenue, Sales Volume, Price, Cost, Gross Margin) 9.6 Ibiden 9.6.1 Ibiden Profile Table Ibiden Overview List 9.6.2 Ibiden Products & Services 9.6.3 Ibiden Company Dynamics & News 9.6.4 Ibiden Business Operation Conditions Table Business Operation of Ibiden (Sales Revenue, Sales Volume, Price, Cost, Gross Margin) 9.7 Tripod 9.7.1 Tripod Profile Table Tripod Overview List 9.7.2 Tripod Products & Services 9.7.3 Tripod Company Dynamics & News 9.7.4 Tripod Business Operation Conditions Table Business Operation of Tripod (Sales Revenue, Sales Volume, Price, Cost, Gross Margin) 9.8 TTM Technologies 9.8.1 TTM Technologies Profile Table TTM Technologies Overview List 9.8.2 TTM Technologies Products & Services 9.8.3 TTM Technologies Company Dynamics & News 9.8.4 TTM Technologies Business Operation Conditions Table Business Operation of TTM Technologies (Sales Revenue, Sales Volume, Price, Cost, Gross Margin) 9.9 Sumitomo Electric SEI 9.9.1 Sumitomo Electric SEI Profile Table Sumitomo Electric SEI Overview List 9.9.2 Sumitomo Electric SEI Products & Services 9.9.3 Sumitomo Electric SEI Company Dynamics & News 9.9.4 Sumitomo Electric SEI Business Operation Conditions Table Business Operation of Sumitomo Electric SEI (Sales Revenue, Sales Volume, Price, Cost, Gross Margin) 9.10 Daeduck Group
ABOUT US :
Fusion Market Research is one of the largest collections of market research reports from numerous publishers. We have a team of industry specialists providing unbiased insights on reports to best meet the requirements of our clients. We offer a comprehensive collection of competitive market research reports from a number of global leaders across industry segments.
CONTACT US
Email:
Phone:
+(210) 775-2636 (USA)
+(91) 853 060 7487 (APAC)
https://ipsnews.net/business/2021/06/17/calculators-market-improvement-in-technology-is-expected-to-drive-the-growth-of-the-market-forecast-2021-2027/
https://ipsnews.net/business/2021/06/17/desktop-outsourcing-services-market-2021-industry-analysis-size-share-growth-trends-and-forecast-to-2027/
https://ipsnews.net/business/2021/06/17/legal-consulting-market-2021-industry-analysis-size-share-growth-trends-and-forecast-to-2027/
0 notes
Text
Serato Scratch Live Torrent

Scratch Live 2.3.3 (Legacy)
Serato Scratch Live Download Mac
WHAT'S NEW?
If you are using a Rane Sixty-One or Sixty-Two, please download Scratch Live for Rane Sixty-One and Sixty-Two.
Serato Torrent
Added in 2.3.3
2.3.3 is a maintenance release containing many bug fixes, read the release notes for details.
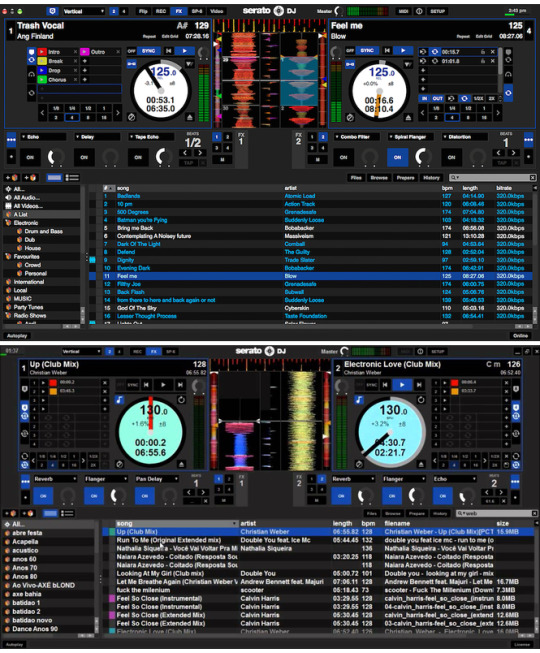
Scratch Live 2.3.3 includes a large rewrite of all MPEG-4 file reading and writing of meta data (tagging data). This includes .mp4, .m4a, .aac and many .mov files. One of these changes involves writing Serato meta data to files in a different way than previous versions of Scratch Live.
Serato Scratch Live 2.5 Download
When playing one of the affected audio files in Scratch Live 2.3.3 for the first time, all existing Serato meta data will need to saved in the new format. Consequently there will be a lot of writing to file, as signified in the status bar.
Scratch Live 2.3.3 will not delete meta data created in previous versions of Scratch Live, however, new meta data created in Scratch Live 2.3.3 will not be able to be read in older versions. Such meta data includes cues, loops etc.
Sep 25, 2012 Serato’s newsletter announcing the upgrades today. In a slew of announcements, Serato today revealed updates to all of its software (apart from the entry-level Serato DJ Intro program). Serato Video 1.1 is the biggest news, with a host of new power features, while Serato ITCH 2.2.2 and Serato Scratch Live 2.4.3 get incremental updates plus compatibility with the new features of Serato Video 1.1. Interoperable with Scratch Live, ITCH, DJ Intro, and iTunes Music Libraries. Serato DJ is concede winning, progressed DJ programming used by specialists over the globe. Serato DJ Pro 2.3.3 Crack is fantastic programming that incorporates all things required to blend and record music like a professional. Garageband download windows vista.
Added in 2.3.0
Cue Point Labels
64-bit drivers for Mac
Better software THRU mode indication for the SL 2, SL 3 and SL 4
Core Audio/ASIO drivers for the SL 3 and Sixty-Eight
Improved Scratch Live user interface layout for minimum screen resolutions
Added native support for the Pioneer CDJ-350
Added native support for the Pioneer CDJ-850
Support for all current Rane Scratch Live hardware (SL 1, SL 2, SL 3, SL 4, TTM 57SL, Sixty-Eight)
Watch the Scratch Live 2.3 Release notes video.
Omnisphere 2 monthly payment. 8 Payments of 59.88 ⚡ Shop Spectrasonics Omnisphere 2 Software Synthesizer only at AMS! Free 2 Day Shipping ⚡ Free Extended Warranty ⚡ Call our Gear Experts at 800-319-9043 for expert advice! Spectrasonics Omnisphere 2.6 Software Omnisphere is the flagship synthesizer of Spectrasonics - an instrument of extraordinary power and versatility. Top Artists all over the world rely on Omnisphere as an essential source of sonic inspiration. Omnisphere 2.6 Features. Creative “Psychoacoustic” sounds from the renowned Spectrasonics sound design team. Sound Lock™ feature gives endless useful variations by locking sound aspects while browsing. Wavetable Synthesis - Each waveform is a Morphing Wavetable. Is Omnisphere 2 worth the $500?? Is there a monthly payment option sorta like Serum has with Splice? Or a student discount? 1 point 2 years ago. No payment plans or student discounts from Spectrasonics. The only way to get it for slightly cheaper is through Guitar Center during sales. Omnisphere 2.6 includes a stunning new “Hardware Library” with over 1,600 new patches created by Eric Persing and the renowned Spectrasonics Sound Development team. Each hardware profile has a corresponding set of sounds in the Hardware Library which were specially designed using that hardware synth as an Omnisphere controller.
Minimum System Requirements
Read the minimum system requirements.
Read the full Scratch Live 2.3.3 release notes.
Making music should be fun, even if you’re making it alone with your Mac. So you can download GarageBand and see how making tracks, sequences, and mixes look and sound like a real band. Looking like a simulator game, this app is quite a tool for composing and arranging your own songs. The core app is free, but you may purchase additional. Here's the way you can.download Garageband for Windows. for free, this method works on Windows 10 hassle free. Install Garageband for PC using this 2020 guide. 6.8 spc.
Latest Version:
TeamViewer Not Working in Windows 10. Windows 10 is running on more than 800 million devices. Recently, I noticed a problem in it: the TeamViewer not working. Many users reported that they can't use it anymore after upgrading systems to Windows 10. There is no connection to partner. The session limit of Teamviewer is reached. Re: Team Viewer NOT Working on Mac Is there a box at the top right of the TeamViewer window for the partner ID? If you don't have the TeamViewer window open, right click the TeamViewer icon on your Doc and select TeamViewer. Teamviewer pc to mac not working windows 7. Feb 13, 2019 Having the same problem on my on my Mac even after following the directions for How to control a Mac running macOS 10.14 Mojave on both apple computers one running MAC OS 14 and one running MacOS 10.13. Team Viewer is the same Version on both computers. Also added Teamview to the Firewall Settings still no keyboard and mouse on remote computer.
Serato DJ Pro 2.3.4 LATEST
Requirements:
macOS 10.13 High Sierra or later
Author / Product:
Serato / Serato DJ Pro for Mac
Old Versions:
Filename:
Serato DJ Pro 2.3.4.pkg
MD5 Checksum:
7f78cd49a798cb98aec243369cacff87
Details:
Serato DJ Pro for Mac 2020 full offline installer setup for Mac
Serato Dj Scratch Live
Serato DJ Pro for Mac delivers all the features and performance to meet the demands of DJs at the top of their game and sets the new standard for controller DJs. Load and customize your choice of high quality FX powered by iZotope including: Delay, Echo, Ping Pong Delay, Reverb, Phaser, Flanger, Distortion, HPF, LPF and a Combo HPF/LPF. Adjust and customize a range of parameters for each effect to shape your sound. Lock your tracks together for seamless grooves. Smart Sync with Beatgrids gives you even more time to get creative. 4 deck mixing has never been better with the ability to create your own special blends of tracks, instrumentals and vocals without the pressure of keeping everything in time too. Less time making it work, more time at the party. Interoperable with Scratch Live, ITCH, DJ Intro and iTunes Music Libraries. Serato DJ for macOS is award winning, digital DJing software used by professionals across the globe. Features and Highlights Virtual decks All the important track information you need is displayed on famous virtual decks. Get live BPM and track time information as well as visual representation of upcoming cue points and playhead position while scratching. Colored waveforms Visualize your tracks with unique EQ colored waveforms. Red for bass, blue for treble and green for mid-range. Never miss an incoming vocal or bass drop. Keep your tracks in time with a simple beat matching display next to waveforms. Full DVS support Use club standard setups with Serato Control Vinyl or CDs for the perfect emulation of real feel DJing. For turntablists there is the unique sticker lock feature to keep your routines super tight. Recording + SP6 Record your full sets in customizable high quality formats, ready to share with your followers online. Trigger DJ stings, loops, acapellas, drops and whole tracks from the SP-6 sample player. Keep up to 24 samples loaded across 4 banks and sync them with your playing tracks. Midi support Add ready-mapped official accessories to your setup. Alternatively connect any MIDI device, or remap your primary device however you like to personalize your performances and increase your productivity. Powerful FX A huge array of customizable DJ FX powered by industry leaders iZotope. From the DJ necessities of Filters, Echoes, and Delays to complex and creative noise synths, dubbed out tape echoes and retro 8-bit audio bending FX. Note: 14-day trial period. Serato DJ is now Serato DJ Pro, a free upgrade for existing DJ users. All supported hardware works too. Also Available: Download Serato DJ Pro for Windows
0 notes
Text
Global Multilayer Printed Circuit Board Market: Growth will Accelerate at CAGR value, SWOT Analysis and EBITA Analysis | Know More
The latest reports contain a deep study of the Global Multilayer Printed Circuit Board market which enables the user to assess the long-term based demand and predicts specific executions. The growth rate which is really estimated depending on the intellectual analysis provides complete information on the worldwide Multilayer Printed Circuit Board industry. The restraints and drivers are actually assembled after total attention to the global Multilayer Printed Circuit Board industry development. Furthermore, several top players in the global market like Nippon Mektron, ZD Tech, TTM Technologies, Unimicron, Sumitomo Denko, Compeq, Tripod, Samsung E-M, Young Poong Group, HannStar, Ibiden, Nanya PCB, KBC PCB Group, Daeduck Group, AT&S, Fujikura, Meiko, Multek, Kinsus, Chin Poon, T.P.T., Shinko Denski, Wus Group, Simmtech, Mflex, CMK, LG Innotek, Gold Circuit, Shennan Circuit, Ellington are also mentioned in the report.
Request an Exclusive “FREE SAMPLE REPORT” of Multilayer Printed Circuit Board Market: https://www.syndicatemarketresearch.com/sample/multilayer-printed-circuit-board-market
(The sample of this report is readily available on request).
The report is decently drafted with the collection of fundamental information particular to the Global Multilayer Printed Circuit Board market, with key components in charge of the demand for its product and benefits. Also, it recognizes the main feature thus as to improve with initial business decisions. The worldwide Multilayer Printed Circuit Board market is expected to reach a CAGR of XX% in the estimated period.
In this report, the Global Multilayer Printed Circuit Board market is estimated at about xx Million USD in 2020 and it is predicted to reach xx Million USD by 2026. As per consumption and production; North America is the largest region within the world, while China is the quickest developing country.
The report features the freshest mechanical developments and new dispatches, which enable the customers to design their store systems, settles on sharp business decisions and execute vital executions.
For Customization & To Know More About This Report, Inquire Here: https://www.syndicatemarketresearch.com/inquiry/multilayer-printed-circuit-board-market
The report points out highly on the modern industrial issues; development, forthcoming policy adjustment, and also striking conceivable outcomes in the business. The regional development techniques and its expectation are really one of the central point that depicts the whole execution and stresses in the key regions and countries such as North America (the USA, Canada), Europe (Western Europe, France, Germany, U.K., Spain, Italy, Eastern Europe), the Middle East & Africa, Asia-Pacific (China, Japan, India, Republic of Korea) and the Rest of Asia-Pacific.
Different angles including details, specifications, generation limit, growth factor, material parameters, product value, demand, supply logistics and chain, profit and loss are comprehensively specified in the article. The Multilayer Printed Circuit Board report turns top to bottom segmentation of the worldwide market in view of various procedures, Product type (Layer 4-6, Layer 8-10, Layer 10+), Application (Consumer Electronics, Communications, Computer Related Industry, Automotive Industry, Other), innovations and strategies.
A few primary components utilized in the Multilayer Printed Circuit Board report are clarified in a simple and easy way to comprehend analysis and receive the most astounding in return. This additionally helps in business development activities for better business prospects, the right figures and graph presentation of vital numerical information. Reports also help to distinguish reliable and promising vendors as well as providers.
This Study Report Offers Following Objectives:
1. Forecast and analysis of the global Multilayer Printed Circuit Board market sales, share, value, status (2016-2018) and forecast (2021-2026). 2. Analyze the regional as well as country level segments, share evolution for Global Multilayer Printed Circuit Board Market. 3. Analysis of global industry-leading manufacturers/players. 4. Define and analyze the market competition landscape, SWOT analysis. 5. Forecasts and analysis of the segments, sub-segments and the regional markets based on the last of 5 years market history. 6. Analysis of the Multilayer Printed Circuit Board market by Type, by Application/end users, and region wise. 7. Forecast and analysis of the Global Multilayer Printed Circuit Board Market Trends, Drivers, Investment Opportunities, Openings, Risk, Difficulties, and recommendations. 8. Analyze the significant driving factors, trends that restrict the market growth. 9. Describe the stakeholder's opportunities in the market by identifying the high-growth segments.
There are 15 Key Chapters Covered in the Global Multilayer Printed Circuit Board Market:
Chapter 1, Industry Overview of Global Multilayer Printed Circuit Board Market; Chapter 2, Classification, Specifications and Definition of Market Segment by Regions; Chapter 3, Industry Suppliers, Manufacturing Process and Cost Structure, Chain Structure, Raw Material; Chapter 4, Specialized Information and Manufacturing Plants Analysis, Limit and Business Production Rate, Manufacturing Plants Distribution, R&D Status, and Technology Sources Analysis; Chapter 5, Complete Market Research, Capacity, Sales and Sales Price Analysis with Company Segment; Chapter 6, Analysis of Regional Market that contains the United States, Europe, India, China, Japan, Korea & Taiwan; Chapter 7 & 8, Multilayer Printed Circuit Board Market Analysis by Major Manufacturers, The Segment Market Analysis (by Type) and (by Application); Chapter 9, Regional Market Trend Analysis, Market Trend by Product Type and by Application: Chapter 10 & 11, Supply Chain Analysis, Regional Marketing Type Analysis, Global Trade Type Analysis; Chapter 12, The Global Multilayer Printed Circuit Board industry consumers Analysis; Chapter 13, Research Findings/Conclusion, Multilayer Printed Circuit Board deals channel, traders, distributors, dealers analysis; Chapter 14 and 15, Appendix and data source of Multilayer Printed Circuit Board market.
To Get Full Information Of The Report With TOC, Visit Here: https://www.syndicatemarketresearch.com/market-analysis/multilayer-printed-circuit-board-market.html
Thanks for reading this report; we can also provide individual topics-wise, chapter or region wise report variants such as North and South America, Europe, the Middle East & Africa, Asia-Pacific.
In this Analysis, the years considered to predict the industry size of Multilayer Printed Circuit Board are as per the following: History Year: 2016-2018 Base Year: 2019 Predicted Year: 2020 Estimate Year 2020 to 2026 For the information data by region, key players, type and application/end users, 2016 is considered as the base year. At whatever point information data was not available for the base year, the earlier year has been considered.
Key Partners:- Multilayer Printed Circuit Board Producers Multilayer Printed Circuit Board Merchants/Dealers/Wholesalers Multilayer Printed Circuit Board Subcomponent Producers Market Association Downstream Sellers
Available Customizations:- With the given market information, We provide modification as indicated by the organization's particular needs. The accompanying customization alternatives are available for the report: • Analysis of the Regional like (North and South America, Europe, the Middle East & Africa, Asia-Pacific) and country-level Multilayer Printed Circuit Board market, by Application/end-user. • Accurate analysis and profiles of other market players.
About Syndicate Market Research:
At Syndicate Market Research, we provide reports about a range of industries such as healthcare & pharma, automotive, IT, insurance, security, packaging, electronics & semiconductors, medical devices, food & beverage, software & services, manufacturing & construction, defense & aerospace, agriculture, consumer goods & retailing, and so on. Every aspect of the market is covered in the report along with its regional data. Syndicate Market Research committed to the requirements of our clients, offering tailored solutions best suitable for strategy development and execution to get substantial results. Above this, we will be available for our clients 24×7.
Contact Us:
Syndicate Market Research 244 Fifth Avenue, Suite N202 New York, 10001, United States +1 347 535 0815 | Email ID: [email protected] Website: www.syndicatemarketresearch.com | Blog: Syndicate Market Research Blog
0 notes
Text
1 Growth Stock to Buy and Hold Forever
Earlier this week PayPal stocks (NASDAQ: PYPL) took a hit after the second quarter earnings report was released. Revenue was $ 6.24 billion, about $ 30 million below Wall Street’s forecast, and PayPal stock fell 8% on the hour.
These losses are sure to sting in the short term, but it is best not to overreact. Instead, take a step back and look at the big picture. From my perspective, PayPal still looks like a smart long-term investment.
Here’s why.
Image source: Getty Images
Great market opportunity
PayPal’s mission is simple: Democratize financial services. To this end, its fintech platform connects buyers and sellers in over 200 markets and enables online, mobile and personal payments. It also facilitates peer-to-peer transfers via Xoom and Venmo and offers personalized shopping experiences via the Honey platform.
In short, PayPal’s business model lies at the intersection of two major trends: digital payments and e-commerce. And both quickly gain traction.
In fact, data from Worldpay shows that digital wallets will account for 52% and 33% of online and in-store payment volumes respectively by 2024. And global e-commerce sales are expected to grow 13% per year over the same period, according to eMarketer.
So how big is PayPal’s market opportunity? Management puts the total payment volume (TPV) at $ 110 trillion. By comparison, PayPal has raised $ 1.1 trillion in TPV over the past 12 months – roughly 1% of its addressable market. That leaves a lot of room for this fintech company to grow.

Image source: Getty Images
Ambitious growth strategy
Recently, PayPal hit the accelerator in its growth strategy. Over the past several years, the company has made several acquisitions and introduced a number of new products and services, each of which adds value to buyers and sellers.
For example, PayPal introduced support for cryptocurrencies last year and now allows mobile users to use tokens like. to buy, sell and finance purchases Bitcoin. It also introduced a buy-it-now-later (Pay in 4) solution that offers consumers an interest-free financing option at the checkout. In both cases, these services have increased engagement.
The company is also aggressively expanding Venmo. In 2020 PayPal has a partnership with Visa to start the Venmo credit card. And earlier this year, the company rolled out business profiles on Venmo that allow merchants to sell through the platform. Taken together, these steps expand PayPal’s ability to monetize the popular mobile app, which now has over 76 million active accounts.
Recently, PayPal launched Zettle in the United States. This platform helps dealers manage sales, reports and inventory in physical and digital locations. And it expands PayPal’s in-store presence, building on the QR code payment feature launched in 2020.
Finally, PayPal recently acquired the Honey rewards platform, the provider of returns solutions Happy Returns and the dispute management specialist Chargehound. Each of these mergers expands PayPal’s ability to participate in trading. For example, Honey’s platform enables the company to engage consumers during the discovery process (i.e., pre-purchase), and Happy Returns enables PayPal to offer post-purchase services.
Taken together, these innovations and acquisitions should help the company capture more of its massive addressable market.
Competitive advantage
PayPal has two key advantages. First, the company has built a widely recognized and trusted brand. PayPal offers free seller protection and fraud prevention services – no other payment company offers this. PayPal also offers buyers purchase protection that allows them to use their digital and mobile wallets with no risk.
This benefit has brought 403 million active users to its platform and helped PayPal grow to an incredible size. And this size is the driving force for the company’s second competitive advantage: a strong network effect.
As more consumers join PayPal, merchants benefit from a wider range of potential buyers; And as more merchants join PayPal, consumers will benefit from more choice of retailers. That positive cycle has been a strong tailwind lately, as demonstrated by PayPal’s solid financial performance.
Metric
2nd quarter 2017 (TTM)
2nd quarter 2021 (TTM)
CAGR
revenue
$ 11.8 billion
$ 23.8 billion
19%
Free cash flow
$ 2.7 billion
$ 4.8 billion
fifteen%
Data source: SEC filings from PayPal, Ycharts. TTM = trailing 12 months. CAGR = average annual growth rate.
Here’s the bottom line: PayPal has a great market opportunity and an effective growth strategy. More importantly, this fintech giant has built a strong moat around its business, making it virtually impossible for a rival to dethrone the company. Together, these details make up a solid investment thesis. So I plan to hold this growth stock forever.
This article represents the opinion of the author who may disagree with the “official” referral position of a premium advisory service from the Motley Fool. We are colorful! Questioning an investment thesis – even one of our own – helps us all think critically about investing and make decisions that will help us get smarter, happier, and richer.
source https://seedfinance.net/2021/08/01/1-growth-stock-to-buy-and-hold-forever/
0 notes
Text
Where do we stand in the equity market cycle?
Sentiments of greed, fear, and confusion are transient in the equity market. The sentiment cycles are permanent.
Most of us have come across the following chart of the sentiment cycle. For those who are uninitiated, the below chart represents the cycle of greed and fear in any asset class with varying degrees of emotions.
Sentiment cycles move from one extreme of greed to another extreme of fear which takes valuations also to extremes from their long-term averages.

At the extreme of greed sentiment (which coincides with steep valuations), the risk-reward ratio of investments is highly unfavorable i.e., lower potential upside with higher potential downside risk.
At the extreme of fear sentiment (which coincides with dirt-cheap valuations), the risk-reward is highly favorable i.e., higher potential upside with lower potential downside risk.
In this blog, I am attempting to understand where do we stand in the current market cycle.
In my previous blog on market cycles, I highlighted the following 5 observations during market peaks:
Retail participation is huge. People with very less knowledge about stocks and most risk-averse FD investors start putting money in equity markets.
Newspaper headlines scream with euphoria about new peaks achieved by markets (and prediction of higher peaks).
There is utter rejection/ridicule of thought or statement that markets can decline by more than 20%.
The majority of the stocks start trading at valuations much above their historical averages.
A melt-up rally (usually more than 50% from the lowest market level in the last one-two-year period).
Now, let us see how many observations points we are checking currently.
Observation 1
Huge Retail Participation: This is something we all have observed in our circle over the past few months. Many of our friends, colleagues, or neighbors who have always preferred FDs and safe investment options have started investing in the stock market – either directly or through mutual funds.
A lot about it has been written in news with data on the surge in new demat/trading accounts being opened in the last 1 year. Some people who were earlier in jobs have now become full-time traders.

According to the industry data, retail participation in stock market trading has gone up from 33% in FY16 to 45% in FY21.
Not just equity, a huge participation of retail can be witnessed in speculative assets like futures & options, and cryptocurrencies to name a few.
Thus, we can safely say, the first point is checked.
Observation 2
Newspaper headline scream with Euphoria: Any regular reader of the business newspapers can validate that the news of strong bull run and predictions of the market achieving further highs are quite regularly over the past few months. Here is the front page of Economic Times, 1st Sept 2021 edition.

Do I need to say more? So, this checks our second observation point.
Observation 3
Complete rejection of any thought of market correction: Relentless market run creates a recency bias in the minds of many people. They assume that the trend over the last few years will continue and any major correction in the market is a distant possibility. That’s why many investors prepare a trap for themselves as any minor correction is looked like an opportunity to invest more and overexpose the portfolio to already expensive valuations. Sometimes, what is considered to be a minor correction snowball into a major correction, and then there is nothing left on the table to take advantage of extremely cheap stock prices.
I used to hear from investors before the covid crash last year that 20% correction is not possible (and that actually didn’t happen for almost 4 years) and I am hearing the same over the past few weeks.
If one has to look at the PE ratio graph, there is an absence of volatility on the downside from long-term averages since 2016. The trend only briefly got disturbed for a few months last year. If we see the period prior to 2016, there was good enough volatility in the market around long-term averages which is how markets normally behave.

Observation 4
Extreme Overall Market Valuations: Market valuations are expensive is very common knowledge now. Though, some might not be knowing how expensive they are and others justifying the case for sustained higher valuations.
Let me share some valuation metrics to get a sense of high expensive today’s markets are.
a) Sensex is currently trading at 30x TTM (trailing twelve months) PE multiple, much above its long-term average of 19-20X. Any investments that are done in Sensex at PEs of more than 25x have delivered abysmal returns even over a 10 years horizon.

b) P/BV multiple is at the highest level in the last 13 years.

c) Indian equity market is the most expensive in the world.

d) Global Market cap to GDP ratio is at a record high. All the observations at market peaks are not just for the Indian markets but it’s a global phenomenon. The global market cap to GDP ratio is the highest in the last 20 years.

Aggressive money printing by central banks has inflated many asset classes all around the world.

Bank of America has projected negative returns over the next 10 years on US Equity Benchmark Index – S&P 500 owing to expensive valuations. You can look at the forecasted return vs actual return till 2011.

Global markets are very closely intertwined with each other. Any decline in US markets will have an impact on all the equity markets globally.
Observation 5
A melt-up rally: The Indian equity market is up 124% from its March low last year. Past two bubble bursts have been preceded by a sharp melt-up rally. How far it will go before the burst is anybody’s guess.

We are mostly checking all 5 observation points which are indicative of market peaks. The observation list is definitely not exhaustive but captures some of the most common key parameters.
Although it is very difficult to put a finger on exactly where we are in the market cycle, my best guess is we are in the zone of euphoria.
Many of us nod in affirmative to the logical sense of investing in the market cycles but most of us continue to invest and not reduce our equity exposure when markets are extremely expensive.
Why most of us do not follow the logical steps of buying low and selling high as represented by market cycles? Why do the majority of people end up investing at high market levels and exit at low market levels? Because we tend to think that emotion of greed & fear affects others and what we are doing makes perfect sense at the moment. And also, the majority of us lack the patience to implement logical investment plans with discipline. Without patience and discipline, long-term investment success is just a mirage.
Unfortunately, emotions of greed and fear of missing out (FOMO) are so strong during a relentless market rally, especially when our friends, neighbors, and strangers are sharing how they have made quick money from the stock market, that our mind starts justifying getting on the bandwagon. Our emotions possess our minds at extremes, take over our ability to think logically and we justify our actions of investing with such reasons:
– The market will not fall. Even if it does, it would be a minor correction and we will be back on the uptrend.
– I am investing for the short term and when I will sense a correction, I will exit immediately.
– This time it is different. High market valuations will sustain for a long time to come.
– I am in for the long term and not bothered by minor short-term corrections.
These are the exact reasons given to justify investing during every market peak and before every market crash.
“History does not repeat itself but it does rhyme.” Mark Twain.
Please note that when we say the markets are in a very expensive zone or closer to their peak, it doesn’t mean that it will correct sooner or it won’t get more expensive. Markets can continue to remain expensive for a long time and reach more dizzying heights. The key point is that any investments at current market valuations have very limited upside potential but very high downside risk.
And guess how many could successfully exit at the very top every time – I am yet to find that person. Perfect exit is an illusion we entertain by overestimating our abilities to time the market. Those who believe in a perfect exit, I wish them good luck.
For others, it’s important to follow a tactical asset allocation plan with utmost discipline to protect the portfolio on the downside and enjoy the upside returns.
Truemind Capital Services is a SEBI Registered Investment Management & Personal Finance Advisory platform. You can write to us at [email protected] or call us on 9999505324.
#mutual funds online in delhi#mutual funds online in noida#SEBI Registered in delhi#mutual fund in delhi#tax saving mutual fund in noida#tax savings mutual fund in Delhi#Start sip in noida
0 notes
Text
Global Multilayer Printed Circuit Board Market Analysis to 2015-2019 and Forecast to 2020-2025 with Key Players
Latest Report on Multilayer Printed Circuit Board Market including Market Landscape, and Market size, Revenues by players, Revenues by regions, Average prices, Competitive landscape, market Dynamics and industry trends and developments during the forecast period.
The global Multilayer Printed Circuit Board Market is broadly analysed in this report that sheds light on critical aspects such as the vendor landscape, competitive strategies, market dynamics, and regional analysis. The report helps readers to clearly understand the current and future status of the global Multilayer Printed Circuit Board Market. The authors of the report profile leading companies of the global Multilayer Printed Circuit Board Market, also the details about important activities of leading players in the competitive landscape.
Key companies operating in the global Multilayer Printed Circuit Board Market include:
· Nippon Mektron
· ZD Tech
· TTM Technologies
· Unimicron
· Sumitomo Denko
· Compeq
· Tripod
· Samsung E-M
Get PDF Sample Copy of the Report to understand the structure of the complete report: @ https://www.planetmarketreports.com/report-sample/global-multilayer-printed-circuit-board-market-5875
The report predicts the size of the global Multilayer Printed Circuit Board Market in terms of value and volume for the forecast period 2020-2026. As per the analysis provided in the report, the global Multilayer Printed Circuit Board Market is expected to rise at a CAGR of xx % between 2020 and 2026 to reach a valuation of US$ xx million/billion by the end of 2026. In 2020, the global Multilayer Printed Circuit Board Market attained a valuation of US$_ million/billion. The market researchers deeply analyse the global Alcohol Packaging industry landscape and the future prospects it is anticipated to create
This publication includes key segmentations of the global Multilayer Printed Circuit Board Market on the basis of product, application, and geography. Each segment included in the report is studied in relation to different factors such as consumption, market share, value, growth rate, and production.
The comparative results provided in the report allow readers to understand the difference between players and how they are competing against each other. The research study gives a detailed view of current and future trends and opportunities of the global Multilayer Printed Circuit Board Market. Market dynamics such as drivers and restraints are explained in the most detailed and easiest manner possible with the use of tables and graphs. Interested parties are expected to find important recommendations to improve their business in the global Multilayer Printed Circuit Board Market.
Segmental Analysis
The report has classified the global Alcohol Packaging industry into segments including product type and application. Every segment is evaluated based on growth rate and share. Besides, the analysts have studied the potential regions that may prove rewarding for the Alcohol Packaging manufacturer’s in the coming years. The regional analysis includes reliable predictions on value and volume, thereby helping market players to gain deep insights into the overall Alcohol Packaging industry.
Global Multilayer Printed Circuit Board Market Segment by Product Type:
· Layer 4-6
· Layer 8-10
· Layer 10+
Global Multilayer Printed Circuit Board Market Segment by Application:
· Smart Packaging
· Smart Cards
· Consumer Electronics
· Medical Devices
· Wearable Devices
· Entertainment
· Wireless Communication
· Others
Competitive Landscape
It is important for every market participant to be familiar with the competitive scenario in the global Alcohol Packaging industry. In order to fulfil the requirements, the industry analysts have evaluated the strategic activities of the competitors to help the key players strengthen their foothold in the market and increase their competitiveness.
Enquire for customization in the Report @ https://www.planetmarketreports.com/enquire-now/global-multilayer-printed-circuit-board-market-5875
Key questions answered in the report:
1. What is the growth potential of the Multilayer Printed Circuit Board Market?
2. Which product segment will grab a lion’s share?
3. Which regional market will emerge as a frontrunner in the coming years?
4. Which application segment will grow at a robust rate? What are the growth opportunities that may emerge in the Alcohol Packaging industry in the years to come?
5. What are the key challenges that the global Multilayer Printed Circuit Board Market may face in the future?
6. Which are the leading companies in the global Multilayer Printed Circuit Board Market?
7. Which are the key trends positively impacting the market growth?
#Multilayer Printed Circuit Board Market Share#Multilayer Printed Circuit Board Market Size#Multilayer Printed Circuit Board Market Industry#Multilayer Printed Circuit Board Market Trends#Multilayer Printed Circuit Board Market Analysis#Multilayer Printed Circuit Board Market Forecast
0 notes
Text
Industrial Traction Equipment Market Potential Growth, Share, Demand and Analysis of Key Players- Research Forecasts to 2027

"
According to a New Research Report Titled Industrial Traction Equipment Market along with supporting figures and facts Forecast by 2021–2027.
This has brought along several changes in This report also covers the impact of COVID-19 on the global market.
The Global Industrial Traction Equipment Market research report to the industry experts and investors, offers business and market-related intelligence that help them make informed decisions based on the current and future trends. The report gives insights into the market size of the global Industrial Traction Equipment Market, market share of major industries functional in the Industrial Traction Equipment Market, segmentation, and growth prospects of the global Industrial Traction Equipment Market. The report discusses all the major sectors which further break down into types, procedures, manufacturing capacities, regional and global market position of the Industrial Traction Equipment Market sector for a more granular view.
The Industrial Traction Equipment market research report highlights the key trends and the factors driving the industry as well as those hindering it. Moreover, it boasts of accurate data pertaining the future growth model of this domain by referencing the past and present business landscape. Further, the document offers a broader perspective by defining the size and shares of the market and its segments, unveiling the top revenue prospects in the process.
Get Sample PDF Copy of Industrial Traction Equipment Market Report with Complete TOC and Figures & Graphs @ https://axelreports.com/request-sample/117796
**Sample pages for this report are accessible upon request.**
Top Companies in Market are: ABB Ltd. Alstom SA Caterpillar Inc. Mitsubishi Electric Corporation Toshiba International Corporation Kawasaki Heavy Industries Ltd. American Traction Systems Bombardier Inc. Crompton Greaves Limited Siemens AG General Electric Company VEM Group TTM Rail - Transtech Melbourne Pty Ltd. Product Type Segmentation : Traction Transformer Traction Motor Traction Converter Application Type Segmentation : Railway Mining Oil and Gas Others
Geographically, the Global Industrial Traction Equipment Market is designed for the following Regional Markets:
North America (USA, Canada and Mexico)
Europe (Germany, France, UK, Russia and Italy)
Asia-Pacific (China, Japan, Korea, India and Southeast Asia)
South America (Brazil, Argentina, Colombia etc.)
Middle East and Africa (Saudi Arabia, UAE, Egypt, Nigeria, and South Africa)
The business intelligence study on global Industrial Traction Equipment Market presents valuable insights such as:
CAGR of the market during the forecast period 2021-2027.
Detailed information on factors that will assist Industrial Traction Equipment market growth during the next five years.
Estimation of the Industrial Traction Equipment market size and its contribution to the parent market.
Predictions on upcoming trends and changes in consumer behavior.
The growth of the Industrial Traction Equipment market.
Analysis of the market’s competitive landscape and detailed information on vendors.
Comprehensive details of factors that will challenge the growth of Industrial Traction Equipment market vendors.
Key Highlights of the TOC provided by AxelReports:
1. Global Industrial Traction Equipment Market Overview
2. Global Industrial Traction Equipment Market Competitions by Manufacturers
3. Global Industrial Traction Equipment Capacities, Production, Revenue (Value) by Region
4. Global Industrial Traction Equipment Supply (Production), Consumption, Export, Import by Region
5. Global Industrial Traction Equipment Productions, Revenue (Value), Price Trend by Type
6. Global Industrial Traction Equipment Market Analyses by Application
7. Global Industrial Traction Equipment Manufacturers Profiles/Analysis
8. Industrial Traction Equipment Manufacturing Cost Analysis
9. Industrial Chain, Sourcing Strategy and Downstream Buyers
11. Market Effect Factors Analysis
12. Global Industrial Traction Equipment Market Forecast
13. Research Findings and Conclusion
14. Appendixes
Share Your Queries @ https://axelreports.com/enquiry-before-buying/117796
Please contact us if you would like more information about the report. If you have any special requirements and would like customization, please let us know. We will then offer the report as you wish.
ABOUT Axel Reports:
Axel Reports has the most comprehensive collection of market research products and services available on the web. We deliver reports from virtually all major publications and refresh our list regularly to provide you with immediate online access to the world’s most extensive and up-to-date archive of professional insights into global markets, companies, goods, and patterns.
Contact: Axel Reports Akansha G (Knowledge Partner) Office No- B 201 Pune, Maharashtra 411060 Phone: US +18488639402
Email: [email protected]
"
0 notes
Text
High-Density Interconnect Printed Circuit Board Market Opportunities Assessment 2021 to 2026
A high-density interconnect (HDI) is the fastest growing technology used in the printed circuit board (PCB) than the conventional circuit boards. Some components help in reducing signal loss and crossing delays. Shorter distance between electronic components and the small size of the components helps to transmit signals from one part to another. Among the various technologies used in the printed circuit board (PCB), a High-Density Interconnect (HDI) is the fastest growing technology with higher wire density than the conventional or traditional circuit board. It works more effectively and efficiently rather than the conventional interconnection. These HDI Printed Circuit Boards have finer lines and spaces, smaller components, and capture pads. Therefore, they are widely adopted in the consumer electronics sector and have a high growth potential in the automotive industry.
Get the inside scoop of the Sample report For FREE:https://www.kdmarketinsights.com/sample/7039
The High-Density Interconnect Printed Circuit Board (HDI PCB) market seems to be promising with wide-scale usage in smartphone, computer, telecommunication, consumer electronics, and automotive industries. Some emerging trends have directly impacted the HDI PCB Industry, includes minimizing electronic devices and increasing demand for low high-speed HDI PCBs.
Globally, the High-Density Interconnect (HDI) Printed Circuit Board (PCB) market is expected to grow to USD 17,600.6 million by 2026. HDI PCB has a higher density than a traditional PCB, allowing designers to place more components on an HDI PCB.
In this market, smartphones & tablets is the largest segment by end-use, whereas 4-6 layer HDI PCB is the largest by technology.
High Density Interconnect Printed Circuit Board Market Segmentation:
By End Use:
Smartphone
Computer
Telecommunication Equipment
Consumer Electronics
Automotive
By Product Layer:
4-6 layers
8-10 layers
10+ layers
By Region:
North America (U.S. & Canada)
Europe (Germany, United Kingdom, France, Italy, Spain, Russia and Rest of Europe)
Asia Pacific (China, India, Japan, South Korea, Indonesia, Taiwan, Australia, New Zealand and Rest of Asia Pacific)
Latin America (Brazil, Mexico, Argentina and Rest of Latin America)
Middle East & Africa (GCC, North Africa, South Africa and Rest of the Middle East & Africa)
Request For Customization –https://www.kdmarketinsights.com/custom/7039
Regional Insights:
HDI PCB market segmented into North America, Europe, Asia Pacific, Latin America, and Middle East & Africa based on regional market shares.
North America captured largest share in HDI PCB market. This region is considered the most advanced region in terms of developing and adopting innovative technologies. Among various countries in North America region, the US is one of the major dominant in the market and expected to be a dominating country in the HDI PCB market in the upcoming future and with their advanced technologies and developments over the period. They showed a significant rise in the advancement of technologies in every segment. Taking the perspective of automotive and consumer electronics industry end users, this region
has a significant potential to generate huge revenues in the HDI PCB market which resulted in their growth.
Furthermore, Asia-Pacific is expected to at the fastest rate. There are some of the driving factors for the HDI PCB market in the region, such as availability of low cost technologies and presence of many electronic devices manufacturing firms in the region. Asia Pacific region also contributes towards the revenue generation of this market across the globe. Meanwhile, the leading countries in this region are India , Japan and China. Market also expected to receive this kind of share from this region and these countries from contributing in similar manner in upcoming future.
Latin America is also envisioned to contribute to the betterment and growth of HDI PCB market during the forecast period.
Key Players:
LLC (US)
TTM Technologies (US)
PCBCART (China)
Millennium Circuits Limited (US)
RAYMING (China)
Mistral Solutions Pvt. Ltd. (India)
SIERRA CIRCUITS, INC. (US)
Advanced Circuits (US)
FUJITSU INTERCONNECT TECHNOLOGIES LIMITED (Japan)
Other Key Players
Request For Discount -https://www.kdmarketinsights.com/discount/7039
About KD Insights
KD Market Insights offers a comprehensive database of syndicated research studies, customized reports, and consulting services. These reports are created to help in making smart, instant, and crucial decisions based on extensive and in-depth quantitative information, supported by extensive analysis and industry insights.
Our dedicated in-house team ensures the reports satisfy the requirement of the client. We aim at providing value service to our clients. Our reports are backed by extensive industry coverage and is made sure to give importance to the specific needs of our clients. The main idea is to enable our clients to make an informed decision, by keeping them and ourselves up to date with the latest trends in the market.
Contact Us:
KD Market Insights
150 State Street, Albany,
New York, USA 12207
+1 (518) 300-1215
Email: [email protected]
Website: www.kdmarketinsights.com
1 note
·
View note
Text
Global TPU Films Market
The report forecast global TPU Films market to grow to reach xxx Million USD in 2019 with a CAGR of xx% during the period 2020-2025 due to coronavirus situation. The report offers detailed coverage of TPU Films industry and main market trends with impact of coronavirus. The market research includes historical and forecast market data, demand, application details, price trends, and company shares of the leading TPU Films by geography. The report splits the market size, by volume and value, on the basis of application type and geography. First, this report covers the present status and the future prospects of the global TPU Films market for 2015-2024. And in this report, we analyze global market from 5 geographies: Asia-Pacific[China, Southeast Asia, India, Japan, Korea, Western Asia], Europe[Germany, UK, France, Italy, Russia, Spain, Netherlands, Turkey, Switzerland], North America[United States, Canada, Mexico], Middle East & Africa[GCC, North Africa, South Africa], South America[Brazil, Argentina, Columbia, Chile, Peru]. At the same time, we classify TPU Films according to the type, application by geography. More importantly, the report includes major countries market based on the type and application. Finally, the report provides detailed profile and data information analysis of leading TPU Films company.
Key Content of Chapters as follows (Including and can be customized) : Part 1: Market Overview, Development, and Segment by Type, Application & Region Part 2: Company information, Sales, Cost, Margin etc. Part 3: Global Market by company, Type, Application & Geography Part 4: Asia-Pacific Market by Type, Application & Geography Part 5: Europe Market by Type, Application & Geography Part 6: North America Market by Type, Application & Geography Part 7: South America Market by Type, Application & Geography Part 8: Middle East & Africa Market by Type, Application & Geography Part 9: Market Features Part 10: Investment Opportunity Part 11: Conclusion
Market Segment as follows: By Region Asia-Pacific[China, Southeast Asia, India, Japan, Korea, Western Asia] Europe[Germany, UK, France, Italy, Russia, Spain, Netherlands, Turkey, Switzerland] North America[United States, Canada, Mexico] Middle East & Africa[GCC, North Africa, South Africa] South America[Brazil, Argentina, Columbia, Chile, Peru] Key Companies Covestro AG Huntsman Corporation Erez Europe Novotex Italiana S.p.A. Bond-A-Band Transmission Limited Permali Gloucester Limited DUNMORE 3M Evermax Eco Redwood TTM Ltd Wiman Corporation and PROCHIMIR SAS Market by Type Polyester TPU Films Polyether TPU Films Polycaprolactone TPU Films Market by Application Automotive and Transportation Building and Construction Aerospace Footwear Energy
for sample report please visit : https://www.statzyreports.com/report/SR158042/COVID-19-Version-Global-TPU-Films-Market-Status-2015-2019-and-Forecast-2020-2025-by-Region-C-Product-Type--6-End-Use
CONTACT US
PHONE NUMBER (IN)- +8484035727 (US)- +12094187979
EMAIL ADDRESS
EMAIL:[email protected] EMAIL:[email protected]
0 notes
Photo

Reposted from @shopeepay_id Emang yaaa, belanja di Alfamart & Alfamidi paling mantap kalau pakai ShopeePay! 🤤 Abisnya mulai dari PROMO SERBA, MURMER, sampai TTM, semua bisa kamu dapetin dan tentunya bikin kamu makin hemat! Seru banget, kaaan? Yuk, langsung ke gerai Alfamart dan Alfamidi terdekatmu sekarang juga buat nikmatin promonya! S&K: 1. Khusus pembayaran di tempat menggunakan ShopeePay 2. Untuk Promo TTM: Min. transaksi Rp50.000 (tidak termasuk susu bayi <1 tahun, minyak goreng, rokok dan produk Promo TTM) 3. Untuk Promo MURMER: Transaksi min. Rp10.000 (tidak termasuk susu bayi <1 tahun & rokok) 4. Harga berlaku untuk 1 (satu) barang/transaksi/struk dan dapat berbeda di setiap wilayah 5. Maks. 5 transaksi/pengguna/periode #Alfamart #Alfamidi #ShopeePay #Shopee #PromoShopee #PromoShopeePay #InfoPromo #kediripromo #promokediri #hambapromo #cashbackkediri @kediripromo #giladiskonkediri #hambadiskon #mantapmantap ______________________________________________________ Yuk! download aplikasi " 𝗛𝗮𝗺𝗯𝗮 𝗣𝗿𝗼𝗺𝗼 " 1 aplikasi, 1x klik ribuan promo bisa diakses... 🔻🔻🔻 - Link download aplikasi 𝙝𝙩𝙩𝙥𝙨://𝙬𝙬𝙬.𝙠𝙚𝙙𝙞𝙧𝙞𝙥𝙧𝙤𝙢𝙤.𝙤𝙣𝙡𝙞𝙣𝙚 - Katalog Promo UpToDate24jam 𝙝𝙩𝙩𝙥𝙨://𝙬𝙬𝙬.𝙝����𝙢𝙗𝙖𝙥𝙧𝙤𝙢𝙤.𝙘𝙤𝙢 ______________________________________________________ 𝙁𝙤𝙡𝙡𝙤𝙬 : @hambapromo @makanmantapmantap https://www.instagram.com/p/CJsiIkKlU6I/?igshid=1ol7kdrzfrkq0
#alfamart#alfamidi#shopeepay#shopee#promoshopee#promoshopeepay#infopromo#kediripromo#promokediri#hambapromo#cashbackkediri#giladiskonkediri#hambadiskon#mantapmantap
0 notes
Text
Global Multilayer Printed Circuit Board Market Outlook, Prospect and Future 2020-2026
Summary – A new market study, titled "Global Multilayer Printed Circuit Board Market 2020 by Manufacturers, Regions, Type and Application, Forecast to 2025" has been featured on WiseGuyReports.
Market Overview
The global Multilayer Printed Circuit Board market size is expected to gain market growth in the forecast period of 2020 to 2025, with a CAGR of 1.8% in the forecast period of 2020 to 2025 and will expected to reach USD 26410 million by 2025, from USD 24570 million in 2019.
The Multilayer Printed Circuit Board market report provides a detailed analysis of global market size, regional and country-level market size, segmentation market growth, market share, competitive Landscape, sales analysis, impact of domestic and global market players, value chain optimization, trade regulations, recent developments, opportunities analysis, strategic market growth analysis, product launches, area marketplace expanding, and technological innovations.
Also read – http://www.digitaljournal.com/pr/4551979
Market segmentation
Multilayer Printed Circuit Board market is split by Type and by Application. For the period 2015-2025, the growth among segments provide accurate calculations and forecasts for sales by Type and by Application in terms of volume and value. This analysis can help you expand your business by targeting qualified niche markets.
By Type, Multilayer Printed Circuit Board market has been segmented into Layer 4-6, Layer 8-10, Layer 10+, etc.
By Application, Multilayer Printed Circuit Board has been segmented into Consumer Electronics, Communications, Computer Related Industry, Automotive Industry, Other, etc.
Regions and Countries Level Analysis
Regional analysis is another highly comprehensive part of the research and analysis study of the global Multilayer Printed Circuit Board market presented in the report. This section sheds light on the sales growth of different regional and country-level Multilayer Printed Circuit Board markets. For the historical and forecast period 2015 to 2025, it provides detailed and accurate country-wise volume analysis and region-wise market size analysis of the global Multilayer Printed Circuit Board market.
The report offers in-depth assessment of the growth and other aspects of the Multilayer Printed Circuit Board market in important countries (regions), including United States, Canada, Mexico, Germany, France, United Kingdom, Russia, Italy, China, Japan, Korea, India, Southeast Asia, Australia, Brazil and Saudi Arabia, etc. It also throws light on the progress of key regional Multilayer Printed Circuit Board markets such as North America, Europe, Asia-Pacific, South America and Middle East & Africa.
Competitive Landscape and Multilayer Printed Circuit Board Market Share Analysis
Multilayer Printed Circuit Board competitive landscape provides details by vendors, including company overview, company total revenue (financials), market potential, global presence, Multilayer Printed Circuit Board sales and revenue generated, market share, price, production sites and facilities, SWOT analysis, product launch. For the period 2015-2020, this study provides the Multilayer Printed Circuit Board sales, revenue and market share for each player covered in this report.
The major players covered in Multilayer Printed Circuit Board are: Nippon Mektron, Samsung E-M, Unimicron, ZD Tech, Tripod, TTM Technologies, HannStar, Compeq, Sumitomo Denko, Young Poong Group, AT&S, Multek, Ibiden, Chin Poon, Fujikura, Daeduck Group, Nanya PCB, Kinsus, Meiko, KBC PCB Group, LG Innotek, T.P.T., CMK, Mflex, Shennan Circuit, Simmtech, Ellington, Shinko Denski, Gold Circuit, Wus Group, etc. Among other players domestic and global, Multilayer Printed Circuit Board market share data is available for global, North America, Europe, Asia-Pacific, Middle East and Africa and South America separately. Global Info Research analysts understand competitive strengths and provide competitive analysis for each competitor separately.
The content of the study subjects, includes a total of 15 chapters:
Chapter 1, to describe Multilayer Printed Circuit Board product scope, market overview, market opportunities, market driving force and market risks.
Chapter 2, to profile the top manufacturers of Multilayer Printed Circuit Board, with price, sales, revenue and global market share of Multilayer Printed Circuit Board in 2018 and 2019.
Chapter 3, the Multilayer Printed Circuit Board competitive situation, sales, revenue and global market share of top manufacturers are analyzed emphatically by landscape contrast.
Chapter 4, the Multilayer Printed Circuit Board breakdown data are shown at the regional level, to show the sales, revenue and growth by regions, from 2015 to 2020.
Chapter 5, 6, 7, 8 and 9, to break the sales data at the country level, with sales, revenue and market share for key countries in the world, from 2015 to 2020.
Chapter 10 and 11, to segment the sales by type and application, with sales market share and growth rate by type, application, from 2015 to 2020.
Chapter 12, Multilayer Printed Circuit Board market forecast, by regions, type and application, with sales and revenue, from 2020 to 2025.
Chapter 13, 14 and 15, to describe Multilayer Printed Circuit Board sales channel, distributors, customers, research findings and conclusion, appendix and data source.
For more details - https://www.wiseguyreports.com/reports/4781947-global-multilayer-printed-circuit-board-market-2020-by
About Us:
Wise Guy Reports is part of the Wise Guy Research Consultants Pvt. Ltd. and offers premium progressive statistical surveying, market research reports, analysis & forecast data for industries and governments around the globe.
Contact Us:
NORAH TRENT
Ph: +162-825-80070 (US)
Ph: +44 2035002763 (UK)
0 notes
Text
CICC: Is there still space for the valuation of video game companies?
The current marketplace debate on game companies primarily lies in whether the valuation of the game sector nevertheless has room for more improvement. At present, the domestic market mainly evaluates A-share video game companies based on the price-to-earnings ratio (PE). Judging from the historic changes of PE (TTM, arithmetic typical), the valuation of the overall game sector reaches a relatively low historical degree; from the evaluation of varied sectors in the horizontal path, the valuation of the game sector is at top of the middle level. Judging from the valuation degree in 2020, the forecasted P/E ratio of the overall game sector in 2020 is 28 occasions, and the PEG is 0.6. We in comparison overseas sport companies and found that domestic video game companies are in a higher-velocity development phase, their income stability has improved significantly in comparison to before, PEG is at a low degree, and valuations have more area for restoration. What is the procedure of valuation advancement of A-share video game companies? China's game business has experienced twenty years of growth, and the marketplace scale is constantly expanding. By 2019, China's game marketplace revenue exceeded RMB 230 billion. From the perspective of driving aspects, technical breakthroughs, gameplay innovations, business design innovations and tale innovations possess promoted the development of the overall game industry. Among them, technical breakthroughs have caused fundamental changes in the form of game items and the optimization of gamer experience; innovation in gameplay has taken new game forms and explosions; creativity in business versions has enabled games to enter the free of charge era from transaction, growing the scope of customers; Story creativity drives the emergence of many strong IP products. _ Chart: The development background of China's sport market (divided by video game form)_ _ Source: Gamma Information, Game Functioning Committee of China Music and Digital Association, International Information Corporation, CICC Analysis Department Note: Before 2008, the market size data was lacking. The end game, page video game and mobile video game era were divided into tough divisions, considering the rise of new forms, but additionally, there are other styles of products. There are also end game items in the web page game era. _ From the perspective of the development procedure for A-share game companies, the market value of domestic game companies is growing in volatility. From the viewpoint of the growth characteristics of different intervals, China's game business has gone through three development periods: from payment to F2P (absolve to play) design innovation period, end-to-end technology breakthrough period, and population brought about by the scale of users The bonus period is currently entering the 4th period in which ARPU boosts to operate a vehicle industry growth. _ Chart: Valuation of A-share sport listed companies _ _ Source: Wind Info, organization announcements, CICC Research Note: In 2010 2010, Zhongqingbao, the first A-share game organization, was outlined. The market capitalization and PE (TTM, weighted typical of market capitalization) of 32 game companies have been counted since 2010, and the period of time when PE (TTM) is unfavorable is excluded. Businesses that have transformed their sport business from various other businesses will undoubtedly be contained in the statistics from the time they complete the asset reorganization. The market value and PE figures are by June 24, 2020. _ In a horizontal comparison, the existing valuation of the game sector reaches the upper middle degree. At the existing time (June 24), the average price-to-earnings ratio (TTM, arithmetic average) of 32 A-share game businesses is around 44 situations (excluding negative ideals). Compared with other sub-sectors (CITIC classification), this valuation level Ranked 8th, less than the pc, electronics, medicine, communications along with other sectors, and comparable to the meals and beverage sectors. In a vertical evaluation, the existing valuation of the game sector is leaner than the historical standard. As of June 24, the P/Electronic ratio (TTM, arithmetic average) of the gaming sector has been lower than the historical average. However, the overall sector has progressively recovered from the downturn before 2H19, and the valuation level is in the process of improving. _ Chart: The price-to-earnings ratio (TTM, arithmetic average) of the game industry ranks 8th inside the CITIC sub-sector, less than the computer, electronics along with other sectors, and comparable to the food and beverage sectors _ _ Source: Wind Info, CICC Research Note: Select the closing cost on June 24, 2020 for calculation. You can find 32 businesses in the game industry, and 14 companies with adverse PE (TTM) are excluded. Media-game PE is the remaining 18 companies PE (TTM, arithmetic average)_ __ _ Chart: P/Electronic ratio (TTM, arithmetic typical) of the overall game sector _ _ Source: Wind Info, CICC Research Note: Calculated based on the closing price on June 24, 2020. There are always a total of 32 businesses in the overall game industry, and 14 businesses with negative PE (TTM) are usually excluded, and the overall game PE may be the remaining 18 businesses PE (TTM, arithmetic average)_ Compared with overseas, what is the valuation degree of the A-reveal game sector? We compared the valuation techniques of game businesses in mature abroad markets. Currently, 9 overseas head game companies have comparable P/Electronic ratios to those of A-share video game companies, but the 2020 PEG of overseas head game companies is 3.1, that is significantly greater than the 0.6 PEG level of A-shares. We believe that when comparing domestic and abroad game companies, taking into consideration the different growth prices of the game marketplace at different development levels, PEG is a appropriate valuation indicator than PE. Taking into consideration the growth price of the domestic video game market higher than abroad, we think that there's still area for enhancement in the valuation of the domestic sport sector. At the moment, the main reason investors come to mind about the valuation boost is the be worried about the instability of the income growth of sport companies. _ Chart: 2020 PE and PEG of 9 representative abroad game companies_ _ Supply: Bloomberg, CICC Research Take note: PE and PEG are usually calculated based on the closing price on June 30, 2020. The 9 companies are usually Activision Blizzard (ATVI), Electronic Arts (EA), Take-Two Interactive (TTWO) in the usa; Nintendo (7974), Nexon Corporation (3659), CAVE Interactive Co., Ltd. (3760) in Japan. ); South Korea's NCSoft (036570), Netmarble (251270), PearlAbyss (263750). _ What is the driving force for the upsurge in income balance of overseas game companies?

Right after discussing the factors that improve the income stability of three overseas head game companies Activision Blizzard (ATVI), Electronic Arts (EA) and Take Two (TTWO), we think that overseas head game companies adopt three methods: 1) Income diversification, including upsurge in quantity, diversified types, and growth of overseas marketplaces; Diversified quantity: create a product matrix Large overseas game manufacturers steadily to push out a selection of games every year, which EA includes a large number of products. Before 2013, EA will release a lot more than 20 new games each year, giving the company an extremely diversified product portfolio; since 2014, the amount of items of the company has declined slightly, but it nevertheless maintains the discharge rhythm of more than 10 items each year . The large number of game products makes the company not overly reliant on an individual explosive item, smoothing the volatility of efficiency. Diversified categories: multi-category products satisfy differentiated needs From a global perspective, gamers have diversified demands for the categories of game products. According to Sensor Tower data, the very best three game classes for global income in 2019 had been role-playing, activity and strategy video games, and each of the three sorts had revenues greater than $14 billion. Consequently, for game companies, by way of a diversified item category matrix, the dangers of a single category due to changes in participant tastes can be dispersed as much as possible. Take EA as an example. The forms of new products released by EA in the past three years have protected sports, existence simulation, shooting, Work and other product types. _ Chart: Income distribution of worldwide mobile game market in 2019 _ __ Source: SensorTower, CICC Study __ __ _ Chart: Distribution of downloads inside the global cellular game market inside 2019 ___

_ Supply: SensorTower, CICC Analysis Department_ Regional diversification: income increase and volatility smooth Overseas markets aren't only a significant income source, but also enhance the stability of income. The global video game marketplace is undergoing quick development. In accordance with Newzoo data, the four major regions of Asia Pacific, North America, Latin America, European countries, the center East, and Africa accounted for 47%, 26%, 4%, and 23% of revenue in 2019. For game businesses, it really is of excellent significance to seize abroad markets beyond their countries and regions: 1) Increase revenue sources. Both Activision Blizzard and EA's revenue from markets beyond THE UNITED STATES accounted for more than 50% in 2019; 2) Services After R&D, developers can very first publish in a particular market and observe marketplace feedback to regulate and optimize; 3) Through the use of the gradual launch of exactly the same product in different regions, game businesses can control and simple the income fluctuations the effect of a single product. _ Chart: Income distribution by area in the global game market _ _ Source: Newzoo, CICC Analysis Department_ 2) IP serialization, on the one hands, the aged IP is constantly updated to attract buys, on the other hand, a number of sequels are launched to create some products; For producers, the growth of new games to the market is a high-investment, high-danger, and time-consuming process. As well as the quality of the merchandise itself, well-recognized IPs can 1) greatly increase the visibility of services and raise the success price of products; 2) reduce the period and resources required to promote new products by accepting the target audience of the original IP; 3) continue steadily to launch well-recognized IPs. Realize the linkage of brand-new and old video games; 4) Serialization may bring positive suggestions on user period and sales, and further promote continuous investment in study and growth by game developers. Therefore, forming a serialized matrix of products developed is becoming a significant development path for game businesses. _ Chart: Sport IP serialization provides positive feedback ramifications of user time and sales _ _ Supply: Activision Blizzard's annual report, CICC Analysis Department_ 3) Long-term operation of star solitary products, star products bring continuous earnings every year, and the proportion of income from head items is stable, which improves the balance of its income growth. As the game industry matures, the heading and concentration of products has gradually become a trend. In accordance with NPD data, through the time period 2009-2019, the proportion of top 10 sales games in the usa has gradually enhanced, and the heading trend of the overall game business continues. For that reason, for game companies, the creation of head items, while preserving a well balanced flow of head products through content iteration and growth updates, can form a stable and considerable income source. The long-term operation of the head series products has brought continuous and stable income to video game manufacturers. Is there still room for the valuation of A-share video game companies? We discovered that A-share game businesses have made progress in diversification, IP serialization, and long-term operation of star solitary products, and the revenue stability of some companies has improved significantly. Among them, there are always a large numbers of Sanqi Mutual Amusement products. Since 2018, the business has created a variety of games each year. The company stated that it will produce more than 50 products in 2020; Perfect World continues to discover the growth of IP series, except for end-to-end items such as "Perfect In addition to the success of "Globe" and "New Swordsman", the business can be actively deploying IP-based terminal video games, mobile video games, and console video games product matrix; Gigabit is founded on the star item "Wendao Mobile Video games", through continuous variations Iteration and concentrate on player experience have shaped a well balanced income base. In addition, because of the higher proportion of mobile games in the domestic marketplace, mobile video games have higher frequency and much more continuous transaction behavior than terminal video games and console video games, and so are more inclined to consumer items. Therefore, we think that domestic sport companies have stronger consumption Attributes will undoubtedly be better with regards to income balance. We think that in the future, as the balance of game companies' revenue growth raises, the PEG of A-share game companies will gradually increase, and the valuation center is likely to move upward.

We synthesized the evaluation criteria for domestic and foreign businesses, compared the scores of three domestic top game businesses, and obtained their reasonable PEG levels. From the viewpoint of longer-term business advancement determinants, we think that the improvement of the long-term valuation middle of the A-share game sector originates from more macro factors, such as technological breakthroughs (innovative systems such as cloud games), model development (monetization or marketing We have been optimistic about the long-term growth potential of the overall game market due to the long-term development potential brought by the market space (the upsurge in user level and payment consciousness). _ Chart: Sanqi Mutual Enjoyment, Perfect Planet and Gigabit Income Balance Evaluation Dimensions _ _ Source: Organization announcement, CICC Study Department_ __ _ Chart: Assessment of Sanqi Mutual Entertainment, Perfect Entire world and Gigabit ___ _ Source: CICC Analysis Department_ _ Chart: Current A-share and overseas game company PEG comparison _ _ Source: Bloomberg, Wind Information, business announcements, China Corporate Research Note: The PE and PEG of the 32 A-share game companies in 2020 are usually both Wind consensus targets, and g is an inverse value. In 2020, the PE and PEG of 9 abroad game companies are Bloomberg consensus anticipation, and g is the inverse value. In 2021, the PE of 9 overseas game companies is usually Bloomberg's consensus, g can be Bloomberg's consensus of the growth rate of net income of 9 businesses, and PEG may be the calculated value of PE/g. _ __ risk The macroeconomic downturn affects entertainment expenditures. The release of new games is sluggish, the overall performance of online game products isn't as expected, the improvement of version quantity acquisition is not as expected, the improvement of overseas market expansion will be slower than expected, and the overall game industry policy risks. Article Source This short article is excerpted from: "Is there still room for the valuation of game companies?" published on July 8, 2020. --Dialogue on PEG from the global perspective Zhang Xueqing CFA SAC Practice Certificate Amount: S0080517090001 SFC CE Ref: BNC281 Wen Hanjing SAC Practice Certificate Number: S0080119080029 Legal Notices Swipe up to see the total legal declaration and BlockchainLink
0 notes