#shewhart
Explore tagged Tumblr posts
Visit Tumblr Blog
Explore Tumblr blogs with no restrictions, modern design and the best experience.
Last Seen Tumblr Blogs


Fun Fact
25% of US internet users with an annual income of $80-100K use Tumblr.
Text
What is the "PDCA thinking model🤔❓️"
We firmly believe that we should think about problems in different ways to cope with this ever-changing world. Therefore, we translate the wisdom of our predecessors into "visual language" to provide a visual thinking formula for solving problems.
The PDCA cycle was first proposed by Walter A. Shewhart, an American quality management expert. It was adopted and promoted by Deming and thus became widely known, so it is also called the Deming Cycle. In life and work, when we face every matter, we first make a plan, then execute the plan, receive feedback during the execution process and reflect on it, and then modify the original plan and act. This is not the end. We continue to repeat the cycle of Plan (planning), Do (execution), Check (inspection), and Act (processing). The PDCA cycle is widely used in areas such as personal growth optimization, enterprise brand optimization, and product quality management, with the aim of ensuring the achievement of reliability goals and promoting continuous quality improvement.
0 notes
Text
¶ … Quality Standards Data Quality Standards This paper examines the different ways of assessing the quality of clinical trial data submitted for regulatory purposes compared to data submitted for academic publication. Researchers and pharmaceutical firms do clinical trials for the purposes of collecting data and sharing with industry, scholars and regulators to help make policies and decisions about the efficacy/safety of illness, disease or preventative drugs being studied. To make sure that researchers are adhering to protocol and best practices in their investigations, sponsors of such studies often monitor these trials in one way or the other (Quality Management in Clinical Trials, n.d). The main objectives of monitoring are to guarantee patient safety and the integrity of the collected data. Monitoring could entail spontaneous visits during the study so as to check on the progress. One of the most important documents in clinical trials is the CSR (Clinical Study Report). This document contains a summary of all important information related to the study. The CSR contains: researcher information, the research design, sample case report forms, statistical analyses, tables, publications and other data related to the issue being investigated. The CSR is presented to regulators after the conclusion of a study. Any questionable data is often removed from the efficacy part of the examination; to increase the reliability of the analysis, the investigators must, however, explain why the data was removed (Quality Management in Clinical Trials, n.d). The removed information may still be utilized in calculating the safety of the product. In several cases, study analyses are done with the questionable data and without it, so as to offer regulators with both analyses for deliberations. The processes used for gathering the data should be clear so as to provide regulators with insight into the ethical aspect of the study. A good quality assurance program can help ensure that risks are prevented. The Shewhart model is one of the best quality assurance guides in the market. The model's effectiveness is evident in the fact that it has been adopted by several pharmaceutical giants, including Pfizer. All across the globe, the key steps of quality assurance in clinical trials are: plan, do, check and act. This is the approach I would take to assess the quality of clinical trial data submitted for regulatory approval. Clinical Trial Data Submitted for Academic Publications Many firms in the pharmaceutical industry prefer restricted and voluntary clinical trials and reporting. Many drug giants have had mixed reactions to the call for increased clinical reporting. This has in the recent years increased the interest of lawmakers and agencies, such as the FDA, leading to several of them volunteering to release to the public, portions of their clinical trials data (Williams, 2007). In late 2004, AMA delegates committed to take all necessary action to protect the rights of investigators and physicians to disseminate clinical trials data. In June of the next year, AMA recommended that the HHS should establish a central clinical trials registry. The organizations also recommended that institutional review boards should make registration in the new central database a condition before giving the go ahead for trials to commence. Noting the recommendations by AMA senators, Chris Dodd and Tim Johnson wrote a letter to the directors of FDA and NIH, calling for a national registry. In 2006, the AAMC decision making organ approved a number of principles to facilitate the analysis and publication of clinical research data. The principles include: trials have to be registered with ICMJE within three weeks of their outset, investigators have an ethical duty to make their findings public and sponsor-contracts should require the publishing of results. This is how I will assess the quality of clinical data submitted for academic publication. References (n.d.). Pfizer: One of the world's premier biopharmaceutical companies. Quality Management in Clinical Trials. Retrieved February 17, 2016, from http://www.pfizer.com/sites/default/files/research/research_clinical_trials Williams, E. (2007). Federation of American Scientists -. Clinical Trials Reporting and Publication. Retrieved February 17, 2016, from http://fas.org/sgp/crs/misc/RL32832.pdf Read the full article
0 notes
Text
Endüstriyel Kalite Kontrol 2023-2024 Vize Soruları
Endüstriyel Kalite Kontrol 2023-2024 Vize Soruları Endüstriyel Kalite Kontrol 2023-2024 Vize Soruları 1. 1928 yılında Dodge, “kabul örneklemesi“ yöntemini aşağıdakilerden hangisi ile birlikte geliştirmiştir? A) Dudling B) Roming C) Feigenbaum D) Shewhart E) Boxing Cevap: B) Roming Açıklama: 2. Tablodaki verilerin aritmetik ortalaması aşağıdakilerden hangisidir? A) 4.25 B) 4.15 C) 4.10 D)…
0 notes
Text
Unveiling the Power of 7QC TOOLS Consultant: Your Path to Quality Excellence
The expertise of a 7QC TOOLS Consultant is instrumental in elevating quality standards across diverse business sectors. These consultants are adept at utilizing the seven fundamental quality control tools to address a wide range of quality-related challenges. By employing tools such as Control Charts, Check Sheets, and Scatter Diagrams, they enable organizations to identify patterns, trends, and anomalies within their processes, leading to proactive problem-solving and enhanced decision-making. Whether in manufacturing, healthcare, finance, or any other industry, the guidance of a 7QC TOOLS Consultant facilitates the implementation of systematic quality improvement initiatives, resulting in tangible benefits such as reduced defects, optimized processes, and increased customer satisfaction.
Understanding the 7QC TOOLS Consultant:
A 7QC TOOLS Consultant is a seasoned professional equipped with in-depth knowledge and expertise in implementing the seven basic quality control tools: Histograms, Pareto Charts, Scatter Diagrams, Control Charts, Check Sheets, Cause-and-Effect Diagrams, and Flowcharts. These tools, originally conceptualized by quality management pioneers such as Kaoru Ishikawa and Walter Shewhart, are instrumental in identifying, analyzing, and resolving quality-related issues across diverse business processes.
Why the 7QC TOOLS Consultant is Needed:
In today’s fast-paced business environment, organizations face multifaceted challenges ranging from production defects to customer complaints. The 7QC TOOLS Consultant serves as a catalyst for change, enabling organizations to:
Identify Root Causes: By leveraging tools like Cause-and-Effect Diagrams and Pareto Charts, consultants help organizations pinpoint the underlying causes of quality issues, facilitating targeted corrective actions.
Enhance Decision-Making: Through the visual representation of data provided by tools like Histograms and Scatter Diagrams, consultants empower decision-makers to make informed choices based on factual insights rather than intuition.
Drive Continuous Improvement: Control Charts and Check Sheets enable organizations to monitor processes in real-time, facilitating ongoing optimization and continuous improvement initiatives.
Maximize Efficiency: By streamlining processes and minimizing defects, organizations can optimize resource utilization and enhance operational efficiency, leading to cost savings and improved profitability.
Benefits of Engaging a 7QC TOOLS Consultant:
Improved Quality: With a 7QC TOOLS Consultant’s guidance, organizations can systematically identify and address quality issues, resulting in higher customer satisfaction and enhanced brand reputation.
Cost Savings: By reducing defects and minimizing rework, organizations can lower production costs and avoid costly recalls, thereby maximizing profitability.
Enhanced Efficiency: Through the implementation of efficient processes and the utilization of data-driven insights, organizations can streamline operations and achieve greater productivity.
Empowered Workforce: By providing training and guidance on the effective use of quality tools, consultants empower employees at all levels to actively participate in quality improvement initiatives, fostering a culture of continuous learning and innovation.
How 4C Consulting Facilitates 7QC TOOLS Consulting:
At 4C Consulting Private Limited, we understand the critical role that quality plays in organizational success. With over 10,000 hours of ISO Training and a track record of implementing ISO Standards at more than 2000 clients, we are your trusted partner in achieving quality excellence through 7QC TOOLS Consulting.
Our approach to 7QC TOOLS Consulting encompasses:
Expert Guidance: Our team of seasoned consultants possesses extensive experience in implementing the seven basic quality control tools across diverse industries, ensuring tailored solutions to meet your specific needs.
Customized Training Programs: We offer comprehensive training programs designed to equip your workforce with the knowledge and skills needed to effectively utilize the 7QC TOOLS and drive continuous improvement within your organization.
Continuous Support: From initial assessment to implementation and beyond, we provide ongoing support and guidance to ensure the successful integration of 7QC TOOLS into your organizational processes.
Measurable Results: Through rigorous data analysis and performance monitoring, we help you track the impact of 7QC TOOLS implementation on key quality metrics, enabling you to demonstrate tangible improvements and ROI.
Engaging a 7QC TOOLS Consultant is not just a wise investment; it’s a strategic imperative for organizations looking to stay ahead of the competition and deliver exceptional quality products and services. Partner with 4C Consulting, and together, let’s embark on a journey towards quality excellence and business success. Contact us now.
0 notes
Text
Six Sigma Quality Tools: A Guide to Elevating Business Processes
https://businessviewpointmagazine.com/wp-content/uploads/2024/11/33-Six-Sigma-Quality-Tools_-A-Guide-to-Elevating-Business-Processes-Image-by-Funtap-from-Getty-Images.jpg
Latest News
News
Stock Market Update: Nifty 50 Movement, Trade Setup, and Top Stock Picks
News
Markets on Edge: Indian Indices Dip, Bitcoin Hits Record, and Global Trends Shape the Week Ahead
News
BlueStone Jewellery Plans ₹1,000 Crore IPO with Fresh Issue and OFS
Source: Funtap-from-Getty-Images
In the competitive business landscape, quality management plays a pivotal role in ensuring that companies deliver exceptional products and services. One of the most effective methodologies that businesses across the globe, including India, have adopted to enhance operational efficiency and product quality is Six Sigma. Central to this methodology are the Six Sigma quality tools, which help in identifying defects, improving processes, and ensuring that companies meet customer expectations.
This article delves into the key Six Sigma quality tools, their relevance to Indian industries, and how businesses can leverage these tools to boost productivity, reduce waste, and improve profitability.
What is Six Sigma?
Before diving into the Six Sigma quality tools, it is essential to understand the concept of Six Sigma. Six Sigma is a data-driven methodology that aims at improving business processes by eliminating defects and reducing variation. Originally developed by Motorola in the 1980s, Six Sigma has since been adopted by companies worldwide, including several Indian businesses across sectors like manufacturing, healthcare, and IT services.
Six Sigma follows the DMAIC framework (Define, Measure, Analyze, Improve, Control) to drive process improvements. At the heart of this methodology are the Six Sigma quality tools that help organizations make data-driven decisions, identify problem areas, and ensure continuous improvement.
The Importance of Six Sigma Quality Tools for Indian Businesses
India, being one of the fastest-growing economies, faces stiff competition both globally and domestically. As businesses strive to improve their products and services while minimizing costs, the need for effective quality management has never been more critical. Here, Six Sigma quality tools come into play.
These tools help Indian businesses:
Reduce defects in production and service delivery processes.
Streamline operations, thereby lowering costs and improving efficiency.
Enhance customer satisfaction by ensuring that products and services meet or exceed customer expectations.
Drive innovation by encouraging continuous improvement in processes.
Now, let’s take a closer look at the six key Six Sigma quality tools that businesses can use to improve their operations.
1. Pareto Chart

The Pareto Chart is a powerful tool used to identify the most significant factors contributing to a problem. It is based on the Pareto Principle, which states that 80% of the problems come from 20% of the causes. By focusing on these vital few causes, businesses can prioritize their efforts for maximum impact.
For instance, in Indian manufacturing sectors, companies can use Pareto Charts to identify the most common defects in their production lines. By addressing these key issues, they can significantly reduce defects and enhance product quality.
2. Fishbone Diagram (Cause-and-Effect Diagram)
Also known as the Ishikawa or Fishbone Diagram, this tool helps in identifying the root causes of a problem. It breaks down problems into various categories such as materials, methods, machines, and manpower, making it easier to pinpoint the cause of the issue.
In Indian industries like pharmaceuticals or IT services, where multiple variables affect the final outcome, the Fishbone Diagram is an effective way to map out all possible factors and prioritize the ones that need attention.
3. Control Charts
Control charts, also known as Shewhart charts, are used to monitor process behavior over time and identify any variations that may lead to defects. This is one of the most effective Six Sigma quality tools for ensuring that a process remains within specified limits and that any deviations are detected early.
In sectors like healthcare, where quality and consistency are of utmost importance, control charts help Indian hospitals and clinics ensure that their processes, such as patient care or medical testing, remain consistent and meet the highest standards.
4. Failure Mode and Effects Analysis (FMEA)

FMEA is a systematic tool used to identify potential failures in a process and evaluate their impact on the final product or service. It helps businesses prioritize which failures to address based on their severity, occurrence, and detectability.
Indian automotive and electronics companies, for example, can use FMEA to assess risks in their product development processes and take preventive measures to avoid costly failures. This not only improves product reliability but also boosts customer satisfaction.
5. Histogram
A histogram is a graphical representation of data that shows the frequency distribution of a set of variables. It helps businesses understand the distribution of data and identify patterns or variations that may require corrective action.
In industries such as textiles or FMCG (Fast Moving Consumer Goods) in India, histograms can be used to analyze product quality data, such as the weight or size of products, and ensure that they meet the required specifications.
6. 5 Whys
The 5 Whys technique is a simple yet effective tool for uncovering the root cause of a problem by repeatedly asking “Why?” until the fundamental issue is identified. This tool is particularly useful in finding solutions to problems that are not immediately apparent.
Indian companies across sectors, from IT to retail, can benefit from using the 5 Whys technique to get to the bottom of operational issues, resolve them quickly, and prevent them from recurring.
Why Six Sigma Quality Tools Matter in the Indian Context
https://businessviewpointmagazine.com/wp-content/uploads/2024/11/33.3-Why-Six-Sigma-Quality-Tools-Matter-in-the-Indian-Context-Image-by-alexsl-from-Getty-Images-Signature.jpg
Indian businesses are constantly under pressure to deliver high-quality products and services at competitive prices. By adopting the Six Sigma quality tools, companies can achieve several significant benefits:
Cost Savings: Reducing defects and improving process efficiency translates to lower operational costs. This is especially crucial in price-sensitive markets like India.
Improved Quality: By focusing on quality improvements, businesses can ensure customer satisfaction, leading to increased loyalty and repeat business.
Global Competitiveness: Indian companies aiming to expand globally need to meet international quality standards. Six Sigma quality tools help them achieve this by maintaining high levels of consistency and reliability.
Employee Engagement: Implementing Six Sigma encourages a culture of continuous improvement, where employees are actively involved in problem-solving and process enhancement.
Conclusion
In a rapidly evolving business environment like India, maintaining quality and efficiency is crucial for long-term success. By leveraging the Six Sigma quality tools, companies can not only improve their processes but also reduce costs, enhance customer satisfaction, and stay ahead of the competition. Whether it’s a manufacturing unit aiming to reduce defects or an IT services firm looking to streamline operations, these tools provide a structured and data-driven approach to continuous improvement.
By focusing on eliminating defects and enhancing efficiency, Indian businesses can unlock their true potential and create a lasting impact in the global market.
Did you find this article helpful? Visit more of our blogs! Business Viewpoint Magazine
#leansixsigma#lean#leanmanufacturing#leadership#training#kaizen#s#iso#greenbelt#projectmanagement#processimprovement#quality#o#business#kanban#pdca#blackbelt#innovation#management#growth
0 notes
Text
Understanding the Plan, Do, Check, Act (PDCA) Cycle for Continuous Improvement
In today's fast-paced world, businesses and individuals alike strive for continuous improvement. One powerful method for achieving this is the Plan, Do, Check, Act (PDCA) cycle. Originating in quality management, this model is a straightforward yet powerful framework to boost efficiency and effectiveness in various fields, from project management to personal development. In this article, we will delve into what PDCA is, how it works, and why it is essential for anyone looking to optimize processes and drive quality improvements in any area of life.
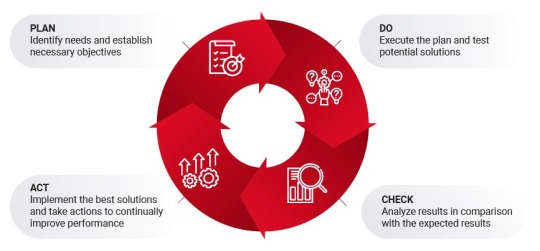
What is the Plan, Do, Check, Act (PDCA) Cycle?
The PDCA cycle, also known as the Deming Cycle or Shewhart Cycle, is a four-step iterative process used for continuous improvement of products, processes, or services. Its goal is to promote ongoing assessment and refinement to achieve higher standards of quality. Each phase serves a specific purpose and involves distinct activities that lead to insights for improvement. Below, we explore each of these steps in detail.
Step 1: Plan
The first step in the PDCA model is planning. This involves defining the problem, identifying goals, and laying out a strategy to address the issue or achieve desired objectives. During this stage, it’s crucial to perform a thorough analysis of the problem, often using techniques like the 5 Whys or Root Cause Analysis. This helps to understand the underlying factors contributing to the problem.
Key activities in the Plan phase:
Define objectives and performance metrics
Conduct research and gather data
Brainstorm and evaluate potential solutions
Develop a clear action plan
Key phrase to remember: Proper planning prevents poor performance.
Step 2: Do
Once a solid plan is in place, it’s time to implement it in the "Do" phase. During this stage, small-scale implementation is recommended to minimize risks and costs. This helps to assess the feasibility of the proposed solutions in a real-world setting without committing extensive resources. While executing, it’s important to document the process carefully, as this documentation will be valuable for the later stages.
Key activities in the Do phase:
Execute the plan on a small scale
Collect relevant data on performance
Observe and record results
Step 3: Check
After implementing the plan, it’s time to evaluate its effectiveness in the "Check" phase. This stage involves comparing actual results to the expected outcomes to determine if the objectives were met. Analytical tools like Key Performance Indicators (KPIs) and variance analysis are often used in this stage to measure success.
Key activities in the Check phase:
Analyze data and assess performance
Identify deviations or discrepancies
Determine the effectiveness of the solution
The Check phase provides critical insights for deciding whether to adopt the changes fully or make further adjustments.
Step 4: Act
The final stage, "Act," involves making adjustments based on the insights gained in the previous phase. If the solution was successful, it might be standardized and implemented on a larger scale. If not, the cycle may start over, with adjustments made to improve upon the initial plan.
Key activities in the Act phase:
Implement changes on a full scale if successful
Standardize the solution if viable
Re-enter the cycle if modifications are needed
Applications of the PDCA Cycle
The PDCA model is versatile and can be applied in various fields:
Manufacturing: In quality control, PDCA helps in minimizing defects and optimizing production processes.
Healthcare: Improves patient care and operational efficiency by continuously assessing and refining processes.
Education: Helps teachers and institutions improve curricula based on feedback and outcomes.
Project Management: Offers a structured approach for risk management and process optimization.
Personal Development: Encourages a proactive approach toward self-improvement and goal achievement.
Benefits of Using the PDCA Cycle
1. Continuous ImprovementThe primary advantage of Plan, Do, Check, Act (PDCA) is its emphasis on continuous improvement, ensuring that processes or products keep evolving to meet changing needs.
2. Reduced RiskBy testing solutions on a smaller scale during the Do phase, organizations can mitigate risks associated with new initiatives.
3. Enhanced EfficiencyPDCA helps in identifying and eliminating wasteful practices, making processes leaner and more efficient.
4. Better Decision-MakingPDCA relies on data-driven insights gathered during the Check phase, leading to informed decision-making.
5. Increased AccountabilityThe PDCA framework requires documentation and review, which promotes accountability and transparency across teams.
Challenges of Implementing PDCA
Despite its simplicity, the PDCA model has certain challenges. Some of these include:
Time Consumption: Each phase, especially planning and evaluation, requires time and commitment.
Requires a Culture of Change: Successful implementation of PDCA demands an organization that values innovation and constant improvement.
Dependency on Accurate Data: The Check phase relies on accurate data collection and analysis. Inaccuracies can lead to incorrect conclusions.
How to Integrate PDCA with Other Quality Tools
PDCA and Lean Six Sigma
Lean Six Sigma focuses on reducing waste and improving quality, making it an ideal partner for PDCA. While Lean Six Sigma identifies areas needing improvement, PDCA provides a cycle to implement and sustain these improvements.
PDCA and Kaizen
In Kaizen, or "continuous improvement," small, incremental changes are made regularly. When integrated with PDCA, Kaizen becomes even more powerful, as the Plan, Do, Check, Act cycle ensures every improvement is tested and validated.
Examples of PDCA in Real-Life Scenarios
1. Improving Customer Service
A company facing customer dissatisfaction issues could apply the PDCA model by analyzing feedback (Plan), testing new response protocols (Do), reviewing customer feedback (Check), and standardizing the most effective protocols (Act).
2. Product Development
In product development, PDCA can be used to ensure each phase of development is optimized for efficiency and quality. By testing each feature on a small scale, product teams can identify issues early and avoid costly adjustments later.
Best Practices for Implementing PDCA
Engage Stakeholders: Ensuring all stakeholders understand and support the PDCA cycle is essential.
Maintain Open Communication: Transparent communication allows teams to share insights at each phase.
Focus on Data Accuracy: Reliable data is key to effective evaluation and decision-making in the Check phase.
Document Every Step: Proper documentation allows for better learning and reference in future PDCA cycles.
Conclusion
The Plan, Do, Check, Act (PDCA) cycle is a foundational framework for anyone looking to enhance efficiency, minimize waste, and drive continuous improvement. With applications across numerous fields, it has become a cornerstone of quality management and process optimization. By embracing PDCA, organizations and individuals alike can foster a culture of ongoing assessment and refinement, achieving a higher standard of excellence and adaptability in today’s dynamic world.
0 notes
Text
PDCA-cyclus: essentieel voor voortdurende verbetering in financiële processen

De PDCA-cyclus is een krachtig hulpmiddel voor voortdurende verbetering, essentieel voor het optimaliseren van financiële processen. Focus op vooruitgang is cruciaal in de financiële wereld, waar efficiëntie en nauwkeurigheid een grote impact hebben op de bedrijfsresultaten. De PDCA-cyclus, ontwikkeld door William Edwards Deming, biedt een gestructureerde aanpak om kwaliteitsproblemen op te lossen en processen te verbeteren.
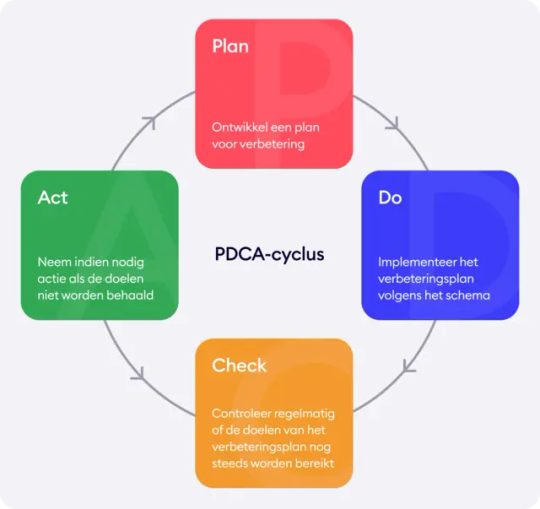
Wat is PDCA (Plan-Do-Check-Act)?
De PDCA-cyclus staat voor Plan, Do, Check, Act en is een methodologie voor kwaliteitsmanagement en probleemoplossen. Deze cyclus werd ontwikkeld door natuurkundige Walter A. Shewhart en verder geoptimaliseerd door William Edwards Deming.
De PDCA-cyclus helpt organisaties om processen te verbeteren door continu te plannen, uit te voeren, te controleren en aan te passen. De cyclus is breed toepasbaar in verschillende sectoren, waaronder lean manufacturing en Six Sigma. Het gebruik van de PDCA-cyclus bevordert een cultuur van voortdurende verbetering en zorgt voor een gestructureerde aanpak bij het oplossen van kwaliteitsproblemen.
De PDCA-cyclus begint met de plan-fase, waarin een probleem wordt geïdentificeerd en een plan van aanpak wordt ontwikkeld. Vervolgens wordt in de do-fase het plan geïmplementeerd op kleine schaal om de effectiviteit ervan te testen. In de check-fase worden de resultaten geëvalueerd om te zien of de gewenste verbeteringen zijn bereikt. Tot slot worden in de act-fase succesvolle strategieën op grotere schaal toegepast, of wordt het proces opnieuw doorlopen als de resultaten niet bevredigend zijn.
Een van de belangrijkste voordelen van de PDCA-cyclus is dat het een creatief hulpmiddel voor kwaliteitsmanagement biedt dat organisaties helpt bij het systematisch aanpakken en oplossen van problemen. Door regelmatig de fasen van de PDCA-cyclus te doorlopen, kunnen organisaties continu verbeteren en efficiënter werken.
De stappen van de PDCA-cyclus
Laten we de belangrijkste stappen van de PDCA-cyclus bekijken.
1/ Plan (Plannen)
In de Plan-fase wordt een goed doordacht plan gemaakt om problemen aan te pakken. Dit omvat het analyseren van de huidige situatie en het formuleren van hypothesen en doelen. In financiële processen kan dit bijvoorbeeld betekenen dat men een strategie ontwikkelt om operationele kosten te verlagen of risicobeheer te verbeteren.
2/ Do (Doen)
Tijdens de Do-fase wordt het plan uitgevoerd op een kleine schaal om de effectiviteit ervan te testen. Nauwkeurige uitvoering en teamwork zijn cruciaal om betrouwbare data te verzamelen. Voor financiële instellingen kan dit betekenen dat men nieuwe software implementeert voor het beheer van klantgegevens.
3/ Check (Controleren)
In de Check-fase worden de resultaten gemeten en vergeleken met de verwachte uitkomsten. Het gebruik van Key Performance Indicators (KPI's) is essentieel om de voortgang te monitoren en te evalueren of de gewenste resultaten zijn behaald. Deze fase zorgt ervoor dat afwijkingen van het plan snel worden geïdentificeerd en gecorrigeerd. Hierdoor kunnen financiële instellingen tijdig bijsturen en optimaliseren voor betere prestaties.
4/ Act (Aanpassen)
De Act-fase omvat het nemen van actie op basis van de verkregen inzichten. Als de resultaten positief zijn, worden de veranderingen geïmplementeerd op een bredere schaal. Deze fase benadrukt het iteratieve karakter van de PDCA-cyclus, wat leidt tot continue verbetering. Het is ook het moment om lering te trekken uit de uitgevoerde stappen en deze kennis te gebruiken bij toekomstige cycli.
PDCA: voorbeelden uit de financiële wereld
Veel financiële instellingen passen de PDCA-cyclus succesvol toe:
De ING Bank gebruikte de cyclus om het kredietbeoordelingsproces te verbeteren, wat leidde tot snellere goedkeuringen en beter risicobeheer. Door de plan-fase goed uit te voeren, identificeerden ze knelpunten in het proces en ontwikkelden een strategie om ze aan te pakken. Tijdens de do-fase implementeerden ze de verbeteringen op een kleine schaal, waarbij ze nauwkeurig de resultaten in de gaten hielden.
Een ander voorbeeld is Nationale-Nederlanden, die de PDCA-cyclus gebruikte om klanttevredenheid te verhogen door processen voor schadeafhandeling te optimaliseren. Ze begonnen met een gedetailleerde analyse in de plan-fase, waarbij ze klantfeedback en interne gegevens gebruikten om inefficiënties te identificeren. In de do-fase voerden ze verbeteringen door zoals het versnellen van documentatieprocessen en het verbeteren van communicatie met klanten. Tijdens de check-fase beoordeelden ze de impact van deze veranderingen door middel van klanttevredenheidsonderzoeken en prestatie-indicatoren.
Een derde voorbeeld betreft Robeco, een investeringsmaatschappij die de PDCA-cyclus toepaste om hun portfoliobeheer te verbeteren. In de plan-fase analyseerden ze de huidige situatie en identificeerden ze kansen om hun beleggingsstrategieën te optimaliseren. Tijdens de do-fase implementeerden ze nieuwe strategieën in een beperkt aantal portefeuilles. De check-fase omvatte het evalueren van de prestaties van deze portefeuilles ten opzichte van benchmarks. In de act-fase werden de succesvolle strategieën breed uitgerold en werden minder effectieve benaderingen aangepast of verlaten.
De voordelen van de PDCA-cyclus bij financiën
Het gebruik van de PDCA-cyclus biedt verschillende voordelen voor financiële instellingen, zoals:
Risicobeheersing: door systematisch te controleren en aan te passen, kunnen financiële instellingen risico's beter beheren. De check-fase helpt bij het identificeren van potentiële risico's en de act-fase zorgt voor de implementatie van corrigerende maatregelen.
Kostenbesparing: efficiënte processen leiden tot lagere operationele kosten. In de do-fase kunnen instellingen inefficiënties elimineren, wat resulteert in minder verspilling van middelen en tijd. Dit leidt tot significante kostenbesparingen op lange termijn.
Klanttevredenheid: voortdurende verbetering van processen verhoogt de tevredenheid van klanten door snellere en nauwkeurigere dienstverlening. Bijvoorbeeld, door de plan-fase goed uit te voeren, kunnen instellingen beter anticiperen op klantbehoeften en in de do-fase zorgen voor een naadloze implementatie van verbeteringen die direct de klantbeleving verbeteren.
Flexibiliteit en aanpassingsvermogen: de PDCA-cyclus maakt organisaties flexibeler waardoor ze beter in staat zijn om zich aan te passen aan veranderingen in de markt. Door de iteratieve aard van de cyclus kunnen financiële instellingen snel reageren op nieuwe uitdagingen en kansen, wat hun concurrentiepositie versterkt.
Betere besluitvorming: de systematische aanpak van de PDCA-cyclus helpt bij het nemen van weloverwogen beslissingen. Door continu te evalueren en aan te passen, kunnen instellingen beter onderbouwde beslissingen nemen gebaseerd op actuele data en inzichten.
Verhoogde productiviteit: door processen voortdurend te verbeteren, kunnen medewerkers efficiënter werken, wat leidt tot een hogere productiviteit. De focus op verbetering motiveert teams om proactief te zoeken naar manieren om hun werk beter en sneller te doen.
Cultuur van continue verbetering: het regelmatig doorlopen van de PDCA-cyclus bevordert een cultuur van voortdurende verbetering binnen de organisatie. Medewerkers raken gewend aan het constant evalueren en verbeteren van hun werk, wat leidt tot een algehele verbetering van de organisatieprestaties.
Praktische tips voor het implementeren van de PDCA-cyclus
Om de PDCA-cyclus effectief te implementeren, moeten financiële professionals:
Duidelijke doelen stellen: specifieke, meetbare doelen helpen bij het evalueren van de voortgang. Dit zorgt ervoor dat iedereen binnen de organisatie weet wat er verwacht wordt en hoe succes eruitziet.
Teamwork bevorderen: betrek er verschillende afdelingen bij om diverse inzichten en expertise te benutten. Dit helpt bij het creëren van een meer holistisch en goed geïnformeerd plan dat beter aansluit bij de behoeften van de hele organisatie.
Regelmatig evalueren: pas regelmatig de check-fase toe om snel te kunnen reageren op veranderingen. Dit zorgt ervoor dat eventuele problemen of inefficiënties snel worden geïdentificeerd en aangepakt voordat ze escaleren.
Communicatie verbeteren: zorg voor heldere en open communicatiekanalen tussen teamleden en afdelingen. Dit bevordert samenwerking en zorgt ervoor dat iedereen op de hoogte is van de voortgang en eventuele wijzigingen in het plan.
Training en ondersteuning bieden: investeer in training en ondersteuning voor medewerkers om ervoor te zorgen dat ze de PDCA-cyclus begrijpen en effectief kunnen toepassen in hun dagelijkse werkzaamheden.
Gebruik van technologie: maak gebruik van technologische hulpmiddelen en software om gegevens te verzamelen, te analyseren en te rapporteren. Dit kan helpen bij het efficiënter en nauwkeuriger uitvoeren van de check-fase.
Leiderschap en betrokkenheid van het management: het succes van de PDCA-cyclus hangt sterk af van de betrokkenheid en ondersteuning van het management. Leiders moeten het belang van voortdurende verbetering benadrukken en actief betrokken zijn bij het proces.
Conclusie
De PDCA-cyclus is een krachtig hulpmiddel voor continue verbetering van financiële processen. Door systematisch te plannen, uitvoeren, controleren en aanpassen, kunnen financiële instellingen hun efficiëntie verbeteren, risico's beheersen en klanttevredenheid verhogen. Het toepassen van de principes van de PDCA-cyclus kan aanzienlijke voordelen opleveren voor elke financiële professional. Het bevordert een cultuur van innovatie en stelt organisaties in staat om flexibel te reageren op veranderende marktomstandigheden. Bovendien draagt het bij aan een duurzame groei door consistent hoogwaardige resultaten te leveren.
0 notes
Text
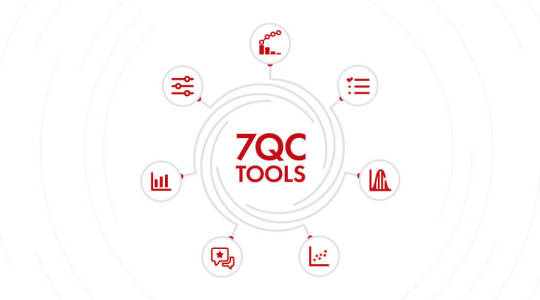
Introduction to the 7QC Tools
In the realm of quality control, the 7QC tools hold a prestigious position. They are the bedrock upon which modern quality management systems are built, providing essential techniques for identifying, analyzing, and solving quality problems. But what exactly are these tools, and why are they so crucial in today's competitive business landscape? Let's dive in and explore.
What Are the 7QC Tools?
The 7QC tools, short for the Seven Quality Control Tools, are a set of fundamental instruments used by quality professionals to troubleshoot and improve processes. Originating from Japan, these tools are now globally recognized and utilized across various industries to enhance product quality and operational efficiency.
Historical Background
The 7QC tools were popularized by Kaoru Ishikawa, a Japanese professor and quality management innovator, in the 1960s. His vision was to make quality control accessible to everyone, not just engineers. By simplifying complex statistical methods into easy-to-use tools, Ishikawa empowered employees at all levels to contribute to quality improvement.
Importance in Quality Control
These tools are crucial because they provide a structured approach to problem-solving. Whether it's identifying the root cause of a defect or monitoring the stability of a production process, the 7QC tools offer reliable methods to gather and analyze data, leading to informed decisions and effective solutions.
Overview of Each Tool
Let's break down each of the seven tools and see how they contribute to quality control.
Cause-and-Effect Diagram
Also known as the Fishbone Diagram or Ishikawa Diagram, this tool helps identify the root causes of a problem. By visually mapping out all potential factors, teams can systematically investigate each one, making it easier to pinpoint the underlying issue.
Check Sheets
A Check Sheet is a simple yet powerful tool for data collection and analysis. It allows users to record and categorize data in real-time, making it easier to identify patterns and trends. This tool is particularly useful for tracking the frequency of defects or occurrences.
Control Charts
Control Charts, or Shewhart Charts, are used to monitor process stability over time. By plotting data points against predetermined control limits, teams can quickly detect any variations that might indicate a problem. This tool is essential for maintaining consistent quality in production processes.
Histograms
A Histogram is a type of bar chart that represents the distribution of data. It provides a visual summary of variations within a dataset, helping teams understand the underlying patterns and identify any abnormalities.
Pareto Charts
Pareto Charts combine bar and line graphs to highlight the most significant factors in a dataset. Based on the Pareto Principle (80/20 rule), this tool helps prioritize issues by showing which factors have the greatest impact on quality.
Scatter Diagrams
Scatter Diagrams, or Scatter Plots, show the relationship between two variables. By plotting data points on a graph, teams can identify correlations and understand how changes in one variable might affect another. This tool is useful for exploring cause-and-effect relationships.
Flowcharts
Flowcharts provide a visual representation of a process, illustrating each step from start to finish. This tool helps teams understand the workflow, identify bottlenecks, and streamline operations for improved efficiency.
How to Use the 7QC Tools
Implementing the 7QC tools in your organization doesn't have to be daunting. Here's a step-by-step guide to get you started.
Integrating Tools in Quality Management
Training and Education: Ensure all team members understand how to use each tool.
Select the Right Tool: Choose the tool that best fits the problem at hand.
Data Collection: Gather accurate data for analysis.
Analysis and Interpretation: Use the tools to analyze data and draw conclusions.
Implement Solutions: Based on your findings, implement changes to improve quality.
Monitor Results: Continuously monitor processes to ensure improvements are sustained.
Practical Applications
For instance, if you're facing a high rate of defects in your manufacturing process, start with a Cause-and-Effect Diagram to identify potential causes. Use Check Sheets to collect data on defect occurrences. Then, create Control Charts to monitor process stability after implementing solutions.
Benefits of Implementing the 7QC Tools
Why should you invest time and resources in using the 7QC tools? Here are some compelling reasons.
Improved Problem-Solving
By providing a structured approach to identify and analyze problems, the 7QC tools enhance your problem-solving capabilities. This leads to more effective solutions and long-term improvements in quality.
Enhanced Decision-Making
The 7QC tools offer data-driven insights, allowing you to make informed decisions. Instead of relying on gut feelings or assumptions, you can base your actions on concrete evidence, leading to better outcomes.
Real-World Examples
Seeing the 7QC tools in action can provide valuable insights. Here are two case studies demonstrating their effectiveness.
Case Study 1
A car manufacturer was facing frequent engine failures. Using the Cause-and-Effect Diagram, they identified several potential causes, including faulty parts and assembly errors. Check Sheets helped track defect occurrences, and Control Charts monitored process stability. By addressing the root causes, they significantly reduced engine failures.
Case Study 2
A food processing company struggled with inconsistent product quality. Histograms revealed variations in ingredient measurements. Pareto Charts highlighted that a small number of suppliers were responsible for most inconsistencies. By switching suppliers and standardizing measurements, they improved product quality.
Challenges in Using the 7QC Tools
While the 7QC tools are powerful, they come with challenges. Here's how to navigate them.
Common Pitfalls
Lack of Training: Without proper training, teams might misuse the tools or misinterpret data.
Inconsistent Data Collection: Accurate data is crucial for reliable analysis. Ensure consistent data collection methods.
Resistance to Change: Implementing new tools can face resistance. Engage and involve all team members to foster acceptance.
Overcoming Challenges
Provide Comprehensive Training: Invest in training programs to ensure everyone understands how to use the tools.
Standardize Data Collection: Develop standardized methods for data collection to ensure consistency.
Communicate Benefits: Clearly communicate the benefits of using the 7QC tools to gain buy-in from all stakeholders.
Conclusion
The 7QC tools are invaluable assets in any quality control toolkit. They offer a structured, data-driven approach to problem-solving, leading to improved product quality and operational efficiency. By understanding and implementing these tools, you can transform your organization's approach to quality management
#7qc#7QC Tools#QualityControl#ProcessOptimization#QualityManagement#BusinessExcellence#LeanManufacturing
1 note
·
View note
Text
https://learntransformation.com/spc-and-msa/
SPC and MSA, or Statistical Process Control and Measurement System Analysis, are vital methodologies for process improvement. SPC involves statistical techniques to monitor and control processes, distinguishing between common and special cause variations. MSA ensures measurement tools provide accurate data. Techniques like control charts, histograms, and Process Capability Analysis aid in continuous improvement. Gauge R&R studies assess measurement reliability, while Failure Mode and Effects Analysis (FMEA) anticipates risks. These methodologies, integral to Six Sigma, were championed by leaders like Shewhart and Deming. Case studies, like Chrysler under Iacocca, showcase how SPC & MSA drive quality, efficiency, and cultural transformation.
0 notes
Text
Unraveling the (PDCA) Cycle: Mastering Continuous Improvement
Small daily improvements over time lead to stunning results. Robin Sharma The quest for perfection is perpetual. Amid this relentless pursuit, the (PDCA) Cycle stands out as a beacon of systematic, continuous improvement. Originating from the fertile minds of quality management pioneers Walter A. Shewhart and later popularized by W. Edwards Deming, the (PDCA) Cycle is a timeless methodology…

View On WordPress
#business#collaboration#communication#Continous Improvement#creativity#leadership#management#Personal Knowledge Management (PKM)#problem-solving#teamwork
1 note
·
View note
Text
Leading and Managing a Change in Clinical Practice: Patient on Ventilator and the Usage of Saline in Performing Suctioning Organizational direction depends on many factors. Most of them were an integral part of clinical practice for a while, but until the latter part of the 20th century has been so prominent in the organizational structure. This paper will explore the four factors that influence the management of clinic and are characterized by efficient designs. This paper will discuss about the leadership and management in relation to improving quality, change, care management, values and results. We will also present integration and possible implementation concepts, tools and strategies. Discussion Suctioning the patient on ventilator pose a unique challenge in following a clinical pathway or case management model of care. Our patient is on ventilator and we are performing suctioning by the usage of saline solution. Multiple decisions need to be made when our patient on ventilator reaches the point in his or her disease process where suctioning needs to be implemented. Evidence-Based Practice This is quite different than the healthcare environment that one is accustomed to managing. Although the environments are different, (Dougherty 2004, 150-896)there are applications that work for either situation. Leadership styles can be used in any area that people are managed by another person. The ability to work through the simulation provided an opportunity to use the three leadership styles and visualize the results from the team. The knowledge gained from the exercise will assist in managing the clinical and non-clinical staff. There will be opportunities that require utilization of the democratic leadership such as staff scheduling, uniform selection, and equipment selection. (Dougherty 2004, 150-896)While other projects will require that the autocratic leadership style is employed, such as policy development, corrective action, and regulatory compliance. The simulation assisted in understanding that leadership has to be flexible enough to know which style is the most excellent for current condition (Dougherty 2004, 150-896). Planning First of all effective planning which must be incorporated in all the steps of performing suctioning and should involve proper monitoring system (Levy 2005, 323- 368)?Due to the lack of any lookout event on planning our performance on ventilator would be affected. After you have identified the planning steps you need to decide regularity and frequency (Dougherty 2004, 150-896). Division of Labour Then comes division of labour is one of the basic concept of leadership and management for case management as given by Deming; workers hold jobs and managers improved with the improvement of system (Levy 2005, 323- 368). Deming developed the concept of overall management and change management model called the Shewhart cycle, or PDCA (Hamric 2005, 311-335). This model requires that for P-D-plan, do, C-check and A-law (Kelly, 2007, 17-89). Efforts to increase productivity clinical practice is, as pointed out by Deming, necessity and not an option.Deming emphasized that cooperation multidisciplinary teams improves communication channels. Solutions for potential and existing problems, thus more soluble and prevented. These advantages are provided for all areas of the Organization, including helping to contain costs (Dougherty 2004, 150-896). Role Clarity Role clarity is also a necessary component of a successful organization. This should be outlined by a clear job description and understanding of how the organizational structure functions (Levy 2005, 323- 368). When these tools are in place the organization will be more likely to successfully adapt to the internal and external factors brought on by the continually changing clinical practice environment (Yoder-Wise, 2003, 174-211). A particularly effective system of analyzing and redesigning clinical pathways was included in a study of suctioning our patient on ventilator, by Owen, et al., (2006). A multidisciplinary team was selected and assigned with the task of evaluating and redesigning the effectiveness of the clinical pathways process. They were known as the process improvement team (Dougherty 2004, 150-896). Change Management Encouraging people to willingly accept change and adapt new methods and procedures is a difficult undertaking. All change processes rely on a change agent. The change agent is given the authority to initiate, formally and informally, those processes that will assist in change (Levy 2005, 323- 368) Change agents can be members of the team working towards change by informal or formally appointed positions. Change is a continuous, dynamic process instead of a single occurrence. It is the process by which something becomes different than it was (Sullivan & Decker, 2005). Due to the rapid changes in clinical practice case management has had to recognize change and transform it to meet the demands of clinical practice and consumers. (Hamric 2005, 311-335). There would also be committees to oversee improvements and policy changes. Doctors, clinicians, dieticians and educators should have direct influence on care maps and clinical pathways (Dougherty 2004, 150-896). These positions need to be available to staff as resources for as well as for our patient on ventilator. An organization's structure can have profound effect on how change is perceived and implemented (Sullivan & Decker, 2005). The medical director and the chief medical officer would be at the apex of the organization with a shared executive function in policy (Dougherty 2004, 150-896). Business management theory regards organizations as open systems. Several types of theories have been translated to the case management and clinical practice environment successfully. Case management uses theories of change that have been developed in the business fields of organizational development and organizational transformation. Normative models are necessary when there is more resistance to change present than in rational models (Dougherty 2004, 150-896). Lewin's model forms the cornerstone of normative models. Others have used his theory as bases for more expanded versions (Levy 2005, 323- 368). Open systems require the manager to have the experience and knowledge to anticipate changes in the working environment and manage them efficiently (Levy 2005, 323- 368). Any attempt of movement by either force would cause a direct oppositional force of equal strength until equilibrium was regained. His theory opened the idea that to remove the restraining force would open up the path to change. Without resistance change would be a natural progression (Levy 2005, 323- 368). Lewin based his theory on social- psychological and cognitive views (Levy 2005, 323- 368). Lewin's theory proposed that driving forces, diametrically opposed, maintained the status quo (Hamric 2005, 311-335). This became known as the Force Field model. Analyzing and identifying the driving forces or facilitators and the restraining forces, barriers, is the first and most important part of the process. Barriers can occur at any step in the process and are factors that interfere with the movement of change in a positive direction; barriers can come from within the facility or from outside. Others incorporate change agents as catalysts and prime facilitators. Facilitators are factors that can be internal or external and cause movement toward positive change (Yoder-Wise, 2003). Theories differ on the part the change agent assumes. Some focus on the process of change itself and how the environment resists or accepts it. In the suctioning unit the official change agent would be the educator (Dougherty 2004, 150-896). The implementation then takes place in accordance to the revised process; this is then evaluated. Managed Care End stage disease (ESRD) accounts for over 400,000 Americans (Levy 2005, 323- 368)?. Disease results in a total of 7% of Medicare's budget and a total of $23 billion dollars (Saxena & West, 2006, 380-389). Cost containment and consistent quality improvement are of paramount importance in the maintenance and care of ERSD for our patient who is on ventilator and suctioning treatment is being performed. Chronic kidney disease (CKD) is regulated by agencies and guidelines. These agencies recognize the benefit of structure and standardization of treatment and the quality and safety these measures bring (Kuchta, 2006, 4-8). In the absence of federal or state mandated changes, determining the need for change should need to be a group mandated (Levy 2005, 323- 368). After a target process is identified and acknowledged the process improvement team work to identify difficulties and adapt a change with measurable outcomes. The change should be based on best practice and evidence-based guidelines (Dougherty 2004, 150-896). There had been a noticeable lack of pre-suctioning preparation despite the policies the facility followed according to the guidelines (Dougherty 2004, 150-896). A surgical clinical pathway should be in place to ensure the access, preferably the members of a multidiscipline team involved with initiating treatment should include the vascular surgeon, nephrologists, social worker, dietician and suctioning clinician. Owens described a model for pathway redesign for starting new suctioning our patient on ventilator (Owens, et al.2006). Barriers are present in the complexity and comorbidity of end stage disease and the inherent individuality of each our patient on ventilator. Goals are set for each our patient on ventilator in each facility and a plan is drawn to correct variances. Suctioning facilities maintain standardization through medication standing orders and treatment procedures (Hamric 2005, 311-335). Sodium modelling and ultrafiltration conductivity values are all quantitative modes of tailoring suctioning to individual needs while acceptable treatment adequacies are mensurated within a standardized range. Suctioning access and the initial treatment course can be measured and managed through clinical pathways (Dougherty 2004, 150-896). Clinical pathways loose their effectiveness when the suctioning our patient on ventilator reaches maintenance and the continuum of health narrows substantially. Initiation of suctioning will end a clinical path for new our patient on ventilator, but start a case management mode of care as the our patient on ventilator moves into a chronic disease status. Chronic suctioning our patient on ventilator are then assessed monthly through Kt/V values measuring effective suctioning, in addition to other salient markers, such as hemoglobin, weight gain and dietary compliance (Levy 2005, 323- 368). Case Management Case management becomes a mode of treatment management that suctioning our patient on ventilator evolves into as their disease progresses. Placed in a schematic the descriptors are consistent with the four cardinal points of the compass (Levy 2005, 323- 368). A clinical value compass is responsible for consolidating the aim of the clinical practice provider and client into a succinct framework (Dougherty 2004, 150-896). This framework is then used to determine the value of the delivered clinical practice. Value is defined by cost containment while keeping quality clinical practice at a premium level. Four types of descriptors are employed to assess the cost, satisfaction, function and clinical aspects of the clients' progression through the clinical practice process (Davis, 2006). The value compass is also represented as a circle with points paired by the by In order to assess the effectiveness of the clinical practice, cost and our patient on ventilator satisfaction, some type of measurement of outcomes is necessary. In the example of the application of a value compass above, end stage disease resulting in suctioning is assessed (Kovner & Neuhauser, 2004, 125-271)). Results Outcomes can then be analyzed to establish strengths and weakness in services and the quality of clinical practice delivered (Levy 2005, 323- 368). Many hospitals and clinical practice facilities are now employing scorecards which employ much of the information obtained and evaluated through use of the value compass. The data is also compared the organization's mission statement or it reason for existing, its vision or what the organization hopes to do, its values and its goals (Kovner & Neuhauser, 2004, 125-271)). Outcomes are established which are measurable and are used as determinates of suctioning adequacy, cost and our patient on ventilator satisfaction. Each cardinal point is connected with the other. Without adequate suctioning our patient on ventilator are unable to participate in activities of daily living, (Levy 2005, 323- 368) clinical practice costs increase as doctor visits and hospitalizations become more frequent (Dougherty 2004, 150-896). Conclusion Outcome Statements After using all the tools and processes most applicable for leadership and change management and care management the outcomes will show their effectiveness (Dougherty 2004, 150-896). Hemoglobin levels will achieve high levels, access complications and hospitalizations will decrease. The effectual use of a planned and well executed total leadership and change management will result in a well managed facility that will be used as an example of best practices. The result will also be an excellent rating in the clinical practice report card evaluation system (Levy 2005, 323- 368) . Clinics and Hospitals have the responsibility to guarantee the most effective and efficient clinical practice, safety for our patient on ventilator and staff and reaffirming its mission, vision and values (Dougherty 2004, 150-896). References Dougherty, Lisa and Lister, Sara (2004) The Royal Marsden Hospital Manual of Clinical Nursing Procedures Sixth Edition (Royal Marsden Nhs Trust) Wiley-Blackwell; 6th Edition (24 Jun 2004) 896 pages Hamric, A.B. (with Spross, J.A, Hanson, C.M.), Spross, J.A.(with Hanson, C.M.), & Hanson, C.M. (2005). Advanced practice nursing an integrative approach (Third, pp. 311-335) https://www.paperdue.com/customer/paper/leading-and-managing-a-change-in-clinical-50190#:~:text=Logout-,LeadingandManagingaChangeinClinical,-Length8pages Kelly, Diane. (2007) Applying quality management in healthcare: A systems approach. 2nd Edition: Health Administration Press. P. 17-89 Kovner, A.R., Neuhauser, D., (ed). (2004). Health Services Management; Readings, Cases, and Commentary (eighth, pp 125-271). Chicago, IL: Health Administration Press. Washington, D.C.: AUPHA Press Kuchta, K., Gilbreath, A., Gilman, C., Wieler, A. (March-April, 2006).The Legislative Process and the Kidney Care Quality and Improvement Act of 2005. Nephrology Nursing Journal. P. 4-8 Levy, J., Morgan, J., Brown, E., (2005). Oxford Handbook of Dialysis (third, pp 323- 368). New York, New York: Oxford University Press Owen... J.E., Walker, J.R., Edgell, L., Collie, J., Douglas, l., Hewitson, T.D., Becker, G.J. (2006). Implementation of a pre-dialysis clinical pathway for patients with chronic kidney disease. International Journal for Quality in Health Care; Volume 18, Number 2: pp. 145-151 Saxena, R., West, C. (September, 2006). Peritoneal Dialysis: a primary care perspective. Journal of the American Board of Family Medicine. 19(4):380-389. Yoder-Wise, P.S. (2003). Leading and managing in nursing (Third, pp. 174-211). St. Louis: Mosby, Inc. Read the full article
0 notes
Text
Re-read Saturday, Actionable Agile Volume II, Week 9, Chapter 8, Myths and Other Considerations
Mastering Work Intake: From Chaos to Predictable Delivery Chapter 8 shatters myths! Once upon a time in a land far, far away, I believed a few of these myths. Ok, it was just about five years ago that I was dissuaded from the last of my misbeliefs. I believe that many of my misconceptions are founded in the collision of words between classical statistics and words Shewhart used for Process…

View On WordPress
0 notes
Text
Ciclo PDCA

PDCA es un acrónimo en inglés de Plan (planificar), Do (hacer), Check (verificar) y Act/Adjust (actuar o ajustar). El concepto PDCA, por tanto, está vinculado a un proceso de mejora continua que debe aplicarse a través de estos cuatro pasos, que se ejecutan de forma cíclica con el objetivo de acelerar y mejorar la calidad de los productos o procesos. También llamado ciclo de Deming o ciclo de Shewhart, el PDCA es una metodología que puede aplicarse en cualquier proceso empresarial (o incluso en la vida personal) que necesite una mejora constante. El método PDCA se desarrolló en la década de 1920 y adquirió mayor notoriedad en los años 50’, cuando el padre de la gestión de la calidad, William Edwards Deming, puso en práctica la lógica de planificar, ejecutar, analizar y corregir un proyecto de gran envergadura: la reconstrucción de la infraestructura industrial japonesa tras la Segunda Guerra Mundial.
¿Por qué se conoce como ciclo?
Un sistema lineal reconoce el último paso como terminado y esa no es la lógica del PDCA. Un ciclo de mejora continua, como propone este método, se basa en la repetición y en los sucesivos intentos de optimizar los procesos.
El trabajo de PDCA es recursivo, es decir, a lo largo del proceso hay que planificar, ejecutar, medir los resultados, analizarlos, encontrar mejoras, ponerlas en práctica y, a continuación, iniciar un nuevo ciclo.
¿Cuáles son los pasos del ciclo PDCA?
Pero, ¿cómo hacer un PDCA paso a paso? El ciclo PDCA incluye los siguientes pasos secuenciales, que deben realizarse sin saltarse ninguna fase:
P: plan (planificar)
El primer paso cuando se quiere optimizar un proceso o mejorar una entrega o un producto es planificar. Es necesario que los objetivos estratégicos de la empresa, así como las expectativas del cliente, estén alineados para cumplir los siguientes pasos:
Inicialmente, es necesario hacer un diagnóstico para identificar los problemas existentes, definir las prioridades de lo que hay que mejorar o incluso detectar nuevas oportunidades. Una vez estipulado el objetivo, hay que desglosarlo en metas posibles y tangibles. Aquí es importante reunir datos e información para determinar el alcance del trabajo. Con el equipo reunido, es el momento de poner la planificación por escrito: crear un plan de acción con las actividades que hay que realizar para que se cumplan los objetivos, fijar plazos y un calendario de ejecución y designar a los responsables.
D: do (hacer)
Ahora es el momento de poner en práctica la planificación. Para que el equipo ejecute lo descrito en el plan, es necesario contar con una formación específica.
Durante la ejecución, intenta también recoger datos para poder controlar el proceso y medir los resultados. Regístralos, independientemente de si son positivos o negativos.
C: check (verificar)
Ahora analiza los resultados. Aquí es importante contar con parámetros objetivos y cuantitativos para poder verificar realmente la mejora del proceso y el nivel de calidad y compararlos con los ciclos anteriores. Es en esta fase en la que podrás identificar problemas o fallas en el proceso, que podrán ajustarse posteriormente.
A: act (actuar)
La letra "A" del acrónimo PDCA también puede significar adjust ("ajustar") y consiste en las acciones que deben implementarse para corregir las fallas detectadas en el paso anterior. En este momento es posible apuntar soluciones a los problemas y luego rehacer la planificación teniendo en cuenta los nuevos resultados.
En esta fase se dan dos situaciones:
Si se consigue el resultado esperado, puede servir de referencia para otros procesos y sectores de la empresa u otras unidades, por ejemplo. Si el resultado no está a la altura de las expectativas, hay que analizarlo para encontrar nuevas soluciones. Es importante decir que el mercado es muy dinámico, se crean innovaciones tecnológicas todo el tiempo y es muy difícil que un patrón que funcionaba bien se consolide como definitivo. Aunque la estrategia haya funcionado bien, es probable que haya algo que mejorar, entrando de nuevo en el ciclo PDCA.
¿Cuándo utilizar el PDCA?
El método puede emplearse en cualquier proceso, de modo que la empresa se encuentra siempre en un ciclo de mejora continua para implantar normas y aumentar la eficiencia.
Cuantas más repeticiones se hagan, mayor será la ganancia de calidad y mejor será la entrega al cliente, aumentando la ventaja competitiva.
El PDCA puede utilizarse para:
Gestión rutinaria: estandarizando los procesos del día a día de la empresa y definiendo un nivel de calidad para las actividades.
Gestión para la mejora: estableciendo un cierto nivel de calidad, pero buscando siempre una nueva adaptación a las inestabilidades externas, encontrando formas de diferenciarse y destacar en el mercado.
0 notes
Text
6 großartige Excel-Vorlagen zu dem Thema "PDCA-Zyklus" zu einem günstigen Preis kaufen
6 großartige Excel-Vorlagen zu dem Thema “PDCA-Zyklus” zu einem günstigen Preis kaufen
PDCA-Zyklus Der PDCA-Zyklus beschreibt einen iterativen vierphasigen Prozess für Lernen und Verbesserung des US-amerikanischen Physikers Walter Andrew Shewhart. PDCA ist eine Abkürzung und steht hierbei für Plan (Planen) Do (Umsetzen) Check (Überprüfen) Act (Handeln), Die Ursprünge des Prozesses liegen in der Qualitätssicherung. Der PDCA-Zyklus ist auch bekannt unter Demingkreis oder auch…

View On WordPress
#Chart#Controlling#Deming-Rad#Demingkreis#Diagramm#Excel#PDCA#PDCA-Zyklus#Plan Do Check Act#Shewhart Cycle#Walter Andrew Shewhart
0 notes