#comp5
Explore tagged Tumblr posts
Text

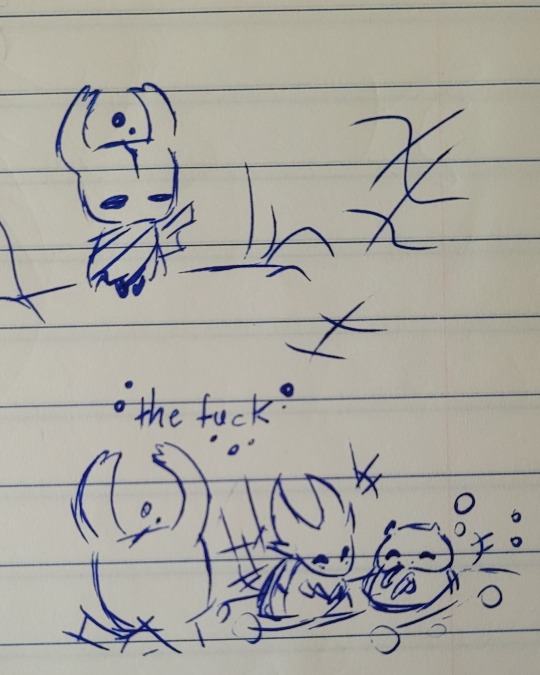


comp5 , beginning adventures in city of tears!
#hunter's playing hollow knight#hk ghost#dung defender#soul master#hk bretta#I struggled on ogrim I'll admit#I struggled a lot
113 notes
·
View notes
Text
Comp5 project
This assignment has many different steps to it. Be sure to check off each one so you know that you accomplished it. You will be creating a personal résumé in Microsoft Word, revising your PowerPoint presentation from Week 5 Discussion, and then zipping these files along with your Excel spreadsheet that you created for Week 4 Project into a compressed folder to upload to the Week 5 Project…
View On WordPress
0 notes
Text
Data Analysis Tools - week 2
LIBNAME mydata "/courses/d1406ae5ba27fe300 " access=readonly;
DATA new; set mydata.marscrater_pds;
attrib Lat length=$12
Szz length=$8
NL length=$3;
LABEL Lat="Latitude (in degrees)"
Number_Layers="# Layers"
Szz="Crater Size (in km)"
NL="Num Layers";
If Latitude_Circle_Image <=-60 then Lat = "A <-60";
ELSE If Latitude_Circle_Image >-60 and Latitude_Circle_Image <=-30 then Lat = "B >-60 <=-30";
ELSE If Latitude_Circle_Image >-30 and Latitude_Circle_Image <=0 then Lat = "C >-30 <=0";
ELSE If Latitude_Circle_Image >0 and Latitude_Circle_Image <=30 then Lat = "D >0 <=30";
ELSE If Latitude_Circle_Image >30 and Latitude_Circle_Image <=60 then Lat = "E >30 <=60";
ELSE IF Latitude_Circle_Image >60 then Lat = "F >60";
If Diam_Circle_Image <=50 then Szz = "<=100";
ELSE IF Diam_Circle_Image > 50 and Diam_Circle_Image <=100 then Szz = ">100-200";
ELSE IF Diam_Circle_Image > 100 and Diam_Circle_Image <=300 then Szz = ">200-300";
ELSE IF Diam_Circle_Image > 150 and Diam_Circle_Image <=400 then Szz = ">300-400";
ELSE IF Diam_Circle_Image > 400 then Szz = ">400 km";
If Number_Layers <= 0 then NL = "0";
ELSE IF Number_Layers > 0 then NL = ">=1";
PROC SORT; by crater_id;
RUN;
DATA COMP1; SET NEW;
IF Szz = "<=100" OR Szz = ">100-200";
PROC SORT; BY CRATER_ID;
PROC FREQ; TABLES NL*Szz/CHISQ;
RUN;
DATA COMP2; SET NEW;
IF Szz = "<=100" OR Szz = ">200-300";
PROC SORT; BY CRATER_ID;
PROC FREQ; TABLES NL*Szz/CHISQ;
RUN;
DATA COMP3; SET NEW;
IF Szz = "<=100" OR Szz = ">300-400";
PROC SORT; BY CRATER_ID;
PROC FREQ; TABLES NL*Szz/CHISQ;
RUN;
DATA COMP4; SET NEW;
IF Szz = "<=100" OR Szz = ">400 km";
PROC SORT; BY CRATER_ID;
PROC FREQ; TABLES NL*Szz/CHISQ;
RUN;
DATA COMP5; SET NEW;
IF Szz = ">100-200" OR Szz = ">200-300";
PROC SORT; BY CRATER_ID;
PROC FREQ; TABLES NL*Szz/CHISQ;
RUN;
DATA COMP6; SET NEW;
IF Szz = ">100-200" OR Szz = ">300-400";
PROC SORT; BY CRATER_ID;
PROC FREQ; TABLES NL*Szz/CHISQ;
RUN;
DATA COMP7; SET NEW;
IF Szz = ">100-200" OR Szz = ">400 km";
PROC SORT; BY CRATER_ID;
PROC FREQ; TABLES NL*Szz/CHISQ;
RUN;
DATA COMP8; SET NEW;
IF Szz = ">200-300" OR Szz = ">300-400";
PROC SORT; BY CRATER_ID;
PROC FREQ; TABLES NL*Szz/CHISQ;
RUN;
DATA COMP9; SET NEW;
IF Szz = ">200-300" OR Szz = ">400 km";
PROC SORT; BY CRATER_ID;
PROC FREQ; TABLES NL*Szz/CHISQ;
RUN;
DATA COMP10; SET NEW;
IF Szz = ">300-400" OR Szz = ">400 km";
PROC SORT; BY CRATER_ID;
PROC FREQ; TABLES NL*Szz/CHISQ;
RUN;
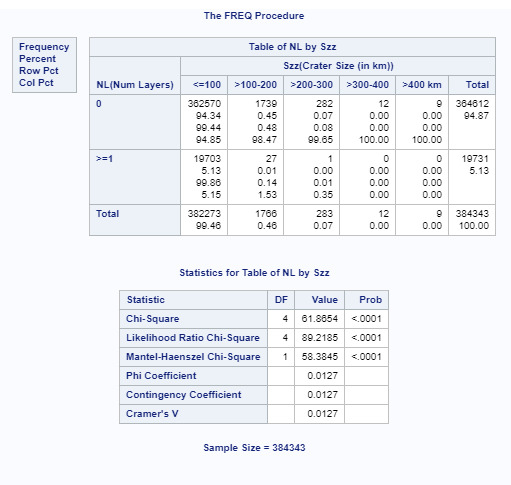
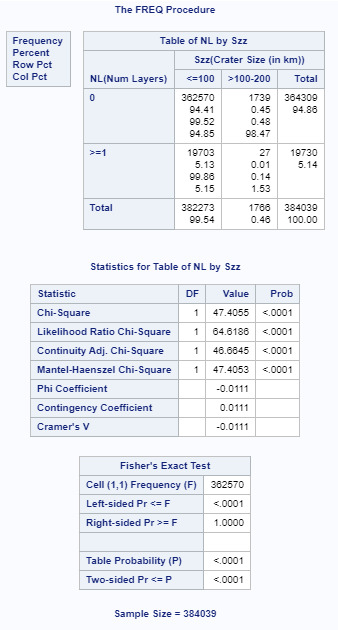

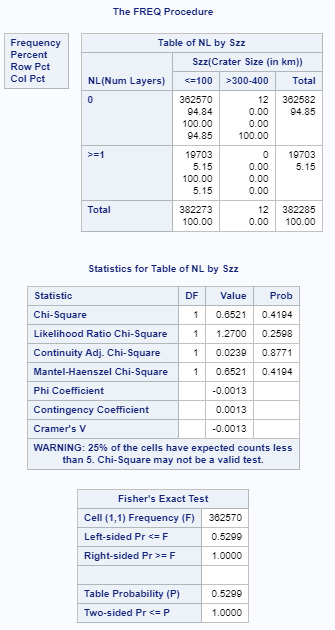
For this assignment I divided the number of craters into 2 categories, o and >=1 just to provide a 2 category column. The crater size data had already been broken down into 5 columns. As you can see, the initial p value of .0001 shows a relationship between number of layers and crater size. As I performed the ad hoc paired testing, the p value must be below .005 for 10 comparisons to show the null hypothesis is false. I have attached the 2 comparisons (<100 to 100-200, and <100 to 200-300 that met that criteria. I attached one other (<100 to 300-400) that had a higher p value. All remaining comparisons had a p value higher than .005. This shows that the data for the most numerous small craters show there is a relationship between size and number of layers.
0 notes
Text
Data Analysis Tools Week 2 Running a Chi-Square Test of Independence
1.Background
I have decided to look at Mars craters and ask the following question:
A. Are shallower depth craters associated with locations near the North and South poles of Mars?” The dataset was limited to craters that had a diameter of 100 km or less and a crater depth that was greater than 0 km.
I divided up the latitude of the planet into 5 bins based on the latitude degree increments/bins to see if there was a significant difference between the latitude of these groups and the depth of the crater.
I classified the crater as either being shallow or deep based on the crater depth. The cutoff was chosen to be 180m.
2.Notes about the Results
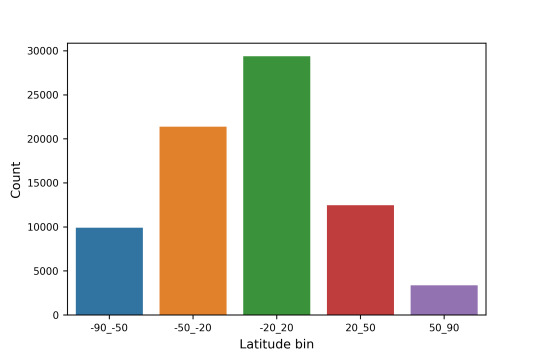
2.1 The crater count based on the latitude is shown below:
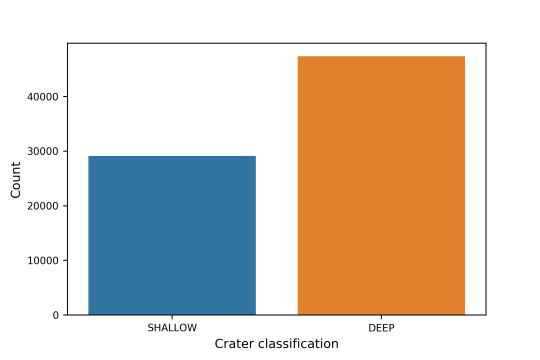
2.2 The crater classification is based on the plot below, where the majority of the craters are classified as deep.
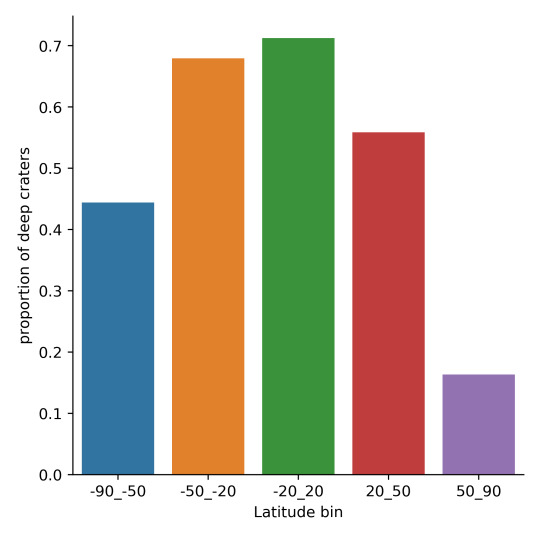
2.3 The overall mean deep craters are shown in the plot below. There seems to be a correlation between latitude and depth of the crater, with a higher concentration of deep craters near the equator of the planet. Lets perform a Chi-squared analysis to further investigate.
The Chi Squared test was run in Python and the full code is below in section 3. The full results are shown in section 4.
For example the Chi squared test that was coded was written as follows:

The output showed that the p value was under 0.05 and the value was 0.0 indicating that a Post Hoc test was necessary. The p value showed that the alternate hypothesis is to be accepted and there is a correlation between deep craters and the latitude.
Response Variable Categorical 2 Levels: Crater Depth (shallow or deep)
************************************************ LAT_LOCATION_GROUP -90_-50 -50_-20 -20_20 20_50 50_90 IS_CRATER_DEEP SHALLOW 5507 6847 8449 5501 2821 DEEP 4402 14528 20948 6966 551 LAT_LOCATION_GROUP -90_-50 -50_-20 -20_20 20_50 50_90 IS_CRATER_DEEP SHALLOW 0.555757 0.320327 0.28741 0.441245 0.836595 DEEP 0.444243 0.679673 0.71259 0.558755 0.163405 chi-square value, p value, expected counts (5870.45780474349, 0.0, 4, array([[ 3771.55808939, 8135.74065604, 11189.06985102, 4745.18263199, 1283.44877156], [ 6137.44191061, 13239.25934396, 18207.93014898, 7721.81736801, 2088.55122844]]))
An example Post Hoc test was coded as follows:
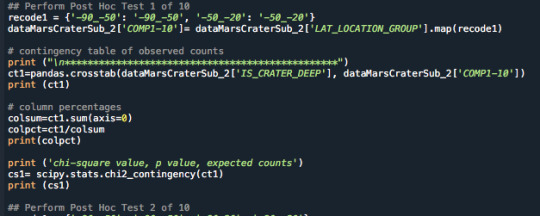
The output showed that the p value was 0.0 indicating the was under the Bonferroni adjustment and the null hypothesis was rejected indicating there is a correlation between latitude groups (-90 to -50 and -50 to -20):
************************************************ COMP1-10 -50_-20 -90_-50 IS_CRATER_DEEP SHALLOW 6847 5507 DEEP 14528 4402 COMP1-10 -50_-20 -90_-50 IS_CRATER_DEEP SHALLOW 0.320327 0.555757 DEEP 0.679673 0.444243 chi-square value, p value, expected counts (1569.4618848788969, 0.0, 1, array([[ 8440.95224396, 3913.04775604], [12934.04775604, 5995.95224396]]))
A table summarizing the results of the 10 Chi Square results are shown below. It shows that we can not accept the null hypothesis and there is a correlation between latitude and crater depth. There is a stronger correlation when looking at the areas close to the poles vs the equator.

3.Raw Python Code:
The raw Python code is shown in the photos below. I decided to use screenshots for easier readability as it includes syntax highlighting.
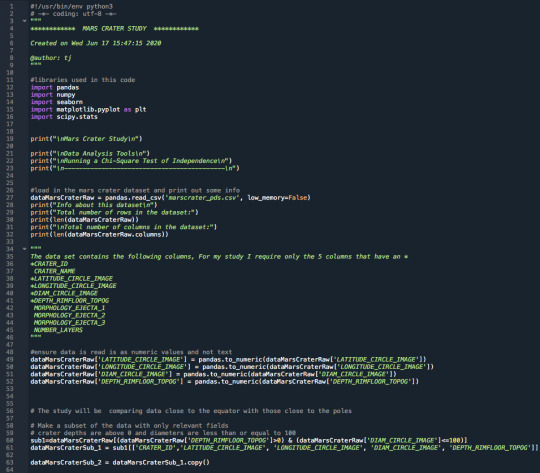
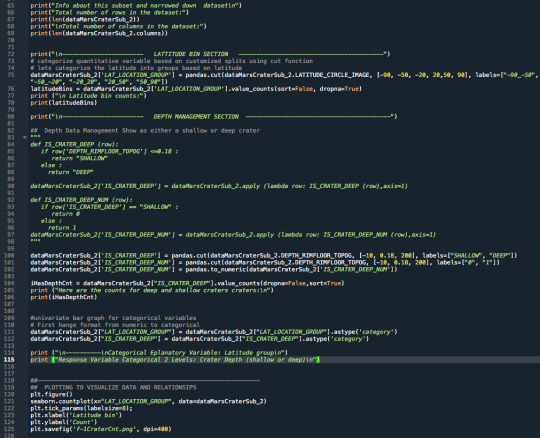
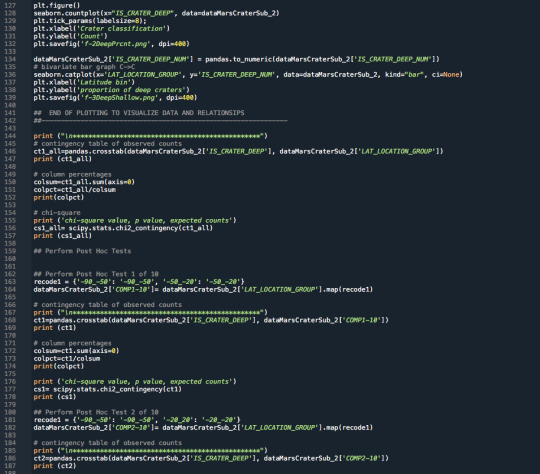
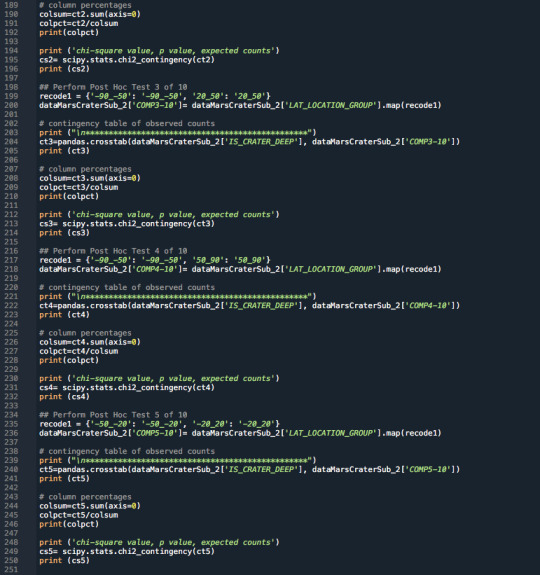
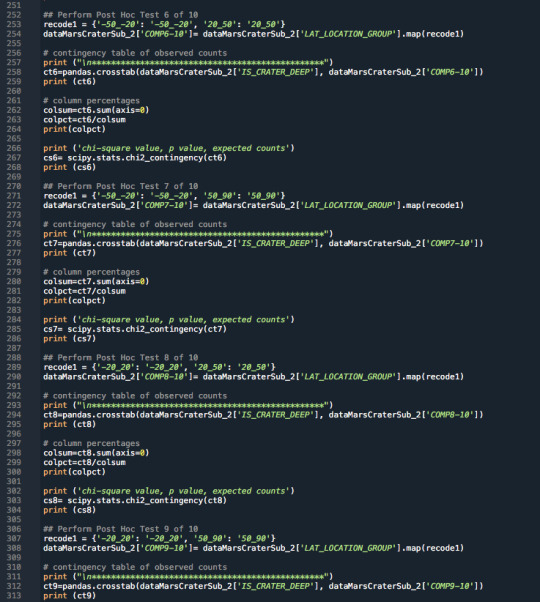

4.Code Output:
Below is the raw output from the code. The interpretation and comments on the results are shown above in Section 2.
Mars Crater Study
Data Analysis Tools
Running a Chi-Square Test of Independence
-------------------------------------------
Info about this dataset
Total number of rows in the dataset: 384343
Total number of columns in the dataset: 10 Info about this subset and narrowed down dataset
Total number of rows in the dataset: 76520
Total number of columns in the dataset: 5
----------------------- LATTITUDE BIN SECTION -----------------------------------------
Latitude bin counts: -90_-50 9909 -50_-20 21375 -20_20 29397 20_50 12467 50_90 3372 Name: LAT_LOCATION_GROUP, dtype: int64
----------------------- DEPTH MANAGEMENT SECTION ----------------------------------------- Here are the counts for deep and shallow craters craters:
DEEP 47395 SHALLOW 29125 Name: IS_CRATER_DEEP, dtype: int64
---------- Categorical Eplanatory Variable: Latitude group
Response Variable Categorical 2 Levels: Crater Depth (shallow or deep)
************************************************ LAT_LOCATION_GROUP -90_-50 -50_-20 -20_20 20_50 50_90 IS_CRATER_DEEP SHALLOW 5507 6847 8449 5501 2821 DEEP 4402 14528 20948 6966 551 LAT_LOCATION_GROUP -90_-50 -50_-20 -20_20 20_50 50_90 IS_CRATER_DEEP SHALLOW 0.555757 0.320327 0.28741 0.441245 0.836595 DEEP 0.444243 0.679673 0.71259 0.558755 0.163405 chi-square value, p value, expected counts (5870.45780474349, 0.0, 4, array([[ 3771.55808939, 8135.74065604, 11189.06985102, 4745.18263199, 1283.44877156], [ 6137.44191061, 13239.25934396, 18207.93014898, 7721.81736801, 2088.55122844]]))
************************************************ COMP1-10 -50_-20 -90_-50 IS_CRATER_DEEP SHALLOW 6847 5507 DEEP 14528 4402 COMP1-10 -50_-20 -90_-50 IS_CRATER_DEEP SHALLOW 0.320327 0.555757 DEEP 0.679673 0.444243 chi-square value, p value, expected counts (1569.4618848788969, 0.0, 1, array([[ 8440.95224396, 3913.04775604], [12934.04775604, 5995.95224396]]))
************************************************ COMP2-10 -20_-20 -90_-50 IS_CRATER_DEEP SHALLOW 8449 5507 DEEP 20948 4402 COMP2-10 -20_-20 -90_-50 IS_CRATER_DEEP SHALLOW 0.28741 0.555757 DEEP 0.71259 0.444243 chi-square value, p value, expected counts (2329.314932557565, 0.0, 1, array([[10437.70752557, 3518.29247443], [18959.29247443, 6390.70752557]]))
************************************************ COMP3-10 -90_-50 20_50 IS_CRATER_DEEP SHALLOW 5507 5501 DEEP 4402 6966 COMP3-10 -90_-50 20_50 IS_CRATER_DEEP SHALLOW 0.555757 0.441245 DEEP 0.444243 0.558755 chi-square value, p value, expected counts (289.20138905047946, 7.422790875630638e-65, 1, array([[4874.78870218, 6133.21129782], [5034.21129782, 6333.78870218]]))
************************************************ COMP4-10 -90_-50 50_90 IS_CRATER_DEEP SHALLOW 5507 2821 DEEP 4402 551 COMP4-10 -90_-50 50_90 IS_CRATER_DEEP SHALLOW 0.555757 0.836595 DEEP 0.444243 0.163405 chi-square value, p value, expected counts (847.2982157758986, 2.811519087431208e-186, 1, array([[6213.54958211, 2114.45041789], [3695.45041789, 1257.54958211]]))
************************************************ COMP5-10 -20_20 -50_-20 IS_CRATER_DEEP SHALLOW 8449 6847 DEEP 20948 14528 COMP5-10 -20_20 -50_-20 IS_CRATER_DEEP SHALLOW 0.28741 0.320327 DEEP 0.71259 0.679673 chi-square value, p value, expected counts (63.54773843933685, 1.5652720877138506e-15, 1, array([[ 8856.38761522, 6439.61238478], [20540.61238478, 14935.38761522]]))
************************************************ COMP6-10 -50_-20 20_50 IS_CRATER_DEEP SHALLOW 6847 5501 DEEP 14528 6966 COMP6-10 -50_-20 20_50 IS_CRATER_DEEP SHALLOW 0.320327 0.441245 DEEP 0.679673 0.558755 chi-square value, p value, expected counts (496.2855186756665, 6.111846388145869e-110, 1, array([[ 7799.14012174, 4548.85987826], [13575.85987826, 7918.14012174]]))
************************************************ COMP7-10 -50_-20 50_90 IS_CRATER_DEEP SHALLOW 6847 2821 DEEP 14528 551 COMP7-10 -50_-20 50_90 IS_CRATER_DEEP SHALLOW 0.320327 0.836595 DEEP 0.679673 0.163405 chi-square value, p value, expected counts (3258.881845816943, 0.0, 1, array([[ 8350.64856346, 1317.35143654], [13024.35143654, 2054.64856346]]))
************************************************ COMP8-10 -20_20 20_50 IS_CRATER_DEEP SHALLOW 8449 5501 DEEP 20948 6966 COMP8-10 -20_20 20_50 IS_CRATER_DEEP SHALLOW 0.28741 0.441245 DEEP 0.71259 0.558755 chi-square value, p value, expected counts (931.7404706337541, 1.2358200405213006e-204, 1, array([[ 9795.72305561, 4154.27694439], [19601.27694439, 8312.72305561]]))
************************************************ COMP9-10 -20_20 50_90 IS_CRATER_DEEP SHALLOW 8449 2821 DEEP 20948 551 COMP9-10 -20_20 50_90 IS_CRATER_DEEP SHALLOW 0.28741 0.836595 DEEP 0.71259 0.163405 chi-square value, p value, expected counts (4040.9902387527836, 0.0, 1, array([[10110.29295981, 1159.70704019], [19286.70704019, 2212.29295981]]))
************************************************ COMP10-10 20_50 50_90 IS_CRATER_DEEP SHALLOW 5501 2821 DEEP 6966 551 COMP10-10 20_50 50_90 IS_CRATER_DEEP SHALLOW 0.441245 0.836595 DEEP 0.558755 0.163405 chi-square value, p value, expected counts (1662.095048322109, 0.0, 1, array([[6550.31087821, 1771.68912179], [5916.68912179, 1600.31087821]]))
0 notes
Text
Tävlingsvikter från AllStrength
Viktskivor 5-25kg Tävlingsvikter från AllStrength är sk. Competition Bumper plates för tävling och gym. Färgad rand och text för att enkelt se de olika vikterna.
Tävlingsvikter från AllStrength
5 kg 40 cm diameter
7,5 kg -25 kg 45 cm diameter
Exakt vikt +-50 gram
Artikelnummer:
Comp5 – 5kg 595 kr exm styck
Comp10 – 10kg 790 kr exm. styck
Comp15 – 15kg 990 kr exm. styck
Comp20 – 20kg 1 190 kr…
View On WordPress
0 notes
Text
1903 Buena Vista St, Central North Side, Pittsburgh, PA, 15214
1903 Buena Vista St, Central North Side, Pittsburgh, Pennsylvania 15214 This is a wholesale fix/flip investment opportunity currently under contract by us. We are selling the purchase contract (our equitable interest) over to a cash buyer. Hurry, this one won't last long! First investor with $2000 EMD will be awarded. Attention Realtors, Co-Wholesalers. Bring us a cash buyer for this property and earn $5,000. Please use the PDF investor package below and add your name as the service provider to the front cover. Investor Package PDF Purchase Price: $95,000 ARV: $350,000 Rehab Costs: $120,000 Potential Profit: $82,960 Rehabbed Sold COMPS Below on MLS HERE COMP1: 520 W Jefferson St, Central North Side, Pennsylvania 15212, SOLD $390,000 COMP2: 1700 Buena Vista St, Central North Side, Pennsylvania 15212, SOLD $391,500 COMP3: 1534 Monterey St., Central North Side, Pennsylvania 15212, SOLD $349,000 COMP4: 1538 Monterey Street, Central North Side, Pennsylvania 15212, SOLD $429,995 COMP5: 1224 Monterey St, Pittsburgh, PA 15212, SOLD $555,000 More reahabbed COMPS

Property Details: 3 bedroom, 1 bathroom (recommend adding additional bathroom(s) Living Space: 1728 sq/ft Build 1900, 2 story, street parking (potential on side for driveway), vinyl siding, property is vacant Description: Perfect opportunity for a renovation. With full renovation this home could be incredible. Located in Central North Side, this two-story style home has 3 bedrooms 1903 Buena Vista St is situated in the Pittsburgh School District. Zillow predicts Perry South home values will rise 3.6% next year, compared to a 5% increase for Pittsburgh as a whole. Places of interest located in the Central North Side Pittsburgh district include: Heinz Field - NFL Pittsburgh Steelers PNC Park - MLB Pittsburgh Pirates Victorian houses in Allegheny West 16th Street Bridge Allegheny Observatory Andy Warhol Museum Carnegie Science Center County Germantown historic district Manchester historic district Mattress Factory Mexican War Streets historic district located in Central North Side National Aviary Riverview Park West Park Children's Museum of Pittsburgh Community College of Allegheny To gain access to the property please contact us at mobile: 435-776-2240 or our realtor Elise Bickel from Keller Williams @ mobile: 724-996-6683 Due Diligence Deadline: June 22 / 2018 Settlement Date: July 6 / 2018 Read the full article
0 notes
Text
Chi²
The following analysis shows the relationship assessment between the depth and the diameter of the mars craters. The null hypothesis assumes that the depth increase according to the diameter of the craters. With the Chi² test it is possible to say that the null hypothesis cannot be refused, except for the cases that involves the depth interval from 4 to 5. This analysis confirm the graph tendency, that shows that the depth of the craters increase up to category 4-5, when the values drop down.
The results and the code are presented below:
COMP1 (-1, 1] (1, 2] CAT_DIAM_CIRCLE_IMAGE (1, 50] 375320 3714 (50, 1170] 1086 776 COMP1 (-1, 1] (1, 2] CAT_DIAM_CIRCLE_IMAGE (1, 50] 0.997115 0.827171 (50, 1170] 0.002885 0.172829 chi-square value, p-value and expected counts (26307.73928914812, 0.0, 1, array([[3.74565949e+05, 4.46805075e+03], [1.84005075e+03, 2.19492460e+01]])) COMP2 (1, 2] (2, 3] CAT_DIAM_CIRCLE_IMAGE (1, 50] 3714 107 (50, 1170] 776 195 COMP2 (1, 2] (2, 3] CAT_DIAM_CIRCLE_IMAGE (1, 50] 0.827171 0.354305 (50, 1170] 0.172829 0.645695 chi-square value, p-value and expected counts (388.6868001527464, 1.5986878600726574e-86, 1, array([[3580.19407346, 240.80592654], [ 909.80592654, 61.19407346]])) COMP3 (2, 3] (3, 4] CAT_DIAM_CIRCLE_IMAGE (1, 50] 107 2 (50, 1170] 195 10 COMP3 (2, 3] (3, 4] CAT_DIAM_CIRCLE_IMAGE (1, 50] 0.354305 0.166667 (50, 1170] 0.645695 0.833333 chi-square value, p-value and expected counts (1.0606313939984895, 0.3030712228105186, 1, array([[104.8343949, 4.1656051], [197.1656051, 7.8343949]])) COMP4 (3, 4] (4, 5] CAT_DIAM_CIRCLE_IMAGE (1, 50] 2 1 (50, 1170] 10 3 COMP4 (3, 4] (4, 5] CAT_DIAM_CIRCLE_IMAGE (1, 50] 0.166667 0.25 (50, 1170] 0.833333 0.75 chi-square value, p-value and expected counts (0.13675213675213677, 0.711531417761122, 1, array([[2.25, 0.75], [9.75, 3.25]])) COMP5 (-1, 1] (1, 3] CAT_DIAM_CIRCLE_IMAGE (1, 50] 375320 3821 (50, 1170] 1086 971 COMP5 (-1, 1] (1, 3] CAT_DIAM_CIRCLE_IMAGE (1, 50] 0.997115 0.797371 (50, 1170] 0.002885 0.202629 chi-square value, p-value and expected counts (35138.049317127116, 0.0, 1, array([[3.74374858e+05, 4.76614167e+03], [2.03114167e+03, 2.58583308e+01]])) COMP6 (-1, 1] (1, 4] CAT_DIAM_CIRCLE_IMAGE (1, 50] 375320 3823 (50, 1170] 1086 981 COMP6 (-1, 1] (1, 4] CAT_DIAM_CIRCLE_IMAGE (1, 50] 0.997115 0.795795 (50, 1170] 0.002885 0.204205 chi-square value, p-value and expected counts (35612.11122482119, 0.0, 1, array([[3.74365048e+05, 4.77795171e+03], [2.04095171e+03, 2.60482883e+01]])) COMP7 (-1, 1] (1, 5] CAT_DIAM_CIRCLE_IMAGE (1, 50] 375320 3824 (50, 1170] 1086 984 COMP7 (-1, 1] (1, 5] CAT_DIAM_CIRCLE_IMAGE (1, 50] 0.997115 0.795341 (50, 1170] 0.002885 0.204659 chi-square value, p-value and expected counts (35751.231014360455, 0.0, 1, array([[3.74362108e+05, 4.78189246e+03], [2.04389246e+03, 2.61075406e+01]])) COMP8 (1, 2] (2, 4] CAT_DIAM_CIRCLE_IMAGE (1, 50] 3714 109 (50, 1170] 776 205 COMP8 (1, 2] (2, 4] CAT_DIAM_CIRCLE_IMAGE (1, 50] 0.827171 0.347134 (50, 1170] 0.172829 0.652866 chi-square value, p-value and expected counts (413.2075233000307, 7.344083031890247e-92, 1, array([[3573.1203164, 249.8796836], [ 916.8796836, 64.1203164]])) COMP9 (2, 3] (3, 5] CAT_DIAM_CIRCLE_IMAGE (1, 50] 107 3 (50, 1170] 195 13 COMP9 (2, 3] (3, 5] CAT_DIAM_CIRCLE_IMAGE (1, 50] 0.354305 0.1875 (50, 1170] 0.645695 0.8125 chi-square value, p-value and expected counts (1.2040727717026352, 0.2725091793647979, 1, array([[104.46540881, 5.53459119], [197.53459119, 10.46540881]]))
import pandas import numpy import seaborn import matplotlib.pyplot as p import scipy.stats
data=pandas.read_csv('_b190b54e08fd8a7020b9f120015c2dab_marscrater_pds.csv', low_memory=False) #declare variables data['MORPHOLOGY_EJECTA_1']=data['MORPHOLOGY_EJECTA_1'].replace(' ', numpy.nan) data['MORPHOLOGY_EJECTA_2']=data['MORPHOLOGY_EJECTA_2'].replace(' ', numpy.nan) data['DEPTH_RIMFLOOR_TOPOG']=data['DEPTH_RIMFLOOR_TOPOG'].replace(' ', numpy.nan) data['DIAM_CIRCLE_IMAGE']=data['DIAM_CIRCLE_IMAGE'].replace(' ', numpy.nan)
print(len(data)) #number of observations (rows) print(len(data.columns)) #number of variables (columns)
c3=data['DEPTH_RIMFLOOR_TOPOG'].value_counts(sort=False) #number of observations of Depth p3=data['DEPTH_RIMFLOOR_TOPOG'].value_counts(sort=False, normalize=True) #percentage of Depth
c5=data.groupby('DEPTH_RIMFLOOR_TOPOG').size() #group and categorize rimfloor depth data['CAT_RIMFLOOR_DEPTH']=pandas.cut(data.DEPTH_RIMFLOOR_TOPOG,[-1,1,2,3,4,5]) data['CAT_RIMFLOOR_DEPTH']=data['CAT_RIMFLOOR_DEPTH'].astype('category')
c6=data.groupby('DIAM_CIRCLE_IMAGE').size() #group and categorize circle diameter data['CAT_DIAM_CIRCLE_IMAGE']=pandas.cut(data.DIAM_CIRCLE_IMAGE,[1,50,1170]) data['CAT_DIAM_CIRCLE_IMAGE']=data['CAT_DIAM_CIRCLE_IMAGE'].astype('category')
#recoding the variables - composition 1 data['COMP1']=pandas.cut(data.DEPTH_RIMFLOOR_TOPOG,[-1,1,2]) data['COMP1'].dropna(inplace=True)
#contigency table of observed counts ct1=pandas.crosstab(data['CAT_DIAM_CIRCLE_IMAGE'], data['COMP1']) print(ct1)
#column percentages calculation colsum1=ct1.sum(axis=0) colpct1=ct1/colsum1 print(colpct1)
#chi-square calculation print ('chi-square value, p-value and expected counts') cs1=scipy.stats.chi2_contingency(ct1) print(cs1)
#recoding the variables - composition 2 data['COMP2']=pandas.cut(data.DEPTH_RIMFLOOR_TOPOG,[1,2,3]) data['COMP2'].dropna(inplace=True)
#contigency table of observed counts ct2=pandas.crosstab(data['CAT_DIAM_CIRCLE_IMAGE'], data['COMP2']) print(ct2)
#column percentages calculation colsum2=ct2.sum(axis=0) colpct2=ct2/colsum2 print(colpct2)
#chi-square calculation print ('chi-square value, p-value and expected counts') cs2=scipy.stats.chi2_contingency(ct2) print(cs2)
#recoding the variables - composition 3 data['COMP3']=pandas.cut(data.DEPTH_RIMFLOOR_TOPOG,[2,3,4]) data['COMP3'].dropna(inplace=True)
#contigency table of observed counts ct3=pandas.crosstab(data['CAT_DIAM_CIRCLE_IMAGE'], data['COMP3']) print(ct3)
#column percentages calculation colsum3=ct3.sum(axis=0) colpct3=ct3/colsum3 print(colpct3)
#chi-square calculation print ('chi-square value, p-value and expected counts') cs3=scipy.stats.chi2_contingency(ct3) print(cs3)
#recoding the variables - composition 4 data['COMP4']=pandas.cut(data.DEPTH_RIMFLOOR_TOPOG,[3,4,5]) data['COMP4'].dropna(inplace=True)
#contigency table of observed counts ct4=pandas.crosstab(data['CAT_DIAM_CIRCLE_IMAGE'], data['COMP4']) print(ct4)
#column percentages calculation colsum4=ct4.sum(axis=0) colpct4=ct4/colsum4 print(colpct4)
#chi-square calculation print ('chi-square value, p-value and expected counts') cs4=scipy.stats.chi2_contingency(ct4) print(cs4)
#recoding the variables - composition 5 data['COMP5']=pandas.cut(data.DEPTH_RIMFLOOR_TOPOG,[-1,1,3]) data['COMP5'].dropna(inplace=True)
#contigency table of observed counts ct5=pandas.crosstab(data['CAT_DIAM_CIRCLE_IMAGE'], data['COMP5']) print(ct5)
#column percentages calculation colsum5=ct5.sum(axis=0) colpct5=ct5/colsum5 print(colpct5)
#chi-square calculation print ('chi-square value, p-value and expected counts') cs5=scipy.stats.chi2_contingency(ct5) print(cs5)
#recoding the variables - composition 6 data['COMP6']=pandas.cut(data.DEPTH_RIMFLOOR_TOPOG,[-1,1,4]) data['COMP6'].dropna(inplace=True)
#contigency table of observed counts ct6=pandas.crosstab(data['CAT_DIAM_CIRCLE_IMAGE'], data['COMP6']) print(ct6)
#column percentages calculation colsum6=ct6.sum(axis=0) colpct6=ct6/colsum6 print(colpct6)
#chi-square calculation print ('chi-square value, p-value and expected counts') cs6=scipy.stats.chi2_contingency(ct6) print(cs6)
#recoding the variables - composition 7 data['COMP7']=pandas.cut(data.DEPTH_RIMFLOOR_TOPOG,[-1,1,5]) data['COMP7'].dropna(inplace=True)
#contigency table of observed counts ct7=pandas.crosstab(data['CAT_DIAM_CIRCLE_IMAGE'], data['COMP7']) print(ct7)
#column percentages calculation colsum7=ct7.sum(axis=0) colpct7=ct7/colsum7 print(colpct7)
#chi-square calculation print ('chi-square value, p-value and expected counts') cs7=scipy.stats.chi2_contingency(ct7) print(cs7)
#recoding the variables - composition 8 data['COMP8']=pandas.cut(data.DEPTH_RIMFLOOR_TOPOG,[1,2,4]) data['COMP8'].dropna(inplace=True)
#contigency table of observed counts ct8=pandas.crosstab(data['CAT_DIAM_CIRCLE_IMAGE'], data['COMP8']) print(ct8)
#column percentages calculation colsum8=ct8.sum(axis=0) colpct8=ct8/colsum8 print(colpct8)
#chi-square calculation print ('chi-square value, p-value and expected counts') cs8=scipy.stats.chi2_contingency(ct8) print(cs8)
#recoding the variables - composition 9 data['COMP9']=pandas.cut(data.DEPTH_RIMFLOOR_TOPOG,[2,3,5]) data['COMP9'].dropna(inplace=True)
#contigency table of observed counts ct9=pandas.crosstab(data['CAT_DIAM_CIRCLE_IMAGE'], data['COMP9']) print(ct9)
#column percentages calculation colsum9=ct9.sum(axis=0) colpct9=ct9/colsum9 print(colpct9)
#chi-square calculation print ('chi-square value, p-value and expected counts') cs9=scipy.stats.chi2_contingency(ct9) print(cs9)
0 notes
Text
Fox Racing Comp 5 Men’s Off-Road Motorcycle Boots – White / Size 10
COMP5 familiar in the short term, high performance boots. Adopt a sole high-durability of intended use in the race. Simple and reliable locking aluminum buckle. Secure full leather body.
from Amazon Best Sellers http://app.amazonreviews.org/fox-racing-comp-5-mens-off-road-motorcycle-boots-white-size-10/
0 notes
Link
Unisystems | Q&R W3C Αθήνα, 29 Μαΐου 2017 ΔΕΛΤΙΟ ΤΥΠΟΥ ΥΠΟΒΟΛΗ ΑΙΤΗΣΕΩΝ ΣΥΜΜΕΤΟΧ��Σ ΣΤΗΝ ΠΡΟΚΗΡΥΞΗ 5Κ/2017 Γνωστοποιείται ότι εκκίνησε η διαδικασία υποβολής των αιτήσεων των υποψηφίων στην Προκήρυξη 5Κ/2017 του ΑΣΕΠ (ΦΕΚ 16/9-5-2017 Τεύχος Προκηρύξεων ΑΣΕΠ) που αφορά στην πλήρωση, με σειρά προτεραιότητας, διακοσίων πενήντα επτά (257) θέσεων τακτικού προσωπικού Πανεπιστημιακής, Τεχνολογικής και Δευτεροβάθμιας Εκπαίδευσης σε φορείς του Υπουργείου Υγείας και στο Αρεταίειο Νοσοκομείο (Υπουργείο Παιδείας, Έρευνας και Θρησκευμάτων). Οι υποψήφιοι πρέπει να συμπληρώσουν και να υποβάλουν ηλεκτρονική αίτηση συμμετοχής στο Α.Σ.Ε.Π. (Πολίτες → Ηλεκτρονικές Υπηρεσίες) ακολουθώντας τις οδηγίες που παρέχονται στην Προκήρυξη (Παράρτημα ΣΤ΄). Σχετικά επισημαίνονται και τα ακόλουθα : Η προθεσμία υποβολής των ηλεκτρονικών αιτήσεων συμμετοχής στη διαδικασία λήγει στις 13 Ιουνίου 2017, ημέρα Τρίτη και ώρα 14:00. Η συμμετοχή στην εν λόγω διαδικασία ολοκληρώνεται με την αποστολή της υπογεγραμμένης εκτυπωμένης μορφής της ηλεκτρονικής αίτησης των υποψηφίων, με τα απαιτούμενα, κατά περίπτωση, δικαιολογητικά, στο ΑΣΕΠ, μέχρι και τη 16η Ιουνίου 2017, ημέρα Παρασκευή, ταχυδρομικά με συστημένη επιστολή στη διεύθυνση: Α.Σ.Ε.Π. Αίτηση για την Προκήρυξη 5Κ/2017 Τ.Θ. 14308 Αθήνα Τ.Κ. 11510 αναγράφοντας στο φάκελο την κατηγορία Π.Ε. ή Τ.Ε. ή Δ.Ε. της οποίας θέσεις διεκδικούν. Για την ομαλή λειτουργία του συστήματος υποβολής των ηλεκτρονικών αιτήσεων, συνιστάται στους υποψήφιους να μην περιμένουν την τελευταία ημέρα για να υποβάλλουν την ηλεκτρονική τους αίτηση καθώς τυχόν υπερφόρτωση του διαδικτύου ή σφάλμα στη σύνδεση με αυτό θα μπορούσε να οδηγήσει σε δυσκολία ή αδυναμία υποβολής αυτής. Το ΑΣΕΠ δεν φέρει ευθύνη για τυχόν αδυναμία υποβολής ηλεκτρονικής αίτησης που οφείλεται στους προαναφερόμενους παράγοντες. Για γενικές διευκρινίσεις σχετικά με την Προκήρυξη και τη συμμετοχή σε αυτή (δικαιολογητικά, τίτλοι σπουδών κτλ.) οι υποψήφιοι μπορούν να απευθύνονται στο Γραφείο Εξυπηρέτησης Πολιτών του ΑΣΕΠ τηλεφωνικά (2131319100, εργάσιμες ημέρες και ώρες 08:00 μέχρι 14:00) ή μέσω email στο [email protected] Για τυχόν τεχνικές διευκρινίσεις και μόνο σχετικά με τη διαδικασία συμπλήρωσης και υποβολής των ηλεκτρονικών αιτήσεων, οι υποψήφιοι μπορούν να απευθύνονται στη Διεύθυνση Ηλεκτρονικής Διοίκησης του ΑΣΕΠ τηλεφωνικά (2131319100): Τις εργάσιμες ημέρες · Κατά τις ώρες 08:00 μέχρι 20:00 Τις αργίες · Κατά τις ώρες 10:00 μέχρι 16:00 ή μέσω email στο [email protected] Σε κάθε περίπτωση, κρίνεται απαραίτητο οι υποψήφιοι να συμβουλεύονται τις Συχνές Ερωτήσεις, τα Εγχειρίδια Χρήσης και τον Ηλεκτρονικό Οδηγό της Προκήρυξης (Βοήθεια → Συχνές Ερωτήσεις ή e-Οδηγός 5Κ/2017 ή Εγχειρίδια Χρήσης) πριν την επικοινωνία τους με το ΑΣΕΠ.
0 notes
Text
Fox Racing Comp 5 Men’s Off-Road Motorcycle Boots – White / Size 9
COMP5 familiar in the short term, high performance boots. Adopt a sole high-durability of intended use in the race. Simple and reliable locking aluminum buckle. Secure full leather body.
from Amazon Best Sellers http://app.amazonreviews.org/fox-racing-comp-5-mens-off-road-motorcycle-boots-white-size-9/
0 notes