#Smart Cities Market Revenue Value
Explore tagged Tumblr posts
Visit Tumblr Blog
Explore Tumblr blogs with no restrictions, modern design and the best experience.
Last Seen Tumblr Blogs


Fun Fact
The average Tumblr user visits about 67 pages every month.
Note
After seeing your weatherbugapp reblog i installed duckduckgo and tried it.

I don't know much about technology tbh but i downloaded this app less than 30 mins ago and in that time google tried to track me 112 times?? And they tried to collect finger prints? And my first and last name? And my gender? And my country, state and city? My gps coordinates? My postal code? My network carrier? My fricking battery level for whatever reason? Can you please tell me if this is normal at all, because i'm freaking out right now. I just turned 18 and started using mobile banking and stuff and this shit scares me
Why tf does it need to know my screen density???my system volume????my charging status????? What tf are they cooking
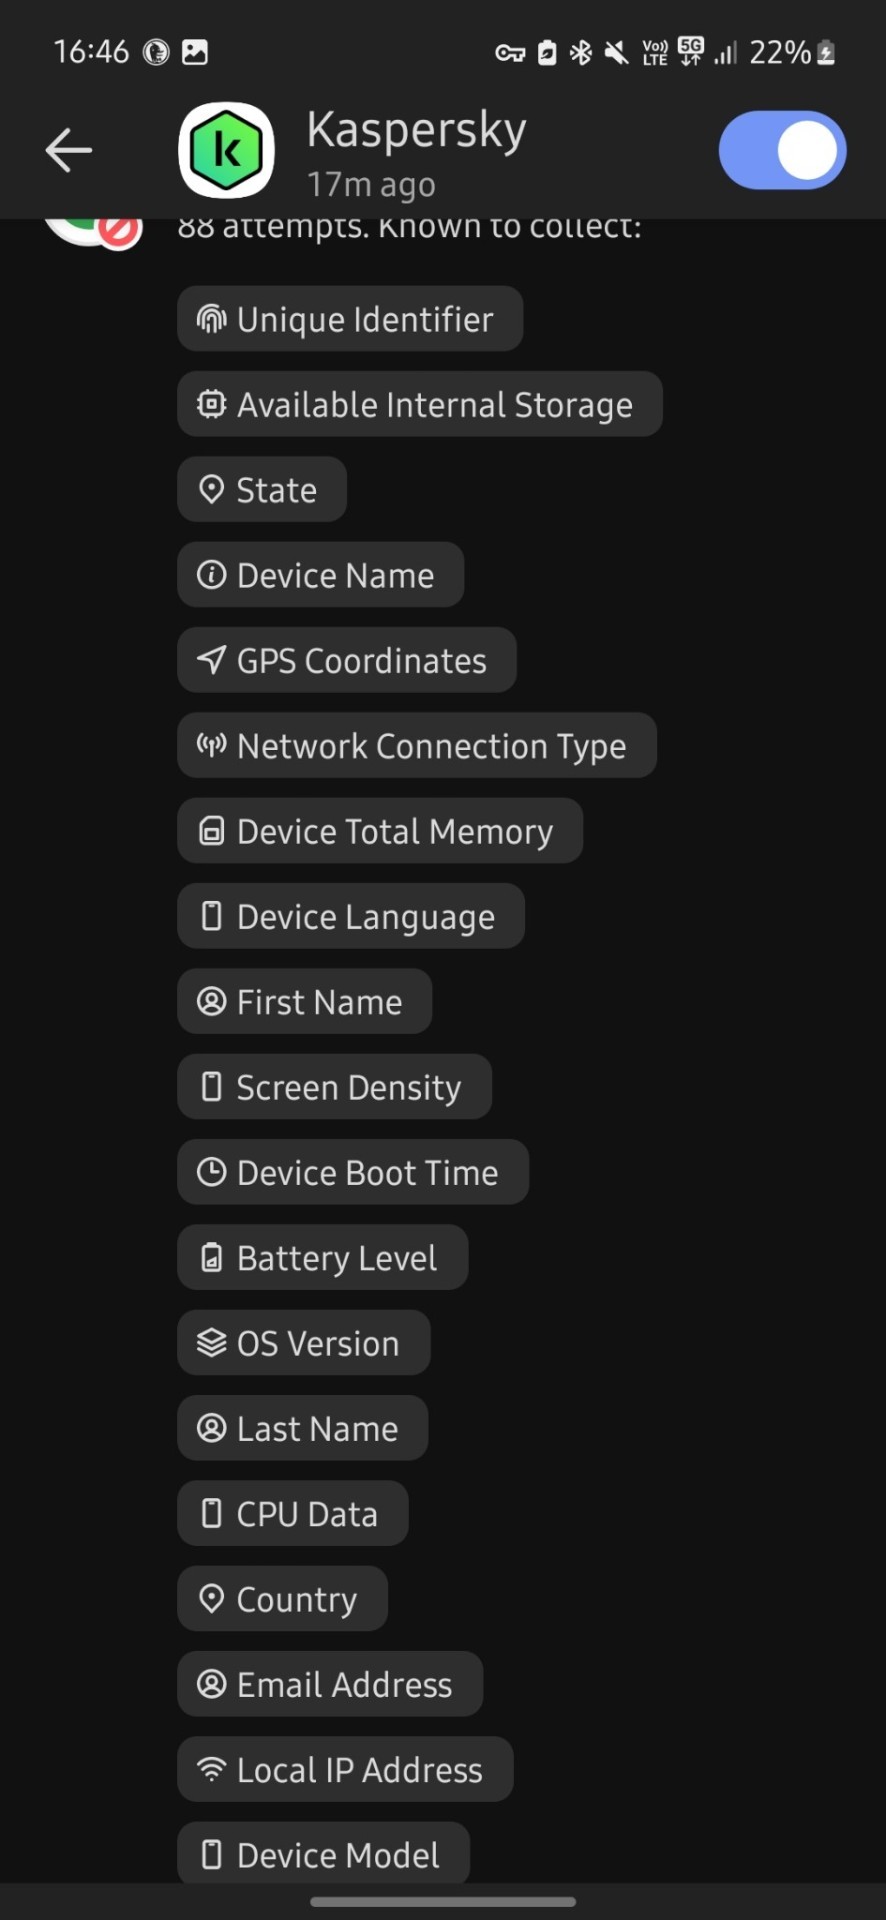
Now it's at 476 tracking attempts bro???? barely 5 mins passed.....
I condensed your three asks into one for readability!
And yeah, I'm very far from an expert about any of this, but as far as I know that's just. Normal. That's the normal amount of spying they're doing on your phone. I assume the numbers we see are to some extent because having been foiled, a lot of these scripts try repeatedly, since I can't imagine what use thousands of trackers per phone would be even to the great aggregators.
Tracking the phone stuff like screen resolution and battery level is because (apart from that definitely not being considered remotely 'private' so it's Free Real Estate) in aggregate that data can be used to track what phone use patterns are like on a demographic scale and therefore. Where the smart money is.
Almost all of this is getting sold in bulk for ad targeting and market analysis. This does presumably make it very hard to notice when like. Actually important stuff is being spied on, which is why I feel better about Having Apps with the duckduckgo app blocker thing.
My bank's app reportedly sells data to a couple aggregators including Google. Not like, my banking info, but it's still so offensive on principle that I avoid using the app unless I have to, and force stop it afterward.
The patterns that show up on the weekly duckduckgo blocker report are interesting. Hoopla attempts about two orders of magnitude more tracking than Libby, which makes sense because they're a commercial streaming service libraries pay by the unit for access, while Libby is a content management software run by a corporation that values its certification as a 'B' company--that is, one invested in the public good that can be trusted. The cleanness of their brand is a great deal of its value, so they have to care about their image and be a little more scrupulous.
Which doesn't mean not being a little bit spyware, because everything is spyware now. Something else I've noticed is that in terms of free game apps, the polished professional stuff is now much more invasive than the random kinda janky thing someone just threw together.
Back in the day you tended to expect the opposite, because spyware was a marginal shifty profit-margin with too narrow a revenue stream to be worth more to an established brand than their reputation, but now that everyone does it there's not a lot of reputation cost and refraining would be sacrificing a potential revenue stream, which is Irresponsible Conduct for a corporation.
While meanwhile 'developing a free game app to put on the game store' is something a person can do for free with the hardware they already have for home use, as a hobby or practice or to put on their coding resume. So while such apps absolutely can be malicious and more dangerous when they are than The Big Brand, they can also be neutral in a way commercial stuff no longer is. Wild world.
But yeah for the most part as far as I can make out, these are just The Commercial Panopticon, operating as intended. It's gross but it probably doesn't indicate anything dangerous on an individual level.
56 notes
·
View notes
Text
🚀 Airport Road Mohali: A Real Estate Growth Corridor
Airport Road in Mohali is a prominent growing destination in the center of Punjab's quickly changing real estate market. What was once a straightforward connecting stretch has seen a dramatic transition in recent years, becoming one of North India's most sought-after real estate corridors.
Airport Road Mohali offers a lot to offer, regardless of your needs as a homeowner, investor, or anyone seeking a second property.

✨ Why Airport Road is Booming in Real Estate
1. Prime Location and Seamless Connectivity
Chandigarh International Airport is directly accessible (10–15 minutes).
Simple access to Zirakpur, Chandigarh, Panchkula, and the main areas of Tricity.
Congestion-free travel is guaranteed by wide, signal-free roads.
2. Infrastructure at its Best
There are several flyovers, elevated roadways, and underpasses in the planning stages.
World-class hospitals, malls, IT parks, and schools are opening up quickly.
Near Mohali Railway Station, IT City, and future metro line plans.
3. Range of Property Options
From reasonably priced plots and builder floors to opulent 3 and 4 BHK residences.
There are options for every budget, including autonomous villas, high-rise apartments, and gated communities.
Excellent rental revenue potential because of the close proximity to corporates, institutions, and the airport.
🌆 Benefits of Living or Investing on Airport Road, Mohali
✔️ High Return on Investment: Real estate values have been rising rapidly, and further expansion is anticipated in 2025–2026.
✔️ Calm Yet Connected: Blends the convenience of city connectivity with the tranquility of suburban living.
✔️ Business and Employment Opportunities: Aerocity, IT City, and Knowledge City are all nearby, which increases demand for jobs and rental properties.
✔️Wi-Fi zones, smart lamps, and trash management systems in more recent developments are examples of smart city features.
✔️ Future Plans: Malls, hospitality projects, and proposals for foreign colleges.
👪 What Buyers Are Saying – Real Testimonials
🗣️ Ravneet Kaur, Investor (Delhi): "I invested in a 3 BHK on Airport Road in 2022. The value has nearly doubled! It’s the smartest real estate decision I’ve ever made."
🗣️ Ankur Sharma, NRI Buyer (Canada): "Airport Road had everything I was looking for—safe, modern, and near the airport. My parents love living here!"
🗣️ Priya Mehta, Business Owner (Chandigarh): "Having my home just 10 minutes from the airport has made travel so easy. It’s the perfect blend of luxury and convenience."
💡 Who Should Consider Buying Here?
Professionals in the workforce searching for homes with good connections
Investors looking to increase their capital
NRIs seeking opulent real estate near the airport
Families aiming for a modern yet tranquil lifestyle
📈 Final Thoughts: A Corridor You Can’t Ignore
The real estate market in Punjab is still dominated by Airport Road Mohali because to its strong demand, continuous infrastructural improvements, and unparalleled connectivity. It's a wise investment in your future, not just a place to live.
📞 Connect with Sarvottam Real Estates
Searching for the ideal real estate investment or your ideal home on Airport Road in Mohali? Let professionals lead the way!
Get in touch with us now:
📱 Call: 9988244033 🌐 Website: sarvottamrealestates.com 👍 Follow us on Facebook
#across the spiderverse#ryan gosling#real estate#property#commercial real estate#investment#mohali#Airport road#3bhk
2 notes
·
View notes
Text
Electrical Conduit Pipe Market Analysis By Segmentations, Top Key Players, Geographical Expansion, Future Development & Forecast 2034
Fact.MR, in its latest research report released recently, states that the worldwide electrical conduit pipe market stands at US$ 34,302.4 million in 2024, and is anticipated to grow at a 4.8% CAGR to reach a market value of US$ 54,819.8 million by the end of 2034. Market Research Report.
The size of the electrical conduit pipe market is likely to witness growth opportunities in emerging markets due to the development of e-commerce, which has greatly revolutionized the operations of businesses, including those involved in the production and supply of building and construction materials, like electrical conduit pipes. Growing online buying and widespread adoption of e-commerce platforms provide new opportunities and benefits for electrical conduit pipe manufacturers.
For More Insights into the Market, Request a Sample of this Report: https://www.factmr.com/connectus/sample?flag=S&rep_id=9412
Country-wise Insights
Fact.MR, a competitive intelligence and market research solutions provider, affirms in its recently released research report that by 2034, North America is estimated to have a 29.9% share in the global market. Ongoing and future residential and commercial buildings projects drive substantially the demand for electrical conduit pipes.
The United States is also expected to control 64.1% of the North American market in 2034. Government policies and higher investments in infrastructure development, such as residential, commercial, and industrial buildings, can fuel the demand for electrical conduit pipes. The establishment of smart cities and the use of IoT devices in urban infrastructure can cause higher demand for conduit systems to accommodate and safeguard the required wiring.
China is predicted to have a 59.5% market revenue share in the East Asia market by the year 2034. Expansion of the manufacturing industry in China, particularly in the production of electronics and electrical equipment, can fuel the need for conduit systems in industrial environments.
Category-wise Insights
On the basis of application, worldwide demand for electrical conduit pipe is expected to grow substantially in the IT and Telecommunication segment. The IT and telecommunication industry undergoes quick technological improvements and regular upgrading. Conduit systems enable one to be adaptable to evolving technologies by offering a modular and adjustable infrastructure for cabling installations.
The IT and Telecommunication portion of electrical conduit pipe is expected to maintain a market share of 52.5% by 2034. Electrical conduit pipes create a safe and neat route for installation and safeguarding data cables, fiber optic cables, and other communication wiring, which is most important in IT and telecommunication infrastructure where the protection and management of cables take precedence.
Conduit systems prevent electromagnetic interference, which is crucial for ensuring the reliability and integrity of data transmission in IT and telecommunication networks, particularly for preserving signal quality and preventing data loss or corruption.
Competitive Landscape
Key players within the electrical conduit pipe industry are adopting a variety of strategies in order to achieve their goals. The strategies include promoting innovation, embracing stringent quality control across their product ranges, forming strategic alliances, streamlining supply chain management systems, and constantly improving both their products and technologies.
Recent Development
In 2022, Atkore International Group Inc. acquired Elite Polymer Solutions, a leading High-Density Polyethylene tubing conduit manufacturer, successfully. Elite Polymer Solutions serves the telecom, utility, and transportation industries. The strategic purchase increases Atkore's portfolio of HDPE pipe products and expands its geography, allowing the company to capitalize on the increasing demand for underground protection in the electrical, utility, and telecommunications markets.
Wienerberger AG, Aliaxis Group S.A., Sekisui Chemical Co., Ltd., Atkore International Group Inc., China Lesso Group Holdings Ltd., Nan Ya Plastics Corp., Zekelman Industries Inc., Orbia Advance Corporation, OPW Corporation, are major players in the market.
Browse Full Report: https://www.factmr.com/report/electrical-conduit-pipe-market
Segmentation of Electrical Conduit Pipe Market Research
By Application :
Electrical Wire Cables
IT and Telecommunication
By Type :
Rigid Conduit Pipe
Flexible Conduit Pipe
By Region :
North America
Europe
East Asia
Latin America
Middle East & Africa
South Asia & Oceania
𝐂𝐨𝐧𝐭𝐚𝐜𝐭:
US Sales Office 11140 Rockville Pike Suite 400 Rockville, MD 20852 United States Tel: +1 (628) 251-1583, +353-1-4434-232 Email: [email protected]
1 note
·
View note
Text
0 notes
Text
AI Camera Market Report with Revolutionizing Security and Surveillance
The global AI camera market was valued at USD 13.93 billion in 2024 and is projected to reach USD 47.02 billion by 2030, exhibiting a robust Compound Annual Growth Rate (CAGR) of 21.6% from 2025 to 2030. This significant growth is primarily fueled by the increasing demand for intelligent surveillance solutions across various sectors, including retail, transportation, government, and smart cities.
The market's expansion is further accelerated by advancements in edge computing, deep learning algorithms, and real-time video analytics, which are enhancing the adoption of AI-powered cameras for improved security and operational efficiency. Moreover, rising concerns about public safety and crime rates, coupled with the need for proactive threat detection, are driving organizations to invest in AI camera systems. These systems are often integrated with technologies like facial recognition, IoT, and cloud platforms to offer comprehensive solutions.
The demand for real-time monitoring and intelligent threat detection across sectors such as transportation, manufacturing, and public safety is a key catalyst for the AI camera industry's growth. The proliferation of edge computing and advanced analytics boosts on-device processing, enabling immediate incident response and reducing reliance on human intervention. These factors, combined with the ability of AI cameras to deliver actionable insights in real-time, are expected to substantially drive market growth.
Key Market Trends & Insights
• North America led the AI camera market in 2024, accounting for over 34% of the revenue share. This dominance is attributed to substantial investments in smart city initiatives and advanced surveillance infrastructure, with a strong focus on integrating AI with existing security and analytics systems for enhanced real-time threat detection and operational efficiency. • Within North America, the U.S. AI camera industry held the largest revenue share, exceeding 65% in 2024. This is primarily due to the widespread adoption of AI cameras across government, retail, and transportation sectors. • By component, the hardware segment secured the largest market share, over 52% in 2024. This highlights the critical need for high-performance, edge-capable hardware to support AI camera functionalities. The market is also witnessing significant advancements within this segment. • In terms of camera type, surveillance cameras accounted for the largest market share in 2024, driven by the growing demand for intelligent surveillance solutions. • Regarding technology, the image/face recognition segment held the highest market share in 2024. This is a direct result of the increasing adoption of these technologies across diverse sectors such as security, retail, banking, and healthcare for identity verification, access control, and customer behavior analysis.
Market Size & Forecast
• 2024 Market Size: USD 13.93 Billion • 2030 Projected Market Size: USD 47.02 Billion • CAGR (2025-2030): 21.6% • North America: Largest market in 2024 • Asia Pacific: Fastest growing market
Order a free sample PDF of the AI Camera Market Intelligence Study, published by Grand View Research.
Key Companies & Market Share Insights
Leading players in the market include Bosch Security Systems GmbH and Axis Communications AB.
• Axis Communications AB is recognized for its network cameras and video surveillance solutions, particularly for pioneering IP-based security products. Their AI-enabled cameras incorporate advanced analytics for real-time threat detection and scalable security management, supported by a strong global presence and innovation focus.
• Bosch Security Systems GmbH specializes in high-quality security systems featuring embedded AI capabilities in their intelligent video surveillance cameras. They emphasize integrating AI with IoT for smart building and city applications, enhancing safety and operational efficiency. Bosch's reputation for robust hardware and software integration solidifies its market position.
Emerging participants in the AI camera market include Teledyne FLIR LLC and Canon Inc.
• Teledyne FLIR LLC is emerging as a specialist in thermal imaging and AI-enhanced sensor fusion cameras for security and industrial applications. Their innovations in infrared technology, combined with AI analytics, cater to niche markets such as critical infrastructure monitoring and perimeter security. Rapid product development and strategic partnerships are positioning FLIR as a rising contender. • Canon Inc. is expanding its AI camera capabilities beyond traditional optics, focusing on intelligent imaging solutions that integrate AI for enhanced video analytics and object recognition. Their emphasis on combining optical excellence with AI-driven software is enhancing applications in retail and public safety, marking them as an emerging innovator in the market.
Conclusion
The AI camera market is undergoing rapid growth, driven by an escalating demand for intelligent surveillance and enhanced operational efficiency across various industries. Key trends include the dominance of North America in terms of market share, the crucial role of hardware in supporting AI capabilities, and the widespread adoption of image/face recognition technologies. As edge computing and advanced analytics continue to evolve, AI cameras are becoming indispensable for real-time monitoring and proactive threat detection. The market is also seeing strong competition and innovation from established players like Bosch and Axis Communications, as well as emerging ones like Teledyne FLIR and Canon, all striving to deliver more sophisticated and integrated AI solutions. This trajectory suggests that AI cameras will increasingly become foundational elements in security, smart city initiatives, and industrial automation, leading to a more connected and secure future.
Explore Horizon Databook – The world's most expansive market intelligence platform developed by Grand View Research.
#AI Camera Market#AI Camera Industry#AI Camera Market Growth#AI Camera Market Analysis#AI Camera Market Forecast#AI Camera Market Size
0 notes
Text
Why Bus Ticket Prices in India Don’t Always Make Sense—And How AI Is Fixing It
Traveler: I just paid ₹850 for a 200-km bus ride in Karnataka. Last week, I traveled 350 km in Odisha for ₹500. Why is pricing so inconsistent?
Pricing Expert: Great question. Bus ticket pricing in India isn’t just about distance—it’s shaped by state taxes, travel alternatives, and regional demand. Let’s break it down.
🧾 State Taxes: The Hidden Fare Factor
Traveler: So taxes really affect ticket prices?
Pricing Expert: Absolutely. Each state has its own transport tax policies. For example:
Road tax is charged per seat, per year or quarter.
Fuel sales tax varies—Telangana charges 27%, making it the most expensive state for diesel.
Two operators running the same route—say, Bangalore to Bhubaneswar—but registered in different states can show up to 63% fare variance, purely due to tax exposure.
Traveler: That’s huge. Do operators do anything to manage this?
Pricing Expert: Many register fleets in low-tax states like Nagaland or Arunachal Pradesh to reduce fixed costs. It’s legal and strategic.
🚍 Travel Alternatives: The Competition Game
Traveler: What about other transport options?
Pricing Expert: They matter a lot. In cities like Mumbai and Pune, passengers have:
Trains
MSRTC buses
Ride-sharing apps
Personal vehicles
This forces private bus operators to keep fares competitive. In contrast, regions with fewer alternatives—like parts of the Northeast—see higher fares due to limited supply and inelastic demand.
Traveler: And government buses?
Pricing Expert: State Transport Undertakings (STUs) are a major factor. They operate under regulated fare bands. For example, Tamil Nadu STU added 455 buses during Pongal 2025, keeping fares low despite high demand.
Private operators must adjust pricing carefully to avoid losing passengers to STUs.
📈 Static Pricing vs. Dynamic Pricing
Traveler: So how do operators keep up?
Pricing Expert: Static pricing doesn’t work anymore. That’s why many use AI-powered dynamic pricing platforms like Viaje.ai.
Traveler: What does Viaje.ai do?
Pricing Expert: It:
Adjusts fares every 15 minutes
Integrates tax and fuel cost data
Tracks STU schedules and competitor pricing
Forecasts demand using travel calendars
Optimizes pricing for occupancy and revenue
Operators using Viaje.ai report:
↑ 15% revenue during peak seasons
↓ 20% fare volatility
↑ Seat utilization through cut-seat bookings
🧠 Strategy for a Fragmented Market
Traveler: Sounds like a lot to manage.
Pricing Expert: It is. India’s bus market is fragmented. Each state has its own:
Tax rules
Travel patterns
Modal competition
Smart operators:
Understand local tax structures
Monitor travel alternatives
Use AI tools for pricing
Register fleets strategically
Plan inventory based on demand
🚀 Final Thought: Pricing with Context
Traveler: So next time I see a weird fare, I’ll know it’s not random?
Pricing Expert: Exactly. Bus ticket pricing in India is a puzzle—but it’s one that can be solved with data, strategy, and smart tech. With platforms like Viaje.ai, operators can price with precision, passengers get fair value, and the system becomes more transparent.
Traveler: Thanks! I’ll be looking at fares differently now.
Pricing Expert: And that’s the power of intelligent pricing.
0 notes
Text
Security Turnstiles and Gates Market Growth Analysis, Market Dynamics, Key Players and Innovations, Outlook and Forecast 2025-2031
According to a comprehensive market research analysis, the global Security Turnstiles and Gates market was valued at US$ 995.7 million in 2024 and is projected to grow to US$ 1,266.0 million by 2030, expanding at a CAGR of 4.08% during the forecast period (2024-2030). This steady growth reflects increasing security concerns across commercial, industrial, and public sectors globally, coupled with technological advancements in access control solutions.
What Are Security Turnstiles and Gates?
Security turnstiles and gates are physical barriers designed for controlled pedestrian and vehicular access management, typically integrating with electronic security systems. Modern solutions increasingly incorporate biometric verification, RFID card readers, facial recognition, and AI analytics for enhanced security. The market has evolved from basic mechanical barriers to sophisticated integrated systems capable of real-time threat detection and crowd management.
Leading manufacturers like Gunnebo, Boon Edam, and Dormakaba continue to innovate, with the top three players accounting for approximately 35% of global revenue in 2023. The competitive landscape remains dynamic as companies develop smarter, more customizable solutions addressing diverse security needs from corporate offices to high-risk transportation hubs.
Key Market Growth Drivers
1. Rising Security Concerns Across Multiple Sectors
The global surge in security incidents has significantly increased adoption rates across several key sectors:
Corporate Security: 68% of Fortune 500 companies now use turnstile systems in headquarters.
Transportation: Airport security upgrades account for 22% of professional installations.
Critical Infrastructure: Government mandates drive adoption in power plants and utilities.
Smart Cities: Integrated public transit systems increasingly incorporate intelligent gates.
2. Technological Integration and Innovations
Recent advancements have transformed traditional turnstiles into intelligent access control systems:
Biometric Authentication: Facial recognition systems now process 50+ individuals per minute.
Touchless Solutions: Pandemic-era demand accelerated contactless technologies.
AI Analytics: Behavioral recognition detects suspicious movements in real-time.
Modular Designs: Customizable configurations for diverse architectural requirements.
Market Challenges and Constraints
Despite strong growth prospects, several factors restrain market expansion:
High Initial Costs: Full-height turnstile systems average $15,000-$50,000 per unit installed.
Integration Complexities: Legacy system compatibility remains challenging for 40% of implementations.
Privacy Concerns: Biometric data collection faces increasing regulatory scrutiny globally.
Maintenance Requirements: Mechanical components demand frequent servicing in high-traffic environments.
Emerging Opportunities
Several high-growth opportunities are shaping the market's future:
Smart City Development: Asia-Pacific governments investing $35B annually in secure urban infrastructure.
Retail Analytics Integration: Combining security with customer flow tracking and heat mapping.
Hybrid Work Security: Corporate offices redesigning entry systems for flexible workplace models.
The modular security gate segment shows particular promise, allowing enterprises to scale systems as needs evolve. For instance, Jieshun's recent FlexGuard series enables configuration changes without full system replacements, addressing a key pain point for growing businesses.
Regional Market Dynamics
North America: Leads in innovation adoption, with 38% market share in premium solutions.
Europe: Strict security regulations drive replacement cycles every 5-7 years.
Asia-Pacific: Fastest-growing region (7.2% CAGR) fueled by infrastructure development.
Middle East/Africa: Major projects like NEOM city creating demand spikes.
Competitive Landscape Analysis
The market features both global specialists and regional players:
Market Leaders: Gunnebo's SpeedGate solutions dominate corporate segments.
Innovation Focus: Boon Edam's thermal scanning integration addresses pandemic needs.
Emerging Competitors: Chinese manufacturers like Hongmen gain share through cost advantages.
Recent strategic moves include Dormakaba's 2024 acquisition of a Brazilian access control firm, expanding Latin American presence. Meanwhile, KONE's elevator-integrated solutions create seamless vertical-horizontal security ecosystems.
Market Segmentation Insights
By Product Type:
Tripod Turnstiles (32% share)
Full-Height Turnstiles (28%)
Optical Turnstiles (22%)
Vehicle Access Gates (18%)
By Technology:
Mechanical (Legacy systems)
RFID Card Readers (51% adoption)
Biometric Systems (Growing at 12% CAGR)
AI-Powered (Premium segment)
By Application:
Corporate Offices (38%)
Transportation Hubs (29%)
Government Facilities (18%)
Stadiums/Entertainment (15%)
Industry Trends and Future Outlook
Three transformative trends are reshaping the market:
Convergence with Building IoT: Gates increasingly serve as data collection points for smart buildings.
Sustainability Focus: Energy-efficient models reduce operational costs by 30-40%.
Modular Architecture: Allows cost-effective future upgrades as needs evolve.
The market's trajectory suggests particular strength in optical turnstiles and biometric integration, with these segments projected to outpace overall market growth. Meanwhile, emerging touchless vein recognition technology may redefine authentication standards by 2026.
Report Scope and Methodology
This comprehensive analysis provides:
Detailed segment-level forecasts through 2030
Competitive benchmarking of 18 key players
Emerging technology impact analysis
Download FREE Sample Report: Security Turnstiles and Gates Market - View in Detailed Research Report
Access Full Research: Complete Security Turnstiles and Gates Market Analysis
About Intel Market Research
Intel Market Research delivers actionable insights in physical security and infrastructure markets. Our research methodology combines:
Primary interviews with 120+ industry executives annually
Technology adoption tracking across 22 vertical markets
Real-world deployment case study analysis
Trusted by security directors and facility managers worldwide, we empower data-driven decisions through precision analysis. Contact: International: +1(332) 2424 294 | Asia: +91 9169164321
Website: https://www.intelmarketresearch.com
Connect With Us: LinkedIn: Intel Market Research
Visit more report :
0 notes
Text
Subscriber Data Management Market Growth: Key Players and Competitive Landscape for 2025
The global subscriber data management market is estimated to be valued at USD 7.8 billion in 2024 and is projected to reach USD 20.2 billion by 2030, growing at a compound annual growth rate (CAGR) of 17.4% from 2025 to 2030. The market's growth is driven by several key factors, including the rising prevalence of infectious diseases among companion and livestock animals, increasing pet ownership, and heightened awareness of animal health.

Additionally, the shift toward cloud and hybrid cloud deployments is enabling telecom operators to adopt scalable and flexible subscriber data management (SDM) solutions. However, the high implementation costs of advanced SDM platforms present a significant challenge, particularly for small and mid-sized operators. The growing demand for fixed mobile convergence (FMC) and VoIP services also offers major growth opportunities for the market.
The increasing demand for 5G networks and the Internet of Things (IoT) is a significant driver of growth in the SDM market. The higher speeds and lower latency of 5G create new opportunities across various industries, from autonomous vehicles to smart cities. To manage the influx of connected devices and services, operators require robust SDM solutions to ensure efficient data handling, security, and seamless user experiences. For instance, in August 2022, Orange Egypt extended its partnership with Nokia to modernize its SDM infrastructure, preparing for 5G services and enhancing operational efficiency. This highlights the growing importance of SDM in supporting advanced network architectures and managing complex 5G and IoT ecosystems.
Order a free sample PDF of the Subscriber Data Management Market Intelligence Study, published by Grand View Research.
Key Market Trends & Insights
North America dominated the subscriber data management market, accounting for 31.5% of the revenue share in 2024. The market's growth in this region is driven by the rapid expansion of 5G networks and the increasing demand for efficient data management solutions to handle growing subscriber data. The widespread adoption of cloud-native core networks by major telecom operators, including AT&T and Verizon, is further fueling the need for scalable SDM platforms for real-time data synchronization and policy control.
The policy management segment led the market with a revenue share of 33.1% in 2024. This growth is attributed to the increasing adoption of 5G core networks and the need for dynamic, real-time control of data sessions and services. Operators are deploying advanced policy control functions (PCF) to support differentiated services, QoS enforcement, and slicing strategies in 5G environments.
The mobile networks segment accounted for the largest revenue share in 2024, driven by the rapid expansion of 5G deployments, rising mobile data traffic, and the growing number of mobile subscribers. The adoption of cloud-native mobile cores and network slicing is prompting mobile operators to invest in advanced SDM platforms that support real-time subscriber data processing and dynamic policy control.
The mobile application segment represented the largest revenue share in 2024, fueled by the rapid adoption of 5G networks, increased mobile data consumption, and a growing number of mobile-based applications such as streaming, gaming, and e-commerce. According to the GSM Association, the number of unique mobile subscribers is expected to grow from 5.8 billion in 2024 to 6.5 billion by 2030, highlighting the ongoing global expansion of mobile services.
By deployment mode, the on-premises segment captured the largest market revenue share in 2024, driven by the demand for full control over data security and compliance. Traditional infrastructures, especially in legacy systems, still dominate many sectors where data privacy and regulatory requirements are paramount.
In terms of organization size, the large enterprises segment accounted for the largest market revenue share in 2024, driven by the need for advanced data management systems, high-volume subscriber data processing, and regulatory compliance. Larger enterprises typically have bigger technology budgets and require tailored SDM solutions to meet their specific needs.
Market Size & Forecast
2024 Market Size: USD 7.8 Billion
2030 Projected Market Size: USD 20.2 Billion
CAGR (2025-2030): 17.4%
North America: Largest market in 2024
Key Companies & Market Share Insights
Key players in the market include Telefonaktiebolaget LM Ericsson, Huawei Technologies Co., Ltd., Nokia Corporation, Oracle Corporation, and Cisco Systems, Inc.
Telefonaktiebolaget LM Ericsson, established in 1876 and headquartered in Stockholm, Sweden, is a leading player in telecommunications and subscriber data management solutions. The company provides end-to-end network infrastructure, cloud-native software, and managed services to telecom operators. Ericsson’s SDM portfolio includes products for unified data management, policy control, and user data consolidation across 4G, 5G, and IoT networks, supporting mobile operators in over 180 countries.
Huawei Technologies Co., Ltd., founded in 1987 and headquartered in Shenzhen, China, is a global provider of information and communications technology (ICT) infrastructure and smart devices. In the subscriber data management space, Huawei offers cloud-native SDM solutions designed for multi-access, high concurrency, and distributed deployment across 5G, IoT, and converged networks, with operations in more than 170 countries.
Key Players
Telefonaktiebolaget LM Ericsson
Huawei Technologies Co., Ltd.
Nokia Corporation
Oracle Corporation
Cisco Systems, Inc.
Amdocs Limited
Hewlett Packard Enterprise Company
ZTE Corporation
Samsung Electronics Co., Ltd.
Mavenir Systems, Inc.
Explore Horizon Databook – The world's most expansive market intelligence platform developed by Grand View Research.
Conclusion
The subscriber data management market is poised for significant growth, driven by the increasing demand for efficient data management solutions amid the rapid expansion of 5G networks and IoT. As telecom operators seek to enhance their capabilities, the need for scalable and flexible SDM solutions will become more crucial. With North America leading the market and large enterprises driving demand, the SDM landscape will continue to evolve, presenting opportunities for innovation and collaboration among key players in the industry.
#Subscriber Data Management#Subscriber Data Management Market#Subscriber Data Management Industry#Subscriber Data Management Market Size#Subscriber Data Management Market Share#Subscriber Data Management Industry Research#Subscriber Data Management Industry Trends#Subscriber Data Management Market Analysis#Subscriber Data Management Market Forecast
0 notes
Text
Digital Display System Market: Economic Impact and Global Forecast 2025–2032
Digital Display System Market, Trends, Business Strategies 2025-2032
Digital Display System Market size was valued at US$ 12.67 billion in 2024 and is projected to reach US$ 19.84 billion by 2032, at a CAGR of 5.8% during the forecast period 2025-2032
Our comprehensive Market report is ready with the latest trends, growth opportunities, and strategic analysis https://semiconductorinsight.com/download-sample-report/?product_id=103411
MARKET INSIGHTS
The global Digital Display System Market size was valued at US$ 12.67 billion in 2024 and is projected to reach US$ 19.84 billion by 2032, at a CAGR of 5.8% during the forecast period 2025-2032.
Digital display systems encompass a range of electronic visual communication devices that dynamically present information, advertisements, or multimedia content. These systems include technologies such as LCD, LED, OLED, and interactive displays, serving applications across retail, transportation, healthcare, and corporate environments. Their ability to deliver real-time updates and engage audiences has made them indispensable in modern communication strategies.
The market growth is primarily driven by rising demand for digital signage, technological advancements in display resolutions, and increasing adoption across smart city initiatives. While North America and Asia-Pacific currently dominate market share due to infrastructure investments, emerging economies are witnessing accelerated adoption. Key industry players like Samsung Electronics, LG Display, and Sony Corporation continue to innovate with ultra-high-definition and energy-efficient solutions, further propelling market expansion.
List of Key Digital Display System Companies Profiled
LG Electronics (South Korea)
Samsung Electronics (South Korea)
Sony Corporation (Japan)
NEC Corporation (Japan)
Sharp Corporation (Japan)
Planar Systems (U.S.)
AdQue (U.S.)
Navori Labs (Switzerland)
ACMI (U.S.)
Dyonics (U.S.)
Mintron (Taiwan)
NMD (U.S.)
Olympus (Japan)
Smith & Nephew (U.K.)
Stryker (U.S.)
Reflex (Canada)
Segment Analysis:
By Type
LED Displays Hold the Largest Share Due to Energy Efficiency and High Brightness
The market is segmented based on type into:
LED displays
LCD displays
OLED displays
Projection displays
Others
By Application
Retail Sector Leads Adoption Owing to Rising Demand for Digital Signage
The market is segmented based on application into:
Retail
Transportation
Healthcare
Hospitality
Education
By Technology
Touchscreen Displays Gain Prominence Across Multiple Industries
The market is segmented based on technology into:
Standard displays
Interactive/touchscreen displays
3D displays
Transparent displays
By End User
Commercial Sector Drives Market Growth with Digital Advertising Requirements
The market is segmented based on end user into:
Commercial
Residential
Industrial
Government
Regional Analysis: Digital Display System Market
North America North America holds a significant share of the digital display system market, driven by strong technology adoption across retail, healthcare, and corporate sectors. The U.S., with its advanced infrastructure, accounts for over 40% of the regional revenue, with major players like LG Electronics and Samsung Electronics leading the market. High demand for interactive kiosks, LED billboards, and smart signage in urban centers like New York and Los Angeles continues to fuel growth. However, high installation costs and stringent energy regulations pose challenges, particularly for small and medium enterprises. The region also sees innovation in transparent OLED displays, with applications expanding into automotive and retail environments.
Europe Europe’s digital display market is characterized by a strong emphasis on sustainability and energy efficiency, influenced by EU directives such as the Ecodesign Regulation. Germany and the U.K. are the frontrunners, leveraging digital displays for public transport systems, advertising, and smart city initiatives. The healthcare sector is another growth driver, with Stryker and Olympus integrating advanced displays into surgical and diagnostic equipment. Competition from regional players like Navori Labs has intensified, particularly in the digital signage segment. Despite economic uncertainties, investments in 4K and 8K displays for commercial use remain robust.
Asia-Pacific The Asia-Pacific region is the fastest-growing market, driven by rapid urbanization and infrastructure development. China dominates, contributing nearly 50% of regional demand, with Samsung and Sony maintaining strong footholds. Countries like India and South Korea are seeing explosive growth in outdoor LED displays, especially for advertising and public events. However, cost sensitivity in emerging markets has led to the dominance of mid-tier displays over premium solutions. Japan remains a hub for innovation, particularly in micro-LED and foldable display technologies, with applications in automotive and consumer electronics.
South America South America presents a developing market, with Brazil as the primary revenue generator. The rise of digital billboards in cities like São Paulo and Buenos Aires highlights the region’s potential, though economic instability limits large-scale deployments. Retail and hospitality sectors increasingly adopt cost-effective LED and LCD displays, but adoption lags behind global averages due to infrastructure constraints. Government initiatives to modernize public transport systems may unlock opportunities for interactive displays, though progress is gradual.
Middle East & Africa The Middle East, particularly the UAE and Saudi Arabia, drives growth in the region through mega-events (e.g., Expo 2020 Dubai) and smart city projects. High disposable income and demand for luxury retail displays sustain the market, while Africa lags due to limited technological penetration outside urban hubs. Major players like NEC Corporation and Planar Systems are expanding their presence, focusing on large-format displays for stadiums and control rooms. Long-term opportunities exist in digital education and healthcare, though inconsistent power supply and funding remain hurdles.
MARKET DYNAMICS
The healthcare industry presents untapped potential for digital display systems, with applications ranging from patient education walls to surgical theater displays. Hospitals are increasingly adopting digital whiteboards for bed management and nurse communication systems, improving operational efficiency by up to 30%. Similarly, educational institutions are transforming traditional learning environments through interactive digital displays that support collaborative problem-solving and distance learning technologies. The hybrid work revolution has also created opportunities for advanced video wall solutions in corporate environments that facilitate immersive virtual collaboration.
The convergence of digital displays with artificial intelligence and Internet of Things technologies is creating groundbreaking use cases. AI-powered digital signs can now analyze customer demographics in real-time to deliver hyper-targeted content, increasing engagement rates by 40-60% in retail environments. IoT-enabled displays serve as hub devices in smart buildings, providing both information and environmental control interfaces. These integrated solutions command premium pricing while offering businesses valuable data analytics capabilities that enhance decision-making processes and operational efficiencies.
The digital display industry continues to face persistent supply chain challenges that affect production timelines and product availability. Semiconductor shortages, particularly for display drivers and controller ICs, have created extended lead times for certain display products. Glass substrate production bottlenecks and fluctuating costs for rare earth materials used in display manufacturing add further complexity. These disruptions have forced manufacturers to maintain higher inventory levels, increasing carrying costs that may ultimately be passed on to consumers.
Cybersecurity Vulnerabilities As digital display networks become more connected and software-defined, they present attractive targets for cyberattacks. Recent incidents of hacked digital signage displaying unauthorized content highlight the need for robust security protocols in display management systems. The industry must address vulnerabilities in networked displays, particularly those integrated with critical infrastructure or handling sensitive information.
Regulatory Compliance Hurdles Digital display providers must navigate an increasingly complex regulatory landscape covering energy efficiency standards, electromagnetic compatibility, and accessibility requirements. Outdoor digital signage faces additional scrutiny regarding light pollution and content regulations. Compliance with evolving
The market is highly fragmented, with a mix of global and regional players competing for market share. To Learn More About the Global Trends Impacting the Future of Top 10 Companies https://semiconductorinsight.com/download-sample-report/?product_id=103411
FREQUENTLY ASKED QUESTIONS:
What is the current market size of Global Digital Display System Market?
Which key companies operate in Global Digital Display System Market?
What are the key growth drivers?
Which region dominates the market?
What are the emerging trends?
CONTACT US: City vista, 203A, Fountain Road, Ashoka Nagar, Kharadi, Pune, Maharashtra 411014 [+91 8087992013] [email protected]
0 notes
Text
Global LiDAR Services Market : Global outlook, Key Trends, and Global Forecast to 2032
The global LiDAR Services Market size was valued at US$ 2.89 billion in 2024 and is projected to reach US$ 8.47 billion by 2032, at a CAGR of 14.37% during the forecast period 2025-2032.
LiDAR (Light Detection and Ranging) is an advanced remote sensing technology that uses pulsed laser light to measure distances and create precise 3D representations of environments. The system comprises three core components: laser scanners (emitting light pulses), GPS receivers (determining location coordinates), and IMU units (tracking orientation). These services are categorized by wavelength (905nm, 1550nm being most prevalent), platform (terrestrial, airborne, mobile), and application segments.
The market expansion is driven by accelerated adoption in autonomous vehicles, where penetration reached 45% of new ADAS systems in 2023, and government mandates for 3D geospatial data – 78 national mapping agencies now mandate LiDAR for infrastructure projects. However, high implementation costs (average USD 75,000 per mobile mapping system) remain a barrier. Recent developments include Velodyne’s 2024 partnership with NVIDIA for AI-powered point cloud processing and Hexagon AB’s acquisition of airborne LiDAR specialist YellowScan, reflecting the industry’s consolidation trend.
Get Full Report with trend analysis, growth forecasts, and Future strategies : https://semiconductorinsight.com/report/global-lidar-services-market-size/
Segment Analysis:
By Type
1550 nm Segment Leads Due to Higher Performance in Adverse Weather Conditions
The market is segmented based on type into:
905 nm
1550 nm
1064 nm
885 nm
Others
By Application
Automotive Segment Dominates Owing to Rising Adoption in ADAS and Autonomous Vehicles
The market is segmented based on application into:
Automotive
Industrial
Mapping and Surveying
Security and Surveillance
Others
By End User
Large Enterprises Lead Market Share Due to Higher Adoption of Advanced Technologies
The market is segmented based on end user into:
Large Enterprises
SMEs
Regional Analysis: Global LiDAR Services Market
North America The North American LiDAR services market is driven by strong demand from autonomous vehicle development, infrastructure modernization, and defense applications. The United States leads the region with significant investments in smart city projects and transportation infrastructure. Major players like Velodyne, Luminar, and Ouster have established R&D hubs to cater to evolving industry needs. Canada is witnessing growth in forestry and mining applications, while Mexico shows potential in urban planning initiatives. The region benefits from advanced technological adoption and favorable government policies supporting spatial data collection. However, high service costs and the need for skilled operators present challenges for widespread SME adoption. The North American market accounts for approximately 35-40% of global LiDAR service revenue, with the U.S. contributing nearly 85% of regional demand.
Europe Europe maintains a robust LiDAR ecosystem with stringent geospatial data standards and growing emphasis on digital twins for urban planning. Countries like Germany, the UK, and France are investing heavily in autonomous mobility solutions, driving demand for high-precision scanning services. The EU’s Copernicus program has significantly boosted Earth observation applications across the continent. Scandinavian nations lead in maritime and forestry applications, while Southern Europe shows increasing adoption for cultural heritage preservation. The market faces challenges from fragmented regulations across member states and competition from traditional surveying methods. European service providers emphasize sustainability and accuracy, with several firms specializing in climate change monitoring through LiDAR-based vegetation analysis.
Asia-Pacific As the fastest-growing regional market, Asia-Pacific is experiencing exponential demand due to rapid urbanization and infrastructure development. China dominates with massive government-backed smart city initiatives and autonomous vehicle testing programs. India is emerging as a key market with its Digital India mission and expanding metro rail networks requiring precise surveying services. Japan and South Korea maintain advanced LiDAR ecosystems tied to their automotive industries. Southeast Asian nations are adopting the technology for flood management and agriculture optimization. While cost sensitivity remains a barrier in developing markets, increasing awareness of LiDAR’s long-term benefits is driving adoption. The region accounts for about 30-35% of global service demand and shows the highest projected growth rate of 18-22% CAGR through 2030.
South America The South American market presents a mixed landscape of opportunities and challenges for LiDAR service providers. Brazil leads in mining and agriculture applications, while Chile and Argentina show growing demand for natural resource management. Infrastructure projects across the region require accurate terrain mapping, though economic volatility sometimes delays large-scale implementations. The Amazon basin monitoring represents a significant application area where governments collaborate with international agencies. However, limited local technical expertise and high equipment costs constrain market growth. Recent initiatives to digitize cadastral records and improve disaster preparedness are creating new opportunities for airborne and mobile LiDAR services.
Middle East & Africa This emerging market demonstrates uneven but promising growth patterns, with Gulf Cooperation Council (GCC) countries driving adoption through megacity projects and oil/gas exploration needs. The UAE and Saudi Arabia are implementing nationwide digital twin programs requiring extensive LiDAR data collection. African nations increasingly utilize the technology for mineral exploration and transportation planning, though limited budgets restrict large-scale deployments. South Africa maintains the most developed market infrastructure in Sub-Saharan Africa. The region shows particular promise for drone-based LiDAR services due to vast, difficult-to-access terrains. While currently accounting for less than 5% of global market share, favorable government initiatives and foreign investments suggest strong long-term potential.
MARKET OPPORTUNITIES
Emerging Applications in Robotics and Industrial Automation to Open New Growth Avenues
The rapid expansion of mobile robotics across logistics, agriculture, and manufacturing sectors presents substantial opportunities for compact LiDAR solutions. Warehouse automation alone is projected to drive demand for over 2 million LiDAR sensors annually by 2027. Agricultural robotics employing LiDAR for precision spraying and yield monitoring are gaining traction, with pilot programs showing 30% reductions in chemical usage. These industrial applications often tolerate higher price points than automotive markets while demanding ruggedized designs suited for harsh operating environments.
Development of 4D LiDAR with Enhanced Sensing Capabilities to Enable Premium Applications
Next-generation 4D LiDAR systems capable of instantaneous velocity measurement present opportunities in high-value markets. These advanced sensors can directly measure target velocity without requiring multiple frames of data, significantly improving collision prediction algorithms. Defense and aerospace applications are particularly interested in these capabilities, with several military programs specifying 4D LiDAR for autonomous platforms. The technology also enables new use cases in crowd monitoring and traffic flow analysis for smart city implementations.
Expansion of Aftermarket Upgrade Programs to Drive Retrofit Demand
Vehicle OEMs and tier-1 suppliers are developing authorized LiDAR retrofit programs to extend advanced safety features to existing fleets. These programs target commercial operators seeking to upgrade vehicle safety ratings without complete fleet replacement. Early adopters in the trucking industry have demonstrated accident rate reductions exceeding 25% post-retrofit. As regulatory pressures mount, such upgrade initiatives could catalyze a secondary market worth over $1 billion annually within five years.
MARKET CHALLENGES
Intense Competition from Alternative Sensor Technologies to Pressure Market Position
LiDAR faces growing competition from enhanced vision systems combining high-resolution cameras with advanced AI processing. These camera-based solutions now achieve comparable object classification performance at significantly lower costs. Radar technology continues advancing as well, with modern high-resolution radars challenging LiDAR’s dominance in certain detection scenarios. Some automakers have publicly questioned LiDAR’s necessity in their autonomous driving stacks, opting instead for vision-centric approaches supported by cheaper sensors.
Supply Chain Vulnerabilities for Critical Components to Impact Production Stability The LiDAR industry relies on specialized components from limited supplier bases, creating production bottlenecks. Gallium nitride lasers, precision MEMS mirrors, and high-performance photodetectors all face constrained availability. Recent disruptions have caused lead times for certain LiDAR models to extend beyond 12 months. These supply challenges are particularly acute for newer solid-state designs requiring cutting-edge semiconductor components also demanded by other high-growth industries.
Intellectual Property Disputes and Patent Litigation to Increase Business Risks The rapidly evolving LiDAR sector has become prone to complex intellectual property conflicts. Several high-profile patent infringement cases have resulted in injunctions against major market players. New entrants often struggle to navigate the dense patent landscape, requiring substantial legal expenditures to ensure design freedom. These disputes sometimes delay product launches and force costly design workarounds, particularly affecting startups with limited litigation resources.
LIDAR SERVICES MARKET TRENDS
Advancements in Autonomous Vehicle Technology Driving LiDAR Adoption
The rapid evolution of autonomous vehicle (AV) technology continues to be a primary driver for the global LiDAR services market. With major automotive players investing heavily in self-driving capabilities, demand for high-precision LiDAR systems has surged by over 40% in the past three years. Modern solid-state LiDAR solutions now offer resolutions below 0.1° angular resolution at ranges exceeding 200 meters, making them indispensable for Level 4 and 5 autonomy. The market has particularly benefited from breakthroughs in 1550 nm wavelength systems, which provide superior eye safety and performance in adverse weather conditions compared to traditional 905 nm solutions.
Other Key Trends
Smart City Infrastructure Development
Urban planning initiatives worldwide are incorporating LiDAR at an unprecedented scale, with municipal governments allocating significant budgets for 3D mapping and digital twin projects. Modern mobile LiDAR systems mounted on vehicles can capture up to 1.5 million data points per second, enabling centimeter-accurate models of entire cityscapes. This data proves invaluable for traffic management, utility planning, and disaster preparedness systems. The Asia-Pacific region in particular has seen accelerated adoption, with several smart city pilots demonstrating how real-time LiDAR data can optimize public services.
Miniaturization and Cost Reduction in LiDAR Hardware
Technological innovation has led to significant reductions in both size and cost of LiDAR units. Where industrial-grade systems once required bulky equipment costing over $75,000, new automotive-grade solutions now fit in the palm of a hand with prices below $500 for mass production. This democratization of LiDAR technology has opened new applications in robotics, logistics automation, and consumer electronics. MEMS-based systems in particular have gained traction, offering reliable performance at 30-50% lower costs than traditional mechanical LiDAR while maintaining dense point cloud generation for object recognition.
COMPETITIVE LANDSCAPE
Key Industry Players
LiDAR Market Sees Intensifying Competition as Players Expand Technological Capabilities
The global LiDAR services market exhibits a moderately fragmented competitive landscape, with established technology providers, automotive suppliers, and emerging startups vying for market share. Velodyne Lidar remains a prominent player due to its early-mover advantage in automotive LiDAR systems and strong patent portfolio. However, the company faces increasing pressure from competitors as the market shifts toward solid-state LiDAR solutions.
Luminar Technologies has emerged as a formidable competitor, securing partnerships with major automakers for its high-performance 1550nm LiDAR systems. The company’s vertically integrated approach and focus on autonomous vehicle applications position it well for future growth. Similarly, Innoviz Technologies has gained traction through design wins with BMW and other OEMs, demonstrating the importance of automotive-grade reliability in this space.
Traditional surveying equipment manufacturers like Trimble and Hexagon AB maintain strong positions in topographic and industrial LiDAR applications. These companies leverage their existing distribution networks and customer relationships to cross-sell LiDAR solutions alongside other geospatial technologies. Their continued investment in mobile and airborne LiDAR systems ensures they remain competitive across multiple verticals.
Chinese players including Hesai and RoboSense are rapidly expanding their global footprint through aggressive pricing strategies and government-supported R&D initiatives. Meanwhile, automotive suppliers like Valeo and Continental are integrating LiDAR into comprehensive ADAS solutions, creating new competition for pure-play LiDAR providers.
List of Key LiDAR Services Companies Profiled
Velodyne Lidar (U.S.)
Luminar Technologies (U.S.)
Trimble Inc. (U.S.)
Hexagon AB (Sweden)
Valeo (France)
Continental AG (Germany)
Ouster (U.S.)
Hesai Technology (China)
RoboSense (China)
Innoviz Technologies (Israel)
Leica Geosystems (Switzerland)
RIEGL Laser Measurement Systems (Austria)
Quanergy Systems (U.S.)
LeddarTech (Canada)
Learn more about Competitive Analysis, and Forecast of Global LiDAR Services Market : https://semiconductorinsight.com/download-sample-report/?product_id=95891
FREQUENTLY ASKED QUESTIONS:
What is the current market size of Global LiDAR Services Market?
-> LiDAR Services Market size was valued at US$ 2.89 billion in 2024 and is projected to reach US$ 8.47 billion by 2032, at a CAGR of 14.37% during the forecast period 2025-2032.
Which key companies operate in Global LiDAR Services Market?
-> Key players include Velodyne, Luminar, Innoviz, Ouster, Hesai, Quanergy, Cepton, and Innovusion, among others.
What are the key growth drivers?
-> Key growth drivers include autonomous vehicle development, smart city initiatives, and increasing adoption in industrial automation.
Which region dominates the market?
-> North America currently holds the largest market share at 38%, while Asia-Pacific is expected to witness the fastest growth during the forecast period.
What are the emerging trends?
-> Emerging trends include solid-state LiDAR development, integration with 5G networks, and increasing use in robotics and drone applications.
CONTACT US:
City vista, 203A, Fountain Road, Ashoka Nagar, Kharadi, Pune, Maharashtra 411014 +91 8087992013 [email protected]
0 notes
Text
Construction Scaffolding Market Analysis, Key Players, Segmentation, Application And Forecast
According to new market research, the global construction scaffolding market was valued at US$ 11.55 billion in 2024 and is projected to reach US$ 17.59 billion by 2032, growing at a Compound Annual Growth Rate (CAGR) of 6.2% during the forecast period (2025–2032). This growth is driven by rapid urbanization, infrastructure development projects worldwide, and increasing construction safety regulations.
Download FREE Sample Report: Construction Scaffolding Market Sample Report
What is Construction Scaffolding?
Construction scaffolding refers to temporary structures erected at building sites to provide secure working platforms for construction crews. Typically made from steel or aluminum alloys, scaffolding systems enable safe access to elevated areas during construction, maintenance, or renovation projects. Modern scaffolding solutions incorporate modular components that can be configured for various building types while complying with stringent occupational safety standards.
Key Market Drivers
1. Global Infrastructure Development Boom
The current decade is witnessing unprecedented infrastructure investments, particularly in emerging economies. Mega projects like smart cities, transportation networks, and energy facilities require extensive scaffolding solutions. China's Belt and Road Initiative alone has spurred scaffolding demand across 70+ countries.
2. Enhanced Safety Regulations
Since the 2017 OSHA scaffolding standard updates, safety compliance requirements have become more rigorous globally. The European Standard EN 12811 and similar regulations mandate load-bearing capacities, fall protection systems, and regular scaffold inspections—driving adoption of engineering-grade scaffolding systems.
Market Challenges
The industry faces material cost volatility, with steel prices fluctuating 18-22% annually since 2020. Additionally, skilled labor shortages in scaffold erection and complex site logistics for mega-projects create operational bottlenecks. Recent supply chain disruptions have extended equipment lead times by 30-45 days in key markets.
Opportunities Ahead
The modular scaffolding segment is gaining traction, offering 40% faster erection times than traditional systems. Meanwhile, scaffold rental business models are expanding in developing nations, reducing capital expenditure for contractors. Digital solutions like IoT-enabled scaffold monitoring present new revenue streams for market leaders.
Regional Market Insights
Asia-Pacific dominates with 48% market share, driven by China's US$ 1.4 trillion construction sector and India's National Infrastructure Pipeline.
North America shows strong growth in specialized scaffolding for energy retrofits and industrial maintenance.
Europe leads in safety-compliant systems, with Germany and the UK implementing smart scaffolding mandates.
Middle East giga-projects like NEOM are adopting AI-assisted scaffold planning solutions.
Competitive Landscape
BrandSafway maintains market leadership through acquisitions and proprietary scaffold engineering software.
PERI Group is expanding its modular scaffold solutions for complex architectural projects.
Asian manufacturers like Youying Group are gaining share through cost-competitive system scaffolding.
Recent developments include Altrad's 2024 acquisition of a digital scaffolding monitoring startup.
Market Segmentation
By Type:
Suspended Scaffolding
Trestle Scaffolding
Cantilever Scaffolding
Others
By Application:
High-rise Building
Bridge Construction
Industrial Maintenance
Others
By Material:
Steel
Aluminum
Fiberglass
By Region:
North America
Europe
Asia-Pacific
Latin America
Middle East & Africa
Report Scope & Offerings
This comprehensive analysis provides:
2025–2032 market forecasts with COVID-19 impact analysis
Competitive intelligence on 15+ major players
PESTLE and SWOT analysis of market dynamics
Emerging technology assessment for scaffold innovation
📘 Get Full Report: https://www.intelmarketresearch.com/manufacturing-and-construction/1156/construction-scaffolding-2025-2032-800
Download FREE Sample Report: Construction Scaffolding Market Sample Report
About Intel Market Research
Intel Market Research delivers actionable insights in technology and infrastructure markets. Our data-driven analysis leverages:
Real-time infrastructure monitoring
Techno-economic feasibility studies
Competitive intelligence across 100+ countries Trusted by Fortune 500 firms, we empower strategic decisions with precision. International: +1(332) 2424 294 | Asia: +91 9169164321
Website: https://www.intelmarketresearch.com
Follow us on LinkedIn: https://www.linkedin.com/company/intel-market-research
0 notes
Text
From Numbers to Narratives: How Financial Modelling Drives Strategic Business Decisions
In a world driven by data and strategy, financial modelling has evolved from a technical function to a strategic tool. Today’s business leaders rely on models not just to crunch numbers—but to make decisions that impact profitability, investments, and long-term sustainability.
Whether it's launching a new product, raising capital, or entering a new market, robust financial models guide these choices. If you're in Hyderabad—a growing hub for finance, tech, and startups—mastering this skill can open doors across industries.
That’s why enrolling in the best financial modelling certification course in Hyderabad is the next smart step for finance professionals and aspiring analysts.
Why Financial Modelling Matters in Business Strategy
Financial modelling isn’t just about Excel sheets or P&L statements. It’s about answering big questions:
Can this project break even within 2 years?
Should we expand into a new market or acquire a competitor?
What is our company's valuation before approaching investors?
How does inflation or currency fluctuation affect our bottom line?
Financial models help stakeholders simulate scenarios, forecast risks, and evaluate outcomes—enabling faster, data-backed decisions.
Common Strategic Use Cases of Financial Modelling
🧩 1. Capital Raising and Investor Pitching
Startups and growing businesses build financial models to:
Project revenues and profits
Justify funding requirements
Showcase ROI and exit scenarios for VCs
A solid model can be the difference between a successful pitch and a missed opportunity.
🧩 2. New Market Entry
For companies planning to expand into new geographies (like Tier-2 Indian cities or Southeast Asia), financial modelling evaluates:
Cost of expansion
Pricing models
Break-even timelines
Local tax implications
🧩 3. Mergers & Acquisitions
During M&A deals, analysts build synergy models to estimate:
Cost savings post-acquisition
Combined revenue potential
Impact on valuation and shareholder value
🧩 4. Strategic Planning & Scenario Analysis
Using models, businesses simulate:
Best-case, worst-case, and base-case scenarios
Impact of economic shifts, like rising interest rates or global supply chain disruptions
Product launch viability or cost restructuring
Hyderabad’s Finance & Startup Ecosystem Is Ripe for Modellers
With leading companies like Deloitte, Wells Fargo, and Accenture operating in Hyderabad—alongside thriving fintech and SaaS startups—there’s high demand for professionals skilled in:
Forecasting revenue
Budget modelling
Valuation and capital planning
Scenario and sensitivity analysis
And that’s where specialized training becomes vital.
Learn the Skills: Best Financial Modelling Certification Course in Hyderabad
If you’re looking to become job-ready and thrive in a strategic finance role, consider joining the best financial modelling certification course in Hyderabad offered by the Boston Institute of Analytics.
📘 What You’ll Learn:
Building and interpreting 3-statement financial models
Valuation techniques: DCF, relative valuation, VC method
Forecasting cash flows, capex, and working capital
Scenario planning, what-if analysis, and risk modelling
Tools: Excel, Power BI, Python basics for automation
👤 Ideal for:
Finance students & MBA grads
Working professionals in finance, business strategy, or operations
Entrepreneurs & startup founders
Professionals preparing for roles in investment banking, FP&A, or consulting
The course is taught by industry experts and includes real-world projects, mock interviews, and placement support—ideal for professionals aiming to stand out in Hyderabad’s fast-paced finance job market.
Real-World Example: Strategic Use of Modelling in Hyderabad
🧠 Case Study: Pharma Company Expansion
A mid-sized pharma firm in Hyderabad wants to enter the African market. Finance analysts build a model to:
Estimate regulatory costs
Forecast product demand based on local healthcare data
Assess FX risks and tax structure differences
This model becomes central to the board’s go/no-go decision.
🧠 Case Study: Startup Valuation in Gachibowli
A health-tech startup in Gachibowli is looking to raise ₹10 crore. Their CFO builds a financial model showing:
Revenue growth from subscription models
Burn rate and cash runway
Exit value at 5x revenue multiple
Investors are convinced by the clarity—and the startup closes the round in 6 weeks.
Final Thoughts
Financial modelling is the language of modern business strategy. From startups to MNCs, everyone relies on strong financial forecasts and scenario planning to move forward confidently.
If you're serious about upskilling and launching a high-impact career in finance, business, or consulting, don't wait. Enroll in the best financial modelling certification course in Hyderabad and gain the tools to become not just a number cruncher—but a strategic thinker.
0 notes
Text
The Role of Tax Services Detroit in Growing Your Business
Running a business in Detroit is both exciting and challenging. With a growing entrepreneurial scene and a supportive local economy, the city provides many opportunities for growth. But success doesn’t happen by chance—it requires smart financial planning, especially when it comes to taxes. That’s where tax services Detroit come in.
Whether you’re a startup, a small business, or an established corporation, having a trusted tax partner can be the difference between simply surviving and truly thriving.
Why Tax Services Are Critical for Business Growth
As a business owner, you’re already juggling product development, marketing, and operations. Taxes can feel like just another headache—but they shouldn’t be. Professional Detroit CPA firms do more than file your returns. They become strategic partners, helping you:
Minimize tax liabilities
Maximize deductions
Avoid costly mistakes
Plan for long-term financial health
If you’ve ever been overwhelmed by the paperwork or unsure about what you can write off, working with an experienced Detroit CPA can offer the clarity you need.
Benefits of Using Local Tax Services Detroit

Hiring someone who understands tax services Detroit on a local level has several advantages:
Local Insight: Detroit CPAs know Michigan-specific tax codes and regulations.
Community-Focused: Local firms care about their city — they want to see local businesses grow and thrive.
Customized Service: Smaller firms often provide more personalized attention compared to national chains.
Easy Access: Need help on short notice? Many offer 24 hour tax services Detroit, especially during peak season.
Tax Services That Support Business Growth
Detroit businesses—from retail shops to tech startups—can benefit from a wide range of services:
Business Tax Returns—Accurate and timely filing of federal, state, and local tax forms
Bookkeeping and Payroll Services—Keeping your financials in order for tax season and beyond
Sales Tax Filing—Ensure compliance with Michigan sales tax laws
IRS Representation—Help if you’re audited or receive letters from the IRS
Financial Forecasting—Strategic planning to grow revenue and reduce unnecessary spending
Startup Consultations—If you’re new, local CPAs can help with entity selection and setup
The best tax services in Detroit are those that go beyond the numbers to understand your industry, goals, and challenges.
24 Hour Tax Services Detroit: Support When You Need It Most
Emergencies don’t follow a 9-to-5 schedule. That’s why some of the best tax services Detroit offer extended or 24-hour tax services. Whether it’s a filing deadline, a last-minute audit notice, or urgent bookkeeping cleanup, knowing you can count on around-the-clock support is a major relief for busy entrepreneurs.
With digital tools like cloud accounting, secure document uploads, and virtual meetings, your CPA can help you anytime, from anywhere.
How Detroit CPAs Add Strategic Value
Your tax expert isn’t just there for April 15th. They can help you:
Plan for growth by forecasting cash flow and tax impact
Stay compliant as your company expands across city or state lines
Reduce tax risks as laws and deductions change
Invest smarter by helping you understand how your decisions affect your tax position
Think of your Detroit CPA as a financial advisor who ensures your business runs efficiently while legally minimizing taxes.
Related FAQs—Tax Services Detroit
Q1. What’s the difference between tax preparation and tax planning?
Tax preparation involves compiling and filing returns based on past transactions. Tax planning is the proactive strategy of reducing future tax liability through legal methods like deductions, investments, and timing.
Q2. How do I choose the best tax service for my business in Detroit?
Look for a CPA firm with experience in your industry, strong client testimonials, up-to-date knowledge of Michigan tax laws, and clear pricing. Personal referrals or online directories can also be helpful.
Q3. Can I get 24-hour tax help in Detroit?
Yes! Many firms offer 24 hour tax services Detroit, especially during busy seasons. Some also provide virtual support for urgent questions or document submission.
Q4. Are there any free business tax filing services in Detroit?
Yes, programs like IRS VITA or community financial organizations may offer free tax filing Detroit services if your business is small or if you qualify based on income.
Q5. How can a CPA help my startup grow?
A Detroit CPA can help you choose the right legal structure, understand tax obligations, apply for licenses, manage cash flow, and set up accounting systems that scale with your business.
Q6. How much do business tax services cost in Detroit?
Costs vary based on complexity, but most small businesses can expect to pay between $300 and $1,200 per year. Many CPAs offer monthly service packages for ongoing support.
Final Thoughts
The right tax services Detroit can do more than help you file taxes—they can help you grow your business. By partnering with a trusted Detroit CPA, you gain a financial expert who understands your goals and can guide you through every stage of your journey. From tax preparation in Detroit to strategic financial planning and 24-hour support, the benefits are clear.
Invest in the best, and watch your business thrive.
#Detroit cpa firms#Tax preparation detroit#Tax services detroit#Detroit cpa#24 hour tax services detroit#Free tax filing Detroit#accounting#bookkeeper#finance#tax planning#tax returns
0 notes
Text
Dry Construction Market Size, Analysis, Business Scope, Drivers And Growth Opportunities 2033
According to a new study by Fact.MR, the global dry construction market is valued at US$ 127.1 billion in 2023. Demand for dry construction worldwide is projected to grow at a CAGR of 5.2%, reaching a market valuation of US$ 212 billion by the end of 2033.
The rise in urbanization and industrialization is driving growth in the construction industry, boosting demand for dry construction solutions. Recent years have seen a notable shift towards lightweight and sustainable construction practices, further propelling market expansion.
𝐃𝐨𝐰𝐧𝐥𝐨𝐚𝐝 𝐚 𝐒𝐚𝐦𝐩𝐥𝐞 𝐂𝐨𝐩𝐲 𝐨𝐟 𝐓𝐡𝐢𝐬 𝐑𝐞𝐩𝐨𝐫𝐭: https://www.factmr.com/connectus/sample?flag=S&rep_id=8841
Country-wise Insights
In 2022, the United States market was valued at US$ 32.1 billion. Limited availability of various raw materials used in wet construction has been a key factor driving the adoption of dry construction practices. Additionally, a rise in building renovation activities is creating new opportunities for market players.
In Germany, demand for dry construction is anticipated to grow at a CAGR of 3.8% from 2023 to 2033. In both Germany and the United Kingdom, there is a strong consumer preference for construction methods that enable faster project completion. As a result, dry construction solutions, known for their efficiency and speed, have seen increased adoption in these regions.
Category-wise Insights
The residential sector is expected to be a major driver of demand for dry construction practices. Growing interest in affordable, smart housing is boosting sales of dry construction products, providing homeowners with eco-friendly, lightweight materials that support quick and sustainable construction.
As urbanization accelerates, demand for housing is rising as more people migrate to cities. The residential sector is well-positioned to offer environmentally friendly and affordable housing options. The availability of energy-efficient building materials and smart home technologies is increasingly popular among homeowners, contributing significantly to global market growth and revenue.
Read More: https://www.factmr.com/report/dry-construction-market
Key Market Players
Leading companies are investing in robust supply chain management, upholding product standards, and ensuring quality control. Many players are pursuing mergers, acquisitions, and collaborations to expand their geographical presence and boost profitability.
For example, Armstrong World Industries, a U.S.-based global leader in ceiling and wall solutions, acquired Arktura, LLC, in December 2020. This acquisition strengthens Armstrong’s market position and broadens its product offerings, as Arktura specializes in designing and manufacturing both standard and customizable ceiling and wall systems in the U.S.
Key companies in the global dry construction market include Armstrong World Industries, Inc., Etex SA, CSR Ltd., Fletcher Building Limited, PABCO Gypsum, Knauf Gips KG, Panel Rey, Xella Group, Saint-Gobain SA, and USG Boral.
𝐆𝐞𝐭 𝐂𝐮𝐬𝐭𝐨𝐦𝐢𝐳𝐚𝐭𝐢𝐨𝐧 𝐨𝐧 𝐭𝐡𝐢𝐬 𝐑𝐞𝐩𝐨𝐫𝐭 𝐟𝐨𝐫 𝐒𝐩𝐞𝐜𝐢𝐟𝐢𝐜 𝐑𝐞𝐬𝐞𝐚𝐫𝐜𝐡 𝐒𝐨𝐥𝐮𝐭𝐢𝐨𝐧𝐬: https://www.factmr.com/connectus/sample?flag=S&rep_id=8841
Segmentation of Dry Construction Industry Research
By Material :
Plasterboards
Metal
Plastic
Wood
By System :
Wall Systems
Flooring Systems
Ceiling Systems
By Application :
Residential
Non-residential
By Region :
North America
Europe
Asia Pacific
Latin America
Middle East & Africa
𝐂𝐨𝐧𝐭𝐚𝐜𝐭:
US Sales Office 11140 Rockville Pike Suite 400 Rockville, MD 20852 United States Tel: +1 (628) 251-1583, +353-1-4434-232 Email: [email protected]
1 note
·
View note
Text
6G Communication Chipset Market Set to Hit $7.18 Billion by 2035
The global 6G Communication Chipset market is expected to grow significantly, reaching $7,182.2 million by 2035, up from $536.4 million in 2024. This growth reflects a robust compound annual growth rate (CAGR) of 26.6% over the forecast period from 2024 to 2035.
Key Growth Drivers and Application Areas
6G Communication Chipsets are emerging as a critical technology across multiple sectors, including:
Telecommunications
Automotive Systems
Healthcare Infrastructure
Smart Cities Development
These chipsets enable ultra-fast data transmission and seamless connectivity, forming the backbone of next-generation digital infrastructure. The market’s rapid expansion is being driven by the proliferation of IoT devices, increasing demand for low-latency networks, and the growing availability of high-definition content.
Strategic Opportunities in Classification and Technology Integration
The report identifies numerous revenue generation opportunities across:
Classification types of 6G chipsets
Application-specific implementations
Performance metric optimizations
Advanced technology integrations
These innovations are pushing the boundaries of wireless communication, and positioning chipset manufacturers at the forefront of digital transformation.
Competitive Landscape and Industry Leadership
The 6G chipset space is marked by intense competition and high innovation, with major players such as:
Intel Corporation
Qualcomm Technologies Inc.
MediaTek Inc.
Broadcom Corporation
Arm Limited
Advanced Micro Devices Inc.
Nvidia Corporation
Texas Instruments Inc.
STMicroelectronics NV
Infineon Technologies AG
Xilinx Inc.
Renesas Electronics Corporation
These companies are investing heavily in R&D, technology scaling, and global expansion strategies to meet the evolving demands of ultra-high-speed wireless communication.
Emerging Demand Hubs and Market Expansion
The global market landscape is evolving rapidly, with high-growth opportunities concentrated in countries like:
United States
China
Japan
South Korea
Germany
In addition, emerging markets such as Nigeria, Poland, and Colombia are gaining momentum as strategic targets for Total Addressable Market (TAM) expansion and revenue diversification.
Regional Shifts and Ecosystem Evolution
North America and Asia Pacific remain the dominant regions in terms of adoption and innovation. However, challenges such as high deployment costs and interoperability with existing systems pose obstacles for large-scale rollout.
As a result, the 6G ecosystem—from raw material sourcing to chipset design, fabrication, and deployment—is undergoing significant transformation. Stakeholders across the value chain are expected to form new alliances and implement localized strategies to optimize cost-efficiency and market access.
Access the Full Report
Explore In-Depth Insights: View Detailed Market Analysis
Get a Free Sample Report: Download Sample Report
About DataString Consulting
DataString Consulting is a trusted provider of market research and business intelligence solutions for B2B and B2C enterprises globally. With a leadership team holding over 30 years of combined experience, we specialize in delivering high-impact, data-driven insights tailored to each client’s strategic needs.
We offer flexible, high-value research reports starting at just USD 1,399, making professional-grade market analysis accessible to organizations of all sizes. Our collaborative and cost-efficient model enables consultants, research firms, and corporate teams to access reliable, decision-ready insights—without the overhead of traditional operations.
Contact: Mr. Mark Lawson 📧 [email protected] 📧 [email protected] 🌐 www.datastringconsulting.com
0 notes
Text
Mastering Google Ads Budgeting for Law Firms: A Strategic Guide for 2025
Running Google Ads for your law firm without a clear budget is like heading into trial without a case strategy. Success hinges not just on spend—but on smart spend. Whether you’re targeting personal injury, criminal defense, or family law clients, the key is to align your advertising dollars with measurable outcomes. Here's how your firm can strategically set and scale a Google Ads budget for 2025 that delivers real ROI.
Why Google Ads Works for Law Firms
Google Ads is the legal industry’s secret weapon for getting instant visibility. Your firm can appear at the top of search results precisely when someone searches for “DUI lawyer near me” or “personal injury attorney in Texas.” With precise targeting and measurable results, it’s one of the fastest ways to generate qualified leads.
Understanding Legal CPCs in 2025
In 2025, cost-per-click (CPC) rates for legal ads remain among the highest across industries. Here’s what you can expect:
Personal Injury: $50–$300+ per click
Criminal Defense: $40–$180
Family Law: $30–$120
Employment Law: $25–$100
Estate Planning: $20–$75
If you're targeting a $5,000 monthly ad spend with an average CPC of $85, you’re looking at roughly 58–60 clicks. With a strong conversion rate (15%), that’s 9 solid leads—worth every penny if your average case value justifies it.
Read Full Blog:- How To Set The Right Google Ads Budget For Your Law Firm
Setting a Realistic Budget
Start with your revenue goals. If your law firm aims for $150,000/month in revenue, you may allocate 5%–15% to marketing ($7,500–$22,500). Of that, Google Ads might take 50–70%. Next, calculate your maximum cost per acquisition (CPA) based on case value and profitability. For a PI case worth $15,000, with $5,000 in expenses and a $5,000 profit margin, your CPA target should be under $5,000.
The Testing-to-Scaling Strategy
Rather than diving into deep waters, start in phases:
Phase 1 (1–2 months): Test ad copy, targeting, and landing pages with $2,000–$5,000.
Phase 2 (3–4 months): Optimize keywords and boost conversions with $5,000–$10,000.
Phase 3 (5+ months): Scale what works and add CRM integrations for deeper tracking.
Factors That Shape Your Budget
Competition Level: More competitive areas (like personal injury) require higher CPCs and daily spend.
Geographic Area: Big cities = high costs. Rural areas = lower spend but fewer leads.
Case Value: The higher the average case value, the more you can afford to invest per lead.
Campaign Objective: Lead generation needs a larger budget than brand awareness.
Make Every Dollar Count
Invest in high-converting landing pages, use call and location extensions, and focus on exact-match, high-intent keywords. Track every click, call, and case with tools like Google Analytics, call tracking, and your CRM.
Final Tip: Know When to Call in the Pros
If managing Google Ads feels overwhelming—or you’re unsure if you're getting a strong ROI—it’s time to consult with a Google Ads specialist. A well-optimized campaign doesn’t just generate clicks—it fills your case pipeline with qualified leads.
#legal marketing agency#law firm marketing agency#legal marketing company#legal marketing#legal marketing services#legal marketing firms#local seo for lawyers
0 notes