#Infographic PPT
Explore tagged Tumblr posts
Visit Tumblr Blog
Explore Tumblr blogs with no restrictions, modern design and the best experience.
Last Seen Tumblr Blogs


Fun Fact
Tumblr Inc. has $15.1M in annual revenue.
Text
won't share a screenshot bc it's company information (+ don't want to doxx myself lol) but I'm doing some work training and the infographic on one of these slides has permanent red spellcheck squiggles under all the product names 😭 whoever made it just took a screenshot of whatever program the graphic was created in and pasted it in an official powerpoint we can share with clients I'm losing my mindddddd
#HELP LMAOO#it was an infographic you could've easily made within PPT too it's so funny#it took me a moment to register like hey I'm in present mode why am i seeing these#just really excellent all around#reilly.txt
6 notes
·
View notes
Text
IMPORTANCE OF GRAPHIC DESIGNING

Graphic design is often misunderstood as simply adding images to advertising. However, it is a much more complex process that involves taking a human-centered approach to creating an experience for site visitors.
Graphic designers use typography, fonts, placement, symbols, and colors to convey the brand image to customers. They also conduct research on the psychology of their target audience and utilize themes, concepts, and principles that will appeal to them.
Although visual marketing is a part of graphic design, it is not the complete story. Graphic design services are used to reach the intended audience and employ tactics to encourage customers to share their photos, which is a crucial aspect of Internet marketing.
The significance of graphic design lies in its ability to create a powerful first impression, establish a strong brand identity, enhance the user experience, build trust and credibility, demonstrate professionalism, and increase the conversion rate.
IMPORTANCE
Graphic design creates a lasting first impression, which is crucial in a competitive market
It helps build a strong brand identity that connects with potential clients and customers.
Graphic design enhances user experience by transforming lengthy text into engaging visuals.
Consistent branding through graphic design builds trust and credibility with customers.
It represents professionalism and a commitment to quality in your business.
Effective visual design can increase visibility and lead to higher conversion rates for your website or business.
Graphic 360 is a graphic design company based in Indore that creates marketing materials for businesses of all sizes, including ad designs for newspapers and magazines, billboards, company brochures, catalogues, flyers, presentation folders, car-truck wraps, PPT designs, emailers, postcards, posters, signage, infographics, menus, banners, and standees.
The company also offers numerology-based brand design services, including logo, design, color, and identity, to help businesses reach their potential and stand out in the market.
Graphic 360 provides logo design services that engage users and incorporate elements such as color, graphics, layout, fonts, and content to create a memorable and user-friendly logo design.
The company also creates illustrations and customized designs as per clients' requirements, including wedding accessories, itinerary cards, welcome banners, car accessories, videos, GIFs, E-cards, stall banner designs, sports event branding, social event branding, mobile covers, posters, mugs, and t-shirts.
Graphic 360 offers digital marketing services, including SEO, SMO, SMM, SEM, PPC, content marketing, email marketing, SMS marketing, and more, to help businesses promote their products and services on digital platforms.
The company designs motion graphics, GIFs, whiteboard animation, pre-wedding videos, Whatsapp invitations, 2D & 3D animation, element design, logo animation, and more to appeal to customers who prefer video and animation over still images.
Visit this website https://graphic360.in/
#graphic design#brand logo design#visiting card design#branding#digitalmarketing#animation#custom fonts#brochures#catalogues#flyers#presentation folders#car-truck wraps#PPT designs#emailers#postcards#posters#signage#infographics#menus#banners#and standees
11 notes
·
View notes
Text
hehehe since my teacher has nothing left to teach (as in, we completed all of the topics and all that already) she gave us a rlly fun activity and its to basically nerd out about your favorite game HEKLWHDFK
#ʕ •ᴥ•ʔ idle chit chat#ofc i put Sky<3#she said to do whatever we want so like . presentation. infographic. whole ass essay. etc. as long as its abt ur favorite game#hehe guess who made a 13 slides ppt as well as a 2k wc essay ^-^#i ddint even aim to do so much...... this is what happens when i have fun doing something😭#I made sure to make the presentation look all pretty and even using my own pictures of sky heuheueh<33333#hope my teacher has fun going through my submission frfr HAHAHKLWHDJ
3 notes
·
View notes
Text
Infographics vs. Brochures: Understanding the Distinct Roles of Visual Communication Tools
Data To Creative Infographic in PowerPoint: Top Inquiries Answered
1.What is an infographic in PPT?
An infographic in PowerPoint (PPT) is a visual representation of information or data designed to communicate complex information clearly and quickly. It combines graphics, charts, icons, and text to present information in an engaging and easily digestible format. Infographics in PPT help enhance presentations by making data more accessible, highlighting key points, and improving audience retention. They can be customized to suit the presentation's theme and purpose, making them effective tools for storytelling and conveying information visually.
2. Is PPT an infographic?
PowerPoint presentations (PPT) are not inherently infographics, but they can include infographics as part of their content. Infographics are visual representations of information designed to make data easily understandable and engaging, whereas PPT is a presentation software used to create slideshows that can contain various types of content, including text, images, charts, and infographics. Essentially, while PPT can incorporate infographics, it encompasses a broader range of visual and textual elements beyond just infographics.
3. Is an infographic a brochure?
No, an infographic is not a brochure. An infographic is a visual representation of information or data designed to communicate complex information quickly and clearly, often using charts, graphs, and images. In contrast, a brochure is a printed or digital promotional document that provides detailed information about a product, service, or organization, often featuring text and images in a multi-page format. While both can convey information visually, their purposes and formats differ significantly.
4. Is an infographic a flyer?
No, an infographic is not a flyer, though they can share some similarities. An infographic is a visual representation of information, data, or knowledge designed to present complex information quickly and clearly. It typically combines graphics, charts, and text to convey a message. A flyer, on the other hand, is a printed advertisement or promotional material used to inform or attract attention to an event, product, or service. While both can be visually appealing, their purposes and formats differ significantly.
5. How to analyse infographics?
To analyze infographics, start by identifying the main message or purpose. Examine the layout and design elements, such as colors, fonts, and images, to see how they enhance or detract from the information. Assess the data sources and ensure they are credible. Evaluate the clarity and accuracy of the visual representations, including charts and graphs. Consider the audience and context to understand how effectively the infographic communicates its message. Finally, reflect on any biases or assumptions present in the information presented.

Visit: VS Website See: VS Portfolio
0 notes
Text

Ready-to-Use Infographics Presentation Templates for Professionals
Enhance your data presentations using SlidesBrain’s Infographics Presentation Templates. Ideal for both business and educational purposes, these templates help you present statistics and facts clearly and attractively. Each design is fully customizable, so you can adjust every slide to fit your brand or message. Begin making impressive presentations now and make a strong impression on your audience with visually appealing infographics.
#Infographics Presentation Templates#Infographics Presentation PPT#Infographics Presentation PowerPoint Templates#Infographics Presentation Google Slides#SlidesBrain
0 notes
Text
Understanding Circle Percentage Infographics: A Comprehensive Guide

Infographics have become a vital tool in the communication of complex data and information. Among the various types of infographics, circle percentage infographics stand out due to their ability to visually represent data in a clear and engaging manner. In this article, we will explore the concept of circle percentage infographics, their benefits, design principles, and practical applications.
What is a Circle Percentage Infographic?
A circle percentage infographic is a visual representation of data where a circle is divided into segments that represent different percentages of a whole. Each segment is proportional to the value it represents, allowing viewers to quickly understand relationships between different data points. This type of infographic is particularly effective for illustrating parts of a whole, making it ideal for showcasing statistics, survey results, and demographic information.
The Importance of Data Visualization
Data visualization plays a crucial role in the way we consume information. With the overwhelming amount of data available today, effective visualization helps us make sense of complex information quickly. Circle percentage infographics leverage visual elements to enhance comprehension and retention, enabling audiences to grasp key insights at a glance.
Key Benefits of Circle Percentage Infographics
Clarity: The circular format provides a clear visual representation of data, making it easier for viewers to understand relationships between different values.
Engagement: Visual elements are more engaging than text-heavy formats. Circle infographics can capture attention and encourage further exploration of the content.
Memorability: Information presented visually tends to be more memorable. The use of colors, shapes, and proportions helps anchor key messages in the viewer’s mind.
Comparison: Circle percentage infographics allow for easy comparison between different categories. Viewers can quickly see which segments are larger or smaller relative to others.
Versatility: These infographics can be used across various fields, from business and marketing to education and healthcare, making them a versatile tool for communication.
Design Principles for Effective Circle Percentage Infographics
Creating an effective circle percentage infographic requires thoughtful design and planning. Here are some key principles to consider:
1. Define Your Objective
Before designing your infographic, clarify its purpose. What message do you want to convey? Understanding your objective will guide your design choices and ensure the final product aligns with your goals.
2. Select the Right Data
Choose data that is relevant to your objective. Ensure the data is accurate and up-to-date. If you’re comparing categories, ensure they are logically related to maintain coherence.
3. Choose Colors Wisely
Color plays a significant role in the effectiveness of your infographic. Use a limited color palette to avoid overwhelming viewers. Each color should represent a specific category, and the contrast between segments should make them easily distinguishable.
4. Keep It Simple
Simplicity is key in design. Avoid cluttering your infographic with excessive text or unnecessary details. Focus on the most important data points and present them in a straightforward manner.
5. Use Clear Labels
Label each segment clearly to ensure viewers understand what each represents. Use concise, descriptive titles and consider including percentage values to provide precise information.
6. Provide Context
Include context or a brief explanation to help viewers understand the significance of the data. A short introduction or caption can enhance comprehension and reinforce the main message.
7. Maintain Proportions
Ensure that the segments accurately reflect the percentages they represent. Incorrect proportions can lead to misinterpretation of the data, undermining the infographic’s credibility.
8. Incorporate Visual Hierarchy
Use size, color, and positioning to create a visual hierarchy that guides the viewer’s eye through the infographic. This helps emphasize the most important information and ensures that the audience grasps the key takeaways.
Tools for Creating Circle Percentage Infographics
Several online tools and software can help you create visually appealing circle percentage infographics. Here are some popular options:
Canva: A user-friendly graphic design platform with templates for infographics, including circle percentage designs.
Piktochart: Offers customizable infographic templates and a range of design elements, making it easy to create professional-looking infographics.
Infogram: A data visualization tool that allows users to create interactive infographics, including circle percentage representations.
Venngage: Provides a variety of templates and design elements tailored for infographics, enabling users to create engaging visuals quickly.
Adobe Illustrator: For those with design experience, Illustrator offers advanced features for creating custom infographics from scratch.
Practical Applications of Circle Percentage Infographics
Circle percentage infographics can be applied in various fields to convey data effectively. Here are some practical examples:
1. Marketing and Business
In marketing, businesses can use circle percentage infographics to represent market share, customer demographics, or survey results. For example, a company might display its customer base by age group, showcasing the percentage of customers in each category.
2. Education
Educators can use these infographics to illustrate classroom statistics, such as student performance across different subjects. A circle infographic can visually represent the percentage of students achieving various grade levels, making it easy for teachers to identify areas for improvement.
3. Healthcare
In the healthcare sector, circle percentage infographics can be utilized to present data on patient demographics, treatment outcomes, or disease prevalence. For instance, a healthcare provider could create an infographic showing the percentage of patients diagnosed with different conditions.
4. Social Media
Social media platforms are ideal for sharing infographics. Circle percentage designs can be used to summarize survey results, engagement metrics, or audience insights, making the information shareable and easily digestible for followers.
5. Nonprofits
Nonprofit organizations can leverage circle percentage infographics to communicate their impact. For instance, they might present the percentage of funds allocated to different programs, helping donors understand how their contributions are used.
Best Practices for Sharing Circle Percentage Infographics
Once you’ve created your circle percentage infographic, it’s essential to share it effectively. Here are some best practices to consider:
Optimize for Platforms: Tailor the infographic’s dimensions and format for the platforms where you intend to share it (e.g., social media, websites, presentations).
Use Descriptive Titles: A clear, engaging title helps attract viewers’ attention and provides context for the infographic’s content.
Include a Call to Action: Encourage viewers to take action, whether it’s visiting your website, sharing the infographic, or participating in a survey.
Monitor Engagement: Track how your audience interacts with the infographic. Analyze metrics such as shares, likes, and comments to understand its impact and make improvements for future infographics.
Update Regularly: If the data changes, update your infographic to keep it relevant and accurate. Regularly refreshed content can help maintain audience interest and trust.
Conclusion
Circle percentage infographics are powerful tools for visual communication, offering clarity and engagement in presenting data. By understanding the principles of effective design and applying best practices, you can create compelling infographics that convey your message clearly and memorably. Whether for business, education, healthcare, or nonprofit initiatives, these infographics can transform complex information into easily digestible visuals, enhancing understanding and engagement among your audience. As data continues to play a crucial role in decision-making, mastering the art of circle percentage infographics will be an invaluable skill in today’s information-driven world.
#circle#infographic#template#presentation#design#infographic template#circle percentage#percetage infographic#slides#ppt#infographic design
1 note
·
View note
Photo

The "List Infographics PowerPoint Template" is a versatile and visually captivating presentation tool. It offers a collection of professionally designed infographics that are specifically tailored for creating lists and organizing information in a visually engaging manner. With this template, you can effectively showcase lists, bullet points, and key data points in an easy-to-understand format.
0 notes
Text
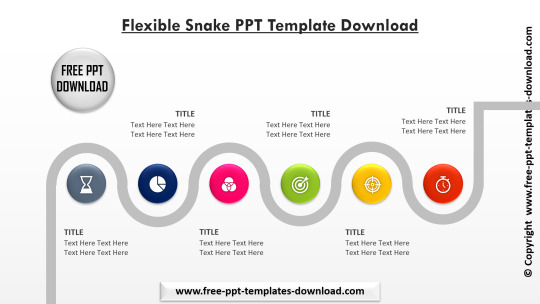
➡️ Download Link: Flexible Snake PPT Template Download
#download#ppt#freeslide#freeppt#Infographics#googleslide#freeinfographics#presentation#graphicdesigner#business#slides#PowerPoint#templates#freetemplates#designtemplate#powerpointdesign#pitchdeck
1 note
·
View note
Text

Now that we FINALLY have a high quality sprite of Thor (courtesy to @rosie-kairi ) I can finally officially preview my Kingdom Hearts Dark Road summary project!

The goal of this PPT is to precisely summarize all relevant information in regards to this game's story, concepts and characters! I have been working very hard on it and I am super excited to finally finish this sometime in the (near) future.
Part of this project will be character infographs which will be posted separately as well so be excited for when that comes out too!
[Just in case anyone is confused about Thor, you can read about him HERE]
#wanted to throw in another thor post#the ppt is 200% real tho#please be excited for it!!!#kingdom hearts dark road#khdr#kingdom hearts#thor kh#unreality#other people's ocs#katvtalkskh
61 notes
·
View notes
Text
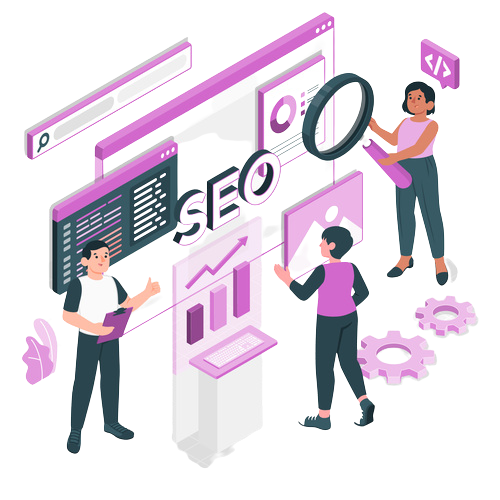
What is SEO in Digital Marketing? Benefits & Types Of SEO
SEO
What is SEO in Digital Marketing?
SEO stands for Search Engine Optimization. It is an organic process used to enhance the visibility and ranking of a website or webpage on the search engine results pages (SERPs). SEO aims to drive organic (unpaid) traffic for a particular’s web page/website.
SEO depends on various important factors like as keyword research, high-quality & relevant content, meta description, title tag, heading tag, URL structure, mobile friendliness etc.
Benefits Of SEO?
Increased Organic Traffic: SEO is an organic process. So, you can get more organic traffic from search engine result pages.
Better User Experience: SEO involves optimizing various aspects of a website, such as its structure, content, and navigation. This often leads to an improved user experience, making it easier for visitors to find what they're looking for.
Long-Term Results: SEO is a time taking organic process. If you follow the best SEO path and implement it on your website, that time you can get long-term benefits.
Cost-Effectiveness: Organic traffic generated through SEO is essentially free, making it a cost-effective way to attract visitors compared to paid advertising methods.
Targeted Traffic: SEO allows you to target specific keywords and phrases that are relevant to your business, ensuring that the traffic you receive is more likely to convert into customers.
Types Of SEO
On-Page SEO: This involves optimizing the content and HTML source code of individual web pages. It includes elements like keyword optimization, high-quality content creation, proper use of header tags, meta descriptions, and optimizing images.
Off-Page SEO: Off-Page SEO means whatever you can do outside of your website. Off-Page SEO is known as Off Side SEO or Link building. After completing your on-page SEO activities, you will start to create Link building to other high-quality websites for your websites. Like as Infographic submission, social bookmarking, classified submission, PPT/PDF submission etc.
Technical SEO: Technical SEO is a part of On-Page SEO. Because you are optimizing your website to ensure that search engines can crawl, index, and understand your content effectively. It includes tasks like improving site speed, optimizing for mobile devices, fixing broken links, and creating XML sitemaps.
Local SEO: For businesses with a physical presence, local SEO is crucial. It involves optimizing your online presence to appear in local search results, often including tasks like creating and optimizing Google My Business profiles, managing online reviews, and ensuring consistent NAP (Name, Address, Phone Number) information across platforms.
If you want to promote your business online, contact Digital Arijit, the best SEO expert in Kolkata. Get excellent SEO services at an affordable price. Visit Our Site: - https://digitalarijit.in/seo-expert-in-kolkata/
Content Strategy: Creating valuable, relevant, and high-quality content is a cornerstone of effective SEO. This includes blog posts, articles, videos, infographics, and other content that caters to your target audience's interests and needs.
Keyword Research: Keyword research is an important part of SEO. Keywords are search terms or words that users search in the search bar. Without the right keyword, you never get better visibility on the SERP. Your selected keyword must be according to your business niche and targeted audience.
Analytics and Monitoring: Regularly analysing your website's performance using tools like Google Analytics helps you track the effectiveness of your SEO efforts. Monitoring your rankings, traffic, and user behaviour can guide your ongoing optimization strategies.
Conclusion
In summary, SEO is a multifaceted approach that combines various techniques to improve a website's visibility, credibility, and organic traffic from search engines. It involves on-page and off-page optimization, technical improvements, content creation, keyword research, and continuous monitoring to achieve its benefits.
2 notes
·
View notes
Text
How the community will help mitigate the hazards caused by climate change?


WE ARE ONE: A community who fight against climate change.
"An understanding of the natural world and what's in it is a source of not only a great curiosity but great fulfillment." - David Attenborough
We all know that there have been changes during the years that we have lived on Earth, changes that are visible to all. Nevertheless, one continues to ignore it. When will we take action against it? NOW. Here are some strategies that community members can employ to lessen the risks brought on by climate change.
Artistry by: Rhea Troy N. Nieva
Caption: Rhea Troy N. Nieva
References:
ppt from Ma'am Anne R. Dioneda (first infographic picture)
https://www.priweb.org/blog-post/ten-ways-you-can-mitigate-climate-change (2nd picture)
#FightAgainstClimateChange
#ProtectEarth
#WeAreOne
3 notes
·
View notes
Text
Corporate PowerPoint Design: Improve Your Presentations with Professional PPT Design
In today’s fast-paced business world, a well-designed PowerPoint presentation can be the key to capturing your audience’s attention and delivering your message effectively. Whether you are pitching an idea, presenting a business strategy, or engaging stakeholders, corporate PowerPoint design plays a crucial role in making a lasting impression.
The Power of Professional PPT Design
A professional PPT design goes beyond just adding text and images to slides. It involves a strategic approach to layout, color schemes, typography, and visual hierarchy to ensure clarity, engagement, and persuasion. Well-structured slides help your audience stay focused while reinforcing your key messages.
Why Invest in Corporate PowerPoint Design?
1. Enhance Brand Credibility
A polished corporate PowerPoint design aligns with your brand identity, reinforcing professionalism and consistency. Custom templates with your brand colors, fonts, and logos create a cohesive experience, making your presentation look refined and trustworthy.
2. Increase Audience Engagement
Dull slides filled with text can cause your audience to lose interest quickly. Professional PPT design incorporates visuals, infographics, and animations to make the content more digestible, ensuring your audience remains engaged and attentive.
3. Communicate Complex Data Effectively
Data-heavy presentations can overwhelm viewers. With presentation graphic design, complex information can be transformed into easy-to-understand charts, graphs, and icons, making it easier for audiences to grasp key insights.
Key Elements of Effective Presentation Graphic Design
1. Visually Appealing Layouts
A balanced layout with ample white space prevents slides from feeling cluttered. Professional designers ensure that text, images, and graphics are harmoniously placed for maximum impact.
2. Consistent Branding
Every slide should reflect your company’s branding. Using the right color palette, fonts, and logo placement ensures that your presentation aligns with your corporate identity.
3. Engaging Visuals
High-quality images, icons, and infographics enhance the storytelling aspect of your presentation. Instead of lengthy text, visually compelling elements make your message more persuasive.
4. Minimal and Clear Text
Overloading slides with too much text can be overwhelming. A professional corporate PowerPoint design keeps text concise and highlights key points effectively.
5. Strategic Use of Animations and Transitions
Animations and transitions, when used correctly, add a dynamic element to presentations. They help direct attention and create a smooth flow without being distracting.
Elevate Your Presentations with Visual Spiders
At Visual Spiders, we specialize in creating corporate PowerPoint design solutions tailored to your needs. Our expert designers craft professional PPT designs that are visually compelling, brand-aligned, and optimized for maximum impact. Whether you need presentation graphic design for business meetings, investor pitches, or conferences, we ensure that your message is communicated effectively.
Let’s Make Your Next Presentation Stand Out!
Don’t let poor design dilute your message. Elevate your slides with our Professional PowerPoint Design services and leave a lasting impression on your audience. Contact Visual Spiders today to transform your presentations into powerful communication tools!
Powerpoint graphic design
Powerpoint Design
presentation design agency
#powerpoint creative design#powerpoint graphic design#corporate PowerPoint design#Professional PowerPoint Design
0 notes
Video
youtube
Create Infographic PPT Slides with Motion Animation
0 notes
Text
Why Presentation Design Consultancy Services Are a Game-Changer for Businesses

In a competitive business environment, the ability to communicate effectively through visuals can make or break a pitch, meeting, or campaign. Whether it’s a high-stakes investor presentation or a marketing deck for stakeholders, the impact of well-designed slides is undeniable. Yet, creating professional presentations that align with your brand while capturing your audience’s attention is no easy feat.
This is where presentation design consultancy services come into play. By combining creativity, strategic thinking, and technical expertise, these services transform ordinary slides into powerful communication tools that drive results. In this blog, we’ll explore why these services are vital for businesses, how INK PPT Design Agency can elevate your presentations, and the benefits of working with expert PPT designers for business presentations.
The Importance of Presentation Design in Modern Business
In today’s fast-paced business world, presentations have become a core element of communication, whether you’re pitching an idea, presenting quarterly results, or launching a product. However, a generic or poorly designed presentation can dilute your message and fail to engage your audience.
Why Design Matters in Business Presentations
First Impressions Count: Your presentation is often the first impression your audience has of your brand or idea. A professional design creates an immediate sense of credibility and trust.
Simplifying Complex Information: Visual storytelling can help simplify complex data and concepts, making it easier for your audience to understand and retain the information.
Engaging Your Audience: A visually appealing presentation keeps your audience engaged and encourages active participation.
Supporting Brand Identity: Consistency in design reflects your brand’s professionalism and attention to detail.
What Are Presentation Design Consultancy Services?
Presentation design consultancy services go beyond basic slide creation. They offer tailored solutions to ensure that your presentation aligns with your goals, audience, and branding.
Key Offerings of Presentation Design Consultancy:
Customized Designs: Tailored presentations that align with your brand’s guidelines and messaging.
Content Strategy: Structuring content for clarity and impact, ensuring your message resonates with your audience.
Data Visualization: Converting complex data into easy-to-understand infographics, charts, and visuals.
Platform Optimization: Designing slides compatible with platforms like PowerPoint, Keynote, or Google Slides.
Revisions and Support: Ongoing collaboration to refine and perfect your presentation.
Why Businesses Need Expert PPT Designers
Creating a compelling presentation requires more than just technical skills; it demands a deep understanding of design principles, audience psychology, and communication strategies. Expert PPT designers for business presentations bring this expertise to the table, ensuring every slide is crafted with purpose.
Benefits of Working with Professional Designers:
Time Efficiency: Free up your team’s time to focus on core tasks while experts handle the design.
High-Quality Output: Professional designers ensure your slides are polished, consistent, and visually appealing.
Tailored Messaging: Designers understand how to structure content for maximum impact, tailoring the narrative to your audience.
Versatility: From pitch decks to training materials, expert designers can handle a wide range of presentation types.
How INK PPT Design Agency Transforms Presentations
As a leading name in the field, INK PPT Design Agency specializes in helping businesses create presentations that leave a lasting impression. With a team of skilled designers and strategists, the agency provides end-to-end solutions for all your presentation needs.
What Sets INK PPT Apart?
Innovative Designs: INK PPT is known for its creative approach, crafting unique visuals that capture attention.
Tailored Solutions: The agency offers personalized services, including Google Slides customizations for marketing teams, to ensure your presentation aligns with your specific needs.
Experience Across Industries: INK PPT has worked with clients across various sectors, giving them a deep understanding of diverse business requirements.
Focus on Storytelling: Every presentation is designed to tell a compelling story, ensuring your audience stays engaged from start to finish.
Leveraging Google Slides Customizations for Marketing Teams
In addition to PowerPoint, Google Slides has become a popular tool for teams looking for seamless collaboration and cloud-based accessibility. However, the default templates often lack the sophistication required for professional business presentations.
Why Custom Google Slides Matter:
Brand Consistency: Custom slides incorporate your brand’s colors, fonts, and logo for a professional look.
Enhanced Collaboration: Google Slides allows team members to work on presentations in real time, making it ideal for marketing teams.
Reusable Templates: Custom templates save time and ensure consistency across multiple presentations.
By offering Google Slides customizations for marketing teams, INK PPT Design Agency ensures that businesses can leverage the platform’s potential while maintaining a polished and professional aesthetic.
The Future of Presentation Design
As technology continues to evolve, so do the tools and techniques for creating impactful presentations. Businesses that stay ahead of these trends can gain a competitive edge by delivering presentations that not only inform but also inspire.
Emerging Trends in Presentation Design:
Interactive Presentations: Incorporating clickable elements, animations, and multimedia for a more engaging experience.
AI-Driven Design Tools: Using artificial intelligence to automate design suggestions and streamline workflows.
Data-Driven Storytelling: Advanced data visualization tools enable more effective communication of insights.
Sustainable Design Practices: Digital presentations reduce the need for printed materials, aligning with eco-friendly initiatives.
Tips for Creating Impactful Presentations
While working with presentation design consultancy services ensures a professional outcome, here are some tips for businesses looking to elevate their presentations:
Start with a Clear Objective: Define what you want to achieve and structure your presentation accordingly.
Keep It Simple: Avoid clutter by focusing on key points and using minimal text.
Use High-Quality Visuals: Invest in professional images, icons, and graphics to enhance your slides.
Practice Your Delivery: A great design is only effective if paired with a confident and engaging presentation style.
Conclusion
In a world where attention spans are shrinking, the ability to deliver compelling presentations is more critical than ever. Presentation design consultancy services offer businesses the expertise and tools needed to stand out in a crowded marketplace.
Whether you’re looking for expert PPT designers for business presentations, Google Slides customizations for marketing teams, or end-to-end support, partnering with professionals like INK PPT Design Agency can transform your presentations into powerful storytelling tools.
By investing in professional design services, you can ensure your message resonates, your brand stands out, and your goals are achieved—one slide at a time.
#Google Slides customizations for marketing teams#Expert PPT designers for business presentations#Presentation design consultancy services
0 notes
Text
Visualizing Data: Crafting Flowcharts and Infographics with Google Slides
Branded Google Slides design of high quality: Frequently Asked Inquiries Explained
1.What files can Google Slides import?
Google Slides can import various file types, including Microsoft PowerPoint (.pptx, .ppt), OpenDocument Presentation (.odp), and PDF files. Additionally, it can import images in formats such as JPEG, PNG, and GIF. Users can also upload files from Google Drive or through other Google services. However, some formatting and features may not be preserved when importing from PowerPoint or other formats.
2. Can I rotate a table in Google Slides?
Yes, you can rotate a table in Google Slides. To do this, first select the table by clicking on it. Then, click on the "Format" menu, choose "Format options," and find the "Rotation" setting. Alternatively, you can hover your mouse near the corner of the table until the rotation handle appears, then click and drag to rotate it to your desired angle. While this method rotates the entire table, individual cells or text within the table can be rotated by adjusting the text direction in the "Table properties" menu.
3. Can I turn a Google slide vertical?
Yes, you can turn a Google Slides presentation vertical by changing the slide dimensions. To do this, go to "File" > "Page setup." In the dialog box, select "Custom" and enter your desired width and height (for a vertical slide, the height should be greater than the width). For example, you might set it to 8.5 inches wide by 11 inches high. After applying the changes, your slides will be oriented vertically.
4. How to do a flow chart in Google Slides?
To create a flowchart in Google Slides, open a new or existing presentation. Go to the “Insert” menu, select “Shape,” and choose shapes like rectangles or circles for your flowchart steps. Drag them onto the slide and arrange as needed. Use “Line” from the “Insert” menu to connect the shapes with arrows. To add text, double-click inside each shape. Customize colors and styles using the toolbar options. Once finished, you can group the shapes for easy movement by selecting them, right-clicking, and choosing “Group.” Save your presentation to maintain your flowchart.
5. Does Google Slides have infographics?
Google Slides does not have built-in infographics as a separate feature, but users can create infographics using its shapes, charts, and design tools. Additionally, there are various templates available in the Google Slides template gallery and third-party websites that offer infographic designs compatible with Google Slides. Users can also import images and graphics from external sources to enhance their presentations.

Visit: VS Website See: VS Portfolio
0 notes
Text
Free AI Presentation Maker: Revolutionizing the Way You Create Presentations
The Need for AI in Presentation Design
Designing presentations traditionally can be time-consuming, requiring attention to detail, creativity, and proficiency with design software. Many users, however, may not have access to advanced design skills or tools to craft visually appealing slides. This is where AI steps in, automating the design process and delivering top-quality presentations with minimal input. The result is a tool that allows you to focus on your content while AI takes care of the design aspects.
Features of a Free AI Presentation Maker
A Free AI Presentation Maker provides a wide array of features that make creating presentations faster and easier. Here are some of the key features:
Template Selection: The AI presentation maker offers a variety of templates designed for different purposes, including business meetings, educational presentations, and marketing campaigns. These templates are ready to use and customizable based on your preferences.
Automated Slide Layouts: Once you input your text, the AI analyzes your content and suggests the best layouts for each slide, ensuring that the information is presented in a clear and engaging manner.
Content Suggestions: AI tools often come with content suggestion features, where the tool suggests relevant images, icons, and infographics to make your slides more attractive and informative. Free Ai Presentation Maker This feature saves you the hassle of searching for visuals and ensures a cohesive presentation design.
Seamless Integration: Many AI presentation makers allow easy integration with popular office applications like PowerPoint and Google Slides, making it simple to share and edit your presentation further if needed.
Benefits of Using an AI Presentation Maker Free Tool
Using aFree AI PPT Generator has several advantages:
Time-Saving: With the AI’s help, you can produce high-quality presentations in a fraction of the time it would take to do manually. free ai ppt generator AI’s ability to quickly process information and suggest layouts saves countless hours.
Cost-Effective: AI tools, especially free ones, eliminate the need to purchase expensive design software or hire professional designers, making it an affordable choice for individuals and small businesses.
Easy to Use: These tools are designed to be user-friendly, so you don’t need to be a design expert to create impressive presentations. Anyone can use them to produce visually appealing results.
Customizable: While the AI suggests layouts and visuals, you still have full control over the content. You can customize slides, adjust colors, fonts, and images to fit your brand or personal style.
The Role of AI in Presentation Design
One of the most innovative aspects of AI-powered presentation tools is their ability to analyze the content you provide and adapt accordingly. Whether you’re delivering a business pitch, a lecture, or a report, the AI understands the context and tailors the design to your specific needs. It can even adjust the flow of the presentation for better readability and impact, making sure your message is communicated clearly.
Additionally, the AI continues to improve over time, learning from user input and gaining the ability to better predict design preferences. This makes AI presentation makers a long-term investment in the efficiency and quality of your presentation creation process.
Why Choose an AI Presentation Maker Free?
Many AI-powered presentation tools offer free versions, which provide users with ample resources to create effective presentations without any hidden costs. For those on a budget or simply looking for a fast and easy solution, a ai presentation maker free offers a valuable alternative to traditional methods. With these free versions, you can enjoy all the essential features, such as customizable templates, smart layouts, and content suggestions, without the need for a paid subscription.
While some premium features may require payment, the free version still offers plenty of capabilities to meet your presentation needs. It’s an ideal choice for students, freelancers, or anyone looking to create polished presentations without spending money.
1 note
·
View note