#Bearish Symmetrical Triangle.
Explore tagged Tumblr posts
Visit Tumblr Blog
Explore Tumblr blogs with no restrictions, modern design and the best experience.
Last Seen Tumblr Blogs


Fun Fact
The “We are the 99%” Tumblr blog became the slogan for the Occupy Wall Street movement.
Video
youtube
🚀 Symmetrical Triangle Chart Pattern🔥 | Bearish Breakout pattern | Chart...
#youtube#Bearish Symmetrical Triangle Pattern | Trading Mindset Academy livetrading optionstrading ! In this video we'll be trading the Bank Nifty
1 note
·
View note
Text
How the McClellan Summation Index and Bearish Pennants Uncover Market The McClellan Summation Index & Bearish Pennants: Advanced Forex Insights with a Twist Why You Need to Know This Ever feel like your trades are like juggling chainsaws—thrilling but risky? The McClellan Summation Index (MSI) and bearish pennants are two tools that can help you identify market trends and avoid costly mistakes. Combining these tools is like having a GPS for market movements, minus the annoying "recalculating" voice. McClellan Summation Index: The Unsung Hero of Market Breadth Picture this: the MSI is like a market thermometer, giving you a pulse on the health of a trading environment. It aggregates data from the McClellan Oscillator, helping traders see beyond surface-level price action. Think of it as reading between the lines of the market’s diary. Key Insights: - Trend Confirmation: When MSI is rising, it signals strong bullish momentum; a falling MSI indicates bearish dominance. - Divergence Clues: Spotting divergences between price movement and MSI can be a game-changer—it's like finding a cheat code in a video game. - Cautionary Tales: Beware of overbought or oversold extremes; they’re like trading on thin ice. Quick Humor Break: Ever felt the market is gaslighting you? MSI can save you from those "Am I crazy, or is the market?" moments. Bearish Pennants: The Subtle Signal You Can't Ignore Imagine a bear waving a red flag in a crowded room—that's the bearish pennant. This chart pattern indicates a continuation of downward trends, often following a sharp price drop (also known as the flagpole). How to Spot It: - Flagpole Formation: Look for a steep decline preceding the pennant pattern. - Consolidation Zone: Prices consolidate into a small symmetrical triangle. - Breakout Alert: A breakout below the consolidation zone confirms the bearish continuation. Elite Tips: - Use volume analysis to validate the breakout. Low volume during consolidation and high volume during breakout = chef’s kiss. - Combine with RSI or MSI for double confirmation, like checking both the weather app and looking outside. Mastering the Pair: MSI & Bearish Pennants in Action Here’s where the magic happens. Combining MSI with bearish pennants gives you a holistic view of the market. When MSI trends down and a bearish pennant forms, it’s like seeing storm clouds before a thunderstorm—time to grab an umbrella. Step-by-Step Strategy: - Identify the MSI Trend: Is it trending downward? Good, you’re halfway there. - Spot the Pennant: Locate the bearish pennant on your chart. - Validate with Volume: Low consolidation volume and high breakout volume seal the deal. - Plan Your Entry: Enter short positions post-breakout and set tight stop-loss levels. - Monitor & Adapt: Use trailing stops and stay updated with market news. Real-World Example: Bearish Pennant Meets McClellan Summation Index In late 2023, EUR/USD showed classic signs of a bearish pennant. The MSI corroborated this, trending sharply downward. Traders who shorted after the breakout pocketed significant gains. Data doesn’t lie, and neither does a well-executed strategy. Avoiding Common Pitfalls - Ignoring Context: Don’t rely solely on patterns; integrate broader market analysis. - Overtrading: Seeing pennants everywhere? Step back—confirmation is key. - Neglecting Risk Management: Always use stop-loss levels; the market doesn’t owe you anything. Quick Recap - MSI offers a panoramic view of market health, while bearish pennants pinpoint potential downward continuations. - Use these tools together for a one-two punch of insight. - Stay disciplined, and don’t let market emotions cloud your judgment. Trading isn’t just about predicting markets; it’s about managing risk and capitalizing on high-probability setups. The MSI and bearish pennants might just become your new best friends. —————– Image Credits: Cover image at the top is AI-generated Read the full article
0 notes
Text
Anticipating a Major Bitcoin Jump as Federal Rate Cut Looms
Key Points
The Federal Reserve’s potential rate cut may boost Bitcoin’s appeal as a non-traditional investment.
Bitcoin’s price and MVRV ratio could be driven higher by increased capital flow into the asset.
The Federal Reserve’s decision regarding interest rates in December is in alignment with a 96% likelihood of a 25 basis points (bps) rate cut, as per the CME’s Fed Watch.
This is a significant rise from the 89% probability recorded in the last 24 hours, and the 65% probability a month ago.
Rate Cut and Bitcoin
Considering the lower inflation rates outside housing, and total inflation just above target due to housing costs, a rate cut by the Fed could enhance the attractiveness of non-traditional investments such as Bitcoin (BTC).
Historically, cryptos have become more appealing with lower rates as they decrease the attraction of yield-bearing assets and enable increased liquidity and institutional borrowing at lesser costs.
Thus, a potential rate cut could signal a bullish outlook for Bitcoin, suggesting a possible continuation of its rally as capital flows into the asset increase.
Price Patterns and Liquidations
BTC’s 4-hour chart shows a consolidation in a symmetrical triangle pattern, a continuation pattern, which supports the rally’s continuation.
The price moved in increasingly smaller oscillations between the two converging trendlines indicating consolidation before a breakout. The breakout to the upside suggested a bullish continuation.
With the anticipated Fed rate cuts, which could be bearish for the dollar, Bitcoin could become more appealing when seeking higher returns, potentially driving BTC’s price further up.
Data from Coinglass showed a massive concentration of leveraged orders risking liquidation around the current price of BTC across different exchanges, including Binance.
If Bitcoin surpassed $105K, over $4.1 billion worth of BTC shorts could be set for liquidation, which could amplify the uptrend due to forced coverings by short sellers.
The MVRV ratio showed that Bitcoin’s market price was approximately 2.53 times higher than its realized value.
The MVRV ratio has not reached the extreme peaks observed in earlier cycles, indicating that Bitcoin may not be at a market peak.
If the Federal Reserve cuts interest rates, it could enhance appetite for Bitcoin. This could potentially drive both the price and MVRV ratio higher as more capital flows in, reflecting a bullish outlook without immediate signs of a peak.
0 notes
Text
China Nvidia probe sparks Wall Street retreat
China equities raced higher yesterday after the government changed its monetary policy stance to "appropriately loose" from "prudent," its first change in 14 years. Chinese equities soared by around 3.0% as investors rushed to price in renewed stimulus efforts by the Mainland government.
China was in the news again later, as regulators announced an anti-monopoly probe on US chip maker Nvidia, sending its stock over 3.0% lower overnight.
Where Nvidia goes these days as the darling of the AI rally, so goes Wall Street. With inflation data also due Wednesday, Wall Street took risk of the table and closed lower. The S&P 500 fell by 0.44%, the Nasdaq by 0.43%, and the Dow Jones fell by 0.26%.
Bitcoin slumped by over 5.0% overnight, but gold rallied 1.03% to $2,660.30 an ounce as geopolitical tensions also lifted oil and the US dollar. Recently, gold has fallen out of the headlines as Bitcoin has stolen the spotlight. It has been quietly consolidating in a symmetrical triangle, with resistance today at $2,675.00 and support at $2592.00. A breakout appears imminent, but its direction is not certain.

XAUUSD H1
Oil moved higher on China's monetary policy comments and turmoil in Syria. Brent crude added 1.20% to $71.85 a barrel, and WTI rose 1.50% to $68.10. The rally overnight did not materially change the bearish technical picture of Brent crude; instead, it extended its sideways consolidation. Trendline resistance remains distant at $73.70, with critical support at $70.00 a barrel.

UKOIL H1
The day in Asia begins with China's trade data. However, the impact will be light as investors focus on the country's monetary policy change and possible measures to lift domestic demand.
The main event is the Reserve Bank of Australia (RBA) rate decision, with the street almost universally forecasting the RBA to remain unchanged at 4.35%.
AUD/USD rode the coattails of China's monetary policy easing higher overnight, rallying an impressive 0.80% to 0.6440. However, it is still trapped within a bearish falling wedge and never threatened resistance at 0.6490. It may track the China story but remains acutely vulnerable to a surprise cut by the RBA today. That would send it sharply lower through support at 0.6360.

AUDUSD H1
Disclaimer:
The information contained in this market commentary is of general nature only and does not take into account your objectives, financial situation or needs. You are strongly recommended to seek independent financial advice before making any investment decisions.
Trading margin forex and CFDs carries a high level of risk and may not be suitable for all investors. Investors could experience losses in excess of total deposits. You do not have ownership of the underlying assets. AC Capital Market (V) Ltd is the product issuer and distributor. Please read and consider our Product Disclosure Statement and Terms and Conditions, and fully understand the risks involved before deciding to acquire any of the financial products provided by us.
The content of this market commentary is owned by AC Capital Market (V) Ltd. Any illegal reproduction of this content will result in immediate legal action.
0 notes
Text
Indian Stock Market Trading | Investing: Technical Analysis
Technical analysis is a popular approach in the Indian stock market for both trading and investing. By using patterns, trends, and other market data, technical analysis aims to forecast stock price movements and identify profitable opportunities. Here’s a comprehensive look at how technical analysis works and how it can be applied to the Indian stock market.
1. What is Technical Analysis?
Technical analysis is the study of past market data, primarily price and volume, to predict future price movements. Unlike fundamental analysis, which looks at a company's financial health and growth potential, technical analysis focuses on stock price movements and investor sentiment.
Key Components of Technical Analysis
Price: The most important element in technical analysis. Every stock’s price reflects all available information.
Volume: Shows the level of trading activity and can confirm price trends.
Timeframe: Different trends appear over short, medium, or long periods, affecting decisions for day traders, swing traders, and long-term investors.
2. Basic Principles of Technical Analysis
Technical analysis is based on a few core principles:
Market Discounts Everything: All information is already priced into the stock.
Price Moves in Trends: Prices often move in recognizable trends rather than random patterns.
History Tends to Repeat Itself: Market behavior repeats over time, often due to investor psychology.
3. Tools and Indicators in Technical Analysis
Simple Moving Average (SMA): The average price over a specific period, like 50-day or 200-day, to identify trends.
Exponential Moving Average (EMA): Gives more weight to recent prices, making it sensitive to new information.
Relative Strength Index (RSI)
A momentum indicator that ranges from 0 to 100, indicating overbought (above 70) or oversold (below 30) conditions.
Bollinger Bands
Consist of a moving average with two bands that adjust to volatility, useful for identifying overbought and oversold conditions.
MACD (Moving Average Convergence Divergence)
Combines moving averages to show momentum, often used to spot trend changes.
Support and Resistance Levels
Price levels where a stock historically stops rising or falling, signaling potential entry or exit points.
4. Chart Patterns in Technical Analysis
Indian traders often rely on chart patterns that help predict future price movements.
Head and Shoulders
A reversal pattern that suggests the end of an uptrend.
Double Top and Double Bottom
These patterns indicate potential reversals, with double tops suggesting a bearish reversal and double bottoms signaling a bullish reversal.
Triangles (Ascending, Descending, and Symmetrical)
These patterns indicate periods of consolidation, where the stock is likely to break out in the direction of the broader trend.
Flags and Pennants
Short-term continuation patterns that signal brief pauses in ongoing trends, often indicating that the price will resume its previous direction.
5. Types of Trends in Technical Analysis
Trends are categorized based on the timeframe, providing different insights for traders and investors.
Uptrend
Characterized by higher highs and higher lows, indicating a bullish market.
Downtrend
Marked by lower highs and lower lows, indicating a bearish market.
Sideways/Horizontal Trend
Occurs when prices move within a narrow range, signaling indecision among investors.
6. Timeframes in Technical Analysis
Choosing a timeframe is essential, as it impacts the analysis and strategy.
Intraday: For traders looking to profit from daily price fluctuations.
Swing Trading: Involves holding stocks for days or weeks to capture short- to medium-term trends.
Long-Term: Investors hold positions for months or years, focusing on longer-term trends.
7. Using Technical Analysis for Trading
Traders can use technical analysis to make quick buy or sell decisions based on signals and patterns.
Identifying Entry and Exit Points
Use indicators like RSI, MACD, and support/resistance levels to determine optimal buy and sell points.
Risk Management
Incorporate stop-loss orders to limit losses and protect profits, especially in volatile stocks.
Backtesting
Testing strategies on historical data to gauge effectiveness before applying them in live trading.
8. Using Technical Analysis for Investing
For long-term investors, technical analysis can help optimize the timing of buying or selling, even if they rely more heavily on fundamentals.
Using Moving Averages for Timing
Long-term investors can use moving averages to confirm uptrends before making investments or to decide when to exit.
Support Levels as Buying Opportunities
In bull markets, support levels offer a chance to buy stocks at a relative discount.
Avoiding Overbought Conditions
Long-term investors may avoid stocks with high RSI values (over 70), as they may be due for a correction.
9. Limitations of Technical Analysis
Technical analysis, while powerful, does have its limitations:
Does Not Consider Fundamentals: It ignores a company’s financial health.
Subjective Interpretation: Patterns and indicators can be interpreted differently.
Prone to False Signals: Indicators can sometimes give incorrect buy or sell signals, especially during volatile markets.
10. Practical Tips for Using Technical Analysis in the Indian Market
Focus on High-Volume Stocks: High-volume stocks offer clearer technical signals and less price manipulation.
Combine with Fundamentals: For investment, combine technical analysis with fundamental analysis to make well-rounded decisions.
Stay Updated with News: The Indian stock market can react to political, economic, and regulatory news, impacting technical patterns.
Practice Patience: Technical analysis requires patience and consistency to understand market trends and patterns.
Conclusion
Technical analysis can be a valuable tool for both traders and investors in the Indian stock market. By learning to read indicators, identify patterns, and understand trends, you can make more informed decisions. Whether you're trading daily or investing for the long term, technical analysis provides actionable insights to help navigate the dynamic and often unpredictable nature of the stock market.
0 notes
Text
Bitcoin Price Dips With Whale Dump! Crucial September For BTC? - Journal Today Internet - BLOGGER https://www.merchant-business.com/bitcoin-price-dips-with-whale-dump-crucial-september-for-btc/?feed_id=184716&_unique_id=66d35fff91928 With the increased uncertainty in the cryptocurrency market, the price of Bitcoin has failed to hold its value above the $60,000 mark. Notably, it has dropped approximately 8.86% over the past seven days and is presently hovering close to its support of $59,000.Moreover, ARK Invest’s recent selling of $100 Million has created a FOMO-like situation among investors regarding its short-term Bitcoin prediction. Further, questions like “Will Bitcoin price hit $100K in 2024?” and “Will BTC Rise Up?” are highly searched.Dive in as, in this article, we have uncovered the market sentiments, price analysis, and possible Bitcoin price prediction for the upcoming month.BTC Price Repeatedly Fails To Breach Its Important Resistance ZoneOver the past few weeks, the Bitcoin price has repeatedly failed to break out of its important resistance level of $62,000. This highlights a strong selling point for the star crypto at that point. Further, it has formed a symmetric triangle pattern in the 1D time frame and has continued trading within it.TradingView: BTC/USDTThe technical indicator, RSI displays a constant flatline below the neutral point. This indicates a weak buying-over-selling pressure for the star crypto in the market.On the other hand, the MACD has recorded a rising red histogram with a bearish convergence in the 1D time frame. This suggests that the Bitcoin price may continue losing value during the upcoming week.Also Read: If Bitcoin Stays Above $60K, These Altcoins Will Drive Above 30% Gains.Bitcoin ETF August ReportDuring the 22 active ETF days in August, the BTC ETF recorded a positive flow for 13 days, or 69.23%. Reportedly, on the 23rd it recorded its highest single-day inflow with $252 Million and lowest inflow day on the 15th with $11.11 Million.Notably, during these 13 days, it has added a total of $1,111.15 Million.Source: SoSoValueOn the flip side, it recorded a negative outflow for 9 out of 22 days, or 30.77%. During this period, it recorded the highest outflow on the 2nd with $237.45 Million and the lowest outflow on the 29th with $71.79 Million.Over the 9 negative days, the Bitcoin ETF has lost $1,205.45 Million. With this, the total net flow of Bitcoin ETF for August concluded at -$94.30 Million. This marks this month a negative one.Will BTC Price Hit $65K This September?If the market regains momentum, the Bitcoin price will prepare to retest its important resistance zone above the $62K level. Maintaining the price above that level will set the stage for the market leader to push itself toward its upper resistance level of $66,725 during the upcoming weeks.Conversely, if the bears overpowered the bulls, the BTC crypto will drop toward its support trendline of the symmetric triangle pattern. Moreover, if the bears continue to dominate the market, it will further plunge toward its lower level of $55,000. http://109.70.148.72/~merchant29/6network/wp-content/uploads/2024/08/bitcoin-price5-1-1.jpg #GLOBAL - BLOGGER With the increased uncertainty in t... BLOGGER - #GLOBAL
0 notes
Text
Master the NZDCHF Symmetrical Triangle: Hidden Tactics Revealed When it comes to Forex trading, some patterns fly under the radar—hidden gems waiting to be discovered by savvy traders. The NZDCHF symmetrical triangle is one such pattern, a technical formation that offers incredible potential when wielded with precision. Let’s explore how to master this lesser-known setup, combining humor, advanced insights, and ninja-level tactics to take your trading game to new heights. What is the NZDCHF Symmetrical Triangle? Imagine a tug-of-war where both teams are equally matched, pulling the rope into a perfectly triangular formation. That’s your symmetrical triangle—formed when NZDCHF price action consolidates into a narrowing range of lower highs and higher lows. This pattern often signals a breakout, but the direction? That’s the million-dollar question. Why Most Traders Miss This Hidden Gem Trading is a lot like fishing. Most traders cast their nets where the crowd gathers, missing out on the quieter spots teeming with opportunity. The NZDCHF symmetrical triangle is one of those quiet spots. Why? - Lack of Awareness: Many traders overlook cross pairs like NZDCHF, focusing instead on major pairs like EURUSD. - Misinterpreting Patterns: Symmetrical triangles often look mundane to the untrained eye, leading traders to dismiss them as noise. - Fear of False Breakouts: The pattern’s ambiguity—whether it will break bullish or bearish—scares off less confident traders. Breaking Down the NZDCHF Symmetrical Triangle Step 1: Identify the Triangle - Use the 4-hour or daily timeframe for clarity. - Look for converging trendlines connecting higher lows and lower highs. Step 2: Measure the Potential - Calculate the height of the triangle at its widest point. This gives you a projected breakout target. Step 3: Watch for the Breakout - Use volume as a confirmation. A breakout accompanied by increasing volume is more reliable. - Wait for a candle close outside the triangle before entering a trade. Step 4: Manage Risk - Set your stop loss just outside the triangle on the opposite side of the breakout. - Use a 1.5:1 or 2:1 risk-reward ratio for optimal results. Advanced Ninja Tactics for Symmetrical Triangles 1. Use Fibonacci Retracements Combine Fibonacci levels with the triangle to pinpoint high-probability breakout zones. For instance, if the breakout aligns with a 61.8% retracement level, it’s a strong signal. 2. Pair it with Economic Indicators NZDCHF is heavily influenced by New Zealand’s dairy exports and Swiss franc’s safe-haven status. Watch for news impacting these economies to anticipate breakout directions. 3. Trade the Fakeout Sometimes, price action fakes a breakout in one direction before reversing. Advanced traders can capitalize on these fakeouts by setting trap orders. Humorous Anecdote: The Triangle Tango Trading the symmetrical triangle is like going to a wedding where everyone expects you to dance. The triangle teases you, hinting at a breakout. You step forward, unsure if it’ll lead to a slow waltz (gradual breakout) or a wild cha-cha (sharp price movement). Either way, the key is not to trip over your own feet—or your stop loss. Case Study: A Real-World Example In October 2023, NZDCHF formed a textbook symmetrical triangle on the daily chart. Traders who spotted the pattern and followed our ninja tactics saw a bullish breakout that rallied 120 pips. By combining Fibonacci retracements and volume analysis, they minimized risks and maximized profits. The Power of the NZDCHF Symmetrical Triangle The symmetrical triangle may not be the flashiest pattern, but it’s a reliable tool for traders willing to dig deeper. With careful analysis, disciplined risk management, and a sprinkle of humor, you can turn this hidden gem into a cornerstone of your trading strategy. Elite Tactics in Bullet Points - Identify the pattern on 4-hour or daily charts. - Measure the triangle’s height to set breakout targets. - Confirm with volume and candle closes. - Manage Risk with strategic stop-loss placement. - Enhance Accuracy using Fibonacci levels and economic indicators. —————– Image Credits: Cover image at the top is AI-generated Read the full article
0 notes
Text
Why It Might Be High Time to Make the Move to Ethereum
Key Points
Ethereum (ETH) shows a potential reversal pattern against Bitcoin (BTC) and USD pairs, indicating a possible market dominance.
Increasing institutional interest and positive market sentiment back Ethereum’s potential rise.
Ethereum (ETH), the second-largest cryptocurrency by market cap, is showing signs of a potential reversal against Bitcoin (BTC) and USD pairs.
Despite recent price action challenges, Ethereum’s scalability continues to drive its growth.
Technical Indicators Favor Ethereum
At the time of writing, the daily chart for ETH/BTC formed a Double Bottom, a common reversal pattern. This suggests a potential shift in crypto market dominance towards Ethereum.
The ETH/USD chart also shows a symmetrical triangle with a double bottom on its lower trendline, further indicating a possible market sentiment shift in Ethereum’s favor.
These combined signals suggest that now might be a good time to shift the focus towards Ethereum, in anticipation of a possible increase in its market dominance.
Moreover, the Supertrend indicator is holding strong, signaling a buying opportunity. Ethereum’s on-balance volume (OBV) has also been steadily increasing, further supporting this potential shift.
Despite bearish sentiments in the market, these technical signals show strength for Ethereum, suggesting a possible shift towards Ethereum dominance.
Market Sentiment and Institutional Interest
The market sentiment is shifting towards Ethereum, with increasing optimism. This aligns with the views of Smart Money, suggesting Ethereum could be set for a bullish breakout.
This shared optimism could strengthen the possibility of Ethereum taking over the market, especially after a prolonged period of Bitcoin’s dominance.
Institutional interest in Ethereum is also rapidly increasing. Data from Arkham revealed that Blackrock’s Ethereum holdings are nearing a $1 billion valuation, highlighting significant institutional confidence in Ethereum.
This rapid accumulation by major financial institutions further validates the potential shift towards Ethereum.
With this level of institutional backing, combined with positive market sentiment and technical indicators, Ethereum may be poised for potential price increases, especially as it aims to take over market leadership from Bitcoin.
1 note
·
View note
Text
BOTT Price Action Guide: Binary Options Turbo Trading, Forex, FX Options, Digital Options BOTT Price Action Guide: Binary Options Turbo Trading, Forex, FX Options, Digital OptionsThe ultimative Price Action guide (7 edition) for any kind of financial instrument (Binary Options, Forex, FX Options, Digital Options) any kind of time frame from 1 min over 5 min up to 15 min, 30 min and above and any kind of broker. This ebook is all you need, especially as a binary option turbo trader or Forex day trader to get profit out of the market, to get out of debt, make yourself a living or help your friends and family and to archieve financial freedom. Don't miss the opportunity to get this ultimative Price Action guide (7 edition)File Size: 12597 KBPrint Length: 118 pagesPublisher: BO Turbo Trader; 7 edition (October 24, 2018)Publication Date: October 24, 2018Content:Mindset for consistent profits- Practice- Win Rate- Discipline- Money Management- Emotions Candlestick Patterns- Hammer, Inverted Hammer, Takuri Line, Shooting Star and Hanging man- Dragonfly Doji, Gravestone Doji- spinning top - long-legged doji, high wave and rickshaw man- Pinbar - Pin Bar - Pinocchio bar or Kangaroo Tail - Tweezer Top and Tweezer Bottom- bearish harami, bullish harami and bullish harami cross and bearish harami cross- three inside down, three inside up- descending hawk and homing pigeon- bearish meeting line - counterattack line and bullish meeting line- bearish belt hold - black opening shaven head - black opening marubozu- bullish belt hold - white opening shaven bottom - white opening marubozu- bearish kicker signal - bullish kicker signal- matching high and matching low- bearish stick sandwich and bullish stick sandwich - bearish breakaway and bullish breakaway- ladder top and ladder bottom - tower top and tower bottom- three stars in the north and three stars in the south- bearish sash pattern and bullish sash pattern- engulfing candlestick pattern or the big shadow pattern- (bearish) dark cloud cover and (bullish) piercing line- Breakaway gap, exhaustion gab, continuation gap and common gaps- rising window and falling window- marubozu and big belt- inside bar and mother bar- evening star, morning star and evening doji star and morning doji star- three white soldiers and three black crowsChart Patterns- Double Top - M Formation - Mammies and Double Bottom - W Formation - Wollahs- J-Hook pattern and inverted J-Hook candlestick pattern- bearish last kiss - bearish pullback and bullish last kiss and bullish breakout- Head and Shoulders and inverted Head and Shoulders Pattern- Trend Channel - uptrend and downtrend- symmetrical triangle- ascending triangle and descending triangle- bullish flag and bearish flag - bullish pennant and bearish pennant - rising wedge and falling wedge- Broadening Bottoms and Broadening Tops- Rectangle Bottoms and Rectangle TopsConcepts- Candlestick Mathematics- Rejection - market move - weak snr and strong snr- trending and ranging market- minor and major trend- adapting forex strategies to binary options turbo trading- proper rejection - invalid rejection- false breakouts - channel breakouts- reversal and retracements- highest probability trading setups- high probability techniques- market pressures and types of market pressures- upper shadow and lower wick or tail- advanced candlestick charting techniques- overbought and oversold - oscilator - RSI CCI Stochastic Oscilator- different market conditions and market conditions examples- cycle of market emotions, psychology and dynamics- trading setups without rejections as confirmation - multiple time frame trading concept, system, methology and strategy- candlestick momenting- direction of candlestick momentum- inside swing and outside swing- support and resistance - minor snr and major snr and much more concepts ... Also by the same author: BOTT Mentorship Self-Study Video Pack 1-4 BOTT Price Action Indicator BOTT Price Action Bible by BO Turbo Trader
0 notes
Text
Recovery in the global crypto market remains elusive despite broader dollar weakness. Bitcoin remains flat around $22,800, while Ethereum has dropped nearly 1% to below $1,650.
Shiba Inu (SHIB) price analysis shows a neutral stance today. Despite opening higher, SHIB couldn't sustain its gains. After reaching a high of $0.00001220, the price retraced to $0.00001206. The 24-hour trading volume for SHIB, the 13th largest cryptocurrency by market cap, is $390,912,433, a 32.14% increase according to CoinMarketCap.
SHIB has gained over 40% since the start of 2023, driven by several fundamental factors. One key factor is the announcement of Shibarium, a layer 2 blockchain solution, on January 6. Additionally, South Korea’s largest cryptocurrency exchange, Upbit, listed Shiba Inu against the Korean Won on January 18.
Moreover, a tweet by Ali Needazar revealed an anonymous user purchased 848,776,937 SHIB coins for over $9.2 million. The largest Ethereum whales also hold more than 50.5 trillion Shiba Inu coins.
Despite significant whale activity, SHIB has struggled to maintain its gains.
Technically, on the 4-hour chart, SHIB is in an uptrend from its December 29 low of $0.00000804. A symmetrical triangle formation at higher levels suggests a potential breakout. The 4-hour RSI reads 58, below the average line, while the MACD is above the midline but shows bearish momentum.
The price is hovering near the 21-day Exponential Moving Average (EMA). Sustained selling could push the price down to $0.00001106. On the upside, the first target is the previous high of $0.00001250.
0 notes
Text
Shiba Inu enthusiasts have reason to celebrate, as analysts predict a bullish pennant pattern could catapult SHIB to new record highs. With this promising technical formation, Market experts are optimistic about the cryptocurrency's future performance. Stay tuned to see how this unfolds and what it means for Shiba Inu investors. Click to Claim Latest Airdrop for FREE Claim in 15 seconds Scroll Down to End of This Post const downloadBtn = document.getElementById('download-btn'); const timerBtn = document.getElementById('timer-btn'); const downloadLinkBtn = document.getElementById('download-link-btn'); downloadBtn.addEventListener('click', () => downloadBtn.style.display = 'none'; timerBtn.style.display = 'block'; let timeLeft = 15; const timerInterval = setInterval(() => if (timeLeft === 0) clearInterval(timerInterval); timerBtn.style.display = 'none'; downloadLinkBtn.style.display = 'inline-block'; // Add your download functionality here console.log('Download started!'); else timerBtn.textContent = `Claim in $timeLeft seconds`; timeLeft--; , 1000); ); Win Up To 93% Of Your Trades With The World's #1 Most Profitable Trading Indicators [ad_1] Multiple analysts have identified a bullish pennant on the Shiba Inu chart, outlining the potential for a profit of above 62% soon. Shiba Inu bulls are encountering significant resistance around the $0.000025 price level. Last week, amid SHIB engineering a mini rally, it barely crossed this range before retreating below. At the last check, SHIB succumbed to bearish pressure, falling behind by at least 5% and hitting an intraday low of $0.00002361. Despite maintaining positive gains in its 30-day trajectory, Shiba Inu is still struggling to surpass the $0.000025 level decisively. Meanwhile, prominent Market observers are confident that SHIB is counting down from its current consolidation phase. They have forecasted various breakout price targets Shiba Inu holders may look out for soon. Incoming 62% Profit for Shiba Inu Holders Famous Bitcoin analyst Clifton has joined the roster of commentators calling attention to an impending bullish trend for Shiba Inu. In a recent update on X, Clifton highlighted the formation of a bullish pennant on the 24-hour timeframe for Shiba Inu. For context, a bullish pennant formation signals that an asset is prepared to continue an uptrend commenced much earlier before encountering brief opposition. This formation, resembling a symmetrical triangle, is characterized by consolidating prices, hinting at an imminent breakout. In Shiba Inu’s case, SHIB had an ongoing uptrend in early March but ran out of steam. It entered a downtrend that took it back to $0.000018 in April. The overall candlestick pattern SHIB established in March translated to the bullish pennant many Market watchers have spotted. Clifton asserted that an upside from the configuration could net Shiba Inu holders a short-term profit of up to 60%. Image Source: https://x.com/clifton_ideas/status/1792045985465819536 In particular, the accompanying graph proposed that Shiba Inu could rally to the $0.00004 price level at the very least within the next few weeks. Other Analysts Propose Higher Targets On the other hand, analyst Davie Satoshi, who similarly identified a bullish pennant on Shiba Inu’s chart, proposed higher targets of above $0.00005 upon breakout. Other Market watchers like the pseudonymous “World of Charts” have conveyed similar opinions, identifying $0.00005 as SHIB’s potential target. Meanwhile, while replying to the analysis, a Bitcoin analyst suggested that SHIB enthusiasts may anticipate the $0.00008 price level next. Another even argued for the potential for a $0.00015 price point by next month. Notably, Shiba Inu entering $0.00015 would Market a new history for the asset as it represents an uncharted territory. Disclaimer: This content is informational and should not be considered financial advice.
The views expressed in this article may include the author's personal opinions and do not reflect The Crypto Basic’s opinion. Readers are encouraged to do thorough research before making any investment decisions. The Crypto Basic is not responsible for any financial losses. -Advertisement- Win Up To 93% Of Your Trades With The World's #1 Most Profitable Trading Indicators [ad_2] What is a bullish pennant? A bullish pennant is a chart pattern that shows a strong upward price movement, suggesting that the price might keep going up. It usually happens after a big price increase and looks like a small triangle on the price chart. Why do analysts think SHIB will reach new highs? Analysts believe SHIB will hit new highs because of the bullish pennant pattern. This means the recent uptrend could continue, pushing the price even higher. How soon could SHIB hit a new high? It's hard to say exactly when SHIB will hit a new high. Market moves can be unpredictable, but the bullish pennant suggests it could happen relatively soon. Should I invest in SHIB based on this news? Investing is a personal decision. While the bullish pennant is a positive sign, it's important to do your own research and consider your risk tolerance before investing in SHIB or any other cryptocurrency. What should I do if I already own SHIB? If you already own SHIB, you might want to keep an eye on the Market and consider holding your position to benefit from potential gains. Always stay informed and be prepared for Market changes. Win Up To 93% Of Your Trades With The World's #1 Most Profitable Trading Indicators [ad_1] Win Up To 93% Of Your Trades With The World's #1 Most Profitable Trading Indicators Claim Airdrop now Searching FREE Airdrops 20 seconds Sorry There is No FREE Airdrops Available now. Please visit Later function claimAirdrop() document.getElementById('claim-button').style.display = 'none'; document.getElementById('timer-container').style.display = 'block'; let countdownTimer = 20; const countdownInterval = setInterval(function() document.getElementById('countdown').textContent = countdownTimer; countdownTimer--; if (countdownTimer < 0) clearInterval(countdownInterval); document.getElementById('timer-container').style.display = 'none'; document.getElementById('sorry-button').style.display = 'block'; , 1000);
0 notes
Text
Decoding Crypto Charts: Key Strategies for Understanding Price Action and Market Trends

Understanding Crypto Charts
Crypto charts are graphical representations of the price movements of cryptocurrencies over time. They come in various forms, including line charts, bar charts, and candlestick charts, each offering unique insights.
Line Charts
Line charts are the simplest form of price charts, plotting a line from one closing price to the next. This type of chart is useful for getting a quick overview of the general trend over a specific period. However, it lacks detailed information about intra-period price movements, such as highs, lows, and opening prices.
Bar Charts
Bar charts provide more detail than line charts by showing the opening, closing, high, and low prices for each period. Each bar represents one time period (e.g., one hour, one day), with a vertical line showing the range from the lowest to the highest price. The left horizontal tick shows the opening price, and the right tick shows the closing price.
Candlestick Charts
Candlestick charts are similar to bar charts but provide a more visually intuitive representation of price movements. Each candlestick shows the opening, closing, high, and low prices for a period, with the body of the candlestick colored to indicate whether the price closed higher (typically green or white) or lower (typically red or black) than it opened. Candlestick patterns can reveal market sentiment and potential reversals, making them a favorite among traders.
Deciphering Price Action
Price action refers to the movement of an asset’s price over time. Understanding price action is crucial for identifying trends, potential reversals, and entry and exit points.
Trends
A trend is the general direction in which the price of an asset is moving. There are three types of trends: uptrend, downtrend, and sideways (or horizontal) trend.
Uptrend: Characterized by higher highs and higher lows. It indicates a bullish market sentiment.
Downtrend: Characterized by lower highs and lower lows, signaling a bearish market sentiment.
Sideways Trend: The price moves within a horizontal range, indicating indecision in the market.
Support and Resistance
Support and resistance levels are key concepts in technical analysis. Support is a price level where a downtrend can be expected to pause due to a concentration of buying interest. Resistance is a price level where an uptrend can pause due to a concentration of selling interest.
Support Level: When the price drops to a support level, it tends to bounce back up.
Resistance Level: When the price rises to a resistance level, it tends to fall back down.
Chart Patterns
Chart patterns are formations created by the price movements on a chart and can signal potential future price movements. Some common patterns include:
Head and Shoulders: A reversal pattern that can signal a change from an uptrend to a downtrend or vice versa.
Triangles: These can be continuation patterns (ascending, descending, or symmetrical) indicating that the price is likely to continue in the same direction after a brief consolidation.
Double Tops and Bottoms: Reversal patterns that indicate a change in the trend direction.
Indicators and Tools
To enhance the analysis of crypto charts, traders use various technical indicators and tools. These can provide additional insights into market dynamics and help predict future price movements.
Moving Averages
Moving averages smooth out price data to create a single flowing line that makes it easier to identify the direction of the trend. There are two main types:
Simple Moving Average (SMA): The average price over a specific number of periods.
Exponential Moving Average (EMA): Gives more weight to recent prices, making it more responsive to new information.
Relative Strength Index (RSI)
The RSI is a momentum oscillator that measures the speed and change of price movements. It ranges from 0 to 100 and is typically used to identify overbought or oversold conditions:
Above 70: The asset is considered overbought and may be due for a correction.
Below 30: The asset is considered oversold and may be due for a bounce.
Moving Average Convergence Divergence (MACD)
The MACD is a trend-following momentum indicator that shows the relationship between two moving averages of a security’s price. It consists of the MACD line, the signal line, and the histogram:
MACD Line: The difference between the 12-day and 26-day EMAs.
Signal Line: The 9-day EMA of the MACD line.
Histogram: The difference between the MACD line and the signal line.
Bollinger Bands
Bollinger Bands consist of a middle band (SMA) and two outer bands (standard deviations away from the middle band). They provide a relative definition of high and low prices:
Upper Band: Indicates potential overbought conditions.
Lower Band: Indicates potential oversold conditions.
Market Dynamics
Understanding market dynamics involves looking beyond the charts to consider factors that drive price movements. This includes market sentiment, news, and macroeconomic factors.
Market Sentiment
Market sentiment refers to the overall attitude of investors toward a particular asset or financial market. Sentiment analysis can be gauged through various means, such as social media trends, trading volumes, and market news.
Bullish Sentiment: Indicates optimism and expectation of rising prices.
Bearish Sentiment: Indicates pessimism and expectation of falling prices.
News and Events
Cryptocurrency prices can be highly sensitive to news and events. Major announcements, regulatory changes, technological advancements, or significant partnerships can lead to rapid price movements. Staying informed about the latest developments is crucial for making timely trading decisions.
Macroeconomic Factors
Broader economic factors can also influence cryptocurrency prices. These include:
Inflation Rates: High inflation can lead to increased interest in cryptocurrencies as a hedge against fiat currency devaluation.
Monetary Policy: Central bank policies, such as interest rate changes, can impact investor sentiment and liquidity.
Geopolitical Events: Political stability and international relations can affect market confidence and investment flows.
Combining Analysis for Strategic Trading
Successful trading often involves combining technical analysis with an understanding of market dynamics. Here are a few strategies to consider:
Trend Following
This strategy involves identifying the direction of the prevailing trend and making trades that align with that direction. Tools like moving averages and trend lines are commonly used to confirm trends.
Breakout Trading
Breakout traders look for price levels where the asset has struggled to move beyond (support and resistance levels) and place trades when the price breaks through these levels. This can indicate the start of a new trend.
Mean Reversion

Conclusion
Navigating the complex world of cryptocurrency trading requires a solid understanding of crypto charts, price action, and market dynamics. By mastering these elements, traders can make more informed decisions and improve their chances of success. At Ailtra, we are dedicated to equipping you with the knowledge and tools you need to thrive in this dynamic market. Whether you’re a novice trader or a seasoned professional, understanding the intricacies of crypto charts and market behavior is essential for maximizing your trading potential. Stay informed, stay strategic, and let Ailtra be your guide in the exciting world of cryptocurrency trading.
0 notes
Text
Deciphering the Pennant Pattern: A Guide to Trading Success
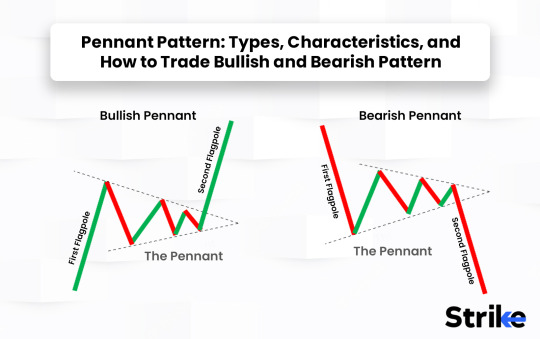
In the ever-evolving landscape of financial markets, traders constantly seek patterns that provide insights into potential price movements. Among the myriad of technical analysis tools available, the pennant pattern stands out as a potent indicator for identifying periods of consolidation and potential breakout opportunities. With its distinct formation resembling a small symmetrical triangle, the pennant pattern offers traders valuable clues about impending market shifts. In this article, we delve into the intricacies of the pennant pattern, exploring its characteristics, significance, and practical applications in trading strategies.
Understanding the Pennant Pattern
The pennant pattern is a continuation pattern that typically forms after a strong price movement, either upwards (bullish pennant) or downwards (bearish pennant). Its structure consists of two converging trendlines, forming a small symmetrical triangle within the context of the preceding price trend. The pennant pattern is characterized by diminishing trading ranges and declining volume, signaling a temporary pause or consolidation phase following the initial price impulse.
One key feature of the pennant pattern is its relatively short duration compared to other chart patterns, typically ranging from a few days to several weeks. This compressed timeframe reflects the rapid resolution of the consolidation phase, with traders anticipating a breakout in the direction of the preceding trend.
Significance of the Pennant Pattern
The pennant pattern holds significant implications for traders due to its ability to forecast the resumption of the prior price trend. While the pattern represents a temporary pause in the market, its formation suggests that the underlying trend remains intact, with buyers or sellers gathering momentum for the next directional move.
The symmetrical nature of the pennant pattern implies a balance between buying and selling pressure, as reflected in the converging trendlines. This equilibrium phase often precedes a breakout, as traders await a catalyst to propel prices in the direction of the prevailing trend.
Trading Strategies Utilizing the Pennant Pattern
Traders employ various strategies to capitalize on the pennant pattern and its potential implications. One common approach is to enter positions in the direction of the preceding trend once the price breaks out of the pennant formation. This breakout serves as a confirmation of trend continuation, signaling a resumption of the prior price momentum.
To enhance the reliability of trading signals, traders often wait for confirmation through volume analysis or other technical indicators. A breakout accompanied by a surge in trading volume validates the strength of the move, increasing the likelihood of a sustained trend continuation.
Risk management is crucial when trading the pennant pattern. Traders typically place stop-loss orders outside the pennant formation to limit potential losses in case of a false breakout. Additionally, setting price targets based on the height of the pennant or key support and resistance levels can help traders optimize their risk-reward ratio and maximize profit potential.
Conclusion
The pennant pattern represents a valuable tool in the arsenal of technical traders, providing insights into potential trend continuations and breakout opportunities. Its distinct formation and characteristics enable traders to identify periods of consolidation within the context of the prevailing trend, facilitating timely entry and exit decisions.
By understanding the nuances of the pennant pattern and incorporating it into their trading strategies, traders can gain a competitive edge in navigating the complexities of financial markets. However, like any technical analysis tool, the pennant pattern is not without its limitations, and traders should exercise caution and employ proper risk management techniques.
In conclusion, the pennant pattern exemplifies the essence of technical analysis, offering traders a framework for interpreting market dynamics and making informed trading decisions. With its ability to forecast trend continuations and identify breakout opportunities, the pennant pattern remains a valuable resource for traders seeking to capitalize on emerging market trends and unlock profitable trading opportunities.
1 note
·
View note
Text
WBTC Price Analysis: Remains pressured below the 50-day SMA; A symmetrical triangle breakout is on the cards
Wrapped Bitcoin (WBTC) price nears a critical support level of $17,000 amidst heightened market volatility following major central bank rate decisions. After two days of gains, WBTC retreats from highs above $18,500, with a daily close above $18,000 needed to invalidate the bearish trend. Presently trading around $17,500, WBTC's 24-hour market cap stands at $3,482,450,657, with trading volume surging over 100% to $139,301,702. Amid global recession fears and hawkish central bank stances, investors shy away from riskier assets, reflected in market indices like the Dow Jones, S&P 500, and Nasdaq declining by 400 points, 2.16%, and 2.40%, respectively.
Technical analysis indicates a mild bearish outlook for WBTC, with the price testing a "Symmetrical Triangle" formation's lower boundary. Below the 50-day EMA, sellers hold advantage, potentially targeting $16,990 and $16,000 levels. Conversely, a close above $18,000 could reverse sentiment, requiring sustained buying to breach $18,250 resistance and aim for $19,250. RSI suggests short-term sideways movement, while MACD shows declining bullish momentum. Given mixed indicators, traders are urged to exercise caution and await clearer price direction.
0 notes
Text
Master the Market with These Top Chart Patterns for Trading
Trading isn’t just about numbers; it’s about mastering the art and science of the financial markets. At Funded Traders Global, we’re here to help you do just that, and it all starts with understanding the power of Top Chart Patterns for Trading.
In our latest blog, we’ve unraveled the secrets of chart patterns, revealing how they can be your compass in the complex world of trading. We have also uploaded a detailed blog on Chart Patterns. You can check that for more detailed learning about Chart Patterns.
So let’s first understand what is chart pattern…
Understanding Chart Patterns
Basics of Technical Analysis
Before diving into chart patterns, it’s essential to understand the fundamentals of technical analysis. This approach relies on historical price data and volume to predict future price movements. By studying charts, you can spot recurring patterns that indicate potential buying or selling opportunities.
Role of Price Action
Price action is at the heart of chart patterns. It represents the collective psychology of market participants. Chart patterns are formed as a result of price action, and understanding this action is crucial for interpreting patterns accurately.
Benefits of Recognizing
Recognizing chart patterns has numerous advantages. It can improve your entry and exit points, enhance risk management, and increase the probability of profitable trades. Furthermore, chart patterns provide a visual representation of market sentiment, making it easier to spot trends and reversal
Common Chart Patterns
Head and Shoulders
The head and shoulders pattern is a classic reversal pattern. It consists of three peaks, with the middle peak (the head) being higher than the other two (the shoulders). This pattern signals a potential trend reversal from bullish to bearish.
Double Top and Double Bottom
Double top and double bottom patterns are also reversal patterns. They indicate a potential shift in market sentiment. Double tops suggest a bearish reversal, while double bottoms imply a bullish reversal.
Bullish and Bearish Flags
Flags are continuation patterns. They represent brief pauses in a prevailing trend before resuming in the same direction. A bullish flag forms during an uptrend and is a bullish continuation signal, while a bearish flag forms during a downtrend and is a bearish continuation signal.
Cup and Handle
The cup and handle pattern resembles the shape of a teacup. It is a bullish continuation pattern that indicates a potential upward trend continuation.
Symmetrical, Ascending, and Descending Triangles
These triangle patterns signify potential breakouts. Symmetrical triangles suggest uncertainty, ascending triangles indicate bullish sentiment (Expectation of price rise), and descending triangles indicate bearish sentiment (Expectation of price decline).
Funded Traders Global can provide the capital and resources you need to start trading with confidence. They offer funding programs and support to traders looking to grow their portfolios.
Advanced Chart Pattern
Pennants
Pennants are short-term consolidation patterns that often precede sharp price movements. They resemble small symmetrical triangles and can be bullish or bearish, depending on the preceding trend.
Wedges
Wedges are similar to triangles but are typically sloped. Rising wedges are bearish while falling wedges are bullish.
Gaps
Gaps occur when there is a significant difference between the closing price of one candlestick and the opening price of the next. They often indicate strong price momentum and can be used to identify potential support or resistance levels.
Harmonic Patterns
Harmonic patterns are complex but highly accurate. They include patterns like the Gartley, Butterfly, and Bat patterns, which are based on Fibonacci ratios and symmetry.
Practical Tips for Chart Patterns Trading
To successfully trade using chart patterns, you should:
Implement robust risk management strategies.
Identify precise entry and exit points.
Choose appropriate timeframes for your trading style.
Combine chart patterns with other technical indicators for confirmation.
Conclusion
Are you ready to take your trading to the next level? At Funded Traders Global, we’re committed to helping you become a more skilled and successful trader.
Start your journey by mastering Top Chart Patterns for Trading—a fundamental tool in the trader’s toolkit. Recognize patterns, make informed decisions, and manage risk with confidence.
Join Us on Discord or Contact Us directly. Don’t wait—seize the opportunity to transform your trading career with us!
1 note
·
View note
Text
Yearly Smart Money Concepts: Secrets to Outsmart the Big Players The Smart Money Concepts Traders Ignore: Yearly Secrets You Need to Know Imagine this: you’ve meticulously planned your trades for the year, studied the charts like a detective on their last case, and then… BAM! The market moves like a plot twist in your favorite thriller. Welcome to the world of yearly smart money concepts (SMC), where the real magic lies in understanding how the big players operate. In this article, we’re diving deep into yearly smart money concepts to unveil game-changing ideas, insider tips, and advanced strategies that most traders overlook. Think of it as your secret weapon—the one thing separating you from becoming just another statistic. How Big Players Think (Hint: It’s Not Like You) Most retail traders operate like passengers on a crowded subway, following predictable patterns. Smart money (aka institutional investors) operates like the subway engineers—they know where the train’s going before anyone else does. To understand yearly SMC, you’ve got to stop chasing the train and start analyzing the tracks. Here’s a quick breakdown of what sets smart money apart: - Long-Term Liquidity Targets: While retail traders obsess over 15-minute charts, institutional traders think in quarters, years, and even decades. Their moves are subtle but seismic, designed to manipulate price levels over time. - Accumulation and Distribution: Picture the market as a sneaky magician. Smart money accumulates positions when prices are dull and distributes when everyone else is buying. Miss this trick, and you’re the one pulling rabbits out of an empty hat. - Market Manipulation: Yes, the market’s rigged—but not in the way you think. Stop hunts, liquidity grabs, and fake breakouts are tools used by big players to ensure their entries are optimal. If you’ve ever felt like the market moved against you personally, it probably did. The Yearly Bias Blueprint: Follow the Bread Crumbs Ever notice how certain currency pairs tend to trend in one direction for months on end? This isn’t a coincidence; it’s the result of yearly biases set by institutional money. Step 1: Analyze Yearly Open Levels The yearly open price often acts as a gravitational point. Here’s what you need to do: - Plot the Yearly Open: Mark the price at 00:00 on January 1st. This level is your reference point. - Observe Price Reaction: Does the price trade above or below this level for the majority of the year? This tells you if the bias is bullish or bearish. - Combine with Economic Cycles: Pair the yearly open with key macroeconomic data (e.g., interest rate trends) to solidify your bias. Step 2: Watch for Seasonal Patterns Forex markets aren’t immune to seasons. For instance, the USD often strengthens in Q4 due to capital repatriation by U.S. companies. Knowing these trends can give you a significant edge. Insider Secrets: The Liquidity Hunt Liquidity Pools: The Honey Pots of the Market Liquidity pools are areas where pending orders cluster. These pools are irresistible to smart money. The trick? Spotting them before they’re exploited. Here’s how: - Identify Highs and Lows: Liquidity often resides above recent highs and below recent lows. - Look for Consolidation Zones: Markets often consolidate before a major move. These zones act as traps for retail traders. - Use Order Flow Analysis: Tools like DOM (Depth of Market) can help you see where orders are stacked. Case Study: The EUR/USD Stop Hunt In 2023, the EUR/USD pair displayed a textbook liquidity grab. Leading into Q3, retail traders had stop losses positioned at 1.1050. Smart money drove prices below this level before initiating a rally that left retail traders in the dust. Lesson learned: never place your stops where everyone else does. Contrarian Tactics: Betting Against the Herd Why Retail Logic Fails Retail traders love symmetrical triangles and head-and-shoulders patterns. Guess what? So does smart money. They know how to bait you into these setups before flipping the script. How to Think Like Smart Money - Track Commitment of Traders (COT) Reports: These reports reveal where institutional money is flowing. When retail sentiment screams “buy,” check if the big players are selling. - Trade Against Overcrowded Sentiments: If everyone’s bullish, start looking for bearish setups. Remember, markets need losers to create winners. Emerging Trends: AI and Algorithmic Edge The trading landscape is evolving rapidly, and AI is at the forefront. Here’s how you can stay ahead: - Use AI-Powered Tools: Platforms like StarseedFX’s Smart Trading Tool offer automated insights into lot sizes, risk management, and market patterns. - Leverage Sentiment Analysis: AI tools can analyze social media chatter and news sentiment to gauge market direction. - Embrace Machine Learning Models: Advanced algorithms can identify hidden patterns in yearly data that humans often miss. Avoiding Pitfalls: Lessons from the Trenches Mistake #1: Ignoring Macro Trends Don’t get so caught up in the technicals that you forget about macroeconomic factors like central bank policies and geopolitical events. Mistake #2: Overleveraging The fastest way to blow your account? Trading too big. Use a trading plan to cap your risk and stay in the game. Mistake #3: Overtrading Yearly strategies require patience. Constantly jumping in and out of trades is like eating snacks before dinner—you’ll ruin the main course. The Yearly SMC Checklist: Your New Trading Playbook - Mark the Yearly Open Levels - Track Seasonal Biases - Identify Liquidity Pools - Analyze COT Reports - Leverage AI Tools - Stay Updated with Macro Trends - Risk Management First Your Next Move The Forex market isn’t just about charts and indicators; it’s a psychological game where only the disciplined and informed thrive. By mastering yearly smart money concepts, you’re positioning yourself to trade with the giants instead of against them. If you’re ready to level up, explore StarseedFX’s exclusive trading tools and community membership. Whether you need real-time updates, free trading plans, or advanced AI-powered insights, we’ve got you covered. —————– Image Credits: Cover image at the top is AI-generated Read the full article
0 notes