#APM Monitoring Tool
Explore tagged Tumblr posts
Visit Tumblr Blog
Explore Tumblr blogs with no restrictions, modern design and the best experience.
Last Seen Tumblr Blogs


Fun Fact
Tumblr has 16.74 million mobile monthly users in the US.
Text

NAVIGATING PROJECT MANAGEMENT IN THE AEC INDUSTRY
Navigating Project Management in the AEC industry involves a series of interconnected tasks that require effective planning, execution, monitoring, and control. By following best practices and leveraging project management methodologies such as APM, SCRUM, KANBAN, or the Traditional WATERFALL Project Management Methodology, the AEC professionals can successfully deliver complex projects while meeting stakeholder expectations and achieving project objectives.
As an architectural manager with a Master of Architecture degree and an architectural engineering degree from reputable institutes, having experience in project and design management for large-scale commercial facilities, multi-story offices, and high-rise administration buildings, I can provide the necessary artifacts to enhance project success, improve team collaboration, and effectively handle project complexities in the architecture, engineering, and construction (AEC) sector.
1. Set Clear Goals and Objectives:
Define project scope, including deliverables and constraints.
Establish SMART (Specific, Measurable, Achievable, Relevant, Time-bound) goals.
Align goals with stakeholder expectations and project requirements.
Obtain buy-in from key stakeholders on project objectives.
2. Develop a Comprehensive Project Plan:
Create a detailed work breakdown structure (WBS) to organize project tasks.
Define project milestones and dependencies.
Develop a project schedule with timelines and resource allocation.
Identify risks and develop a risk management plan.
Establish a budget and financial plan for the project.
3. Foster Effective Communication:
Establish communication channels and protocols for project team members.
Hold regular project meetings to discuss progress, issues, and updates.
Use clear and concise language in all communications.
Encourage open and transparent communication among team members.
Address communication barriers and conflicts promptly.
4. Embrace Technology and Communication:
Utilize project management software for task tracking and collaboration.
Implement communication tools such as emails, instant messaging, and video conferencing.
Leverage cloud-based platforms for document sharing and version control.
Provide training and support for team members on project management tools.
Stay updated on new technologies and tools to improve project efficiency.
5. Manage Change Effectively:
Establish a change control process to evaluate and approve changes to project scope.
Communicate changes to stakeholders and assess their impact on project objectives.
Update project documentation and plans to reflect approved changes.
Monitor changes to prevent scope creep and ensure project alignment with goals.
Evaluate the risks and benefits of proposed changes before implementation.
6. Foster Collaboration and Teamwork:
Encourage team members to share ideas, feedback, and best practices.
Foster a collaborative work environment that values diversity and inclusivity.
Promote team building activities and recognize team achievements.
Facilitate cross-functional collaboration and knowledge sharing.
Resolve conflicts and promote a positive team culture.
7. Continuously Monitor and Evaluate Progress:
Track project performance against key performance indicators (KPIs).
Conduct regular project reviews to assess progress and identify areas for improvement.
Monitor project risks and issues and take corrective actions as needed.
Evaluate project outcomes against initial goals and objectives.
Use lessons learned to make informed decisions and optimize project performance.
By focusing on these subtasks within each point, project managers can enhance project success, improve team collaboration, and effectively manage project complexities in the Architecture, Engineering, and Construction (AEC) industry.
Sonetra KETH (កេត សុនេត្រា) •Architectural Manager, Project Manager, BIM Director •建築師經理, 專案經理, BIM總監 •Giám đốc kiến trúc, Giám đốc dựán, Giám đốc BIM •RMIT University Vietnam + Institute of Technology of Cambodia
#Pinned#Avatar#sonetra-keth#Badge image.#Nov 1#2023#Sonetra KETH#Architectural Manager#Project Manager#BIM Director#Thought Leadership#Design Management#Project Management#BIM Management#建筑���经理、专案经理、BIM总监#Giám đốc Kiến Trúc#Giám đốc Dựán#Giám đốc BIM#<meta name=“google-adsense-account” content=“ca-pub-9430617320114361”>#Sonetra Keth#blueprint#Inspired Urban Planning#Urban Planning Framework#crossorigin=“anonymous”></script>#កេត សុនេត្រា#នេត្រា#NETRA#netra#n8tra#N8TRA
5 notes
·
View notes
Text
Link: telex.im
Competitor analysis between telex (hypothetical instrument) and other similar tool
Using New relics in Monitoring and Observability: New Relic offers a comprehensive suite of monitoring and observability tools covering a wide range of areas, including APM, infrastructure monitoring, and log management. In contrast, Telex's capabilities may be more focused on specific domains or have a different approach to data organization and presentation. New Relic relies on extensive agent-based instrumentation to collect detailed performance data, while Telex may use a mix of agent-based and agentless methods. Telex have the advantage of providing many other benefit aside monitoring and it is user-driven interface
And also in comparison with which is just a webdriver used for testing and offer the user that ability to know how to code before using it. But Telex offers the webtesting service prior knowledge of coding and it is effective across all apps and websites. Datadog provides extensive customization options for alerting rules, in contrast to Telex's potentially more streamlined approach. Datadog also has a broader ecosystem of integrations compared to Telex's more focused integration capabilities.Datadog provides extensive customization options for alerting rules, in contrast to Telex's potentially more streamlined approach. Datadog also has a broader ecosystem of integrations compared to Telex's more focused integration capabilities.
And Telex has the advantage of getting many other capabilities aside from cloud monitoring.
With a third-party app for users to navigate to use at their own convenience. So telex have the ability to be world if it increase its marketing strategies and has a user interface to make it user-driven, then I can say it is a world call
2 notes
·
View notes
Text
How-To IT
Topic: Core areas of IT
1. Hardware
• Computers (Desktops, Laptops, Workstations)
• Servers and Data Centers
• Networking Devices (Routers, Switches, Modems)
• Storage Devices (HDDs, SSDs, NAS)
• Peripheral Devices (Printers, Scanners, Monitors)
2. Software
• Operating Systems (Windows, Linux, macOS)
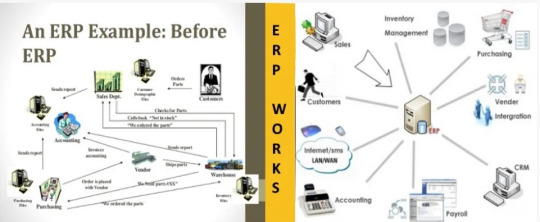
• Application Software (Office Suites, ERP, CRM)
• Development Software (IDEs, Code Libraries, APIs)
• Middleware (Integration Tools)
• Security Software (Antivirus, Firewalls, SIEM)
3. Networking and Telecommunications
• LAN/WAN Infrastructure
• Wireless Networking (Wi-Fi, 5G)
• VPNs (Virtual Private Networks)
• Communication Systems (VoIP, Email Servers)
• Internet Services
4. Data Management
• Databases (SQL, NoSQL)
• Data Warehousing
• Big Data Technologies (Hadoop, Spark)
• Backup and Recovery Systems
• Data Integration Tools
5. Cybersecurity
• Network Security
• Endpoint Protection
• Identity and Access Management (IAM)
• Threat Detection and Incident Response
• Encryption and Data Privacy
6. Software Development
• Front-End Development (UI/UX Design)
• Back-End Development
• DevOps and CI/CD Pipelines
• Mobile App Development
• Cloud-Native Development
7. Cloud Computing
• Infrastructure as a Service (IaaS)
• Platform as a Service (PaaS)
• Software as a Service (SaaS)
• Serverless Computing
• Cloud Storage and Management
8. IT Support and Services
• Help Desk Support
• IT Service Management (ITSM)
• System Administration
• Hardware and Software Troubleshooting
• End-User Training
9. Artificial Intelligence and Machine Learning
• AI Algorithms and Frameworks
• Natural Language Processing (NLP)
• Computer Vision
• Robotics
• Predictive Analytics
10. Business Intelligence and Analytics
• Reporting Tools (Tableau, Power BI)
• Data Visualization
• Business Analytics Platforms
• Predictive Modeling
11. Internet of Things (IoT)
• IoT Devices and Sensors
• IoT Platforms
• Edge Computing
• Smart Systems (Homes, Cities, Vehicles)
12. Enterprise Systems
• Enterprise Resource Planning (ERP)
• Customer Relationship Management (CRM)
• Human Resource Management Systems (HRMS)
• Supply Chain Management Systems
13. IT Governance and Compliance
• ITIL (Information Technology Infrastructure Library)
• COBIT (Control Objectives for Information Technologies)
• ISO/IEC Standards
• Regulatory Compliance (GDPR, HIPAA, SOX)
14. Emerging Technologies
• Blockchain
• Quantum Computing
• Augmented Reality (AR) and Virtual Reality (VR)
• 3D Printing
• Digital Twins
15. IT Project Management
• Agile, Scrum, and Kanban
• Waterfall Methodology
• Resource Allocation
• Risk Management
16. IT Infrastructure
• Data Centers
• Virtualization (VMware, Hyper-V)
• Disaster Recovery Planning
• Load Balancing
17. IT Education and Certifications
• Vendor Certifications (Microsoft, Cisco, AWS)
• Training and Development Programs
• Online Learning Platforms
18. IT Operations and Monitoring
• Performance Monitoring (APM, Network Monitoring)
• IT Asset Management
• Event and Incident Management
19. Software Testing
• Manual Testing: Human testers evaluate software by executing test cases without using automation tools.
• Automated Testing: Use of testing tools (e.g., Selenium, JUnit) to run automated scripts and check software behavior.
• Functional Testing: Validating that the software performs its intended functions.
• Non-Functional Testing: Assessing non-functional aspects such as performance, usability, and security.
• Unit Testing: Testing individual components or units of code for correctness.
• Integration Testing: Ensuring that different modules or systems work together as expected.
• System Testing: Verifying the complete software system’s behavior against requirements.
• Acceptance Testing: Conducting tests to confirm that the software meets business requirements (including UAT - User Acceptance Testing).
• Regression Testing: Ensuring that new changes or features do not negatively affect existing functionalities.
• Performance Testing: Testing software performance under various conditions (load, stress, scalability).
• Security Testing: Identifying vulnerabilities and assessing the software’s ability to protect data.
• Compatibility Testing: Ensuring the software works on different operating systems, browsers, or devices.
• Continuous Testing: Integrating testing into the development lifecycle to provide quick feedback and minimize bugs.
• Test Automation Frameworks: Tools and structures used to automate testing processes (e.g., TestNG, Appium).
19. VoIP (Voice over IP)
VoIP Protocols & Standards
• SIP (Session Initiation Protocol)
• H.323
• RTP (Real-Time Transport Protocol)
• MGCP (Media Gateway Control Protocol)
VoIP Hardware
• IP Phones (Desk Phones, Mobile Clients)
• VoIP Gateways
• Analog Telephone Adapters (ATAs)
• VoIP Servers
• Network Switches/ Routers for VoIP
VoIP Software
• Softphones (e.g., Zoiper, X-Lite)
• PBX (Private Branch Exchange) Systems
• VoIP Management Software
• Call Center Solutions (e.g., Asterisk, 3CX)
VoIP Network Infrastructure
• Quality of Service (QoS) Configuration
• VPNs (Virtual Private Networks) for VoIP
• VoIP Traffic Shaping & Bandwidth Management
• Firewall and Security Configurations for VoIP
• Network Monitoring & Optimization Tools
VoIP Security
• Encryption (SRTP, TLS)
• Authentication and Authorization
• Firewall & Intrusion Detection Systems
• VoIP Fraud DetectionVoIP Providers
• Hosted VoIP Services (e.g., RingCentral, Vonage)
• SIP Trunking Providers
• PBX Hosting & Managed Services
VoIP Quality and Testing
• Call Quality Monitoring
• Latency, Jitter, and Packet Loss Testing
• VoIP Performance Metrics and Reporting Tools
• User Acceptance Testing (UAT) for VoIP Systems
Integration with Other Systems
• CRM Integration (e.g., Salesforce with VoIP)
• Unified Communications (UC) Solutions
• Contact Center Integration
• Email, Chat, and Video Communication Integration
2 notes
·
View notes
Text
Advanced Tips and Tricks for Global Market Trading

Trading in the global market can be both exciting and profitable if you employ the right strategies. Whether you're dealing with Forex, commodities, or other investments, these advanced tips will set you up for success.
Master Technical Analysis: Technical analysis is crucial for predicting market movements. Learn to read charts and use indicators like the Relative Strength Index (RSI) and Moving Average Convergence Divergence (MACD). These tools help you identify trends and make informed trading decisions.
Choose the Best Trading Platform: Selecting the right trading platform is essential. Look for platforms that offer real-time data, analytical tools, and a user-friendly interface. Good platforms also provide educational resources and excellent customer support.
Diversify Your Investments: Diversification reduces risk. Spread your investments across different asset classes like Forex, commodities, and stocks. This approach ensures that your portfolio is protected from market volatility.
Stay Updated with Market News: Keeping up with global news, economic events, and market trends is vital. Regularly read financial news and reports. Use economic calendars to track important events that might impact your trades.
Implement Risk Management Strategies: Effective risk management is key to long-term success. Use stop-loss orders to limit potential losses and ensure no single trade can hurt your portfolio too much. This way, you can trade with confidence.
Follow Expert Insights: Industry experts and analysts provide valuable insights. Platforms like TradingView and social media channels can offer advanced strategies and techniques. Learning from these experts can enhance your trading approach.
Use Automated Trading Systems: Automated trading systems can execute trades based on pre-set criteria, helping you take advantage of market opportunities without constant monitoring. Understand the algorithms and monitor their performance regularly.
Focus on Continuous Learning: The trading world is always changing. Participate in webinars, attend workshops, and take online courses to stay updated with the latest strategies and trends. Continuous learning helps you stay ahead.
Monitor Your Performance: Regularly review your trades and performance. Keep a trading journal to track your decisions, outcomes, and lessons learned. This practice helps you improve your strategies and avoid repeating mistakes.
Partner with Reliable Brokers: Choosing a reliable broker is crucial. Look for brokers with competitive spreads, low fees, and robust security measures. A good broker provides the tools and support you need for successful trading.
Trust APM for more expert insights and trading solutions.
5 notes
·
View notes
Text
Performance Optimization Tips for Your ERP System
Imagine your ERP system as the central nervous system of your business—connecting finance, inventory, HR, supply chain, and more. When it runs smoothly, decision-making is faster, teams stay aligned, and growth feels effortless. But as your company scales, even the best ERP can slow down without the right care.
At KSoft Technologies, we’re a trusted custom software development services provider offering custom CRM development company expertise, ecommerce and custom development, and complete ERP solutions. From design to cloud-based deployment to performance tuning, we help U.S. businesses keep their systems sharp and future-ready.
Let’s dive into practical tips that will keep your ERP system running at peak efficiency.
1️⃣ Audit Your ERP System Regularly
Your ERP might be carrying old baggage—unused modules, outdated integrations, or redundant data. These slow your system down.
Schedule ERP health checks twice a year.
Remove unused modules and unnecessary customizations.
Monitor server storage and capacity closely.
2️⃣ Optimize Your Database
Your ERP’s database is its engine. If it’s cluttered, expect sluggish performance.
Index frequently used tables for faster queries.
Archive historical data to reduce load.
Run maintenance tasks like re-indexing and log cleanup.
3️⃣ Streamline User Roles and Access
Excessive permissions slow things down and add security risks.
Review and clean up user roles often.
Follow the “least privilege” rule—users get only the access they need.
4️⃣ Modernize Your Infrastructure
ERP speed depends on the backbone supporting it.
Upgrade servers or scale up cloud resources as your business grows.
Add load balancing and redundancy for better uptime.
Ensure sufficient bandwidth for remote teams and mobile users.
At KSoft Technologies, we build scalable systems as part of our custom software development services so your ERP stays future-proof.
5️⃣ Simplify Reports and Dashboards
Reports that nobody reads still sap resources.
Remove unused reports.
Consolidate where reports overlap.
Keep queries efficient and minimize complex calculations.
6️⃣ Keep ERP Software Up to Date
Outdated ERP versions miss out on fixes, performance boosts, and security patches.
Stay on top of vendor updates.
Test updates in a staging environment before deploying fully.
Don’t forget third-party add-ons!
7️⃣ Automate Workflows Where Possible
Manual steps drag down efficiency.
Map out and simplify workflows.
Automate approvals and routine tasks using your ERP’s built-in tools.
Use alerts to keep processes moving.
8️⃣ Invest in User Training
A well-trained team keeps your ERP running smoothly.
Offer regular training on best practices and new features.
Collect user feedback to spot hidden bottlenecks.
9️⃣ Implement Continuous Monitoring
Don’t wait for users to report issues—stay ahead.
Use ERP monitoring tools or external APM solutions.
Track server loads, error rates, and query times.
Respond quickly to alerts.
10️⃣ Design for Scalability
Your ERP should grow with you.
Choose solutions that scale easily—cloud or hybrid options.
Build customizations with tomorrow in mind.
Review infrastructure needs annually.
11️⃣ Strengthen Integrations
Your ERP doesn’t work alone—it talks to CRM, e-commerce, and more.
Audit and optimize integrations.
Remove outdated connections.
Use secure APIs and middleware for better data flow.
If you're investing in ecommerce website development, make sure your ERP and commerce tools integrate cleanly for speed and accuracy.
12️⃣ Plan for the Unexpected
Downtime hurts.
Keep backups current and test recovery processes regularly.
Build in failover capabilities.
Have a clear incident response plan.
🚀 Let KSoft Help You Optimize ERP Performance
At KSoft Technologies, we go beyond just ERP development. We’re a software development company USA businesses trust for:
Custom CRM development and ERP integration
Ecommerce and custom development
Scalable cloud ERP solutions
Ongoing performance tuning and optimization
Our team includes some of the best software developers USA, focused on delivering solutions that grow with your business.
👉 Ready to future-proof your ERP system? Contact KSoft Technologies today and let’s talk about what’s next for your business.
#ERPOptimization#CustomSoftwareDevelopment#ERPPerformance#SoftwareDevelopmentCompanyUSA#BestSoftwareDevelopersUSA#CustomCRMDevelopment#EcommerceDevelopment#CloudERP#MobileAppDevelopersUSA
0 notes
Text
What is APM and why does your business need it
In today’s constantly changing business environment, every business needs to optimise its assets to help achieve goals better. With the successful management of these assets, organisations can not only form viable objectives for their growth but also help monitor the health of vital company assets.
As a business leader, you need to know when and how your enterprise assets will fail to take immediate actions to reduce risk. For that, you need asset management insights. With the help of targeted AI and analytics and automation tools, Asset Performance Management (APM) software enhances your company's asset management insights.
Here's an in-depth guide to Asset Performance Management and why your business needs it.
What is APM?
Asset Performance Management or APM is a strategy or process that companies adopt to monitor and assess the assets required for the smooth running of the business. This process often includes industrial machinery, computers, network equipment, etc. APM also aids in determining the funding each asset requires to stay functional and perform at a specific level. Source Url
0 notes
Text
Customer Experience Monitoring Market: Is AI the Next Game-Changer in Global CX Monitoring
The Customer Experience Monitoring Market was valued at USD 2.45 billion in 2023 and is expected to reach USD 18.35 billion by 2032, growing at a CAGR of 25.11% from 2024-2032.
Customer Experience Monitoring Market is gaining strong traction as businesses prioritize real-time insights to enhance service delivery, user engagement, and digital interactions. With the rise in digital platforms and omnichannel experiences, enterprises across sectors are investing in tools that measure, analyze, and optimize customer journeys in real time.
U.S. Market Leading in AI-Powered CX Strategies and Multichannel Insights
Customer Experience Monitoring Market is transforming the way organizations understand consumer behavior by integrating AI, predictive analytics, and automation into their CX strategies. As customer expectations evolve rapidly, especially in highly competitive sectors like retail, BFSI, and telecom, companies are leveraging these solutions to identify friction points, improve satisfaction, and drive brand loyalty.
Get Sample Copy of This Report: https://www.snsinsider.com/sample-request/6664
Market Keyplayers:
RADCOM Ltd. [RADCOM Network Insights, RADCOM ACE]
Aternity, Inc. [Aternity Employee Experience, Aternity Mobile Experience]
Oracle Corporation [Oracle CX Cloud, Oracle Service Cloud]
RadioOpt GmbH [Network Signal Info, Network Quality App]
BMC Software, Inc. [BMC Helix Digital Workplace, BMC Helix AIOps]
Startek [Startek Interaction Analytics, Startek Speech Analytics]
CA Technologies, Inc. [CA Digital Experience Insights, CA Application Performance Management]
Comarch SA [Comarch Service Quality Management, Comarch Fault Management]
Riverbed Technology, Inc. [Aternity Real User Monitoring, Aternity Synthetic Monitoring]
Compuware Corporation [Compuware APM, Compuware Strobe]
CorrelSense, Inc. [SharePath Real User Monitoring, SharePath Transaction Tracking]
Cisco Systems, Inc. [Cisco ThousandEyes, Cisco AppDynamics]
Dynatrace LLC [Dynatrace Digital Experience Monitoring, Dynatrace Real User Monitoring]
New Relic, Inc. [New Relic Browser, New Relic Synthetics]
SAP SE [SAP Customer Experience, SAP Service Cloud]
Qualtrics International Inc. [Qualtrics CustomerXM, Qualtrics Experience iD]
Medallia, Inc. [Medallia Experience Cloud, Medallia Agent Connect]
NICE Ltd. [NICE Nexidia, NICE Enlighten AI]
IBM Corporation [IBM Tealeaf, IBM Customer Experience Analytics]
Zoho Corporation [Zoho Desk, Zoho CRM Plus]
Adobe Inc. [Adobe Experience Platform, Adobe Customer Journey Analytics]
Market Analysis
The Customer Experience Monitoring Market is being shaped by the growing demand for real-time customer feedback, performance tracking, and behavioral analytics. In the U.S., strong cloud adoption and digital-first business models are driving market growth, while European firms are pushing for seamless experiences backed by GDPR-compliant analytics platforms. The shift toward customer-centric business models is prompting companies to proactively monitor and act on customer experiences at every touchpoint, fueling demand for integrated platforms.
Market Trends
Rising integration of AI and machine learning in experience tracking
Surge in demand for real-time omnichannel monitoring solutions
Adoption of predictive analytics for proactive customer engagement
Increasing use of sentiment analysis and NLP tools
Growth in mobile and app-based customer feedback mechanisms
Emergence of CX dashboards with customizable KPIs
Demand for cloud-native platforms enabling scalability and agility
Market Scope
The scope of the Customer Experience Monitoring Market is expanding as enterprises shift from reactive feedback to proactive customer engagement. The need to capture insights across diverse digital and physical channels has made CX monitoring a strategic imperative.
Multi-touchpoint monitoring across web, app, call centers, and in-store
Real-time alerts for service disruptions or negative sentiment
Custom reporting aligned with key business objectives
CX analytics integrated with CRM and marketing stacks
Global platforms with localization and compliance features
Support for journey orchestration and feedback loop closure
Forecast Outlook
The Customer Experience Monitoring Market is poised for significant advancement as organizations seek actionable insights to differentiate their brand experience. Driven by advancements in AI, edge computing, and automation, the market is expected to see major innovations in how businesses collect and act on experience data. The U.S. will remain a frontrunner due to its tech maturity, while Europe will continue influencing growth through a focus on privacy and high-quality digital engagement.
Access Complete Report: https://www.snsinsider.com/reports/customer-experience-monitoring-market-6664
Conclusion
As customer expectations reach all-time highs, the Customer Experience Monitoring Market is emerging as a vital enabler of loyalty, retention, and competitive edge. Forward-thinking businesses in the U.S. and Europe are leveraging intelligent CX solutions not just to react—but to anticipate, personalize, and elevate every interaction. In this data-driven era, mastering customer experience is no longer optional—it's a strategic necessity.
About Us:
SNS Insider is one of the leading market research and consulting agencies that dominates the market research industry globally. Our company's aim is to give clients the knowledge they require in order to function in changing circumstances. In order to give you current, accurate market data, consumer insights, and opinions so that you can make decisions with confidence, we employ a variety of techniques, including surveys, video talks, and focus groups around the world.
Related Reports:
U.S.A Field Service Management Market shows robust adoption of automation and real-time tracking solutions
U.S.A drives growth in enterprise A2P SMS market amid surge in business messaging trends
Contact Us:
Jagney Dave - Vice President of Client Engagement
Phone: +1-315 636 4242 (US) | +44- 20 3290 5010 (UK)
Mail us: [email protected]
#Customer Experience Monitoring Market#Customer Experience Monitoring Market Growth#Customer Experience Monitoring Market Trends
0 notes
Text
Why Splunk Is the Go-To Platform for Enterprise Security and Observability
In today’s digital-first world, organizations generate and rely on vast volumes of machine data to run their operations, serve customers, and protect digital assets. As cyber threats grow in complexity and IT environments become more fragmented with cloud, hybrid, and multi-cloud setups, enterprises are under pressure to maintain visibility, ensure compliance, and respond to incidents in real time. Enter Splunk: the platform leading enterprises trust for security, observability, and data-driven decision-making.
Splunk has become synonymous with real-time analytics and intelligent monitoring. Its ability to ingest, index, and correlate data from virtually any source makes it indispensable for enterprises seeking to gain end-to-end visibility across their digital infrastructure. But what exactly makes Splunk service the go-to platform for enterprise security and observability? Let’s break it down.
1. Unified Data Platform for Security and IT Operations
Splunk provides a unified platform that bridges the gap between IT security, and business operations. Unlike siloed tools that provide fragmented views, Splunk consolidates data from across your network, applications, endpoints, and cloud services to deliver a single source of truth.
Whether you’re monitoring for performance issues, detecting security breaches, or ensuring compliance, Splunk enables stakeholders to work from a common, real-time data set. This holistic approach empowers faster, more accurate decisions and fosters collaboration across departments.
2. Powerful Security Information and Event Management (SIEM) Capabilities
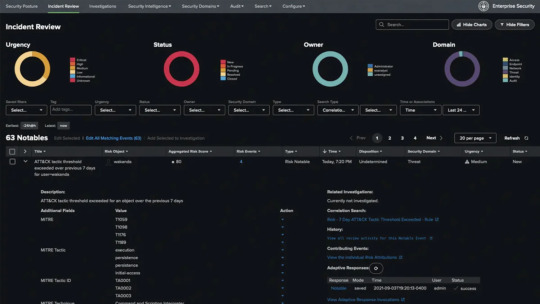
One of the strongest use cases for Splunk is in enterprise security. Splunk Enterprise Security (ES) acts as a powerful SIEM platform, enabling security teams to detect, investigate, and respond to threats efficiently. It offers advanced analytics, prebuilt dashboards, threat intelligence integration, and real-time alerting.
With features like risk-based alerting, behavioral analytics, and threat detection rules, Splunk helps security teams cut through the noise and focus on high-priority incidents. It empowers analysts to conduct rapid incident response and forensic investigations using historical data.
3. Unmatched Observability Tools for Modern Applications
Observability is more than just monitoring—it’s about understanding system behavior across distributed environments. Splunk Observability Cloud offers a full-stack observability solution that includes infrastructure monitoring, application performance monitoring (APM), log analysis, and synthetic transaction testing.
By leveraging OpenTelemetry and AI-driven insights, Splunk provides real-time visibility into system health, user experiences, and performance bottlenecks. This enables DevOps and SRE teams to troubleshoot faster, optimize application performance, and deliver consistent uptime.
4. Scalability for Enterprise Workloads
Enterprise environments are complex, and the volume of machine data they produce can be staggering. Splunk is designed to scale with your business, whether you're analyzing gigabytes or petabytes of data daily. Its distributed architecture supports horizontal scaling and high availability, ensuring consistent performance even under heavy loads.
This scalability is critical for large enterprises that require long-term retention, high-speed analytics, and support for thousands of users accessing data concurrently.
5. Advanced Analytics and Machine Learning
Splunk's analytics capabilities go beyond simple search and dashboards. With built-in machine learning (ML) and support for custom models, Splunk enables predictive analytics, anomaly detection, and behavior profiling. Security and IT teams can use ML to identify suspicious patterns, forecast system failures, or automate threat detection.
The Splunk Machine Learning Toolkit (MLTK) empowers users to apply, train, and tune models using their existing data—no data science degree is required. This intelligent layer of automation enhances situational awareness and drives proactive responses.
6. Robust Ecosystem and Integrations
Splunk integrates seamlessly with a wide range of tools, platforms, and services, including AWS, Microsoft Azure, Google Cloud, Kubernetes, ServiceNow, Palo Alto Networks, and more. These integrations extend Splunk’s capabilities and ensure it fits naturally into your existing technology stack.
The Splunkbase app marketplace features thousands of apps and add-ons for specialized data sources, dashboards, and utilities—making it easier for teams to customize the platform to suit their needs.
7. Enhanced Compliance and Audit Readiness
For industries like finance, healthcare, and government, regulatory compliance is a top priority. Splunk simplifies compliance management by offering prebuilt dashboards and reports aligned with standards like HIPAA, PCI DSS, GDPR, and ISO 27001.
Automated data collection, alerting, and audit trails make it easier to demonstrate compliance and pass audits with confidence. Splunk also provides role-based access controls and data masking to protect sensitive information.
8. Flexible Deployment Options: On-Prem, Cloud, or Hybrid
Not all enterprises are at the same stage of cloud adoption. Splunk’s flexible deployment options allow organizations to deploy the platform on-premises, in the cloud, or a hybrid environment.
Splunk Cloud Platform offers the same functionality as on-prem with the added benefits of scalability, automatic updates, and reduced infrastructure management. It’s ideal for businesses that want to accelerate time to value and reduce operational overhead.
9. Real-Time Dashboards and Visualizations
Splunk’s intuitive dashboards and data visualizations help users transform raw machine data into actionable insights. From real-time alerts on security threats to performance metrics for executive reports, Splunk offers customizable dashboards that can be tailored to user roles and use cases.
Interactive charts, graphs, and maps help bring data stories to life, making it easier for decision-makers to act on insights without technical barriers.
Final Thoughts: Why Splunk Stands Out
In a world where data is both a powerful asset and a potential liability, having the right tools to manage, secure, and understand your data is critical. Splunk delivers on all fronts—offering real-time analytics, enterprise-grade security, and unparalleled observability.
By unifying IT operations, DevOps, and security teams around a single data platform, Splunk breaks down silos, accelerates response times, and drives digital resilience. Its flexibility, intelligence, and scalability make it the ideal choice for enterprises navigating the complexities of modern IT environments.
If your organization is ready to move beyond reactive monitoring and embrace intelligent, proactive operations, Splunk is not just an option—it’s the answer.
#splunk services#microsoft azure sentinel#Splunk solutions#splunk enterprise#splunk security#Splunk consultant#microsoft sentinel#SIEM solutions#Sentinel
0 notes
Text
Ping vs Other Monitoring Methods: Why Choose Ping Monitoring?

In the digital world, your website or server is the front line of your business. Whether you're running an e-commerce platform, a blog, or a SaaS product, keeping your site live and responsive is essential. That’s where monitoring tools come into play. But with so many monitoring methods available, how do you choose the right one?
Among these, Ping Monitoring stands out for its simplicity and effectiveness. Let’s explore how it compares to other methods—and why it might be the best fit for your needs.
💡 What is Ping Monitoring?
Ping monitoring checks the availability of your server or website by sending small packets of data (ICMP echo requests) and waiting for a response. If the server replies, it’s online. If not, it may be down or unreachable.
✅ Benefits:
Real-time uptime checks
Fast detection of server failures
Lightweight and efficient
Easy setup
It’s perfect for quickly knowing whether your website or system is online without needing deep configuration.
🔧 Other Monitoring Methods Explained
Let’s take a look at some other popular methods:
1. HTTP Monitoring
Checks if a webpage loads correctly and returns the right status code (like 200 OK). It ensures the website is not only up but also functioning.
2. DNS Monitoring
Monitors if your domain name resolves correctly and quickly to the right IP address.
3. TCP Port Monitoring
Checks specific ports (e.g., 80 for HTTP, 443 for HTTPS, 21 for FTP) to ensure services are accepting connections.
4. Application Performance Monitoring (APM)
Deeply analyzes application behavior—response time, transaction flow, database calls, etc. Best for complex backend systems.
5. Synthetic Monitoring
Simulates user actions (e.g., logging in, adding to cart) to test the user experience from different regions.
📊 Ping vs Other Monitoring: A Quick Comparison
FeaturePing MonitoringHTTP MonitoringAPMSynthetic MonitoringSetup ComplexityVery LowLowHighMediumDetects Downtime Fast✅ Yes✅ Yes✅ Yes✅ YesDetects Broken Features❌ No✅ Sometimes✅ Yes✅ YesSimulates User Experience❌ No❌ No✅ Partially✅ YesIdeal ForServers, RoutersWebsitesWeb AppsFull User Journey
🕒 When to Use Ping Monitoring?
Ping monitoring is best when:
You want quick alerts for server uptime
You're monitoring basic infrastructure like web servers or routers
You don’t need application-level details
You need a low-cost and low-maintenance solution
It’s ideal for small businesses, developers, IT admins, and anyone who wants basic uptime tracking.
⚠️ Limitations of Ping Monitoring
While powerful, ping monitoring has some limitations:
Doesn’t detect if a website is returning errors (like 500 or 404)
Doesn’t check if a site’s layout is broken or buttons don’t work
Some firewalls may block ping requests
Doesn’t simulate actual user interaction
That’s why it’s often best to combine ping with other monitoring methods for complete coverage.
🚀 Why Choose Ping Monitoring with WebStatus247?
If you want easy, reliable, and global uptime checks, WebStatus247’s Ping Monitoring is a perfect choice.
Here’s what you get:
🌍 Global monitoring nodes
📩 Instant alerts via SMS or email
📊 Clean, simple dashboard
💸 Affordable plans
🧠 Easy setup – no technical skills needed
Whether you're monitoring one website or an entire network, WebStatus247 helps you stay ahead of downtime.
🏁 Final Thoughts
Ping monitoring may seem basic, but it's often the first and fastest line of defense against downtime. It’s lightweight, cost-effective, and incredibly useful for anyone managing a website or server.
0 notes
Text
Observability In Modern Microservices Architecture
Introduction
Observability in modern microservice architecture refers to the ability to gain insights into the system’s internal workings by collecting and analyzing data from various components. Observability in modern microservice architecture has become supreme in today’s dynamic software landscape. It extends beyond traditional monitoring, encompassing logging, tracing, and more to gain comprehensive insights into complex systems. As microservices, containers, and distributed systems gain popularity, so does the need for strong observability practices. However, with these advancements come challenges such as increased complexity, the distributed nature of microservices, and dynamic scalability. Gaining a comprehensive view of an entire application becomes challenging when it’s deployed across 400+ pods spanning 100 nodes distributed globally. In this blog, we offer some insights on these issues and some thoughts on the tools and best practices that can help make observability more manageable.

Observability Components
Monitoring
Monitoring is the continuous process of tracking and measuring various metrics and parameters within a system. This real-time observation helps detect anomalies, performance bottlenecks, and potential issues. Key metrics monitored include resource utilization, response times, error rates, and system health. Monitoring tools collect data from various sources such as infrastructure, application logs, and network traffic. By analyzing this data, teams can gain insights into the overall health and performance of the system.
Logging
Logging involves the systematic recording of events, errors, and activities within an application or system. Each log entry provides context and information about the state of the system at a specific point in time. Logging is essential for troubleshooting, debugging, and auditing system activities. Logs capture critical information such as user actions, system events, and errors, which are invaluable for diagnosing issues and understanding system behavior. Modern logging frameworks offer capabilities for log aggregation, filtering, and real-time monitoring, making it easier to manage and analyze log data at scale.
Tracing
Tracing involves tracking the flow of requests or transactions as they traverse through different components and services within a distributed system. It provides a detailed view of the journey of a request, helping identify latency, bottlenecks, and dependencies between microservices. Tracing tools capture timing information for each step of a request, allowing teams to visualize and analyze the performance of individual components and the overall system. Distributed tracing enables teams to correlate requests across multiple services and identify performance hotspots, enabling them to optimize system performance and enhance user experience.
APM
APM focuses on monitoring the performance and availability of applications. APM tools provide insights into various aspects of application performance, including response times, error rates, transaction traces, and dependencies. These tools help organizations identify performance bottlenecks, troubleshoot issues, and optimize application performance to ensure a seamless user experience.
Synthetic
Synthetic monitoring involves simulating user interactions with the application to monitor its performance and functionality. Synthetic tests replicate predefined user journeys or transactions, interacting with the application as a real user would. These tests run at regular intervals from different locations and environments, providing insights into application health and user experience. Synthetic monitoring helps in identifying issues before they affect real users, such as downtime, slow response times, or broken functionality. By proactively monitoring application performance from the user’s perspective, teams can ensure high availability and reliability.
Metrics Collection and Analysis
Metrics collection involves gathering data about various aspects of the system, such as CPU usage, memory consumption, network traffic, and application performance. This data is then analyzed to identify trends, anomalies, and performance patterns. Metrics play a crucial role in understanding system behavior, identifying performance bottlenecks, and optimizing resource utilization. Modern observability platforms offer capabilities for collecting, storing, and analyzing metrics in real time, providing actionable insights into system performance.
Alerting and Notification
Alerting and notification mechanisms notify teams about critical issues and events in the system. Alerts are triggered based on predefined thresholds or conditions, such as high error rates, low disk space, or system downtime. Notifications are sent via various channels, including email, SMS, and chat platforms, ensuring timely awareness of incidents. Alerting helps teams proactively address issues and minimize downtime, ensuring the reliability and availability of the system.
Benefits of Observability
Faster Issue Detection and Resolution
One of the key benefits of observability is its ability to identify bottlenecks early on. By offering a detailed view of individual services and the overall system dynamics, developers can quickly detect and diagnose issues like unexpected behaviors and performance bottlenecks, enabling prompt resolution.
Infrastructure Visibility
Infrastructure visibility involves actively monitoring the foundational components of a system, including the network, storage, and compute resources. This practice yields valuable insights into system performance and behavior, facilitating quicker diagnosis and resolution of issues. Rewrite in a professional way
Compliance And Auditing
Observability is super important for making sure businesses follow the rules and pass audits in their Kubernetes setups. It’s all about keeping careful records of what’s happening in the system, like keeping track of logs, traces, and metrics. These records help prove that the company is sticking to the rules set by the government and industry standards. Plus, they help spot any changes over time. During audits, these records are super handy for inspectors to check if everything’s running as it should be according to the company’s own rules and legal requirements. This careful way of keeping track doesn’t just show that things are going smoothly but also helps find ways to do things even better to keep following the rules.
Capacity Planning and Scaling
Observability is like a smart tool that helps businesses strike the perfect balance between having enough resources to handle their workload and not overspending on unused capacity. By adjusting the amount of resources they use based on real-time needs, they can save money while still delivering top-notch service. Plus, observability lets them peek into the past to see how many resources they’ve needed before, helping them plan for the future and avoid any surprises. It also shows them which parts of their systems are busiest and which ones aren’t as active, so they can manage their resources more effectively, saving cash and ensuring everything runs smoothly.
Improved System Performance
Additionally, observability contributes to performance optimization. It provides valuable insights into system-level and service-level performance, allowing developers to fine-tune the architecture and optimize resource allocation. This optimization incrementally enhances system efficiency.
Enhanced User Experience
Observability in a system, particularly within a microservices architecture, significantly contributes to an enhanced user experience. The ability to monitor, trace, and analyze the system’s behavior in real time provides several benefits that directly impact the overall user experience. This proactive identification of problems enables teams to address issues before users are affected, minimizing disruptions and ensuring a smoother user experience.
Best Observability Tool Features to Consider
There are some key factors to be evaluated while selecting an Observability tool. Evaluating the right observability tool is very critical, as these tools play a crucial role in ensuring the stability and reliability of modern software systems.
Alerting Mechanisms
Check out for tools equipped with notification capabilities that promptly inform you when issues arise, enabling proactive management of potential problems. The tool should provide a search query feature that continuously monitors telemetry data and alerts when certain conditions are met. While some tools offer simple search queries or filters, others offer more complex setups with multiple conditions and varying thresholds.
Visualization
Observability requires quickly interpreting signals. Look out for a tool featuring intuitive and adaptable dashboards, charts, and visualizations. These functionalities empower teams to efficiently analyze data, detect trends, and address issues promptly. Prioritize tools with strong querying capabilities and compatibility with popular visualization frameworks.
Data Correlation
When troubleshooting, engineers often face the need to switch between different interfaces and contexts to manually retrieve data, which can lengthen incident investigations. This complexity intensifies when dealing with microservices, as engineers must correlate data from various components to pinpoint issues within intricate application requests. To overcome these challenges, data correlation is vital. A unified interface automatically correlating all pertinent telemetry data can greatly streamline troubleshooting, enabling engineers to identify and resolve issues more effectively.
Distributed Tracing
Distributed tracing is a method utilized to analyze and monitor applications, especially those constructed with a microservices framework. It aids in precisely locating failures and uncovering the underlying reasons for subpar performance. Choosing an Observability tool that accommodates distributed tracing is essential, as it provides a comprehensive view of request execution and reveals latency sources.
Data-Driven Cost Control
Efficient data optimization is essential for building a successful observability practice. Organizations need observability tools with built-in automated features like storage and data optimization to consistently manage data volumes and associated costs. This ensures that organizations only pay for the data they need to meet their specific observability requirements.
Key Observability Tools
Observability tools are essential components for gaining insights into the health, performance, and behavior of complex systems. Here’s an overview of three popular observability tools: Elastic Stack, Prometheus & Grafana, and New Relic.Observability ToolCategoryDeployment ModelsPricingElastic Stack
The choice of an observability tool depends on specific use cases, system architecture, and organizational preferences. Each of these tools offers unique features and strengths, allowing organizations to customize their observability strategy to meet their specific needs.
Conclusion
Observability in modern microservice architecture is indispensable for adopting the complexities of distributed systems. By utilizing key components such as monitoring, logging, and tracing, organizations can gain valuable insights into system behavior. These insights not only facilitate faster issue detection and resolution but also contribute to improved system performance and enhanced user experience. With a pool of observability tools available, organizations can customize their approach to meet specific needs, ensuring the smooth operation of their microservices architecture. Source Url: https://squareops.com/blog/observability-in-modern-microservices-architecture/
0 notes
Text
0 notes
Text
Emerging Trends Reshaping the Global Asset Performance Management Market in the Coming Years
In an increasingly digital and data-driven industrial landscape, the demand for improved operational efficiency, cost reduction, and asset longevity has brought Asset Performance Management (APM) to the forefront of strategic enterprise initiatives. APM encompasses a suite of software, systems, and services designed to optimize the performance, reliability, and availability of physical assets. As global industries transition toward smarter and more predictive operations, the asset performance management market is experiencing robust growth, fueled by technological advancements and a heightened focus on data-centric decision-making.

Market Overview
The Asset Performance Management market has witnessed significant momentum in recent years. According to industry analysts, the global APM market is projected to grow at a compound annual growth rate (CAGR) of over 10% through 2030. This growth is largely driven by increased adoption of cloud-based APM solutions, the integration of artificial intelligence (AI) and machine learning (ML), and the rise of Industry 4.0. Key sectors such as energy and utilities, oil and gas, manufacturing, and transportation are among the early adopters, leveraging APM tools to enhance operational reliability and reduce unplanned downtime.
Drivers of Market Growth
1. Digital Transformation Initiatives
Organizations across sectors are undergoing digital transformation, and APM is a critical component of this shift. By harnessing IoT sensors, real-time analytics, and advanced data modeling, APM solutions provide predictive insights that empower companies to preempt equipment failures and optimize maintenance schedules. These capabilities lead to substantial cost savings and improved asset utilization.
2. Demand for Predictive Maintenance
Traditional maintenance strategies, such as reactive or scheduled maintenance, often lead to inefficiencies. Predictive maintenance, enabled by APM systems, uses real-time data and historical trends to forecast equipment issues before they occur. This not only extends asset life but also enhances safety and regulatory compliance—factors that are increasingly critical in high-risk industries.
3. Regulatory and Environmental Pressures
Regulatory bodies worldwide are imposing stricter standards related to operational safety, environmental sustainability, and reporting. APM solutions help organizations monitor compliance, reduce environmental impact, and ensure adherence to evolving regulations. Additionally, they support corporate sustainability goals by minimizing energy consumption and material waste.
Technological Advancements
The integration of cutting-edge technologies is transforming the capabilities and value proposition of APM platforms:
Artificial Intelligence & Machine Learning: AI-driven analytics allow for more accurate failure predictions, anomaly detection, and automated decision-making, which enhances asset reliability and maintenance planning.
Cloud Computing: Cloud-based APM platforms offer scalability, easier updates, and seamless data integration across geographically dispersed assets. This is particularly beneficial for large enterprises with global operations.
Digital Twins: The use of digital twin technology virtual replicas of physical assets enables simulation of real-world conditions and scenarios, helping engineers and operators make informed decisions without physical intervention.
Competitive Landscape
The APM market is characterized by a mix of established players and innovative startups. Major vendors such as GE Digital, IBM, Siemens, SAP, and AVEVA are continually enhancing their offerings through strategic partnerships and acquisitions. Meanwhile, niche players are introducing specialized solutions tailored to industry-specific needs, such as APM tools for offshore oil rigs or renewable energy infrastructure.
To remain competitive, vendors are focusing on delivering integrated platforms that combine APM with enterprise asset management (EAM), manufacturing execution systems (MES), and enterprise resource planning (ERP). This integration creates a holistic view of asset health and operational efficiency.
Challenges and Considerations
Despite its potential, the APM market faces several challenges:
Data Silos and Integration Issues: Many organizations struggle with disparate data systems and legacy infrastructure, which can hinder the effective deployment of APM solutions.
Skill Gaps: Implementing and managing advanced APM technologies requires specialized knowledge in data science, engineering, and IT—skills that are in short supply in many markets.
Initial Investment Costs: While APM solutions offer long-term savings, the upfront costs and implementation timelines can be barriers for small to mid-sized enterprises.
The Road Ahead
As industries continue to prioritize resilience, sustainability, and operational efficiency, APM will play a pivotal role in shaping the future of asset-intensive enterprises. The convergence of AI, IoT, and cloud technologies will further democratize access to sophisticated asset management tools, enabling more organizations to harness the full value of their assets.
In this evolving environment, companies that proactively invest in APM not only stand to improve their bottom line but also enhance their competitive edge, agility, and ability to navigate the complex demands of the modern industrial ecosystem.
0 notes
Text
Customer Experience Monitoring Market Size, Share, Analysis, Forecast, and Growth Trends to 2032: Telecom & Retail Sectors Drive Expansion
The Customer Experience Monitoring Market was valued at USD 2.45 billion in 2023 and is expected to reach USD 18.35 billion by 2032, growing at a CAGR of 25.11% from 2024-2032.
Customer Experience Monitoring Market is gaining significant traction as businesses prioritize real-time insights to enhance user satisfaction and brand loyalty. With digital transformation accelerating across industries, especially in the USA and Europe, companies are increasingly investing in tools that track customer journeys, touchpoints, and sentiments across multiple platforms.
U.S. Customer Experience Monitoring Market Thrives as Brands Race for Loyalty
Customer Experience Monitoring Market is rapidly evolving with the integration of AI, machine learning, and omnichannel analytics. Enterprises are leveraging these technologies to proactively identify service issues, personalize interactions, and strengthen customer retention strategies in highly competitive environments.
Get Sample Copy of This Report: https://www.snsinsider.com/sample-request/6664
Market Keyplayers:
RADCOM Ltd. [RADCOM Network Insights, RADCOM ACE]
Aternity, Inc. [Aternity Employee Experience, Aternity Mobile Experience]
Oracle Corporation [Oracle CX Cloud, Oracle Service Cloud]
RadioOpt GmbH [Network Signal Info, Network Quality App]
BMC Software, Inc. [BMC Helix Digital Workplace, BMC Helix AIOps]
Startek [Startek Interaction Analytics, Startek Speech Analytics]
CA Technologies, Inc. [CA Digital Experience Insights, CA Application Performance Management]
Comarch SA [Comarch Service Quality Management, Comarch Fault Management]
Riverbed Technology, Inc. [Aternity Real User Monitoring, Aternity Synthetic Monitoring]
Compuware Corporation [Compuware APM, Compuware Strobe]
CorrelSense, Inc. [SharePath Real User Monitoring, SharePath Transaction Tracking]
Cisco Systems, Inc. [Cisco ThousandEyes, Cisco AppDynamics]
Dynatrace LLC [Dynatrace Digital Experience Monitoring, Dynatrace Real User Monitoring]
New Relic, Inc. [New Relic Browser, New Relic Synthetics]
SAP SE [SAP Customer Experience, SAP Service Cloud]
Qualtrics International Inc. [Qualtrics CustomerXM, Qualtrics Experience iD]
Medallia, Inc. [Medallia Experience Cloud, Medallia Agent Connect]
NICE Ltd. [NICE Nexidia, NICE Enlighten AI]
IBM Corporation [IBM Tealeaf, IBM Customer Experience Analytics]
Zoho Corporation [Zoho Desk, Zoho CRM Plus]
Adobe Inc. [Adobe Experience Platform, Adobe Customer Journey Analytics]
Market Analysis
The Customer Experience Monitoring (CEM) Market is being shaped by rising customer expectations, growing digital service touchpoints, and the need for seamless user experiences. Businesses now require sophisticated tools that can provide real-time alerts, sentiment analysis, and behavioral insights to improve service delivery and decision-making. In the USA, demand is driven by digital-first strategies, while Europe is focusing on compliance-driven monitoring and data privacy in customer-centric platforms.
Market Trends
Increased adoption of AI-based sentiment analysis tools
Real-time monitoring of web and app performance affecting customer journeys
Growing focus on voice of the customer (VoC) programs
Integration of CEM tools with CRM and support platforms
Use of predictive analytics for early issue detection
Shift toward omnichannel monitoring across digital and physical touchpoints
Emphasis on personalization through customer journey analytics
Market Scope
The scope of the Customer Experience Monitoring Market is expanding as businesses recognize CX as a competitive differentiator. From e-commerce to banking, brands are using CEM tools to convert customer data into actionable strategies.
Unified dashboards for cross-channel monitoring
Customizable alerts and KPIs for CX teams
Cloud-based and on-premise deployment options
Multilingual sentiment analysis supporting global reach
Industry-specific CEM solutions (retail, finance, healthcare)
Integration-ready platforms compatible with existing tech stacks
Forecast Outlook
The Customer Experience Monitoring Market is expected to grow dynamically as customer engagement becomes a top-line priority. Innovation in real-time data capture, automation, and analytics will shape the future of CXM. Businesses that invest in intelligent monitoring tools will gain an edge in delivering seamless, proactive, and personalized experiences. The USA and Europe will remain front-runners, fueled by digital maturity, innovation ecosystems, and customer-first business models.
Access Complete Report: https://www.snsinsider.com/reports/customer-experience-monitoring-market-6664
Conclusion
In today’s hyperconnected world, exceptional customer experience isn’t optional—it’s a mandate. The Customer Experience Monitoring Market is empowering brands to listen, adapt, and lead with empathy and intelligence.
Related Reports:
U.S.A customer intelligence platforms are revolutionizing data-driven marketing strategies
U.S.A leads innovation in media monitoring tools for real-time brand insights
About Us:
SNS Insider is one of the leading market research and consulting agencies that dominates the market research industry globally. Our company's aim is to give clients the knowledge they require in order to function in changing circumstances. In order to give you current, accurate market data, consumer insights, and opinions so that you can make decisions with confidence, we employ a variety of techniques, including surveys, video talks, and focus groups around the world.
Contact Us:
Jagney Dave - Vice President of Client Engagement
Phone: +1-315 636 4242 (US) | +44- 20 3290 5010 (UK)
#Customer Experience Monitoring Market#Customer Experience Monitoring Market Scope#Customer Experience Monitoring Market Trends
0 notes
Text
Looking for application performance monitoring tools? We have a huge list of application performance monitoring software that can help you manage your applications. Many of these tools are specialized in web application performance monitoring, however, you can also find tools that can monitor other enterprise applications and processes as well. Application performance management is an essential part of any business running software. Choosing the right application performance management tool can help you reduce a lot of costs and unwanted burden on the support team. Today, with continuous research and development, IT applications can be broadly defined as the key to modern business processes such as management of various office tasks. More and more businesses are depending upon APM tools for the performance optimization of various applications including customer relations, payroll, and accounting. There is a lot of debate about the efficiency of APM tools or Application Performance Management Tools which has become critical for continuity of the business as well productivity of many aspects of the organization. Here, we offer you a list of various APM tools or Application Performance Management Tools which can be very helpful in any organization. 1. Ruxit Ruxit is a popular application performance monitoring software with rich features. It can automatically detect problems and send notifications. Its extremely easy to setup and works seamlessly with all major platforms. Unlike other APM software, Ruxit is highly scalable and scales with your application. It has a simple web-based user interface that can be operated from anywhere. 2. Sensu App Sensu APM is a comprehensive open source monitoring framework which is used for building comprehensive monitoring solutions without imposing any restrictions. 3. Moskito This APM is an open source and free monitoring software for Java applications. It offers a complete ecosystem for DevOps users. 4. Stage Monitor - Stage Monitor can be broadly defined as an open source solution for the benefit of the users who would like to monitor the application performance for java server applications. 5. Zenoss This is one of award winning open source IT monitoring solution which is very popular in the industry. It offers visibility over the complete IT stack which includes applications and network devices. There are a lot of features which includes easy to use web portal, sophisticated alerting and automatic discovery. 6. Cacti Cacti can be defined as an extensive trending and performance graphing tool. It can be used to track any monitored metric which you can plot on any graph. Cacti have the capability of tracking and making the data available for the user for various tasks such as fan speed of a power supply to disk utilization. 7. Nagios This can be broadly described as the old guard of network and system monitoring and is very reliable, fast and can be customized easily. A challenge for newcomers, but still its strength is a complex configuration which can be customized easily. 8. Icinga Icinga can be broadly defined as enterprise-grade, open source monitoring system which is used for monitoring various networks as well as all related network resources. The main function of this monitoring system is a generation of performance data and giving notification regarding errors and recoveries. 9. NeDi NeDi is known for offering a good solution regarding tracking of devices across any network. This tool continuously tracks the network infrastructure for keeping track of its discoveries as well as cataloging devices. It offers the user current history as well as the location of devices. 10. Observium Observium offers the combination of network and system monitoring with the performance trending. This performance tool uses both auto and static discovery for identification of network and server devices. It also offers leverage in different monitoring methods for the user. 11. Zabbix Zabbix is extensively used for monitoring networks and servers with an extensive array of different tools.
You can use Zabbix agents for most of the operating systems or external or passive checks which include the use of SNMP for monitoring network and host devices. 12. Ntop Ntop can be broadly defined as packet sniffing tool which includes Web UT. It displays the live data on monitoring interface regarding network traffic passing. You can get information regarding instant data on the network flows with an advanced live graphing. 13. OpenNMS OpenNMS can be defined as the first enterprise-grade network management application platform in the world which was developed with open source. 14. New Relic New Relic APM has a lot of key features which are useful for its users such as code-level diagnostics, cross application tracing, and browser monitoring. It also offers full visibility in the problem transactions. In addition to that, it has the capability of monitoring critical business transactions. 15. AppDynamics AppDynamics can be broadly defined as an application intelligence platform which monitors application performance. It is mostly used for analyzing the impact of application performance over business operation. There are various key features such as intuitive user interface for the benefit of the user. 16. Foglight This application performance management tool has the capability of monitoring and managing performance across several technologies. These technologies include physical and virtual servers, databases and Java. In addition to that, it also offers insights about how users interaction with the application. 17. SteelCentral For Performance Management And Control This is end to end and complete solution which also combines the user experience, network and application performance management with centralized control. It offers a complete tool suite for a different environment for fulfilling the requirements of any application environment. 18. Compuware APM There are many products which are available with this application performance management tools which include dynaTrace and Gomez. They are unified as well as integrated to offer a modern APM solution for those users who would like to get a challenging APM tool. 19. BMC Software This software has been programmed for offering APM for everyone as well as for every situation. It offers insight from the perspective of an end user to diagnostics and code-level monitoring. It also helps in saving time and money of user by quick identification of root cause. 20. JenniferSoft APM This APM offers a comprehensive solution regarding application performance and performance management which outweighs both top-down business process approaches as well bottom-up infrastructure for the user. It also offers visibility in the performance metrics which is critical for IT as well as business perspective. 21.ExtraHop This is a passive network appliance which has been designed for helping IT professionals to maximize the application performance in dynamic as well as complex environments. It also offers visibility in application servers, storage systems, databases and full network. 22. Lucierna This is one of the comprehensive and complete enterprise Application performance management solutions which ensure that your apps are functioning at peak performance to meet the business objective. Each and every transaction of each user is tracked across all tiers within full business context. 23.CA Application Performance Management This application performance Management or APM delivers the productivity and revenue generation business services to the user while exceeding the expectation of the customers. It also offers management and visibility across various environments 24. AppNeta AppNeta has been programmed to offer full stack monitoring the web applications such as network monitoring, code and end user monitoring for full visibility. The monitoring of the applications has become very simple with four integrated models combined into one solution. 25. AppEnsure When you need to manage throughput and
response time of applications you are running in various locations, the best solution is AppEnsure. This APM tool has the ability to discover, name and map each and every application in each location. 26. AppFirst This APM can be defined as a unique web scale platform for IT when they require watching every event across all the enterprise. It offers multi-tenant access for sub-second metrics, proactive error resolution and application footprints for optimal performance. 27. Neebula This service performance monitoring solution’s main objective is to keep the applications running at their peak performance through the mapping of business services to the storage, networks, middleware, servers etc. The solution achieves this by correlation of event and monitoring data. 28. BlueStripe BlueStripe offers a complete solution for an enterprise application, infrastructure performance and IT operations monitoring. It also offers APM for IT operations which range from monitoring to mapping and identification of fixes at component level. 29. Boundary Boundary can be broadly defined as the unified monitoring for Web-based IT. It offers continuous monitoring and resolution for the user across applications, infrastructure and events. It also offers a comprehensive solution which spans the modern agile enterprise. 30. NetScout This APM offers a complete range of solutions which start from quality analysis of communication technology to resource capacity planning for optimization. The unified solution offers top- down approach for monitoring and management of performance. 31.Precise With Precise, you can monitor and fine tune the performance of the infrastructure across each system tier. It also delivers the actionable information from all types of storage devices, custom application and packaged databases as well as apps across virtual layers and operating systems. 32. Opsview The main aim of Opsview is to streamline the correlation of data within context for deriving the actionable insights. It also offers the unified and automated approach for combination of all performance data which is relevant and displays it within the context. 33. SevOne This APM offers full visibility across the comprehensive enterprise network and meets the full challenge regarding its versatility. The APM tools Netuitive The main aim of Netuitive is to resolve the issue of Big Data which has been associated with APM tool. The main focus of this app is to monitor all the applications across distributed, virtualized network. This APM offers increased visibility in application performance within context. Radware The best resolution regarding ensuring the consistent, smooth service delivery is detection of issues with application performance before any customer is affected by them. This APM solution offers automated monitoring, alert and management for user. 36. Oracle Enterprise Manager 12C This APM offers better business IT alignment which requires fewer efforts than any other solutions. It has been specially designed for enterprise data as well as cloud centre deployment and functions for both customs and Oracle applications. 37. INETCO Insight This is widely known as next generation operational tool which offers transaction centric performance monitoring as well as business transaction management with best service quality delivery. It also offers end to end visibility in transaction flow. 38. LogicMonitor This APM taps in your application’s predefined data sources for comprehensive monitoring, graphing and alerting user on important events. It also helps user regarding trends in a single resource for streamlining the application management needs. 39. Visual TruView This is a product whose main function is focused completely on end user experience. With three clicks, the programmer can determine poor response time, isolate the issue and diagnose the cause of issue. The programmer also can take specific action for protection of network against any threats. 40. Level3 Application Performance Management
This APM has been specially designed and offers various tools which are required for optimization of network as well as increasing efficiency of application. It also increases visibility as well as performance data of any application. 41. Nastel The customer can ensure high quality of user experience with complete visibility of application performance with this APM. There are 2 core products which offer message tracking, analytics and real life monitoring. 42. Citrix NetScaler The main feature of this APM is that not only it monitors the applications but also is able to take control of management of performance. This function ensures availability of applications, reduction in ownership costs and optimization of end user experience. 43. Catchpoint Catchpoint is one of the best APM which has bility to serve as single data source for complete visibility in end user experience. It can be also defined as streamlined web performance management platform which have intuitive user interface. 44. EG Enterprise This APM offers an integrated web interface so that user can monitor more than 150 common applications anywhere. With both types of approaches which includes active and passive, it offers the unbiased external perspective on performance. 45. Op5 Monitor This APM can be broadly defined as an open and flexible server monitoring solution which also helps you to take control from basement servers. It also offers a unified and single view of complete network infrastructure for various matters such as efficient problem resolution as better data analysis. 46. Op5 Monitor This APM can be broadly defined as the flexible and open monitoring solution for server. It offers many features such as meeting hybrid challenges, reports, intuitive user interface and monitoring of virtual infrastructure as well as resources. 47. CopperEgg This APM offers continuous real time monitoring of all the devices as well as server. It also offers comprehensive view of enterprise application performance, co-relates performance of applications with business results. 48. Driven Designed especially for cascading development platform, this APM offers deep insight in various applications. You can visualize data application diagnose failure of application and optimization from same platform which has been designed for developers. 49. Datadog This APM tool offers an intuitive dashboard from which you can view your team, cloud, apps, and server in a single view. This tool is specially designed for teams which write and run various applications at a scale. 50. Librato This is complete monitoring solution which helps user to understand impact of all sources of data on the business at every level. It is a flexible and scalable platform which turns complex problems in a service which is easy to use. 51. Aternity This APM tool closes the gap of visibility which is between the performance of an application and actual user experience. It is because this tool approaches issue from the perspective of end user and considers experience of each app from all devices. 52. Centreon Centreon can be broadly defined as network and system monitoring software which has been adapted for the requirements for ISD. This APM tool is excellent combination of essential and excellent supervision with Open Source flexibility. 53. Ground Work With this APM tool, you can integrate your log analysis tool with performance data for improvement of root cause analysis and search-based correlations. You can also use this tool for scalable and distributed graphing of time-series performance data. 54. Packet Beat This is an open source application performance and monitoring management software which is used by lot of developers across the globe. These are some popular and free Application Performance Management Tools which are very popular all over the world with people working in the IT industry. Article Updates Updated On Mar 2017: Updated broken links and fixed minor issues. Updated On Oct 2016: Updated links and fixed minor formatting issues.
0 notes
Text
Application Performance Optimization

Application performance is critical to user experience, scalability, and success in today's fast-paced digital world. A slow or laggy app can result in poor retention and lost users. This blog post outlines practical strategies to improve the performance of your applications across web, mobile, and backend systems.
Why Optimize Performance?
User Experience: Fast-loading apps keep users engaged and satisfied.
Resource Efficiency: Efficient applications use less CPU, memory, and bandwidth.
Scalability: Well-optimized apps handle more users and data without performance degradation.
SEO and Ranking: For web apps, speed impacts search engine rankings.
Key Areas to Focus On
1. Front-End Optimization
Minimize HTML, CSS, and JavaScript files using tools like UglifyJS or CSSNano.
Use lazy loading for images and videos to load content as needed.
Implement browser caching and content delivery networks (CDNs).
Optimize media assets (compress images, use modern formats like WebP).
Reduce the number of HTTP requests.
2. Back-End Optimization
Optimize database queries and use indexing where appropriate.
Implement caching layers with tools like Redis or Memcached.
Use load balancing to distribute requests efficiently.
Avoid blocking code and use asynchronous processing where possible.
Profile server performance to identify bottlenecks.
3. Code-Level Improvements
Use efficient data structures and algorithms.
Refactor redundant or complex code.
Eliminate memory leaks and manage resources properly.
Remove unnecessary dependencies and modules.
4. Mobile App Optimization
Reduce app size and startup time.
Use efficient network calls and minimize battery usage.
Support offline caching and background data syncing.
Optimize rendering performance on different screen sizes.
Tools for Performance Monitoring and Testing
WebPageTest / Lighthouse: For analyzing web page performance.
Chrome DevTools: For inspecting and debugging web applications.
New Relic / Datadog: For backend monitoring and APM (Application Performance Monitoring).
JMeter / LoadRunner: For stress and load testing applications.
Firebase Performance Monitoring: For mobile apps.
Best Practices
Monitor performance continuously using real-time tools.
Set performance budgets and goals during development.
Optimize early, but also review regularly as features grow.
Involve QA and DevOps teams in performance testing.
Conclusion
Performance optimization is an ongoing process that plays a vital role in the success of any application. By following these best practices and using the right tools, you can ensure your applications are fast, reliable, and scalable — leading to better user experiences and business outcomes.
1 note
·
View note